Central Queensland - Economic and Infrastructure Framework · Central Queensland Economic and...
90
Central Queensland Economic and Infrastructure Framework Background Paper June 2013 NOT GOVERNMENT POLICY
Transcript of Central Queensland - Economic and Infrastructure Framework · Central Queensland Economic and...
Central Queensland
Economic and Infrastructure Framework
Background Paper June 2013
NOT GOVERNMENT POLICY

Central Queensland – Economic and Infrastructure Framework � - ii-
The Department of State Development, Infrastructure and Planning leads a coordinated Queensland Government approach to planning, infrastructure and development across the state. © State of Queensland. Published by the Department of State Development, Infrastructure and Planning, June 2013, 100 George Street, Brisbane Qld 4000. The Queensland Government supports and encourages the dissemination and exchange of information. However, copyright protects this publication. The State of Queensland has no objection to this material being reproduced, made available online or electronically but only if it is recognised as the owner of the copyright and this material remains unaltered. Copyright enquiries about this publication should be directed to the department’s Legal Services division via email [email protected] or in writing to PO Box 15009, City East, Queensland 4002. The Queensland Government is committed to providing accessible services to Queenslanders of all cultural and linguistic backgrounds. If you have difficulty understanding this publication and need a translator, please call the Translating and Interpreting Service (TIS National) on 131 450 and ask them to telephone the Queensland Department of State Development, Infrastructure and Planning on 07 3227 8548. Disclaimer: While every care has been taken in preparing this publication, the State of Queensland accepts no responsibility for decisions or actions taken as a result of any data, information, statement or advice, expressed or implied, contained within. To the best of our knowledge, the content was correct at the time of publishing.
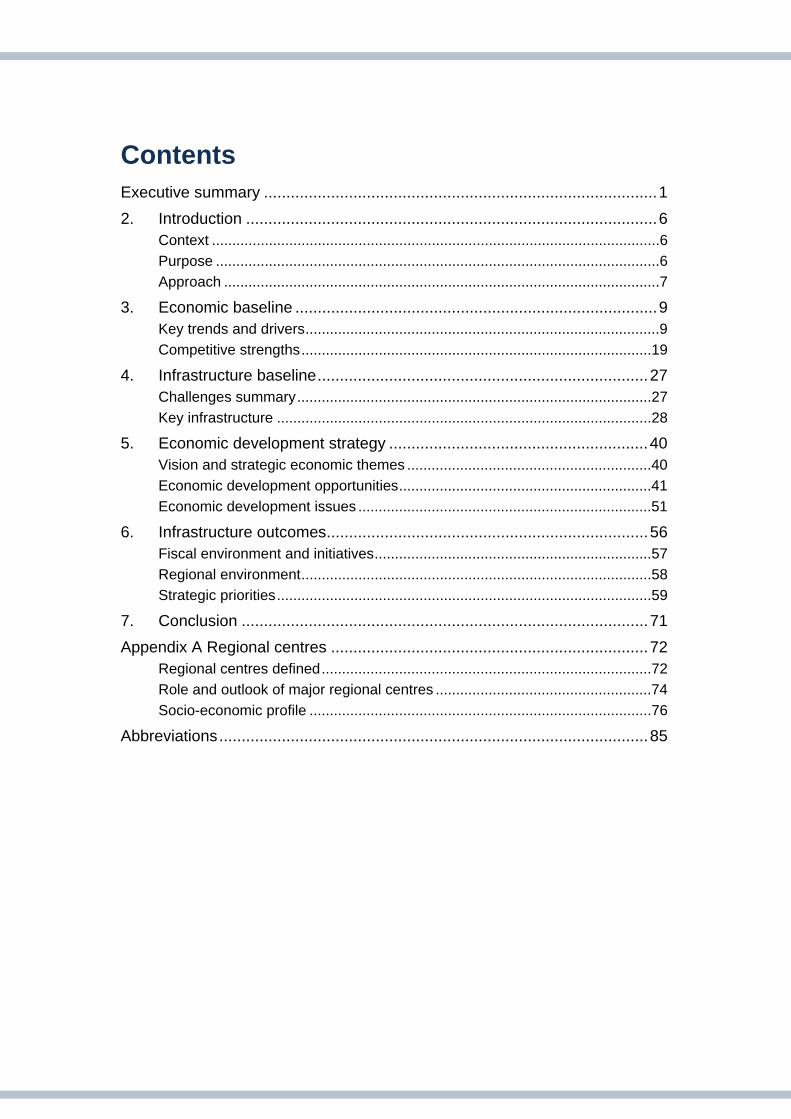
Contents Executive summary ........................................................................................1
2. Introduction ............................................................................................6 Context ..............................................................................................................6 Purpose .............................................................................................................6 Approach ...........................................................................................................7
3. Economic baseline .................................................................................9 Key trends and drivers.......................................................................................9 Competitive strengths......................................................................................19
4. Infrastructure baseline..........................................................................27 Challenges summary.......................................................................................27 Key infrastructure ............................................................................................28
5. Economic development strategy ..........................................................40 Vision and strategic economic themes ............................................................40 Economic development opportunities..............................................................41 Economic development issues ........................................................................51
6. Infrastructure outcomes........................................................................56 Fiscal environment and initiatives....................................................................57 Regional environment......................................................................................58 Strategic priorities............................................................................................59
7. Conclusion ...........................................................................................71
Appendix A Regional centres .......................................................................72 Regional centres defined.................................................................................72 Role and outlook of major regional centres .....................................................74 Socio-economic profile ....................................................................................76
Abbreviations................................................................................................85
Figures Figure 1 Economic and Infrastructure Framework components.............................5 Figure 2 Economic and Infrastructure Framework approach .................................8 Figure 3 Industry composition, GVA, current prices, 2000–01 and 2010–11 .......11 Figure 4 Regional industry specialisation 2000–01 and 2010–11 (GVA chain
volume measure)....................................................................................13 Figure 5 Projected population growth, 2011–2031...............................................14 Figure 6 Major projects in Central Queensland ($M), Dec-2012 ..........................18 Figure 7 Value of mineral production and coal volumes – Central Queensland..19 Figure 8 Value of agricultural commodities, Central Queensland, 2010–11 ........20 Figure 9 Structure of Central Queensland’s manufacturing industry....................21 Figure 10 Building approvals – Central Queensland ..............................................23 Figure 11 LNG exports, Queensland and Rest of Australia ...................................24 Figure 12 Total visitors to Central Queensland tourism region ..............................25 Figure 13 Map of the regions key transport infrastructure......................................28 Figure 14 Coal rail networks...................................................................................31 Figure 15 Map of the region’s key energy infrastructure ........................................34 Figure 16 Map of the region’s major dams .............................................................37
Tables Table 1 Competitive strengths...............................................................................2 Table 2 Economic development opportunities ......................................................3 Table 3 Gross regional product, 2001 to 2011 ......................................................9 Table 4 Central Queensland industry growth, real GVA .....................................12 Table 5 Projected population, by LGA.................................................................15 Table 6 Number of non-resident workers on shift (at 30 June) ...........................15 Table 7 Labour market condition (smoothed series), Dec–09 to Dec–12 ...........16 Table 8 Central Queensland employment by industry, 2001 to 2011 .................17 Table 9 Employment and specialisation – selected manufacturing industries in
Central Queensland, 2011 .....................................................................22 Table 10 Water supply ..........................................................................................37 Table 11 Economic development opportunities ....................................................46 Table 12 Economic development issues...............................................................54 Table 1A Regional centres (SA2) – mapping ASGS, 2011 ...................................73 Table 2A Estimated resident population – urban centres and localities ................77 Table 3A Non-resident workers, FTE population estimates, Bowen Basin LGAs
and selected UC/Ls, June 2012 .............................................................78 Table 4A Projected non-resident workers on-shift, Banana (S).............................79 Table 5A Projected non-resident workers on-shift, Central Highlands (R) ............79 Table 6A Projected non-resident workers on-shift, Gladstone (R) ........................80 Table 7A Regional centres – detailed findings .....................................................80
Central Queensland – Economic and Infrastructure Framework � - 1 -
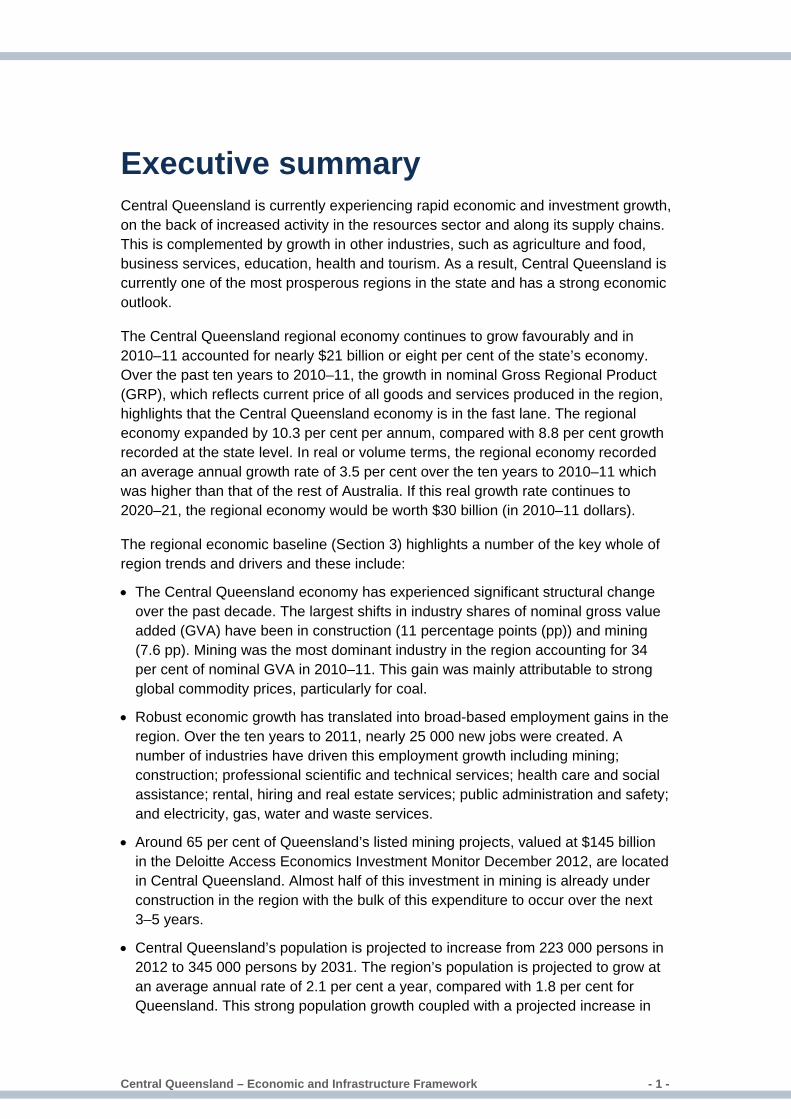
Executive summary Central Queensland is currently experiencing rapid economic and investment growth, on the back of increased activity in the resources sector and along its supply chains. This is complemented by growth in other industries, such as agriculture and food, business services, education, health and tourism. As a result, Central Queensland is currently one of the most prosperous regions in the state and has a strong economic outlook.
The Central Queensland regional economy continues to grow favourably and in 2010–11 accounted for nearly $21 billion or eight per cent of the state’s economy. Over the past ten years to 2010–11, the growth in nominal Gross Regional Product (GRP), which reflects current price of all goods and services produced in the region, highlights that the Central Queensland economy is in the fast lane. The regional economy expanded by 10.3 per cent per annum, compared with 8.8 per cent growth recorded at the state level. In real or volume terms, the regional economy recorded an average annual growth rate of 3.5 per cent over the ten years to 2010–11 which was higher than that of the rest of Australia. If this real growth rate continues to 2020–21, the regional economy would be worth $30 billion (in 2010–11 dollars).
The regional economic baseline (Section 3) highlights a number of the key whole of region trends and drivers and these include:
• The Central Queensland economy has experienced significant structural change over the past decade. The largest shifts in industry shares of nominal gross value added (GVA) have been in construction (11 percentage points (pp)) and mining (7.6 pp). Mining was the most dominant industry in the region accounting for 34 per cent of nominal GVA in 2010–11. This gain was mainly attributable to strong global commodity prices, particularly for coal.
• Robust economic growth has translated into broad-based employment gains in the region. Over the ten years to 2011, nearly 25 000 new jobs were created. A number of industries have driven this employment growth including mining; construction; professional scientific and technical services; health care and social assistance; rental, hiring and real estate services; public administration and safety; and electricity, gas, water and waste services.
• Around 65 per cent of Queensland’s listed mining projects, valued at $145 billion in the Deloitte Access Economics Investment Monitor December 2012, are located in Central Queensland. Almost half of this investment in mining is already under construction in the region with the bulk of this expenditure to occur over the next 3–5 years.
• Central Queensland’s population is projected to increase from 223 000 persons in 2012 to 345 000 persons by 2031. The region’s population is projected to grow at an average annual rate of 2.1 per cent a year, compared with 1.8 per cent for Queensland. This strong population growth coupled with a projected increase in
Central Queensland – Economic and Infrastructure Framework � - 2-
the non-resident population will drive demand for housing, construction, retail trade and services such as health, education, electricity, water and other utilities. An ageing population is also likely to bring challenges and potential opportunities. The proportion of residents aged 65 years and over in Central Queensland is projected to increase from 11.2 per cent in 2011 to nearly 17 per cent by 2031.
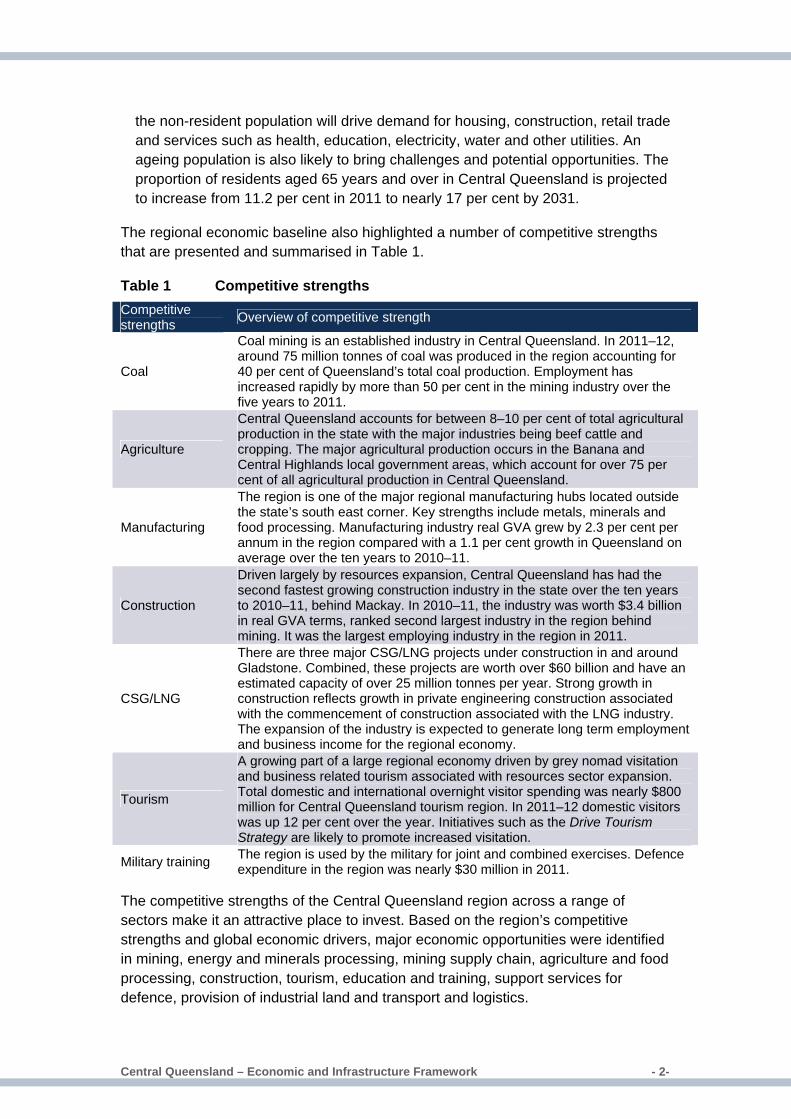
The regional economic baseline also highlighted a number of competitive strengths that are presented and summarised in Table 1.
Table 1 Competitive strengths Competitive strengths Overview of competitive strength
Coal
Coal mining is an established industry in Central Queensland. In 2011–12, around 75 million tonnes of coal was produced in the region accounting for 40 per cent of Queensland’s total coal production. Employment has increased rapidly by more than 50 per cent in the mining industry over the five years to 2011.
Agriculture
Central Queensland accounts for between 8–10 per cent of total agricultural production in the state with the major industries being beef cattle and cropping. The major agricultural production occurs in the Banana and Central Highlands local government areas, which account for over 75 per cent of all agricultural production in Central Queensland.
Manufacturing
The region is one of the major regional manufacturing hubs located outside the state’s south east corner. Key strengths include metals, minerals and food processing. Manufacturing industry real GVA grew by 2.3 per cent per annum in the region compared with a 1.1 per cent growth in Queensland on average over the ten years to 2010–11.
Construction
Driven largely by resources expansion, Central Queensland has had the second fastest growing construction industry in the state over the ten years to 2010–11, behind Mackay. In 2010–11, the industry was worth $3.4 billion in real GVA terms, ranked second largest industry in the region behind mining. It was the largest employing industry in the region in 2011.
CSG/LNG
There are three major CSG/LNG projects under construction in and around Gladstone. Combined, these projects are worth over $60 billion and have an estimated capacity of over 25 million tonnes per year. Strong growth in construction reflects growth in private engineering construction associated with the commencement of construction associated with the LNG industry. The expansion of the industry is expected to generate long term employment and business income for the regional economy.
Tourism
A growing part of a large regional economy driven by grey nomad visitation and business related tourism associated with resources sector expansion. Total domestic and international overnight visitor spending was nearly $800 million for Central Queensland tourism region. In 2011–12 domestic visitors was up 12 per cent over the year. Initiatives such as the Drive Tourism Strategy are likely to promote increased visitation.
Military training The region is used by the military for joint and combined exercises. Defence expenditure in the region was nearly $30 million in 2011.
The competitive strengths of the Central Queensland region across a range of sectors make it an attractive place to invest. Based on the region’s competitive strengths and global economic drivers, major economic opportunities were identified in mining, energy and minerals processing, mining supply chain, agriculture and food processing, construction, tourism, education and training, support services for defence, provision of industrial land and transport and logistics.
Central Queensland – Economic and Infrastructure Framework � - 3-
An infrastructure baseline analysis (Section 4) was also undertaken to identify the key economic infrastructure supporting the region and its economy, as well as related issues and challenges that could hold back economic development and growth.
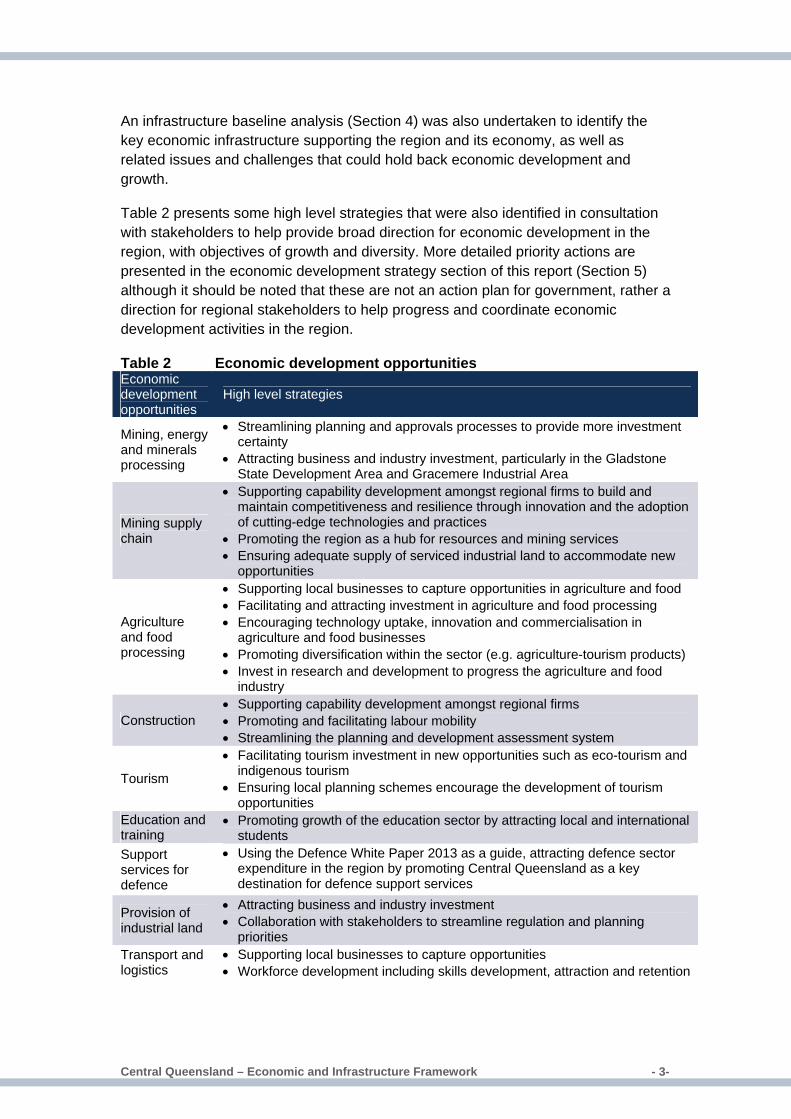
Table 2 presents some high level strategies that were also identified in consultation with stakeholders to help provide broad direction for economic development in the region, with objectives of growth and diversity. More detailed priority actions are presented in the economic development strategy section of this report (Section 5) although it should be noted that these are not an action plan for government, rather a direction for regional stakeholders to help progress and coordinate economic development activities in the region.
Table 2 Economic development opportunities Economic development opportunities
High level strategies
Mining, energy and minerals processing
• Streamlining planning and approvals processes to provide more investment certainty
• Attracting business and industry investment, particularly in the Gladstone State Development Area and Gracemere Industrial Area
Mining supply chain
• Supporting capability development amongst regional firms to build and maintain competitiveness and resilience through innovation and the adoption of cutting-edge technologies and practices
• Promoting the region as a hub for resources and mining services • Ensuring adequate supply of serviced industrial land to accommodate new
opportunities
Agriculture and food processing
• Supporting local businesses to capture opportunities in agriculture and food • Facilitating and attracting investment in agriculture and food processing • Encouraging technology uptake, innovation and commercialisation in
agriculture and food businesses • Promoting diversification within the sector (e.g. agriculture-tourism products) • Invest in research and development to progress the agriculture and food
industry
Construction • Supporting capability development amongst regional firms • Promoting and facilitating labour mobility • Streamlining the planning and development assessment system
Tourism
• Facilitating tourism investment in new opportunities such as eco-tourism and indigenous tourism
• Ensuring local planning schemes encourage the development of tourism opportunities
Education and training
• Promoting growth of the education sector by attracting local and international students
Support services for defence
• Using the Defence White Paper 2013 as a guide, attracting defence sector expenditure in the region by promoting Central Queensland as a key destination for defence support services
Provision of industrial land
• Attracting business and industry investment • Collaboration with stakeholders to streamline regulation and planning
priorities Transport and logistics
• Supporting local businesses to capture opportunities • Workforce development including skills development, attraction and retention
Central Queensland – Economic and Infrastructure Framework � - 4-
Central Queensland’s greatest strength in having a strong resources sector can also be its greatest challenge. The economic dependence on commodities exposes the region to short and medium-term fluctuations in global economic conditions and commodities market. The region also continues to face skills shortages, as well as a growing non-resident workforce, which creates challenges in terms of health services, housing and social amenities. Significant challenges are also posed by the rapidly increasing infrastructure requirements of the region, driven by the growing resources sector in and around the region. The region is also vulnerable to natural disasters such as floods, cyclones and bushfires, which can have a devastating impact on residents and the economy. To fully realise the region’s economic development opportunities, these issues and challenges need to be addressed.
Improving the region’s infrastructure base is particularly important to realise these opportunities. Enhancing the infrastructure base can also have a range of indirect economic gains, for example, improving supply chain productivity, increasing land values, enabling small business growth and growing consumer sales.
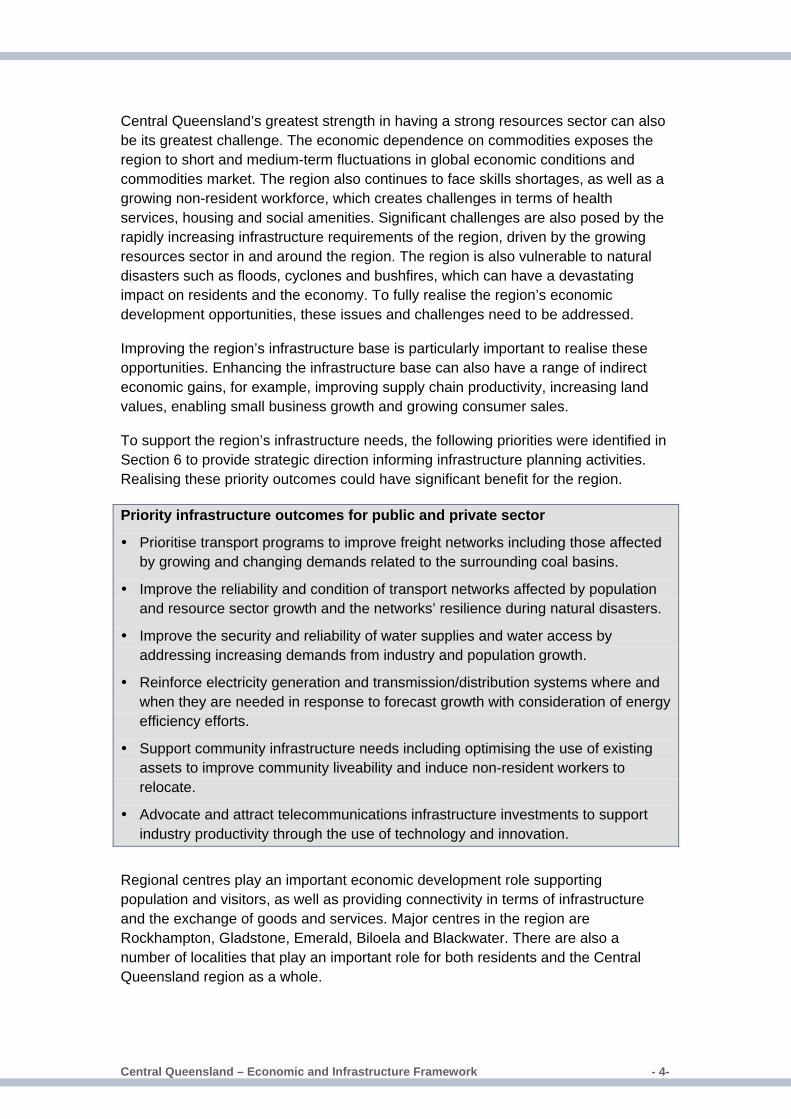
To support the region’s infrastructure needs, the following priorities were identified in Section 6 to provide strategic direction informing infrastructure planning activities. Realising these priority outcomes could have significant benefit for the region.
Priority infrastructure outcomes for public and private sector
Prioritise transport programs to improve freight networks including those affected by growing and changing demands related to the surrounding coal basins.
Improve the reliability and condition of transport networks affected by population and resource sector growth and the networks’ resilience during natural disasters.
Improve the security and reliability of water supplies and water access by addressing increasing demands from industry and population growth.
Reinforce electricity generation and transmission/distribution systems where and when they are needed in response to forecast growth with consideration of energy efficiency efforts.
Support community infrastructure needs including optimising the use of existing assets to improve community liveability and induce non-resident workers to relocate.
Advocate and attract telecommunications infrastructure investments to support industry productivity through the use of technology and innovation.
Regional centres play an important economic development role supporting population and visitors, as well as providing connectivity in terms of infrastructure and the exchange of goods and services. Major centres in the region are Rockhampton, Gladstone, Emerald, Biloela and Blackwater. There are also a number of localities that play an important role for both residents and the Central Queensland region as a whole.
Central Queensland – Economic and Infrastructure Framework � - 5-
While largely focusing on the opportunities and challenges related to the region’s medium term outlook, the framework presented in this document also starts to take a longer term perspective. It canvasses opportunities and challenges beyond the current phase of resource sector expansion and highlights the need to boost productivity growth to help foster future economic resilience.
This includes those opportunities presented by the Australian Government’s ‘Asian Century’ paper, particularly in agriculture and food, as well as capitalising on longer term growth in services such as business and professional services as well as the digital economy and the jobs of the future. Economic diversity will also contribute to the region’s longer term resilience.
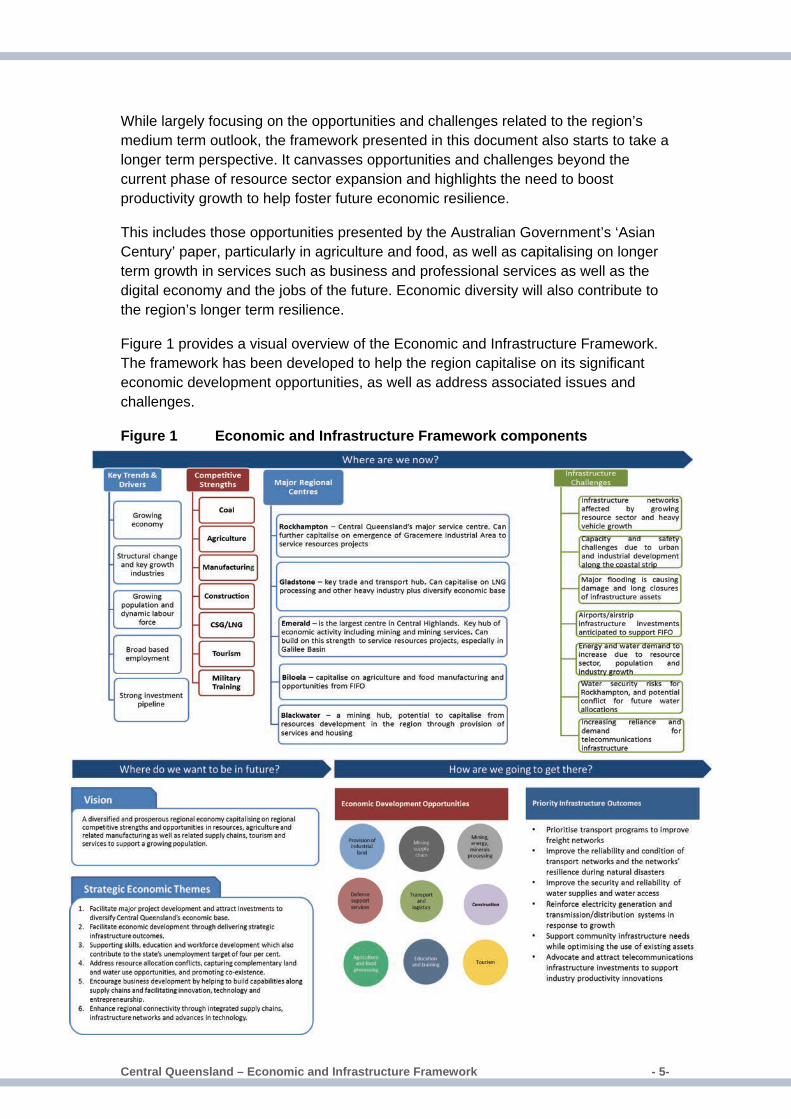
Figure 1 provides a visual overview of the Economic and Infrastructure Framework. The framework has been developed to help the region capitalise on its significant economic development opportunities, as well as address associated issues and challenges.
Figure 1 Economic and Infrastructure Framework components
Central Queensland – Economic and Infrastructure Framework � - 6-
2. Introduction
Context The Queensland Government is developing statutory regional plans that foster economic opportunities, address land use issues and build communities. These plans are being prepared in collaboration with key industry and community groups, local government, and state government agencies. The Department of State Development, Infrastructure and Planning (DSDIP) is leading the preparation of the plans.
The Queensland Government is committed to creating strong and diverse regional economies and unlocking the four pillars of the Queensland economy: the agriculture, resources, construction, and tourism sectors. These sectors drive economic growth, employment and prosperity – through the jobs and incomes they generate; through resulting economic effects along their supply chains; and, in the demand generated for a wide range of goods and services in the state’s regions. There is also a focus on streamlining regulatory barriers and creating certainty to help regions achieve their economic potential, and developing new strategies and policies to support long-term productive growth in Queensland.
Purpose This Economic and Infrastructure Framework (the framework) identifies opportunities for the Central Queensland economy to grow with the support of strategic infrastructure planning. By highlighting the economic potential of Central Queensland, the framework aims to encourage private sector investment in the region, as well as inform infrastructure planning, investment and delivery decisions. More specifically, the framework provides analytical and strategic guidance to the Central Queensland Statutory Regional Plan (‘the regional plan’) which has a land use planning focus. The regional plan defines Central Queensland to include five local government areas: Banana, Central Highlands, Gladstone, Rockhampton and Woorabinda (six from 2014 when former Livingstone Shire is re-established).
It is important to note that this framework can not provide a single or definitive pathway for economic development and growth in the region. Whilst it draws on the latest available economic data and rigorous analysis, and has been widely consulted and considered by regional stakeholders, it can not precisely predict the exact economic future of the region. Similarly it is important to note that it is not intended to be a single definitive guide in planning for the region’s future infrastructure. Whilst it presents the regional significant economic infrastructure and proposes priority outcomes for the region, it recognises other initiatives are important for detailed infrastructure planning.
Central Queensland – Economic and Infrastructure Framework � - 7-
For the purposes of this framework, infrastructure is the basic physical structures that enable the delivery of essential goods and services to communities and businesses. This framework focuses on economic infrastructure which supports economic development through the supply of energy and water, and the transportation of goods, workers and information (e.g. electrical grids, water supplies and roads).
The framework is intended to provide the economic development and infrastructure context within which the regional plan is situated and to provide some of the detail to complement the regional plan's concise format. It is also important to remember that the framework is just one of a number of local, regional and state planning and strategy documents that have helped shape the regional plan.
The framework seeks to create a collaborative approach to the region’s economic development. It also aims to improve the environment for business investment by providing a strategic positioning statement for the future and highlighting priority areas for coordinated action.
The framework is non-statutory and will be reviewed every five years in line with the regional plan to ensure it remains consistent with changing market forces and community expectations.
Approach The framework has been developed through a process of understanding where we are, where we want to be and how we can get there. An economic baseline study was undertaken to identify the region’s competitive strengths, growth drivers and the role of major regional centres in supporting and facilitating economic development. In conjunction with this study, an infrastructure baseline analysis was undertaken to get an understanding of the key economic infrastructure supporting the region and its economy, as well as the significant challenges that may impede the economic development of the region as a whole.
Central to the framework is the economic development strategy which establishes a vision and supporting strategic economic themes to help guide the region’s future economic development. It broadly identifies how the region can capitalise on its major growth opportunities and address economic development issues that may impede this growth. This is supported by infrastructure outcomes which highlight opportunities and provide guidance to infrastructure planning and prioritisation activities to help address the challenges identified. Realising these economic development opportunities and infrastructure outcomes will increase the efficiency, productivity and growth potential of the region’s economy.
By taking this approach, the framework logically works through the central issues confronting the Central Queensland economy and its prospects. The major findings and outcomes from each stage of the process are presented in this document.
Central Queensland – Economic and Infrastructure Framework � - 8-
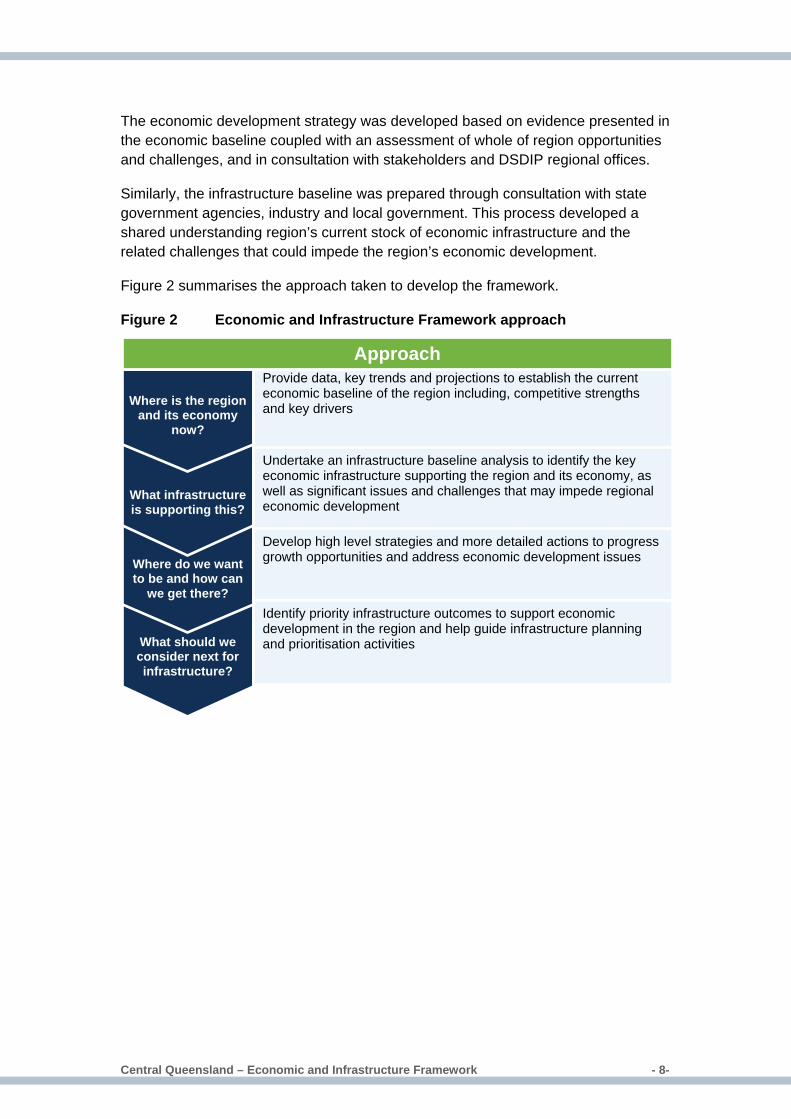
The economic development strategy was developed based on evidence presented in the economic baseline coupled with an assessment of whole of region opportunities and challenges, and in consultation with stakeholders and DSDIP regional offices.
Similarly, the infrastructure baseline was prepared through consultation with state government agencies, industry and local government. This process developed a shared understanding region’s current stock of economic infrastructure and the related challenges that could impede the region’s economic development.
Figure 2 summarises the approach taken to develop the framework.
Figure 2 Economic and Infrastructure Framework approach
What should we consider next for infrastructure?
Where do we want to be and how can
we get there?
What infrastructure is supporting this?
Where is the region
and its economy now?
Provide data, key trends and projections to establish the current economic baseline of the region including, competitive strengths and key drivers
Undertake an infrastructure baseline analysis to identify the key economic infrastructure supporting the region and its economy, as well as significant issues and challenges that may impede regional economic development
Develop high level strategies and more detailed actions to progress growth opportunities and address economic development issues
Identify priority infrastructure outcomes to support economic development in the region and help guide infrastructure planning and prioritisation activities
Approach
Central Queensland – Economic and Infrastructure Framework � - 9-
3. Economic baseline The analysis presented in this section is based largely on a number of publicly available information sources including Queensland Treasury and Trade (Government Statistician), as well as the Australian Bureau of Statistics (ABS) (and in particular the recently released census data for 2011). In some cases, this analysis is based on varying timelines but the aim in an overall sense, is to provide a detailed baseline that reflects longer term historical trends, identifies regional competitive strengths as well as emerging developments on top of baseline projections.
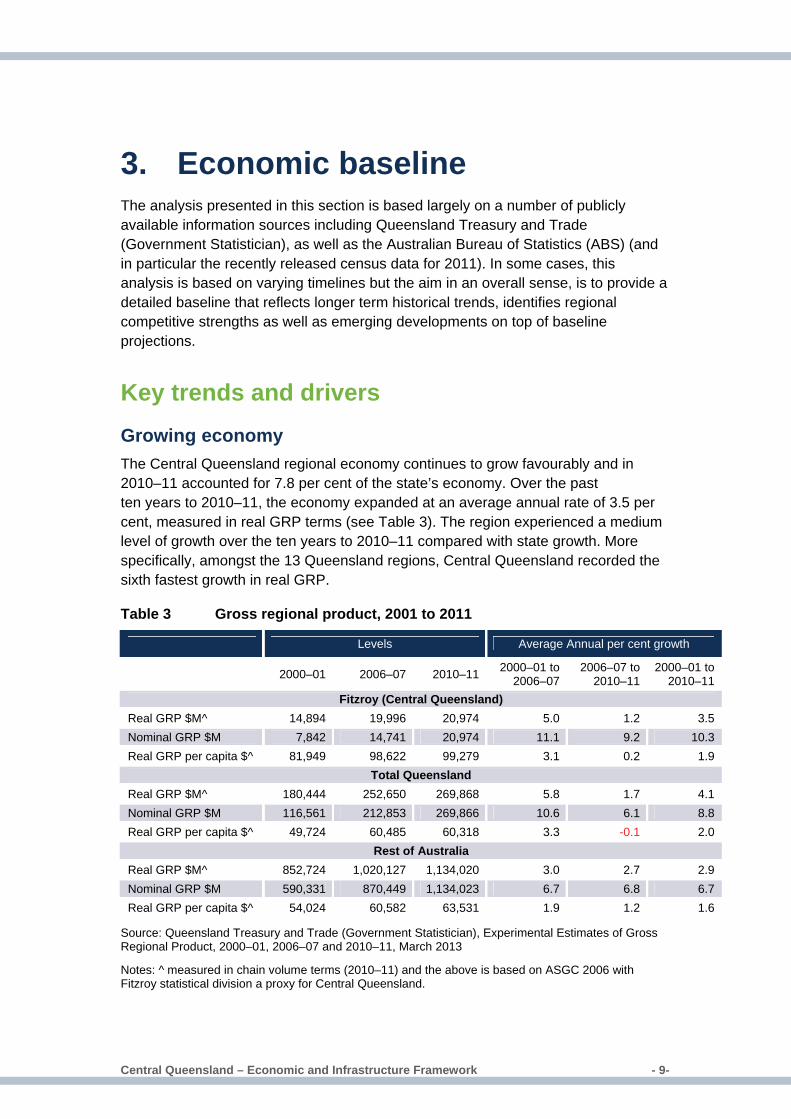
Key trends and drivers Growing economy The Central Queensland regional economy continues to grow favourably and in 2010–11 accounted for 7.8 per cent of the state’s economy. Over the past ten years to 2010–11, the economy expanded at an average annual rate of 3.5 per cent, measured in real GRP terms (see Table 3). The region experienced a medium level of growth over the ten years to 2010–11 compared with state growth. More specifically, amongst the 13 Queensland regions, Central Queensland recorded the sixth fastest growth in real GRP.
Table 3 Gross regional product, 2001 to 2011
Levels Average Annual per cent growth
2000–01 2006–07 2010–11 2000–01 to 2006–07
2006–07 to 2010–11
2000–01 to 2010–11
Fitzroy (Central Queensland) Real GRP $M^ 14,894 19,996 20,974 5.0 1.2 3.5 Nominal GRP $M 7,842 14,741 20,974 11.1 9.2 10.3 Real GRP per capita $^ 81,949 98,622 99,279 3.1 0.2 1.9
Total Queensland Real GRP $M^ 180,444 252,650 269,868 5.8 1.7 4.1 Nominal GRP $M 116,561 212,853 269,866 10.6 6.1 8.8 Real GRP per capita $^ 49,724 60,485 60,318 3.3 -0.1 2.0
Rest of Australia Real GRP $M^ 852,724 1,020,127 1,134,020 3.0 2.7 2.9 Nominal GRP $M 590,331 870,449 1,134,023 6.7 6.8 6.7 Real GRP per capita $^ 54,024 60,582 63,531 1.9 1.2 1.6
Source: Queensland Treasury and Trade (Government Statistician), Experimental Estimates of Gross Regional Product, 2000–01, 2006–07 and 2010–11, March 2013
Notes: ^ measured in chain volume terms (2010–11) and the above is based on ASGC 2006 with Fitzroy statistical division a proxy for Central Queensland.
Central Queensland – Economic and Infrastructure Framework � - 10-
The growth in nominal GRP, which reflects current price of all goods and services produced in the region, was strong and based on this measure, the Central Queensland economy is in the fast lane. The regional economy expanded by 10.3 per cent per annum, compared with 8.8 per cent growth recorded at the state level.
This was largely underpinned by substantial increases in global commodity prices, particularly coal prices.1 Over the ten years to 2010–11, the mining industry output in the region grew by 13 per cent per annum mainly due to price effects as production in terms of volume rose by 0.9 per cent on an annual basis.
The region’s economic growth over the past decade has not been uniform. The impacts of the Global Financial Crisis (GFC) can be seen over the period 2006–07 to 2010–11, which significantly slowed growth in the region, state and rest of Australia (to a lesser extent) when compared with the 2000–01 to 2006–07 period. In addition, this period was also impacted by the natural disasters that occurred in 2011. The natural disasters significantly disrupted economic production in 2011 with large disruptions resulting in significantly lower volume of production from mining and agriculture in Queensland in 2011. There have been significant impacts on mining production due to legacy mine water issues in Queensland.
Changes in population play a key role in determining changes in a region’s productive capacity. For this reason, it is useful to consider population changes over time when comparing GRP. In effect, per capita measures remove the impact of population growth as a driver of economic growth. Hence, after accounting for population the economic growth rate in the region was essentially in line with the state. The GRP per capita grew by 1.9 per cent on average in Central Queensland and 2 per cent in Queensland, both slightly above rest of Australia.
Analysis of economic growth provides useful insights into the Central Queensland economy, including:
structural changes (taking into account both price and volume effects), as well as driver industries (focussing on underlying volume growth) and;
regional specialisation (regional industries that account for a larger share of economic output when compared with the state).
If it is assumed that the historical long term real growth rate continues, the regional economy could be worth around $30 billion in 2020–21 (value in 2010–11 dollars).
1 The region accounts of around 40 per cent of Queensland’s total coal exports. Over the ten years to 2010–11 thermal and metallurgical coal prices rose by approximately 102% and 221%, respectively in AUD terms (source: Australian Mineral Statistics, March 2011, Australia Bureau of Agricultural and Resource Economics).
Central Queensland – Economic and Infrastructure Framework � - 11-
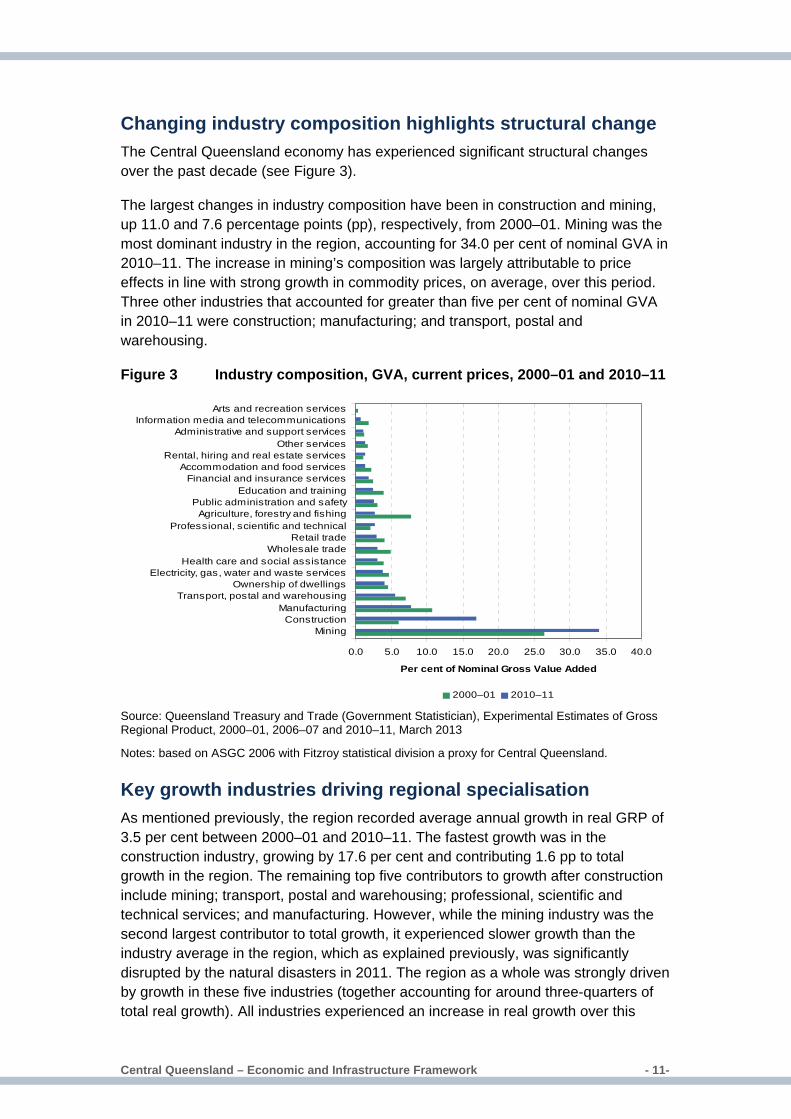
Changing industry composition highlights structural change The Central Queensland economy has experienced significant structural changes over the past decade (see Figure 3).
The largest changes in industry composition have been in construction and mining, up 11.0 and 7.6 percentage points (pp), respectively, from 2000–01. Mining was the most dominant industry in the region, accounting for 34.0 per cent of nominal GVA in 2010–11. The increase in mining’s composition was largely attributable to price effects in line with strong growth in commodity prices, on average, over this period. Three other industries that accounted for greater than five per cent of nominal GVA in 2010–11 were construction; manufacturing; and transport, postal and warehousing.
Figure 3 Industry composition, GVA, current prices, 2000–01 and 2010–11
0.0 5.0 10.0 15.0 20.0 25.0 30.0 35.0 40.0
MiningConstruction
ManufacturingTransport, postal and warehousing
Ownership of dwellingsElectricity, gas, water and waste services
Health care and social assistanceWholesale trade
Retail tradeProfessional, scientific and technical
Agriculture, forestry and fishingPublic administration and safety
Education and trainingFinancial and insurance services
Accommodation and food servicesRental, hiring and real estate services
Other servicesAdministrative and support services
Information media and telecommunicationsArts and recreation services
Per cent of Nominal Gross Value Added
2000–01 2010–11
Source: Queensland Treasury and Trade (Government Statistician), Experimental Estimates of Gross Regional Product, 2000–01, 2006–07 and 2010–11, March 2013
Notes: based on ASGC 2006 with Fitzroy statistical division a proxy for Central Queensland.
Key growth industries driving regional specialisation As mentioned previously, the region recorded average annual growth in real GRP of 3.5 per cent between 2000–01 and 2010–11. The fastest growth was in the construction industry, growing by 17.6 per cent and contributing 1.6 pp to total growth in the region. The remaining top five contributors to growth after construction include mining; transport, postal and warehousing; professional, scientific and technical services; and manufacturing. However, while the mining industry was the second largest contributor to total growth, it experienced slower growth than the industry average in the region, which as explained previously, was significantly disrupted by the natural disasters in 2011. The region as a whole was strongly driven by growth in these five industries (together accounting for around three-quarters of total real growth). All industries experienced an increase in real growth over this
Central Queensland – Economic and Infrastructure Framework � - 12-
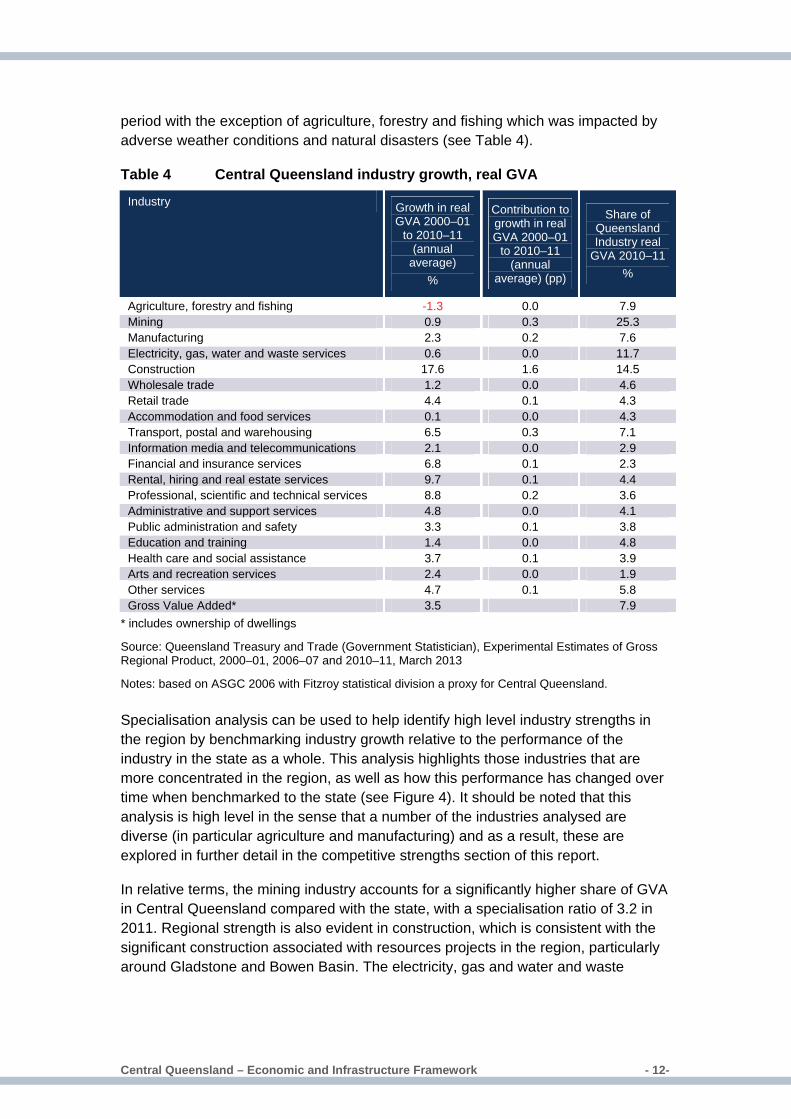
period with the exception of agriculture, forestry and fishing which was impacted by adverse weather conditions and natural disasters (see Table 4).
Table 4 Central Queensland industry growth, real GVA
Industry Growth in real GVA 2000–01
to 2010–11 (annual
average) %
Contribution to growth in real GVA 2000–01
to 2010–11 (annual
average) (pp)
Share of Queensland Industry real
GVA 2010–11 %
Agriculture, forestry and fishing -1.3 0.0 7.9 Mining 0.9 0.3 25.3 Manufacturing 2.3 0.2 7.6 Electricity, gas, water and waste services 0.6 0.0 11.7 Construction 17.6 1.6 14.5 Wholesale trade 1.2 0.0 4.6 Retail trade 4.4 0.1 4.3 Accommodation and food services 0.1 0.0 4.3 Transport, postal and warehousing 6.5 0.3 7.1 Information media and telecommunications 2.1 0.0 2.9 Financial and insurance services 6.8 0.1 2.3 Rental, hiring and real estate services 9.7 0.1 4.4 Professional, scientific and technical services 8.8 0.2 3.6 Administrative and support services 4.8 0.0 4.1 Public administration and safety 3.3 0.1 3.8 Education and training 1.4 0.0 4.8 Health care and social assistance 3.7 0.1 3.9 Arts and recreation services 2.4 0.0 1.9 Other services 4.7 0.1 5.8 Gross Value Added* 3.5 7.9
* includes ownership of dwellings
Source: Queensland Treasury and Trade (Government Statistician), Experimental Estimates of Gross Regional Product, 2000–01, 2006–07 and 2010–11, March 2013
Notes: based on ASGC 2006 with Fitzroy statistical division a proxy for Central Queensland.
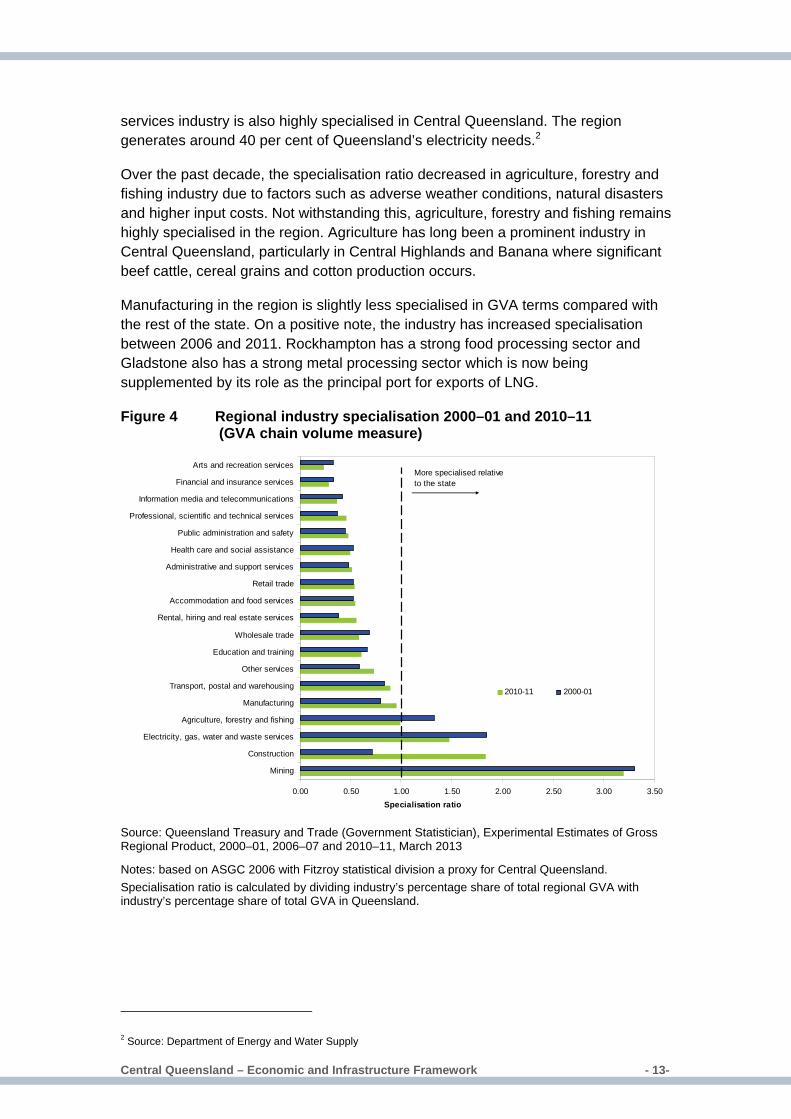
Specialisation analysis can be used to help identify high level industry strengths in the region by benchmarking industry growth relative to the performance of the industry in the state as a whole. This analysis highlights those industries that are more concentrated in the region, as well as how this performance has changed over time when benchmarked to the state (see Figure 4). It should be noted that this analysis is high level in the sense that a number of the industries analysed are diverse (in particular agriculture and manufacturing) and as a result, these are explored in further detail in the competitive strengths section of this report.
In relative terms, the mining industry accounts for a significantly higher share of GVA in Central Queensland compared with the state, with a specialisation ratio of 3.2 in 2011. Regional strength is also evident in construction, which is consistent with the significant construction associated with resources projects in the region, particularly around Gladstone and Bowen Basin. The electricity, gas and water and waste
Central Queensland – Economic and Infrastructure Framework � - 13-
services industry is also highly specialised in Central Queensland. The region generates around 40 per cent of Queensland’s electricity needs.2
Over the past decade, the specialisation ratio decreased in agriculture, forestry and fishing industry due to factors such as adverse weather conditions, natural disasters and higher input costs. Not withstanding this, agriculture, forestry and fishing remains highly specialised in the region. Agriculture has long been a prominent industry in Central Queensland, particularly in Central Highlands and Banana where significant beef cattle, cereal grains and cotton production occurs.
Manufacturing in the region is slightly less specialised in GVA terms compared with the rest of the state. On a positive note, the industry has increased specialisation between 2006 and 2011. Rockhampton has a strong food processing sector and Gladstone also has a strong metal processing sector which is now being supplemented by its role as the principal port for exports of LNG.
Figure 4 Regional industry specialisation 2000–01 and 2010–11 (GVA chain volume measure)
0.00 0.50 1.00 1.50 2.00 2.50 3.00 3.50
Mining
Construction
Electricity, gas, water and waste services
Agriculture, forestry and fishing
Manufacturing
Transport, postal and warehousing
Other services
Education and training
Wholesale trade
Rental, hiring and real estate services
Accommodation and food services
Retail trade
Administrative and support services
Health care and social assistance
Public administration and safety
Professional, scientific and technical services
Information media and telecommunications
Financial and insurance services
Arts and recreation services
Specialisation ratio
2010-11 2000-01
More specialised relative to the state
Source: Queensland Treasury and Trade (Government Statistician), Experimental Estimates of Gross Regional Product, 2000–01, 2006–07 and 2010–11, March 2013
Notes: based on ASGC 2006 with Fitzroy statistical division a proxy for Central Queensland. Specialisation ratio is calculated by dividing industry’s percentage share of total regional GVA with industry’s percentage share of total GVA in Queensland.
2 Source: Department of Energy and Water Supply
Central Queensland – Economic and Infrastructure Framework � - 14-
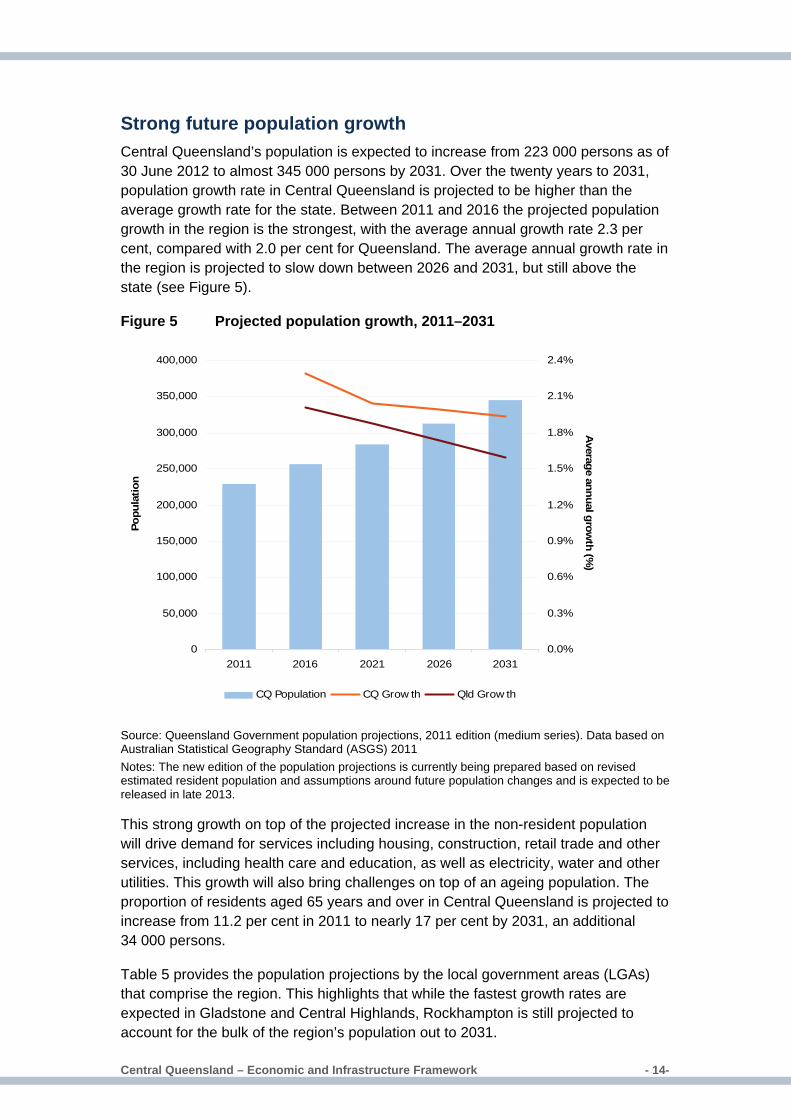
Strong future population growth Central Queensland’s population is expected to increase from 223 000 persons as of 30 June 2012 to almost 345 000 persons by 2031. Over the twenty years to 2031, population growth rate in Central Queensland is projected to be higher than the average growth rate for the state. Between 2011 and 2016 the projected population growth in the region is the strongest, with the average annual growth rate 2.3 per cent, compared with 2.0 per cent for Queensland. The average annual growth rate in the region is projected to slow down between 2026 and 2031, but still above the state (see Figure 5).
Figure 5 Projected population growth, 2011–2031
0
50,000
100,000
150,000
200,000
250,000
300,000
350,000
400,000
2011 2016 2021 2026 2031
Popu
latio
n
0.0%
0.3%
0.6%
0.9%
1.2%
1.5%
1.8%
2.1%
2.4%
Average annual grow
th (%)
CQ Population CQ Grow th Qld Grow th
Source: Queensland Government population projections, 2011 edition (medium series). Data based on Australian Statistical Geography Standard (ASGS) 2011 Notes: The new edition of the population projections is currently being prepared based on revised estimated resident population and assumptions around future population changes and is expected to be released in late 2013.
This strong growth on top of the projected increase in the non-resident population will drive demand for services including housing, construction, retail trade and other services, including health care and education, as well as electricity, water and other utilities. This growth will also bring challenges on top of an ageing population. The proportion of residents aged 65 years and over in Central Queensland is projected to increase from 11.2 per cent in 2011 to nearly 17 per cent by 2031, an additional 34 000 persons.
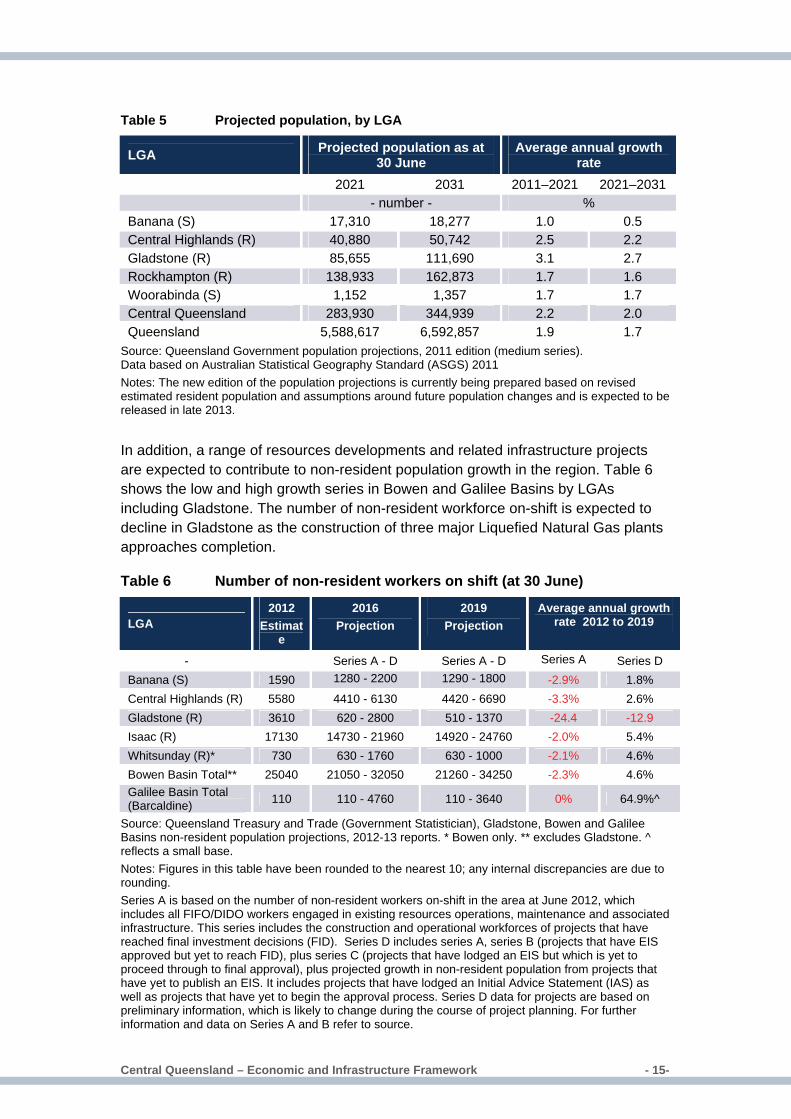
Table 5 provides the population projections by the local government areas (LGAs) that comprise the region. This highlights that while the fastest growth rates are expected in Gladstone and Central Highlands, Rockhampton is still projected to account for the bulk of the region’s population out to 2031.
Central Queensland – Economic and Infrastructure Framework � - 15-
Table 5 Projected population, by LGA
LGA Projected population as at 30 June
Average annual growth rate
2021 2031 2011–2021 2021–2031 - number - % Banana (S) 17,310 18,277 1.0 0.5 Central Highlands (R) 40,880 50,742 2.5 2.2 Gladstone (R) 85,655 111,690 3.1 2.7 Rockhampton (R) 138,933 162,873 1.7 1.6 Woorabinda (S) 1,152 1,357 1.7 1.7 Central Queensland 283,930 344,939 2.2 2.0 Queensland 5,588,617 6,592,857 1.9 1.7
Source: Queensland Government population projections, 2011 edition (medium series). Data based on Australian Statistical Geography Standard (ASGS) 2011 Notes: The new edition of the population projections is currently being prepared based on revised estimated resident population and assumptions around future population changes and is expected to be released in late 2013.
In addition, a range of resources developments and related infrastructure projects are expected to contribute to non-resident population growth in the region. Table 6 shows the low and high growth series in Bowen and Galilee Basins by LGAs including Gladstone. The number of non-resident workforce on-shift is expected to decline in Gladstone as the construction of three major Liquefied Natural Gas plants approaches completion.
Table 6 Number of non-resident workers on shift (at 30 June)
LGA 2012
Estimate
2016 Projection
2019 Projection
Average annual growth rate 2012 to 2019
- Series A - D Series A - D Series A Series D Banana (S) 1590 1280 - 2200 1290 - 1800 -2.9% 1.8% Central Highlands (R) 5580 4410 - 6130 4420 - 6690 -3.3% 2.6% Gladstone (R) 3610 620 - 2800 510 - 1370 -24.4 -12.9 Isaac (R) 17130 14730 - 21960 14920 - 24760 -2.0% 5.4% Whitsunday (R)* 730 630 - 1760 630 - 1000 -2.1% 4.6% Bowen Basin Total** 25040 21050 - 32050 21260 - 34250 -2.3% 4.6% Galilee Basin Total (Barcaldine) 110 110 - 4760 110 - 3640 0% 64.9%^
Source: Queensland Treasury and Trade (Government Statistician), Gladstone, Bowen and Galilee Basins non-resident population projections, 2012-13 reports. * Bowen only. ** excludes Gladstone. ^ reflects a small base. Notes: Figures in this table have been rounded to the nearest 10; any internal discrepancies are due to rounding. Series A is based on the number of non-resident workers on-shift in the area at June 2012, which includes all FIFO/DIDO workers engaged in existing resources operations, maintenance and associated infrastructure. This series includes the construction and operational workforces of projects that have reached final investment decisions (FID). Series D includes series A, series B (projects that have EIS approved but yet to reach FID), plus series C (projects that have lodged an EIS but which is yet to proceed through to final approval), plus projected growth in non-resident population from projects that have yet to publish an EIS. It includes projects that have lodged an Initial Advice Statement (IAS) as well as projects that have yet to begin the approval process. Series D data for projects are based on preliminary information, which is likely to change during the course of project planning. For further information and data on Series A and B refer to source.
Central Queensland – Economic and Infrastructure Framework � - 16-
While there is likely to be a greater presence of non-residents workers in the neighbouring Isaac region, increases are also projected in Central Highlands and Banana Shire. In 2012 Blackwater, in the Central Highlands LGA, and Biloela, in Banana Shire, are amongst the top five Urban Centres/Localities in terms of growth in the number of non-resident workers (see Appendix A).
Regional centres Regional centres are important from an economic development perspective in terms of the role they provide in supporting their own populations, non-residents and visitors, as well as surrounding areas in the region. This includes the connections they provide and facilitate (including infrastructure), as well as goods and services that are exchanged both within and outside of Central Queensland region. Major centres in the region are Rockhampton, Gladstone, Emerald, Biloela and Blackwater. There are also a number of localities that play an important role for both residents and the Central Queensland region as a whole. The role and outlook of these major regional centres, including their contributions to resident and non-resident population growth in the region is provided in Appendix A.
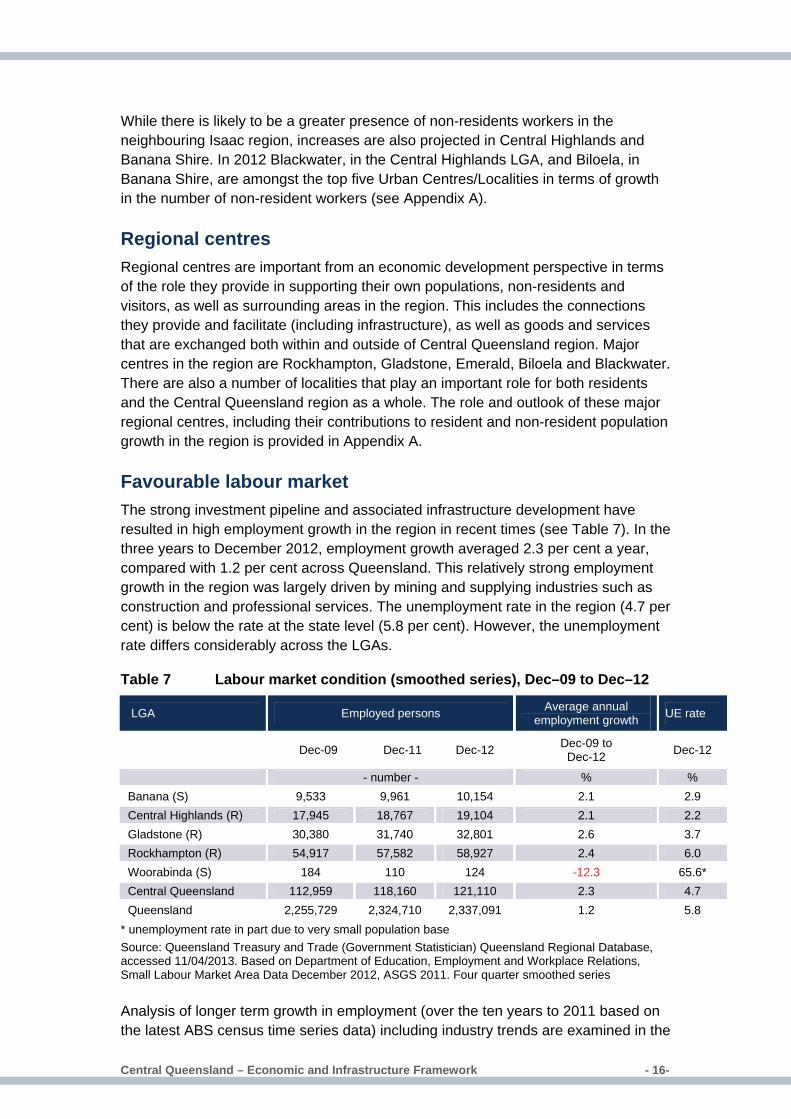
Favourable labour market The strong investment pipeline and associated infrastructure development have resulted in high employment growth in the region in recent times (see Table 7). In the three years to December 2012, employment growth averaged 2.3 per cent a year, compared with 1.2 per cent across Queensland. This relatively strong employment growth in the region was largely driven by mining and supplying industries such as construction and professional services. The unemployment rate in the region (4.7 per cent) is below the rate at the state level (5.8 per cent). However, the unemployment rate differs considerably across the LGAs.
Table 7 Labour market condition (smoothed series), Dec–09 to Dec–12
LGA Employed persons Average annual employment growth UE rate
Dec-09 Dec-11 Dec-12 Dec-09 to Dec-12 Dec-12
- number - % % Banana (S) 9,533 9,961 10,154 2.1 2.9 Central Highlands (R) 17,945 18,767 19,104 2.1 2.2 Gladstone (R) 30,380 31,740 32,801 2.6 3.7 Rockhampton (R) 54,917 57,582 58,927 2.4 6.0 Woorabinda (S) 184 110 124 -12.3 65.6* Central Queensland 112,959 118,160 121,110 2.3 4.7 Queensland 2,255,729 2,324,710 2,337,091 1.2 5.8
* unemployment rate in part due to very small population base Source: Queensland Treasury and Trade (Government Statistician) Queensland Regional Database, accessed 11/04/2013. Based on Department of Education, Employment and Workplace Relations, Small Labour Market Area Data December 2012, ASGS 2011. Four quarter smoothed series
Analysis of longer term growth in employment (over the ten years to 2011 based on the latest ABS census time series data) including industry trends are examined in the
Central Queensland – Economic and Infrastructure Framework � - 17-
following section. The aim of this is to provide an understanding of driver industries in the region for job growth and regional specialisation.
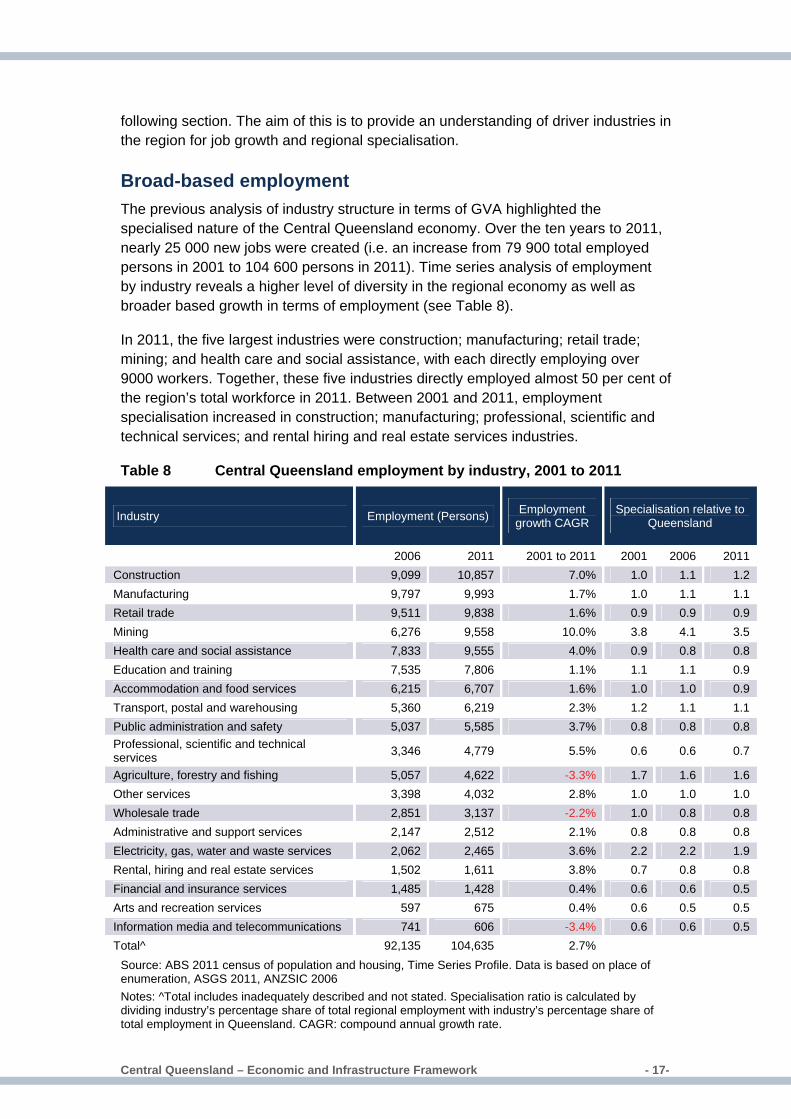
Broad-based employment The previous analysis of industry structure in terms of GVA highlighted the specialised nature of the Central Queensland economy. Over the ten years to 2011, nearly 25 000 new jobs were created (i.e. an increase from 79 900 total employed persons in 2001 to 104 600 persons in 2011). Time series analysis of employment by industry reveals a higher level of diversity in the regional economy as well as broader based growth in terms of employment (see Table 8).
In 2011, the five largest industries were construction; manufacturing; retail trade; mining; and health care and social assistance, with each directly employing over 9000 workers. Together, these five industries directly employed almost 50 per cent of the region’s total workforce in 2011. Between 2001 and 2011, employment specialisation increased in construction; manufacturing; professional, scientific and technical services; and rental hiring and real estate services industries.
Table 8 Central Queensland employment by industry, 2001 to 2011
Industry Employment (Persons) Employment growth CAGR
Specialisation relative to Queensland
2006 2011 2001 to 2011 2001 2006 2011 Construction 9,099 10,857 7.0% 1.0 1.1 1.2 Manufacturing 9,797 9,993 1.7% 1.0 1.1 1.1 Retail trade 9,511 9,838 1.6% 0.9 0.9 0.9 Mining 6,276 9,558 10.0% 3.8 4.1 3.5 Health care and social assistance 7,833 9,555 4.0% 0.9 0.8 0.8 Education and training 7,535 7,806 1.1% 1.1 1.1 0.9 Accommodation and food services 6,215 6,707 1.6% 1.0 1.0 0.9 Transport, postal and warehousing 5,360 6,219 2.3% 1.2 1.1 1.1 Public administration and safety 5,037 5,585 3.7% 0.8 0.8 0.8 Professional, scientific and technical services 3,346 4,779 5.5% 0.6 0.6 0.7
Agriculture, forestry and fishing 5,057 4,622 -3.3% 1.7 1.6 1.6 Other services 3,398 4,032 2.8% 1.0 1.0 1.0 Wholesale trade 2,851 3,137 -2.2% 1.0 0.8 0.8 Administrative and support services 2,147 2,512 2.1% 0.8 0.8 0.8 Electricity, gas, water and waste services 2,062 2,465 3.6% 2.2 2.2 1.9 Rental, hiring and real estate services 1,502 1,611 3.8% 0.7 0.8 0.8 Financial and insurance services 1,485 1,428 0.4% 0.6 0.6 0.5 Arts and recreation services 597 675 0.4% 0.6 0.5 0.5 Information media and telecommunications 741 606 -3.4% 0.6 0.6 0.5 Total^ 92,135 104,635 2.7%
Source: ABS 2011 census of population and housing, Time Series Profile. Data is based on place of enumeration, ASGS 2011, ANZSIC 2006 Notes: ^Total includes inadequately described and not stated. Specialisation ratio is calculated by dividing industry’s percentage share of total regional employment with industry’s percentage share of total employment in Queensland. CAGR: compound annual growth rate.
Central Queensland – Economic and Infrastructure Framework � - 18-
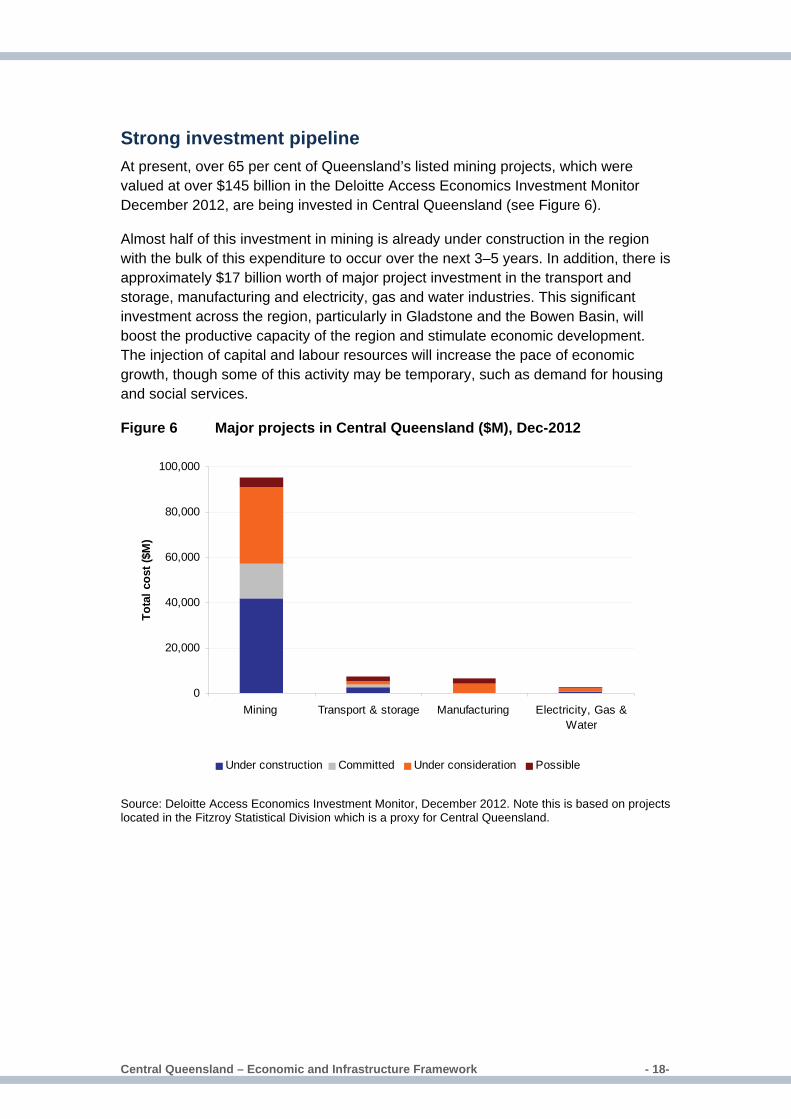
Strong investment pipeline At present, over 65 per cent of Queensland’s listed mining projects, which were valued at over $145 billion in the Deloitte Access Economics Investment Monitor December 2012, are being invested in Central Queensland (see Figure 6).
Almost half of this investment in mining is already under construction in the region with the bulk of this expenditure to occur over the next 3–5 years. In addition, there is approximately $17 billion worth of major project investment in the transport and storage, manufacturing and electricity, gas and water industries. This significant investment across the region, particularly in Gladstone and the Bowen Basin, will boost the productive capacity of the region and stimulate economic development. The injection of capital and labour resources will increase the pace of economic growth, though some of this activity may be temporary, such as demand for housing and social services.
Figure 6 Major projects in Central Queensland ($M), Dec-2012
0
20,000
40,000
60,000
80,000
100,000
Mining Transport & storage Manufacturing Electricity, Gas &Water
Tota
l cos
t ($M
)
Under construction Committed Under consideration Possible
Source: Deloitte Access Economics Investment Monitor, December 2012. Note this is based on projects located in the Fitzroy Statistical Division which is a proxy for Central Queensland.
Central Queensland – Economic and Infrastructure Framework � - 19-
Competitive strengths Coal Central Queensland is home to a significant share of the state’s coal and mineral production. The region consistently accounted for around 25–30 per cent of the total value of mining production in Queensland over the past decade.
Coal accounted for around half the value of Queensland’s total commodity exports between 2008–09 and 2011–12. This value is largely derived from coal production, with the southern section of the Bowen Basin running through the Central Highlands and some parts of the Banana shire. In 2011–12, Central Queensland produced 40 per cent of Queensland’s coal.
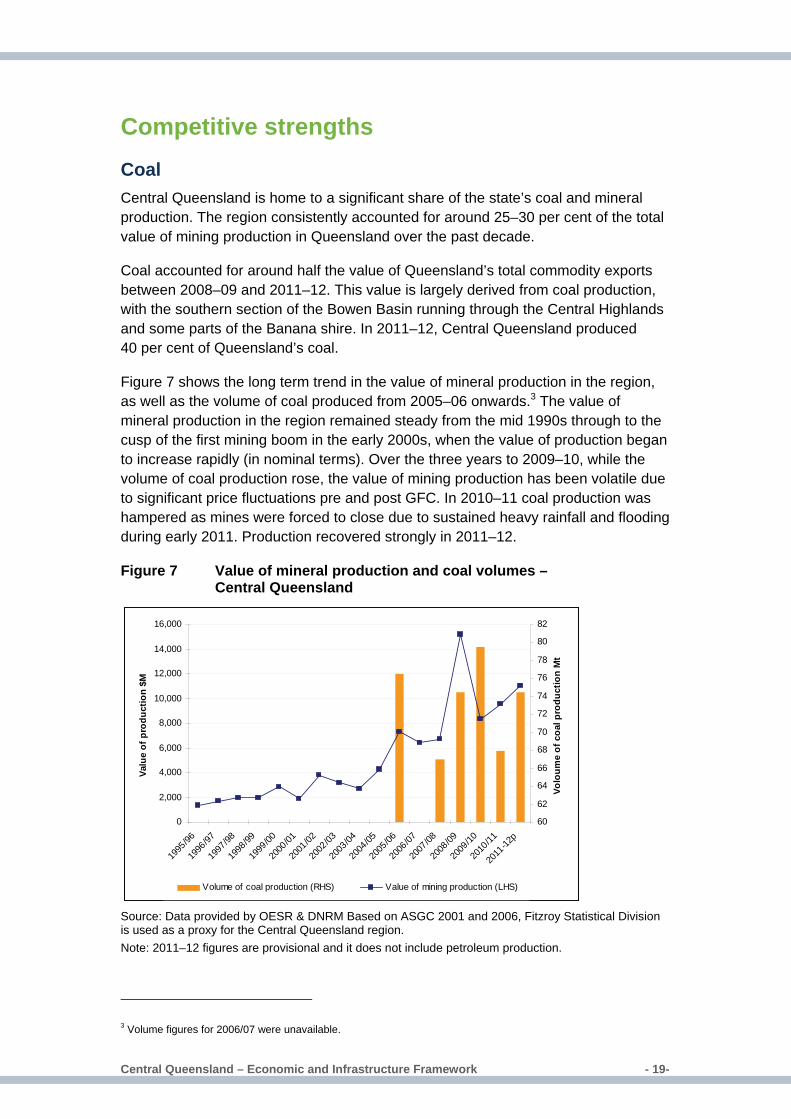
Figure 7 shows the long term trend in the value of mineral production in the region, as well as the volume of coal produced from 2005–06 onwards.3 The value of mineral production in the region remained steady from the mid 1990s through to the cusp of the first mining boom in the early 2000s, when the value of production began to increase rapidly (in nominal terms). Over the three years to 2009–10, while the volume of coal production rose, the value of mining production has been volatile due to significant price fluctuations pre and post GFC. In 2010–11 coal production was hampered as mines were forced to close due to sustained heavy rainfall and flooding during early 2011. Production recovered strongly in 2011–12.
Figure 7 Value of mineral production and coal volumes – Central Queensland
0
2,000
4,000
6,000
8,000
10,000
12,000
14,000
16,000
1995
/96
1996
/97
1997
/98
1998
/99
1999
/00
2000
/01
2001
/02
2002
/03
2003
/04
2004
/05
2005
/06
2006
/07
2007
/08
2008
/09
2009
/10
2010
/11
2011
-12p
Valu
e of
pro
duct
ion
$M
60
62
64
66
68
70
72
74
76
78
80
82
Volo
ume
of c
oal p
rodu
ctio
n M
t
Volume of coal production (RHS) Value of mining production (LHS)
Source: Data provided by OESR & DNRM Based on ASGC 2001 and 2006, Fitzroy Statistical Division is used as a proxy for the Central Queensland region. Note: 2011–12 figures are provisional and it does not include petroleum production.
3 Volume figures for 2006/07 were unavailable.
Central Queensland – Economic and Infrastructure Framework � - 20-
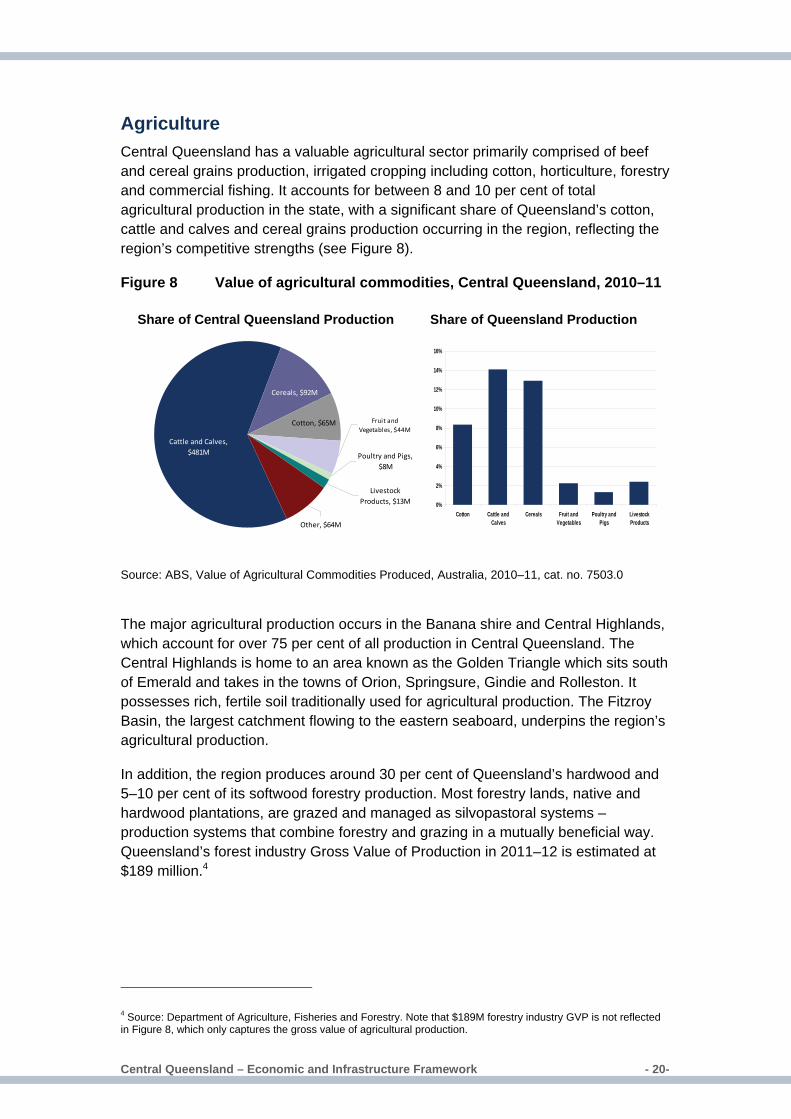
Agriculture Central Queensland has a valuable agricultural sector primarily comprised of beef and cereal grains production, irrigated cropping including cotton, horticulture, forestry and commercial fishing. It accounts for between 8 and 10 per cent of total agricultural production in the state, with a significant share of Queensland’s cotton, cattle and calves and cereal grains production occurring in the region, reflecting the region’s competitive strengths (see Figure 8).
Figure 8 Value of agricultural commodities, Central Queensland, 2010–11
Source: ABS, Value of Agricultural Commodities Produced, Australia, 2010–11, cat. no. 7503.0
The major agricultural production occurs in the Banana shire and Central Highlands, which account for over 75 per cent of all production in Central Queensland. The Central Highlands is home to an area known as the Golden Triangle which sits south of Emerald and takes in the towns of Orion, Springsure, Gindie and Rolleston. It possesses rich, fertile soil traditionally used for agricultural production. The Fitzroy Basin, the largest catchment flowing to the eastern seaboard, underpins the region’s agricultural production.
In addition, the region produces around 30 per cent of Queensland’s hardwood and 5–10 per cent of its softwood forestry production. Most forestry lands, native and hardwood plantations, are grazed and managed as silvopastoral systems – production systems that combine forestry and grazing in a mutually beneficial way. Queensland’s forest industry Gross Value of Production in 2011–12 is estimated at $189 million.4
4 Source: Department of Agriculture, Fisheries and Forestry. Note that $189M forestry industry GVP is not reflected in Figure 8, which only captures the gross value of agricultural production.
0%
2%
4%
6%
8%
10%
12%
14%
16%
Cotton Cattle andCalves
Cereals Fruit andVegetables
Poultry andPigs
LivestockProducts
Fruit and Vegetables, $44M
Cotton, $65M
Cereals, $92M
Livestock Products, $13M
Other, $64M
Cattle and Calves, $481M Poultry and Pigs,
$8M
Share of Central Queensland Production Share of Queensland Production
Central Queensland – Economic and Infrastructure Framework � - 21-
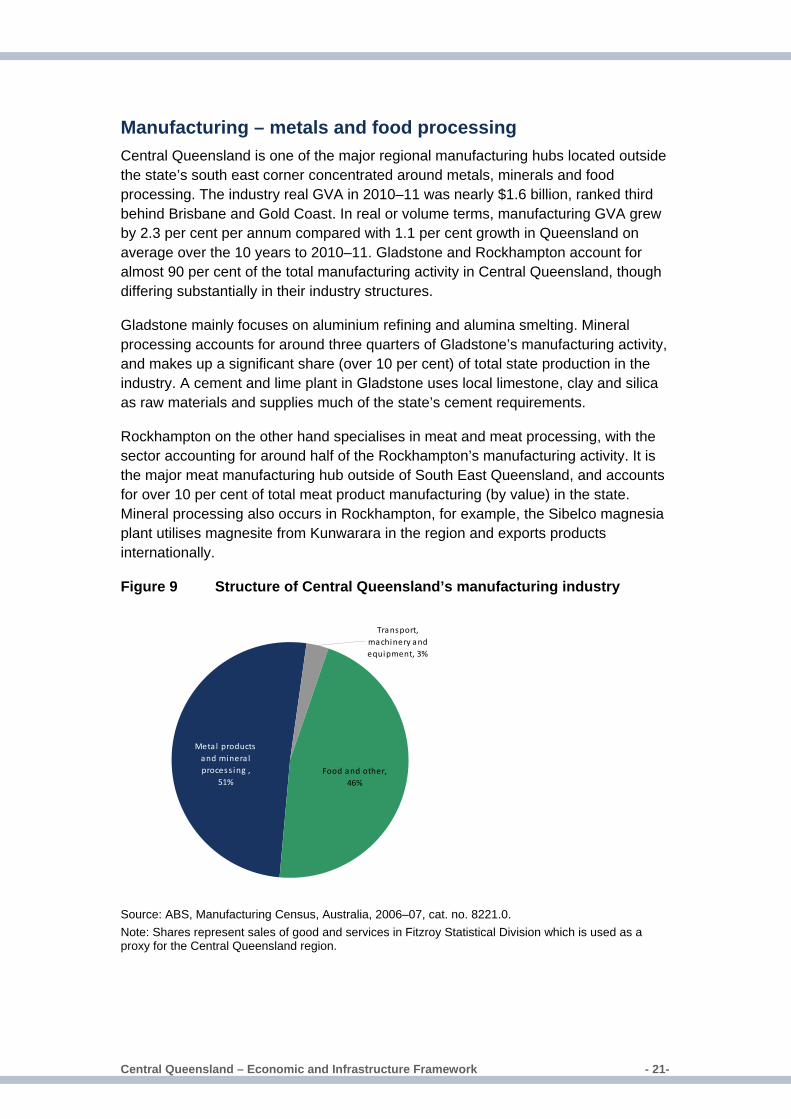
Manufacturing – metals and food processing Central Queensland is one of the major regional manufacturing hubs located outside the state’s south east corner concentrated around metals, minerals and food processing. The industry real GVA in 2010–11 was nearly $1.6 billion, ranked third behind Brisbane and Gold Coast. In real or volume terms, manufacturing GVA grew by 2.3 per cent per annum compared with 1.1 per cent growth in Queensland on average over the 10 years to 2010–11. Gladstone and Rockhampton account for almost 90 per cent of the total manufacturing activity in Central Queensland, though differing substantially in their industry structures.
Gladstone mainly focuses on aluminium refining and alumina smelting. Mineral processing accounts for around three quarters of Gladstone’s manufacturing activity, and makes up a significant share (over 10 per cent) of total state production in the industry. A cement and lime plant in Gladstone uses local limestone, clay and silica as raw materials and supplies much of the state’s cement requirements.
Rockhampton on the other hand specialises in meat and meat processing, with the sector accounting for around half of the Rockhampton’s manufacturing activity. It is the major meat manufacturing hub outside of South East Queensland, and accounts for over 10 per cent of total meat product manufacturing (by value) in the state. Mineral processing also occurs in Rockhampton, for example, the Sibelco magnesia plant utilises magnesite from Kunwarara in the region and exports products internationally.
Figure 9 Structure of Central Queensland’s manufacturing industry
Metal products and minera l process ing ,
51%
Transport, machinery and equipment, 3%
Food and other, 46%
Source: ABS, Manufacturing Census, Australia, 2006–07, cat. no. 8221.0. Note: Shares represent sales of good and services in Fitzroy Statistical Division which is used as a proxy for the Central Queensland region.
Central Queensland – Economic and Infrastructure Framework � - 22-
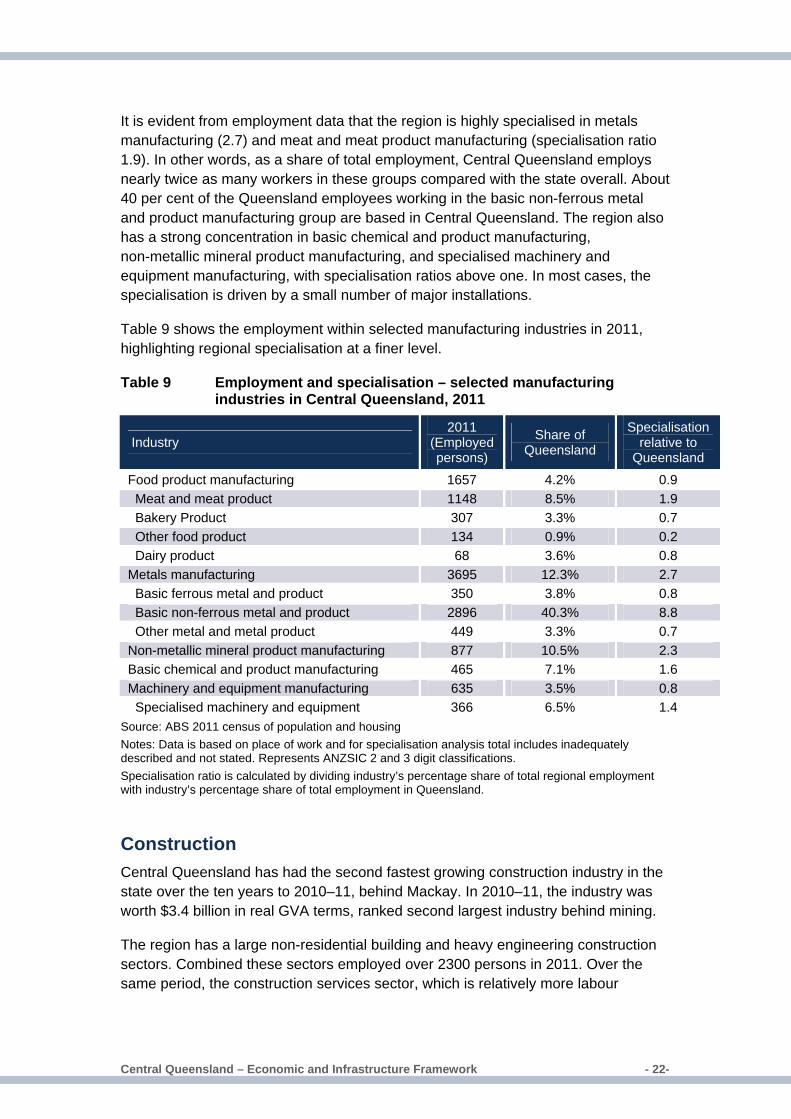
It is evident from employment data that the region is highly specialised in metals manufacturing (2.7) and meat and meat product manufacturing (specialisation ratio 1.9). In other words, as a share of total employment, Central Queensland employs nearly twice as many workers in these groups compared with the state overall. About 40 per cent of the Queensland employees working in the basic non-ferrous metal and product manufacturing group are based in Central Queensland. The region also has a strong concentration in basic chemical and product manufacturing, non-metallic mineral product manufacturing, and specialised machinery and equipment manufacturing, with specialisation ratios above one. In most cases, the specialisation is driven by a small number of major installations.
Table 9 shows the employment within selected manufacturing industries in 2011, highlighting regional specialisation at a finer level.
Table 9 Employment and specialisation – selected manufacturing industries in Central Queensland, 2011
Industry 2011
(Employed persons)
Share of Queensland
Specialisation relative to
Queensland Food product manufacturing 1657 4.2% 0.9 Meat and meat product 1148 8.5% 1.9 Bakery Product 307 3.3% 0.7 Other food product 134 0.9% 0.2 Dairy product 68 3.6% 0.8 Metals manufacturing 3695 12.3% 2.7 Basic ferrous metal and product 350 3.8% 0.8 Basic non-ferrous metal and product 2896 40.3% 8.8 Other metal and metal product 449 3.3% 0.7 Non-metallic mineral product manufacturing 877 10.5% 2.3 Basic chemical and product manufacturing 465 7.1% 1.6 Machinery and equipment manufacturing 635 3.5% 0.8 Specialised machinery and equipment 366 6.5% 1.4
Source: ABS 2011 census of population and housing Notes: Data is based on place of work and for specialisation analysis total includes inadequately described and not stated. Represents ANZSIC 2 and 3 digit classifications. Specialisation ratio is calculated by dividing industry’s percentage share of total regional employment with industry’s percentage share of total employment in Queensland.
Construction Central Queensland has had the second fastest growing construction industry in the state over the ten years to 2010–11, behind Mackay. In 2010–11, the industry was worth $3.4 billion in real GVA terms, ranked second largest industry behind mining.
The region has a large non-residential building and heavy engineering construction sectors. Combined these sectors employed over 2300 persons in 2011. Over the same period, the construction services sector, which is relatively more labour
Central Queensland – Economic and Infrastructure Framework � - 23-
intensive, employed around 4100 persons.5 The growth in construction industry is underpinned by increased pace of economic development in and around the region centred on resources sector.
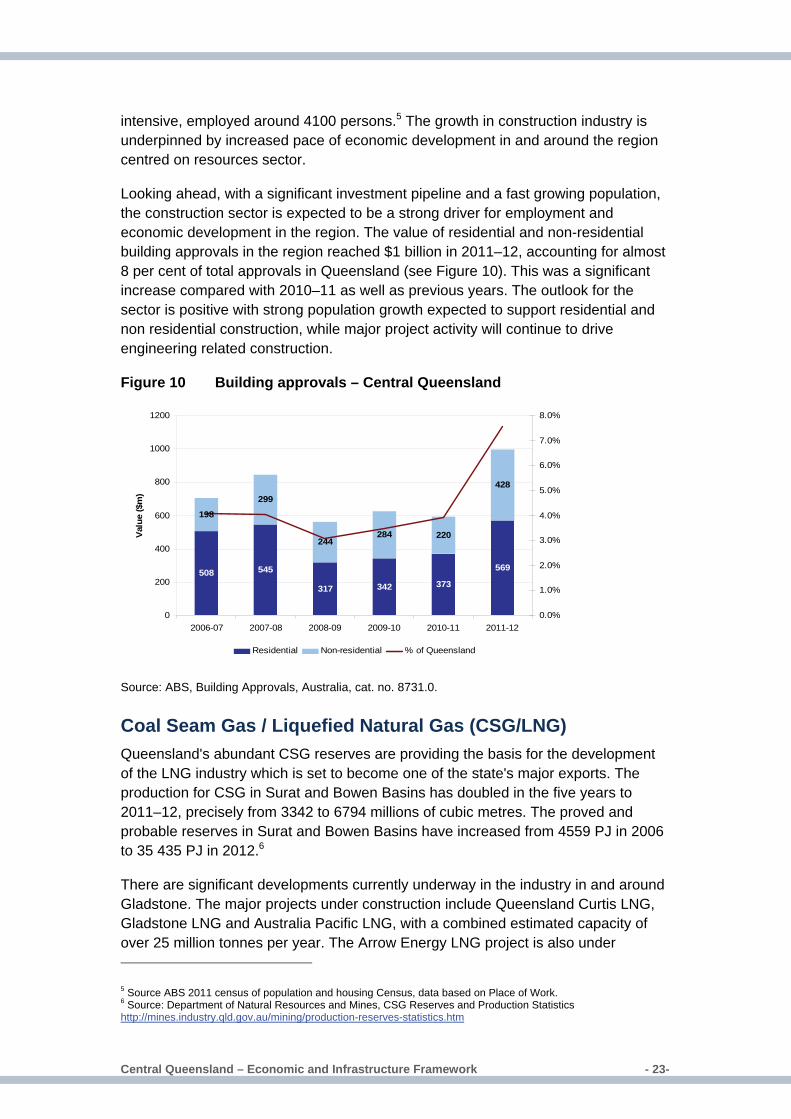
Looking ahead, with a significant investment pipeline and a fast growing population, the construction sector is expected to be a strong driver for employment and economic development in the region. The value of residential and non-residential building approvals in the region reached $1 billion in 2011–12, accounting for almost 8 per cent of total approvals in Queensland (see Figure 10). This was a significant increase compared with 2010–11 as well as previous years. The outlook for the sector is positive with strong population growth expected to support residential and non residential construction, while major project activity will continue to drive engineering related construction.
Figure 10 Building approvals – Central Queensland
508 545
317 342 373
569
198
299
244284 220
428
0
200
400
600
800
1000
1200
2006-07 2007-08 2008-09 2009-10 2010-11 2011-12
Val
ue ($
m)
0.0%
1.0%
2.0%
3.0%
4.0%
5.0%
6.0%
7.0%
8.0%
Residential Non-residential % of Queensland
Source: ABS, Building Approvals, Australia, cat. no. 8731.0.
Coal Seam Gas / Liquefied Natural Gas (CSG/LNG) Queensland's abundant CSG reserves are providing the basis for the development of the LNG industry which is set to become one of the state's major exports. The production for CSG in Surat and Bowen Basins has doubled in the five years to 2011–12, precisely from 3342 to 6794 millions of cubic metres. The proved and probable reserves in Surat and Bowen Basins have increased from 4559 PJ in 2006 to 35 435 PJ in 2012.6
There are significant developments currently underway in the industry in and around Gladstone. The major projects under construction include Queensland Curtis LNG, Gladstone LNG and Australia Pacific LNG, with a combined estimated capacity of over 25 million tonnes per year. The Arrow Energy LNG project is also under 5 Source ABS 2011 census of population and housing Census, data based on Place of Work. 6 Source: Department of Natural Resources and Mines, CSG Reserves and Production Statistics http://mines.industry.qld.gov.au/mining/production-reserves-statistics.htm
Central Queensland – Economic and Infrastructure Framework � - 24-
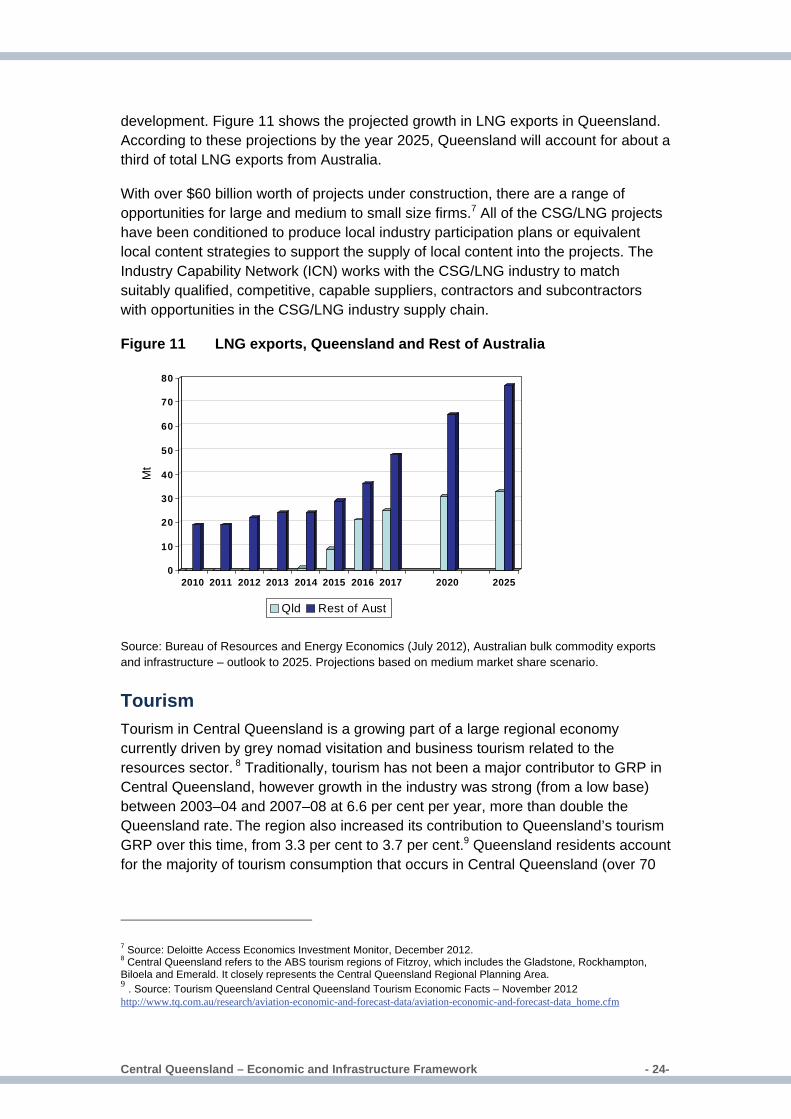
development. Figure 11 shows the projected growth in LNG exports in Queensland. According to these projections by the year 2025, Queensland will account for about a third of total LNG exports from Australia.
With over $60 billion worth of projects under construction, there are a range of opportunities for large and medium to small size firms.7 All of the CSG/LNG projects have been conditioned to produce local industry participation plans or equivalent local content strategies to support the supply of local content into the projects. The Industry Capability Network (ICN) works with the CSG/LNG industry to match suitably qualified, competitive, capable suppliers, contractors and subcontractors with opportunities in the CSG/LNG industry supply chain.
Figure 11 LNG exports, Queensland and Rest of Australia
0
10
20
30
40
50
60
70
80
Mt
2010 2011 2012 2013 2014 2015 2016 2017 2020 2025
Qld Rest of Aust
Source: Bureau of Resources and Energy Economics (July 2012), Australian bulk commodity exports and infrastructure – outlook to 2025. Projections based on medium market share scenario.
Tourism Tourism in Central Queensland is a growing part of a large regional economy currently driven by grey nomad visitation and business tourism related to the resources sector. 8 Traditionally, tourism has not been a major contributor to GRP in Central Queensland, however growth in the industry was strong (from a low base) between 2003–04 and 2007–08 at 6.6 per cent per year, more than double the Queensland rate. The region also increased its contribution to Queensland’s tourism GRP over this time, from 3.3 per cent to 3.7 per cent.9 Queensland residents account for the majority of tourism consumption that occurs in Central Queensland (over 70
7 Source: Deloitte Access Economics Investment Monitor, December 2012. 8 Central Queensland refers to the ABS tourism regions of Fitzroy, which includes the Gladstone, Rockhampton, Biloela and Emerald. It closely represents the Central Queensland Regional Planning Area. 9 . Source: Tourism Queensland Central Queensland Tourism Economic Facts – November 2012 http://www.tq.com.au/research/aviation-economic-and-forecast-data/aviation-economic-and-forecast-data_home.cfm

Central Queensland – Economic and Infrastructure Framework � - 25-
per cent). A comparatively minor share of consumption is sourced from international and interstate visitors, compared with the Queensland average.
In 2011–12, the Central Queensland region had over 3.3 million international and domestic overnight visitors as well as day visitors. Figure 12 shows trends in domestic and international visitors in the region. There has been a notable fall in the number of international visitors in the past two financial years. On a positive note, the number of domestic visitors continues to trend upwards, increasing by 12 per cent over the year to 2011–12. In the year ending June 2012, total domestic and international overnight visitor spending was nearly $800 million.10
Looking ahead, the expansion of the resources sector and tourism initiatives such as the drive tourism strategy are likely to be key drivers of growth in visitors to the region as the international market gradually recovers over time.
Figure 12 Total visitors to Central Queensland tourism region
0
500
1,000
1,500
2,000
2,500
2001–02 2002–03 2003–04 2004–05 2005–06 2006–07 2007–08 2008–09 2009–10 2010–11 2011–12
Dom
estic Visitor
s ('0
00)
0
20
40
60
80
100
120
140
Inte
rnat
iona
l Vis
itors
('00
0)
Domestic Visitors (LHS) Domestic Day Visitors (LHS) International Visitors (RHS)
Source: Queensland Treasury and Trade (Government Statistician) based on Tourism Research Australia 2011 data.
Military training The Shoalwater Bay Training Area (SWBTA) is situated on the Capricorn Coast, approximately 170 Km north of Rockhampton. The SWBTA, which covers around 454 000 hectares, is of significant strategic importance to the Australian Defence Force (ADF) as it is the only location on the east coast of Australia where large-scale joint and combined exercises can be conducted. The training area is managed by the Australian Army from a base in Rockhampton but is also used by the Royal Australian Navy and Air Force as well as foreign (particularly Singaporean and US) forces. No prospective alternative training area that provides all the advantages of SWBTA has been identified for development within Australia.11 Rockhampton’s
10 Source: Tourism Research Australia, National Visitor Survey and International Visitor Survey. Expenditure figure, excludes day visitor expenditure. 11 Source: http://www.airport.rockhampton.qld.gov.au/common/pages/display/showarticle.aspx?id=13610).
Central Queensland – Economic and Infrastructure Framework � - 26-
heavy lift capacity (e.g. Antonov aircraft) supports both occasional specialist freight and military exercise deployment and logistics.
The SWBTA provides a regular economic stimulus to the region through its use of the Rockhampton Airport and the Port of Gladstone and purchase of goods and services including fuel, accommodation, catering and food operators and hire companies. ADF expenditure within the region was estimated to be approximately $24.7 million per year and the US Defence Force expenditure provides an additional $5.8 million.12
12 Source: Australian Defence Force Posture Review, March 2012, Australian Government http://www.defence.gov.au/oscdf/adf-posture-review/docs/final/Report.pdf

Central Queensland – Economic and Infrastructure Framework � - 27-
4. Infrastructure baseline The Central Queensland region has strong transport linkages, both internally and with surrounding regions. These provide access routes for people and for goods, including food, as well as travel between mines and major centres, particularly freight transport accessing markets, and the inwards logistics of the resources sector.
As the region has a strong coal sector, the region’s electricity is mostly generated by a number of coal-fired power stations. The largest of these is near Gladstone, with the second largest near Rockhampton. Three other large power stations, Callide A, B and C are located at a site near Biloela.
The infrastructure supplying water for urban, industrial, mining and agricultural uses comes primarily from six water supply schemes in the region. Most of the water infrastructure associated with these water supply schemes is owned and operated by SunWater.
Telecommunications infrastructure in the region plays an integral role within modern businesses enabling access to the internet, real time communication between companies and also innovative use of technology like telemetry.
Challenges summary Significant challenges for the region are presented by the infrastructure requirements of growing industry sectors, and impacts of resource activities.
There is growing demand on transport infrastructure that supports freight movement through the region particularly as a result of the surrounding coal basins.
The condition, reliability and flood resilience of the networks, the growing impact of non-resident workforce movements and traffic in the coastal strip.
Maintaining reliable water supplies for communities and the agriculture sector through continuing resources sector growth.
Power generation and transmission to meet future demand growth with consideration of proposed resource projects and energy efficiency.
Growing and fluctuating non-resident workforces across the region are putting pressure on community infrastructure which is impacting local communities.
Lack of certainty surrounding broadband access and an increasing demand for telecommunications infrastructure in the region as businesses innovate through the use of technology.

Central Queensland – Economic and Infrastructure Framework � - 28-
Key infrastructure Transport The Central Queensland region has a number of strong transport linkages, both internally and with surrounding regions. Figure 13 highlights some of the region’s key transport infrastructure.
Figure 13 Map of the regions key transport infrastructure
Road The strategic road network in Central Queensland is well-connected and a key facilitator for economic development. Unlike commodity exports, mining inputs (such as fuel, mining equipment, workers etc) are transported predominantly by road and come from across Queensland and Australia. Furthermore, major roads in the coastal strip accommodate significant commuter, business and tourist traffic, particularly around the major towns of Rockhampton and Gladstone.
Primary north-south road corridors in Central Queensland are the Bruce Highway (A1), Burnett Highway (A3), Fitzroy Developmental Road, Leichhardt Highway (A5), and Carnarvon Highway (part of the Great Inland Way tourist drive). Key east-west road corridors are the Capricorn Highway (A4) and Dawson Highway. The majority of the roads in this strategic network are sealed, with two lanes.
Central Queensland – Economic and Infrastructure Framework � - 29-
Traffic volumes range in magnitude from over 10 000 vehicles per day around the major towns of Rockhampton and Gladstone, to less than 2500 vehicles per day on rural highways further west.
Traffic conditions There is concern over traffic conditions in terms of speed and travel time, freedom to manoeuvre, traffic interruptions, comfort and convenience and safety around Rockhampton and Gladstone. Specific areas of particular concern include:
the Bruce Highway immediately north and immediately south of the Rockhampton CBD
sections of the Rockhampton/Emu Park Rd and Rockhampton/Yeppoon Rd
some sections of the Burnett Highway north of Biloela
Gladstone-Mount Larcom Road north of Gladstone CBD
the Dawson highway within Gladstone city limits; and
sections of the Gladstone-Benaraby Rd.
Road infrastructure The region’s growing economies have seen greater average daily traffic volumes. Key challenges with regard to road infrastructure are:
Poor ride quality on the Burnett Highway around Mount Morgan and Biloela, the Dawson Highway around Biloela and Moura, and the Bruce Highway around Marlborough in the north of the region.
A large number of bridges in the region are considered to be in poor or very poor condition. In determining future planning priorities, consideration for bridge upgrades must be made to ensure bridges continue to be fit for purpose, particularly bridges on main freight routes.
West of Emerald the road network and bridges are constructed with a narrow formation width which is unsuitable to facilitate traffic growth by Galilee Basin mining activities.
Growing heavy vehicle traffic contributes to increasing challenges related to road construction, maintenance and safety.
Flooding is significantly impacting road assets and thus the safety and reliability of the road network. In particular, flooding constraints in Emerald, coupled with rapid urban growth, are creating access challenges for both freight and passengers within and through the town.
Road transport demand task Heavy vehicles in Central Queensland predominantly travel on the Bruce Highway and the Capricorn Highway which link some of the region’s largest cities (Rockhampton, Gladstone and Emerald). Currently, the dominant outward bulk freight flows in Central Queensland are grains and cereals and meat and livestock.
Central Queensland – Economic and Infrastructure Framework � - 30-
The established mining industry in the Bowen Basin generates significant heavy vehicle traffic to transport mining inputs such as fuel, equipment and machinery. Many of these loads are over size, over mass (OSOM) movements causing safety and efficiency challenges on the road network. Furthermore, mining activities generate workforce traffic across the region. Mining workers travel long distances and have increased levels of driver fatigue.
Key road transport challenges include:
Increased necessity for heavy vehicle movements (including OSOM) to supply new and expanding mines requiring more on road support from state departments, police and industry. Moreover, heavy vehicle routes may alter over time as different projects commence and progress (e.g. move from a construction to an operational phase).
Growing conflict between private and freight services on the existing road network, including conflict between road and rail services at open level crossings.
The development of the Galilee Basin which will impact key road routes between Alpha, Clermont and Emerald connecting to the coastal activity centres of Gladstone, Rockhampton and Mackay. Transport demand will be characterised by strong growth in heavy vehicle traffic, particularly freight efficient vehicles to and from the ports.
Mining workforce traffic is likely to increase by 35 per cent in the next five years. As workforce patterns are not clear, it is difficult to estimate future demands in order to develop a proactive road policy in response to these demands, particularly between the coast and Bowen and Galilee Basin.
The haulage mining site inputs and outputs across Central Queensland has caused increased demand on road and other transport network infrastructure (i.e. rail). This demand may present in the form of local road congestion, heavy vehicle impact on road networks and the requirement for specialist infrastructure (e.g. railway lines, gas pipelines, port and loading facilities).
Population growth around Gladstone is taking place in isolation from the significant job growth to the north of Gladstone. Private vehicle use is the only viable mode and reduces the road capacity available for freight haulage and other economic road activity.
Rail There are several railway lines in Central Queensland as part of four rail systems: the Blackwater, Central West and Moura rail systems, along with the North Coast Line system. Rail lines are used to connect many of the mining districts (primarily coal) with the Port of Gladstone. The Central West and North Coast Line systems also transport bulk agriculture produce and facilitate passenger services.
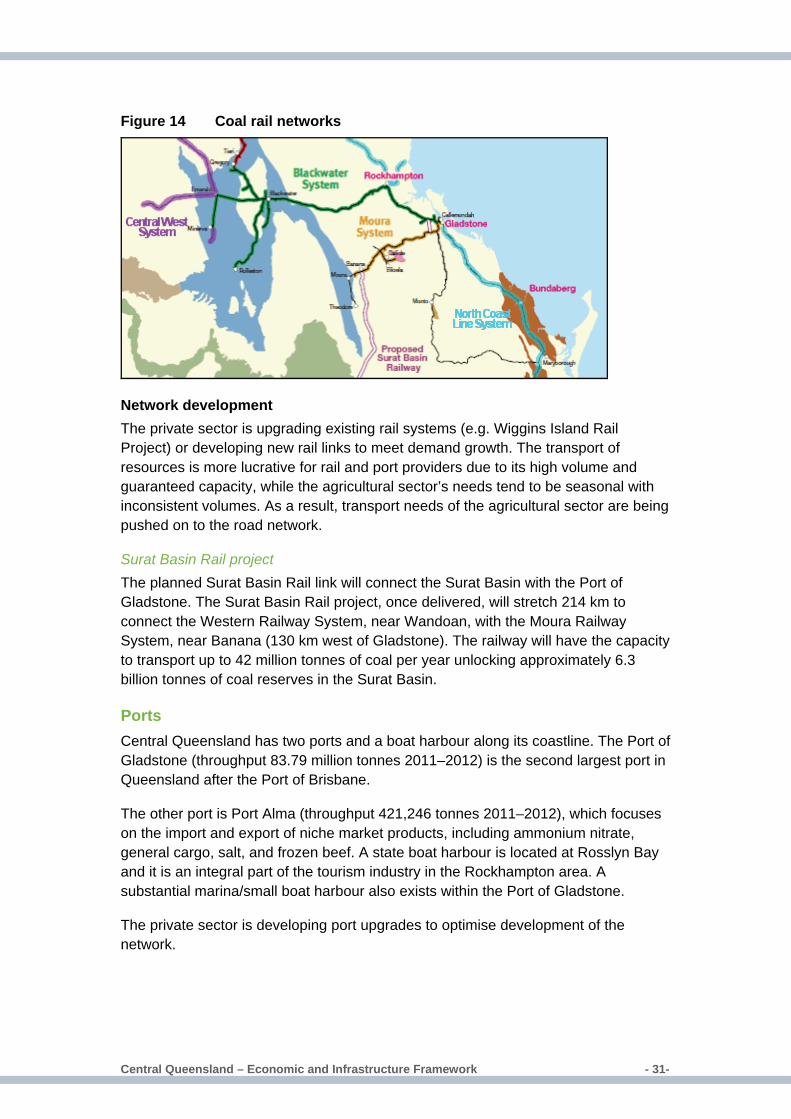
Central Queensland – Economic and Infrastructure Framework � - 31-
Figure 14 Coal rail networks
Network development The private sector is upgrading existing rail systems (e.g. Wiggins Island Rail Project) or developing new rail links to meet demand growth. The transport of resources is more lucrative for rail and port providers due to its high volume and guaranteed capacity, while the agricultural sector’s needs tend to be seasonal with inconsistent volumes. As a result, transport needs of the agricultural sector are being pushed on to the road network.
Surat Basin Rail project The planned Surat Basin Rail link will connect the Surat Basin with the Port of Gladstone. The Surat Basin Rail project, once delivered, will stretch 214 km to connect the Western Railway System, near Wandoan, with the Moura Railway System, near Banana (130 km west of Gladstone). The railway will have the capacity to transport up to 42 million tonnes of coal per year unlocking approximately 6.3 billion tonnes of coal reserves in the Surat Basin.
Ports Central Queensland has two ports and a boat harbour along its coastline. The Port of Gladstone (throughput 83.79 million tonnes 2011–2012) is the second largest port in Queensland after the Port of Brisbane.
The other port is Port Alma (throughput 421,246 tonnes 2011–2012), which focuses on the import and export of niche market products, including ammonium nitrate, general cargo, salt, and frozen beef. A state boat harbour is located at Rosslyn Bay and it is an integral part of the tourism industry in the Rockhampton area. A substantial marina/small boat harbour also exists within the Port of Gladstone.
The private sector is developing port upgrades to optimise development of the network.
Central Queensland – Economic and Infrastructure Framework � - 32-
Port challenges The Great Barrier Reef Marine Park is World Heritage Area and needs to be
protected. Therefore environmental impacts from future port development on the reef need to be minimised while supporting economic development13.
The floods of early 2011 severely affected Port of Gladstone’s coal exports due to rail network damage, with some 13 million tonnes of export being lost in the second half of the financial year.
Port development
Wiggins Island Coal Export Terminal (WICET) project The Wiggins Island Coal Export Terminal (WICET) project involves the construction of a new coal export terminal at Golding Point, to the west of the existing RG Tanna Coal Terminal in Gladstone Harbour. WICET will effectively double coal export capacity at the Port of Gladstone to meet growing demand. The coal export terminal is currently under construction. There are also other coal export terminals proposed in the lower Fitzroy (Balaclava Island) and Raglan Creek (Fitzroy Terminal Project).
Aviation Central Queensland has two large airports located in Rockhampton and Gladstone and several smaller airports and local airstrips, making a total of 15 airports of regional significance. The airports serve business, social and tourism travel as well as FIFO workers for the resources industry. Airstrips in rural areas cater for essential community services and the Royal Flying Doctor Service.
Rockhampton Airport provides flights to Queensland destinations as well as some interstate and has heavy lift capabilities. Gladstone Airport offers flights to Queensland destinations only. Emerald Airport has substantial FIFO capacity for the workforce supporting the surrounding mining industry.
Airport challenges Flooding resulting from extreme weather events has previously affected the
Rockhampton Airport and smaller regional airstrips, making them unusable for varying periods of up to several weeks.
The urban development in Gladstone is resulting in encroachment on the airport, creating operating constraints.
Significant growth in FIFO movements is expected through mining development in the basins, in particular to the remotely located Galilee Basin.
13 Great Barrier Reef Ports Strategy (2012), Queensland Government, Department of State Development, Infrastructure and Planning
Central Queensland – Economic and Infrastructure Framework � - 33-
Airport development The Central Queensland region is experiencing unprecedented demand for aviation services from the energy and resources sector, including airport upgrades or new (on-site) airstrips.
Numerous existing airstrips throughout the region assist with the servicing of regional, agricultural and mining communities. The Regional Airport Development Scheme (RADS) has been developed to assist local governments to upgrade airports in rural and remote areas of Queensland.
Challenges summary The region’s transport challenges relate to the growing freight demand and the condition and reliability of the networks. They also related to the affects of growing non-resident workforce movements and traffic in the coastal strip, and also the networks resilience during floods.
Sections of the road network require extensive maintenance works and upgrades to accommodate additional traffic loads, in particular heavy vehicle movements. The cumulative impacts of new and expanding resource projects will put increasing pressure on major road links, causing heavy vehicle and workforce traffic safety and efficiency challenges.
Urban and industrial development along the coastal strip is causing capacity and safety challenges on the main corridor, the Bruce Highway, in particular around Gladstone and Rockhampton. Urban development around Gladstone Airport is constraining its capacity.
The environmental impacts of port development on the protected Great Barrier Reef World Heritage Area needs to be minimised.
Major flooding is causing damage and long closures of infrastructure assets across the region including roads, airports, and seaports.
The planned Surat Basin Rail link is needed to unlock the Surat Basin coal reserves by providing a connection through to the Port of Gladstone.
Due to strong growth of the resource sector on rail systems in Central Queensland, rail transport demand of the agricultural sector is being pushed on to the road network.
The resource sector growth will result in an increase in FIFO workers and several airport upgrades and new (on-site) airstrips to access mining projects are proposed.

Central Queensland – Economic and Infrastructure Framework � - 34-
Electricity
Electricity infrastructure
Power generation Queensland had a projected generating capacity of 12 209 megawatts for summer 2012–13, with the Central Queensland region providing approximately 41 per cent of this. Major electricity generators in the region can be found in Callide, Gladstone, Stanwell and Yarwun.
High voltage transmission grid The high voltage transmission grid in Central Queensland is key infrastructure relating to electricity generation. The high voltage transmission grid is owned and operated by Powerlink Queensland. The distribution network (owned by Ergon Energy Corporation Limited and ENERGEX Limited) connects customers to the transmission network and energy generators.
Figure 15 Map of the region’s key energy infrastructure
The high voltage transmission grid is characterised by two major 275 kilovolts transmission backbones that run north-south through the region. These two backbones are part of the main transmission grid for the eastern coast of Queensland and, together with the 132 kilovolts transmission lines in the region, connect key locations around the resource basins and regional centres.
Central Queensland – Economic and Infrastructure Framework � - 35-
Powerlink has a number of proposed transmission projects in varying stages of progress to connect large customers, meet the growing demand from the resources sector and cater for emerging growth.
Queensland is also part of the National Electricity Market (NEM), which is a wholesale electricity market operating on the interconnected power system between Queensland, New South Wales, South Australia, ACT and Victoria.
Electricity demand The region’s electricity requirements are escalating due to population growth, industrial and mining/resource development, agricultural expansion and economic growth. Added pressure is occurring from changing consumer practices, such as the use of air conditioners and other high energy use items.
Development in the resource and industrial sectors over the next five years is expected to cause a 4.4 per cent per year increase in electricity demand in the Central and North Queensland region, which includes Gladstone and Rockhampton. Long-term planning is required to meet the future energy needs of the population and industry to facilitate economic growth.
Energy efficiency and electricity prices It is important that the region supports growth by increasing energy efficiency per capita. There are a number of energy efficiency programs currently in place with the focus on easing the upward pressure on electricity prices by slowing the current growth in electricity use and peak demand, for instance Queensland Energy Management Plan (QEMP).
The efficient use of energy can help avoid the equivalent of 1000 megawatts of necessary electricity generation and network infrastructure upgrades which will save substantial infrastructure investment. It will also assist Queensland households, businesses and industries respond to the energy challenges of the future through energy efficiency, energy conservation and peak demand management.
Challenges summary Power generation and transmission in the region faces challenges to meet future demand growth with consideration of proposed resource projects, neighbouring regions and energy efficiency.
Strong electricity demand is expected from the expanding resource sector in the Bowen and Galilee Basins in Central Queensland.
The high voltage transmission grid requires upgrades and Powerlink works with the private sector on power supply and generation projects.
Energy efficiency programs needs to reduce consumption and alleviate pressure on the electricity network.

Central Queensland – Economic and Infrastructure Framework � - 36-
Telecommunications Telecommunications infrastructure plays an integral role in a modern economy. It enables access to the internet, real time communication between businesses and also innovative use of technology such as telemetry. In a community context telecommunications infrastructure also plays a significant role in bridging physical distances for remote communities improving safety and enabling a variety of services to be delivered, including distance education, health and banking services.
The Australian Government is constitutionally responsible for telecommunications services, while the Queensland Government advocates the benefits of telecommunications infrastructure for the Queensland economy.
Network challenges Effective communication infrastructure can strengthen regional economic development by enhancing productivity. Access to mobile services and high speed internet will become increasingly important for the region as businesses innovative through the use of technology.
Network development Stakeholders have raised concerns that with the rollout of the National Broadband Network (NBN), existing commercial providers have ceased expanding the reach of their broadband internet networks. As a result some businesses have little certainty as to when they may be able to access broadband to support their growing operations.
The NBN rollout schedule for the next three years only indicates areas around Rockhampton are planned to commence. Further to this though there are some green field sites in Biloela, Emerald, Gladstone and Rockhampton which will be enabled.
Stakeholders have also raised concerns about black spots in mobile telecommunications coverage. These black spots can affect productivity and efficiency improvements made through the inability to adopt technology like telemetry. Stakeholders also cited safety concerns in emergency situations in these black spots.
Challenges summary Telecommunications infrastructure will increasingly become important for the region as businesses innovate through the use of technology, and there is a lack of certainty surrounding faster broadband availability.
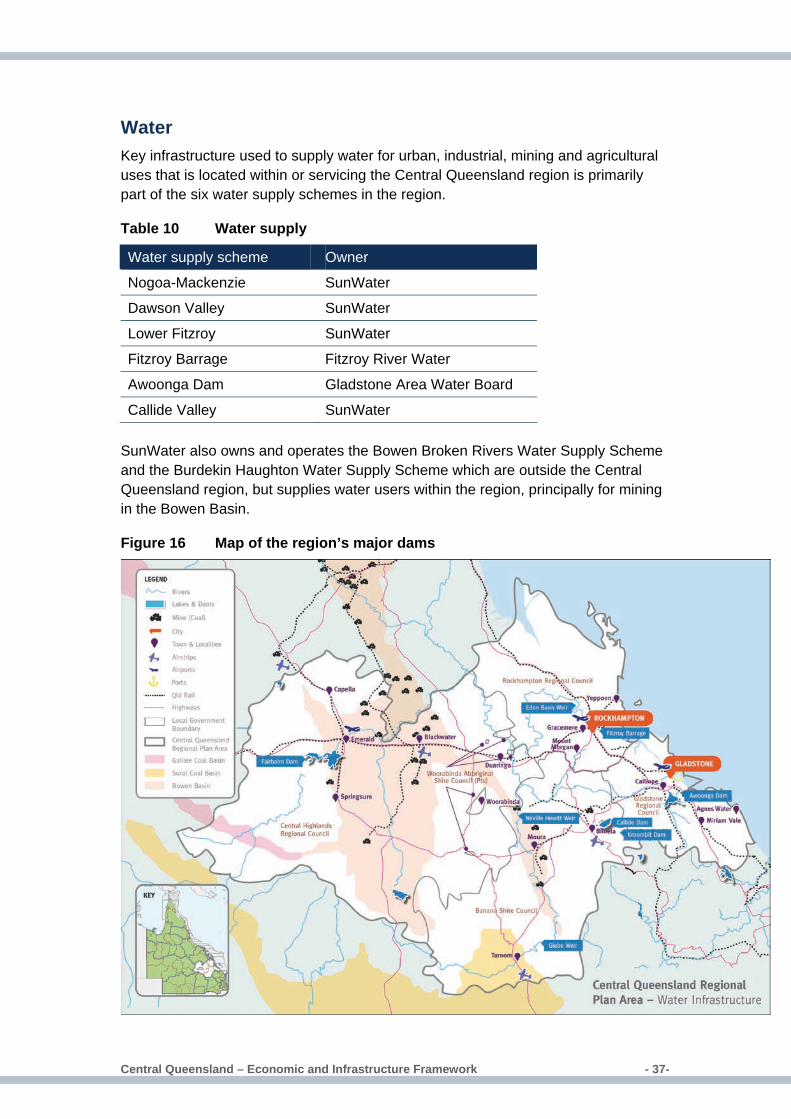
Central Queensland – Economic and Infrastructure Framework � - 37-
Water Key infrastructure used to supply water for urban, industrial, mining and agricultural uses that is located within or servicing the Central Queensland region is primarily part of the six water supply schemes in the region.
Table 10 Water supply
Water supply scheme Owner
Nogoa-Mackenzie SunWater
Dawson Valley SunWater
Lower Fitzroy SunWater
Fitzroy Barrage Fitzroy River Water
Awoonga Dam Gladstone Area Water Board
Callide Valley SunWater SunWater also owns and operates the Bowen Broken Rivers Water Supply Scheme and the Burdekin Haughton Water Supply Scheme which are outside the Central Queensland region, but supplies water users within the region, principally for mining in the Bowen Basin.
Figure 16 Map of the region’s major dams
Central Queensland – Economic and Infrastructure Framework � - 38-
Water demand Increasing water demand (and wastewater treatment) is expected due to:
Ongoing population growth, in particular the key regional centres of Gladstone and Rockhampton.
Small towns or work camps with a significant influx of workers associated with the resource industry.
Mining activities such as dust suppression and mineral washing. Cumulative demand from multiple mines may need to be transported from other catchments and potentially other regions.
Increases in agricultural production to support the Queensland government’s target of doubling of food production value by 2040 will present challenges for the quality and quantity of water supply available for irrigation purposes.
Water supply challenges Supply security risks are identified for Rockhampton, in particular due to the short duration storage characteristics of the Fitzroy River Barrage. Options are limited to provide adequate additional supplies during an emergency.
The resources sector has a higher capacity to pay for water allocations. This can lead to the reallocation of water away from agriculture to an expanding resources sector.
The impact of flooding on water supply infrastructure and the potential for in-stream infrastructure to exacerbate flooding in some areas as it necessarily disrupts the flow of water.
Challenges summary The principal challenge within the region relating to water supply concerns the security and reliability of sources for existing communities and agriculture sector, in particular in resource rich areas.
Strong growth of water is expected to be driven by population growth, mining projects and agriculture sector. There is a potential conflict for future water allocations between the mining and agriculture sectors.
Supply security risks such as the impact of flooding on water supply infrastructure and the short duration storage characteristics of the Fitzroy River Barrage are future challenges.
Community infrastructure Central Queensland has a diverse range of essential social and local infrastructure servicing the local needs and contributing to the liveability of the region’s communities. This includes education, health, emergency services, sporting, recreation and community facilities as well as, roads, energy, telecommunications and sewerage infrastructure.
Central Queensland – Economic and Infrastructure Framework � - 39-
The regional economic focus of the framework means this infrastructure baseline can not address the diverse range of social and local infrastructure that exists throughout Central Queensland.
It is important, however, to acknowledge the significance of social and local infrastructure in the region and the challenges faced by some communities in the region.
Challenges summary Growing and fluctuating non-resident workforces across the region are putting pressure on community infrastructure which is impacting liveability for local communities.
Impact of non-resident workforces on service levels and infrastructure requirements for resource towns. Moreover, residents and non-residents have different needs for services such as education.
Cumulative impact of multiple resource developments and fluctuations in non-resident workforce size complicate the determination and provision of adequate levels of infrastructure.
Central Queensland – Economic and Infrastructure Framework � - 40-
5. Economic development strategy
Vision and strategic economic themes In line with the objectives of the regional plan, the economic development strategy has been developed to propose a high level vision for future economic development and to help foster economic development opportunities.
In addition, a number of strategic economic themes were identified to unlock the economic potential of Central Queensland region:
facilitate major project development and attract investments to diversify Central Queensland’s economic base
facilitate economic development through delivering strategic infrastructure outcomes
supporting skills, education and workforce development which also contribute to the state’s unemployment target of four per cent
address resource allocation conflicts, capturing complementary land and water use opportunities, and promoting co-existence
encourage business development by helping to build capabilities along supply chains and facilitating innovation, technology and entrepreneurship
enhance regional connectivity through integrated supply chains, infrastructure networks and advances in technology.
Economic development vision
A diversified and prosperous regional economy capitalising on regional competitive strengths and opportunities in resources, agriculture and related manufacturing as well as related supply chains, tourism and services to support a growing population.
Central Queensland – Economic and Infrastructure Framework � - 41-
Economic development opportunities Mining, energy and minerals processing Resources developments will provide a major economic return for the region over the medium to long term, with coal mines of global significance in the southern section of the Bowen Basin and the neighbouring Galilee Basin. There are also ongoing exploration activities and supporting industries in the region.
To support increased production in the resources sector, the Wiggins Island Coal Export Terminal is under construction to provide increased long term export coal capacity. It is planned to commence operations in 2014. Two major port developments have been proposed for the Fitzroy delta area, including the Balaclava Island Coal Export Terminal and the Fitzroy River Coal Terminal project. The availability of large-scale industrial land, good port facilities and access to resources means Gladstone will continue to build a more diverse range of heavy industries.
Moreover, the planned CSG developments in the neighbouring Surat Basin will be processed and exported via Gladstone, which is the location of major international investment in LNG for overseas markets. Gladstone is the state’s hub for heavy industry and large-scale mineral and chemical processing.
In addition to these established industries, potential opportunities exist in oil shale, with Central Queensland containing the majority of oil shale resources of commercial interest within Australia.
Soil conditions in the region indicate potential renewable energy opportunities in the field of advanced biofuels. Advanced biofuels are liquid fuels derived from sustainable sources of organic matter that do not typically compete with food production, such as wood residues, certain oilseeds and algae.14 This opportunity in renewable energy offers scope for longer-term energy supply and economic diversification and development; however it is currently subject to the development of associated technologies.
Mining supply chain Growth in the mining, energy and minerals processing sectors will provide supply opportunities for regional firms across a wide range of industries such as construction manufacturing, food and accommodation services and business services. However, these opportunities could be limited by both the scale and capability of local firms. Therefore, it is possible that tier one project managers may retain supply chains from outside the region and Queensland more generally.
In the region, competitiveness and access to skilled labour remain critical issues, requiring complementary efforts to improve regional liveability and access to services. Emerald and Rockhampton are established service centres for mining and
14 Australian Government, Australian Renewable Energy Association, Advanced Biofuels study: Strategic Directions for Australia – Summary Report, 14 December 2011.
Central Queensland – Economic and Infrastructure Framework � - 42-
resources with scope to develop further. Smaller centres and towns such as Biloela, Moura and Taroom are also impacted by the growth in LNG and offer some prospects for local supply at lower tier levels. Existing links to components of the supply chains outside the region provide opportunities for scaling and accessing new opportunities.
Agriculture and food processing Central Queensland’s agriculture and food processing sectors can capitalise on growing global as well as domestic demand. The real value of global food demand is expected to rise by around 35 per cent by 2025 from 2007 levels, with most demand coming from Asia. China and India alone could account for almost 60 per cent of the global increase.15
Other than horticulture, the majority of the region’s agricultural production currently targets commodity markets. However with increased globalisation of consumer demand, there is a real opportunity to target higher value niche markets through enhanced production specifications and branding that can lead to more local product being consumed locally, as well as exported. Product differentiation for beef and grains is growing world-wide and can add value along the supply chain.
There is also potential for timber and wood products in the region. Timber processing facilities are located throughout Central Queensland with major processing facilities at Dingo and Theodore. Timber plantation, agro-forestry, silvopastoral (grazing and timber) production systems and downstream processing have growth prospects, particularly in Byfield and Gladstone to Bundaberg areas.
The profitability of the industry is being strongly driven across the agribusiness supply chain through adoption of the latest technology and better responding to national and international markets.
Construction A range of growth opportunities exist in the construction industry associated with strong levels of residential, non-residential and infrastructure investment derived from the burgeoning resources and energy sectors. Projected population growth in the region will also generate demand for housing as well as social infrastructure such as hospitals and schools, providing additional support for the construction industry. Local construction firms have an opportunity to expand and diversify their operations as they capitalise on rapid growth in the resources and energy sectors.
Given the construction industry tends to be quite cyclical in nature, there is some scope for those employed by the industry to move both within and between the subsectors of ‘building’ and ‘engineering’ to meet various levels of demand. However, it should be noted that some occupations are highly specialised and are therefore not as transferable to roles in other subsectors.
15 Source: Australian Government, Australia in the Asian Century White Paper, October 2012. http://asiancentury.dpmc.gov.au/white-paper
Central Queensland – Economic and Infrastructure Framework � - 43-
Tourism Tourism experiences in Central Queensland are centred around nature-based tourism, indigenous tourism, education tourism, some industrial tourism and cultural and heritage tourism. Opportunities also exist for diversification through product offerings.
The region is the gateway to the Southern Great Barrier Reef, which provides opportunities for overall industry growth and new product development. Along the coastal areas, major tourism developments such as the Great Keppel Island Redevelopment provide significant opportunities for the Capricorn Coast to position itself for increased tourism visitation into the future.
The DestinationQ conference in June 2012 also highlighted defence tourism and tourism built around the region’s heritage and mining history as potential new opportunities worth exploring. The expansion in the resources sector has also created demand for short term accommodation in the region. Opportunities exist to leverage off resources development by encouraging workers to holiday in the region.
Education and training The region has a growing knowledge-based economy, with technology and education underpinning a wide range of activities in the region. The Central Queensland University Australia (CQUni) had nearly 20 000 students enrolled for higher education in 2011. The number of students completing courses in 2011 increased from around 2900 in 2000 to 5025.16
CQUni could possibly become the first dual sector university in Queensland to offer higher education opportunities for students from vocational education through to post-doctoral studies, if the planned merger between CQUni and the Central Queensland Institute of TAFE is realised.17 This will assist in addressing future increases in regional demand for skilled and professional workers.
Support services for the defence industry Potential development in support service for the defence industry includes equipment storage areas to facilitate the use of the training area.
The Rockhampton Regional Council has developed preliminary plans for Rockhampton Airport to increase support for the Australian Defence Force (ADF) and regional defence activities by giving consideration to: increase apron areas substantially; provide new aircraft hard stand, parking and loading bays; improve aircraft security and logistics; and provide ordinance loading areas.
16 Source: Commonwealth Department of Industry, Innovation, Climate Change, Science, Research and Tertiary Education http://www.innovation.gov.au/HigherEducation/HigherEducationStatistics/StatisticsPublications/Pages/default.aspx 17 “Government Approves CQU and CQIT”, Queensland Government Media Statement 07 December 2012, http://statements.qld.gov.au/Statement/2012/12/7/government-approves-cqu-and-cqit-merger
Central Queensland – Economic and Infrastructure Framework � - 44-
Port Alma, strategically located in an isolated area, is one of only two sites on the east coast of Australia designated to enable the delivery of dangerous goods for mining and defence industries. Port Alma has been identified by the ADF as a possible site for increased explosive ordnance loading, storage and distribution to support the new amphibious capability.
Provision of industrial land There are designated areas for industrial development in the region, which provide room for expansion of other industries such as manufacturing and related services. For example, the Gladstone State Development Area (GSDA) covers 28 000 hectares and is serviced with transport infrastructure including main roads, rail links and a Materials Transportation and Services Corridor that connects GSDA to port facilities.
The Gracemere Stanwell Corridor is also an area designated for industrial development, with initial focus on industries servicing the resources sector. The Gracemere Industrial Area within the Corridor is now attracting investment interest from a range of sectors.
In addition corridors to provide significant supporting infrastructure are:
The Stanwell to Gladstone Infrastructure Corridor State Development Area that was declared in 2008 to house underground pipelines. It is approximately 90 km long and 100 metres wide. The corridor can accommodate up to seven pipelines.
The Callide Infrastructure Corridor State Development Area that is approximately 44 km long and 200 metres wide. The corridor is primarily designed to transport CSG to LNG plants on Curtis Island.
Transport and logistics Existing transport infrastructure together with established transport industries represents a competitive advantage and opportunity for the region.
Transport and logistics is an enabler for the majority of the economic sectors in Central Queensland. There are currently a number of transport companies based in Central Queensland that provide services to the various industry sectors. Industry expansion or diversification will provide further opportunities for growth and investment in transport and logistics.
The existing transport and logistics sector has created a skilled and mobile workforce, which is particularly important in changing economic conditions.
Desired outcomes, strategies and actions To add value to the major economic development opportunities that have been identified, Table 11 has been populated in consultation with state government agencies and stakeholders involved in the regional planning process. The actions
Central Queensland – Economic and Infrastructure Framework � - 45-
contained within this table represent identified activities that will help capitalise on the region’s economic development opportunities. It is important to note that this is not an action plan for Government, rather a direction for regional stakeholders to progress economic growth in the region. For this reason the table does not identify timeframes or responsible parties.
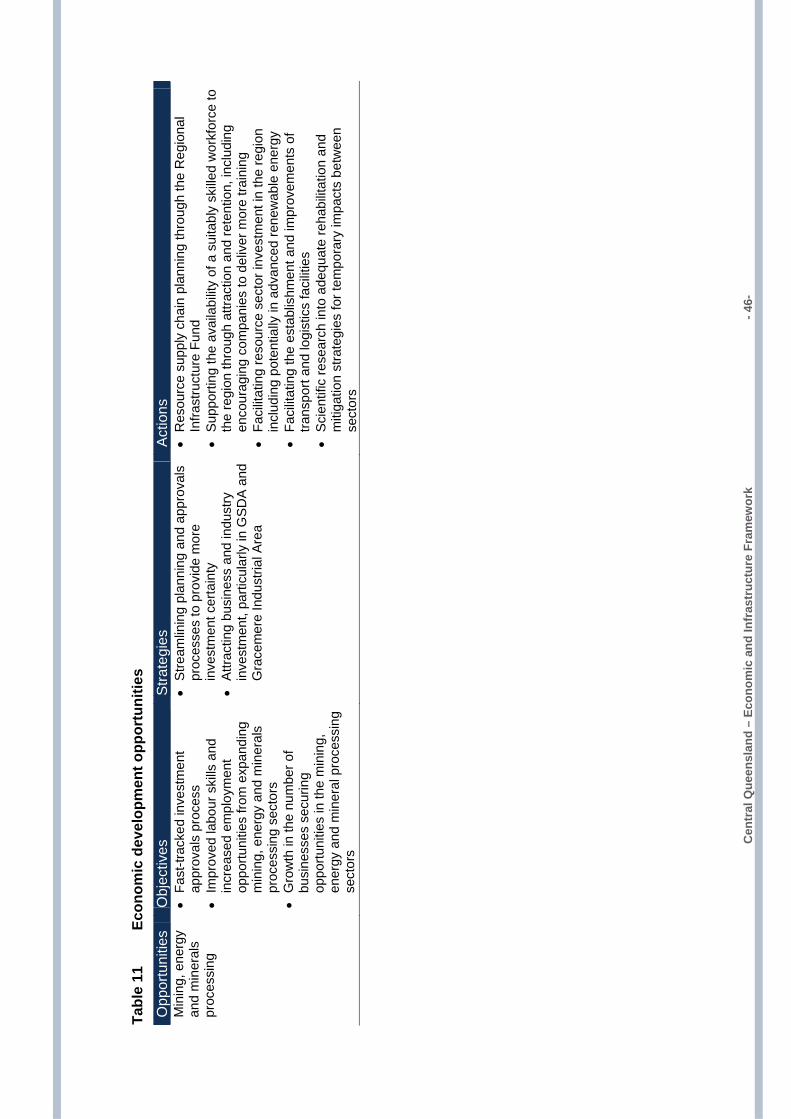
Cen
tral
Que
ensl
and
– Ec
onom
ic a
nd In
fras
truc
ture
Fra
mew
ork
�
- 46-
Tabl
e 11
Ec
onom
ic d
evel
opm
ent o
ppor
tuni
ties
O
ppor
tuni
ties
Obj
ectiv
es
Stra
tegi
es
Act
ions
M
inin
g, e
nerg
y an
d m
iner
als
proc
essi
ng
• Fa
st-tr
acke
d in
vest
men
t ap
prov
als
proc
ess
•
Impr
oved
labo
ur s
kills
and
in
crea
sed
empl
oym
ent
oppo
rtuni
ties
from
exp
andi
ng
min
ing,
ene
rgy
and
min
eral
s pr
oces
sing
sec
tors
•
Gro
wth
in th
e nu
mbe
r of
busi
ness
es s
ecur
ing
oppo
rtuni
ties
in th
e m
inin
g,
ener
gy a
nd m
iner
al p
roce
ssin
g se
ctor
s
• S
tream
linin
g pl
anni
ng a
nd a
ppro
vals
pr
oces
ses
to p
rovi
de m
ore
inve
stm
ent c
erta
inty
•
Attr
actin
g bu
sine
ss a
nd in
dust
ry
inve
stm
ent,
parti
cula
rly in
GS
DA
and
G
race
mer
e In
dust
rial A
rea
• R
esou
rce
supp
ly c
hain
pla
nnin
g th
roug
h th
e R
egio
nal
Infra
stru
ctur
e Fu
nd
• S
uppo
rting
the
avai
labi
lity
of a
sui
tabl
y sk
illed
wor
kfor
ce to
th
e re
gion
thro
ugh
attra
ctio
n an
d re
tent
ion,
incl
udin
g en
cour
agin
g co
mpa
nies
to d
eliv
er m
ore
train
ing
•
Faci
litat
ing
reso
urce
sec
tor i
nves
tmen
t in
the
regi
on
incl
udin
g po
tent
ially
in a
dvan
ced
rene
wab
le e
nerg
y •
Faci
litat
ing
the
esta
blis
hmen
t and
impr
ovem
ents
of
trans
port
and
logi
stic
s fa
cilit
ies
•
Sci
entif
ic re
sear
ch in
to a
dequ
ate
reha
bilit
atio
n an
d m
itiga
tion
stra
tegi
es fo
r tem
pora
ry im
pact
s be
twee
n se
ctor
s
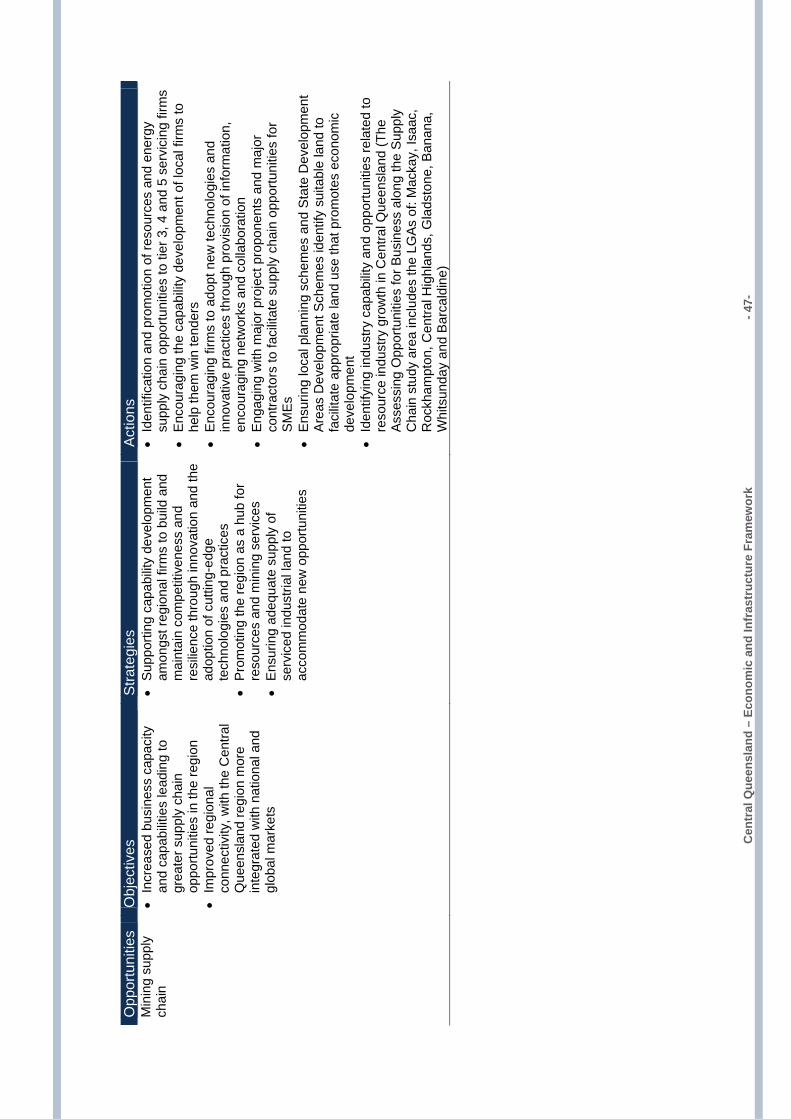
Cen
tral
Que
ensl
and
– Ec
onom
ic a
nd In
fras
truc
ture
Fra
mew
ork
�
- 47-
Opp
ortu
nitie
s O
bjec
tives
S
trate
gies
A
ctio
ns
Min
ing
supp
ly
chai
n
• In
crea
sed
busi
ness
cap
acity
an
d ca
pabi
litie
s le
adin
g to
gr
eate
r sup
ply
chai
n op
portu
nitie
s in
the
regi
on
• Im
prov
ed re
gion
al
conn
ectiv
ity, w
ith th
e C
entra
l Q
ueen
slan
d re
gion
mor
e in
tegr
ated
with
nat
iona
l and
gl
obal
mar
kets
• S
uppo
rting
cap
abilit
y de
velo
pmen
t am
ongs
t reg
iona
l firm
s to
bui
ld a
nd
mai
ntai
n co
mpe
titiv
enes
s an
d re
silie
nce
thro
ugh
inno
vatio
n an
d th
e ad
optio
n of
cut
ting-
edge
te
chno
logi
es a
nd p
ract
ices
•
Pro
mot
ing
the
regi
on a
s a
hub
for
reso
urce
s an
d m
inin
g se
rvic
es
• E
nsur
ing
adeq
uate
sup
ply
of
serv
iced
indu
stria
l lan
d to
ac
com
mod
ate
new
opp
ortu
nitie
s
• Id
entif
icat
ion
and
prom
otio
n of
reso
urce
s an
d en
ergy
su
pply
cha
in o
ppor
tuni
ties
to ti
er 3
, 4 a
nd 5
ser
vici
ng fi
rms
• E
ncou
ragi
ng th
e ca
pabi
lity
deve
lopm
ent o
f loc
al fi
rms
to
help
them
win
tend
ers
•
Enc
oura
ging
firm
s to
ado
pt n
ew te
chno
logi
es a
nd
inno
vativ
e pr
actic
es th
roug
h pr
ovis
ion
of in
form
atio
n,
enco
urag
ing
netw
orks
and
col
labo
ratio
n
• E
ngag
ing
with
maj
or p
roje
ct p
ropo
nent
s an
d m
ajor
co
ntra
ctor
s to
faci
litat
e su
pply
cha
in o
ppor
tuni
ties
for
SMEs
•
Ens
urin
g lo
cal p
lann
ing
sche
mes
and
Sta
te D
evel
opm
ent
Are
as D
evel
opm
ent S
chem
es id
entif
y su
itabl
e la
nd to
fa
cilit
ate
appr
opria
te la
nd u
se th
at p
rom
otes
eco
nom
ic
deve
lopm
ent
• Id
entif
ying
indu
stry
cap
abilit
y an
d op
portu
nitie
s re
late
d to
re
sour
ce in
dust
ry g
row
th in
Cen
tral Q
ueen
slan
d (T
he
Ass
essi
ng O
ppor
tuni
ties
for B
usin
ess
alon
g th
e S
uppl
y C
hain
stu
dy a
rea
incl
udes
the
LGAs
of:
Mac
kay,
Isaa
c,
Roc
kham
pton
, Cen
tral H
ighl
ands
, Gla
dsto
ne, B
anan
a,
Whi
tsun
day
and
Bar
cald
ine)
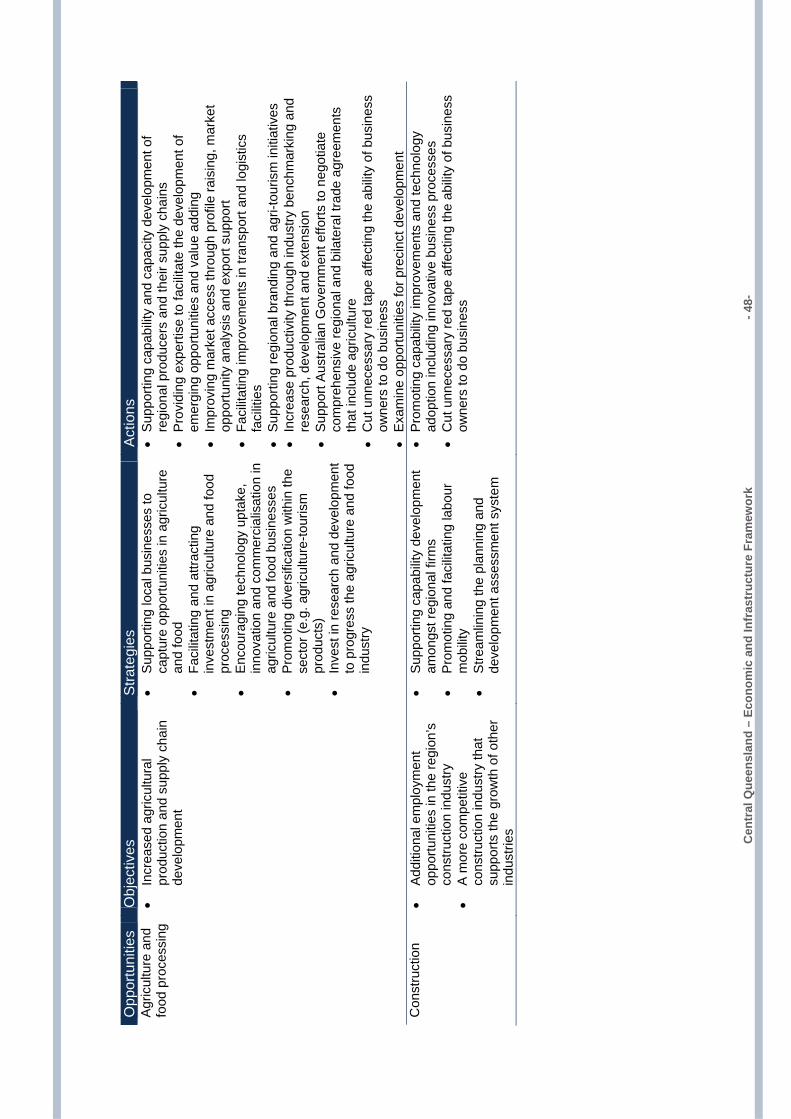
Cen
tral
Que
ensl
and
– Ec
onom
ic a
nd In
fras
truc
ture
Fra
mew
ork
�
- 48-
Opp
ortu
nitie
s O
bjec
tives
S
trate
gies
A
ctio
ns
Agr
icul
ture
and
fo
od p
roce
ssin
g •
Incr
ease
d ag
ricul
tura
l pr
oduc
tion
and
supp
ly c
hain
de
velo
pmen
t
• S
uppo
rting
loca
l bus
ines
ses
to
capt
ure
oppo
rtuni
ties
in a
gric
ultu
re
and
food
•
Faci
litat
ing
and
attra
ctin
g in
vest
men
t in
agric
ultu
re a
nd fo
od
proc
essi
ng
• En
cour
agin
g te
chno
logy
upt
ake,
in
nova
tion
and
com
mer
cial
isat
ion
in
agric
ultu
re a
nd fo
od b
usin
esse
s •
Pro
mot
ing
dive
rsifi
catio
n w
ithin
the
sect
or (e
.g. a
gric
ultu
re-to
uris
m
prod
ucts
) •
Inve
st in
rese
arch
and
dev
elop
men
t to
pro
gres
s th
e ag
ricul
ture
and
food
in
dust
ry
• S
uppo
rting
cap
abilit
y an
d ca
paci
ty d
evel
opm
ent o
f re
gion
al p
rodu
cers
and
thei
r sup
ply
chai
ns
• P
rovi
ding
exp
ertis
e to
faci
litat
e th
e de
velo
pmen
t of
emer
ging
opp
ortu
nitie
s an
d va
lue
addi
ng
• Im
prov
ing
mar
ket a
cces
s th
roug
h pr
ofile
rais
ing,
mar
ket
oppo
rtuni
ty a
naly
sis
and
expo
rt su
ppor
t •
Faci
litat
ing
impr
ovem
ents
in tr
ansp
ort a
nd lo
gist
ics
faci
litie
s •
Sup
porti
ng re
gion
al b
rand
ing
and
agri-
tour
ism
initi
ativ
es
• In
crea
se p
rodu
ctiv
ity th
roug
h in
dust
ry b
ench
mar
king
and
re
sear
ch, d
evel
opm
ent a
nd e
xten
sion
•
Sup
port
Aus
tralia
n G
over
nmen
t effo
rts to
neg
otia
te
com
preh
ensi
ve re
gion
al a
nd b
ilate
ral t
rade
agr
eem
ents
th
at in
clud
e ag
ricul
ture
•
Cut
unn
eces
sary
red
tape
affe
ctin
g th
e ab
ility
of b
usin
ess
owne
rs to
do
busi
ness
•
Exa
min
e op
portu
nitie
s fo
r pre
cinc
t dev
elop
men
t
Con
stru
ctio
n
• A
dditi
onal
em
ploy
men
t op
portu
nitie
s in
the
regi
on’s
co
nstru
ctio
n in
dust
ry
• A
mor
e co
mpe
titiv
e co
nstru
ctio
n in
dust
ry th
at
supp
orts
the
grow
th o
f oth
er
indu
strie
s
• S
uppo
rting
cap
abilit
y de
velo
pmen
t am
ongs
t reg
iona
l firm
s
• P
rom
otin
g an
d fa
cilit
atin
g la
bour
m
obilit
y
• S
tream
linin
g th
e pl
anni
ng a
nd
deve
lopm
ent a
sses
smen
t sys
tem
• P
rom
otin
g ca
pabi
lity
impr
ovem
ents
and
tech
nolo
gy
adop
tion
incl
udin
g in
nova
tive
busi
ness
pro
cess
es
• C
ut u
nnec
essa
ry re
d ta
pe a
ffect
ing
the
abilit
y of
bus
ines
s ow
ners
to d
o bu
sine
ss
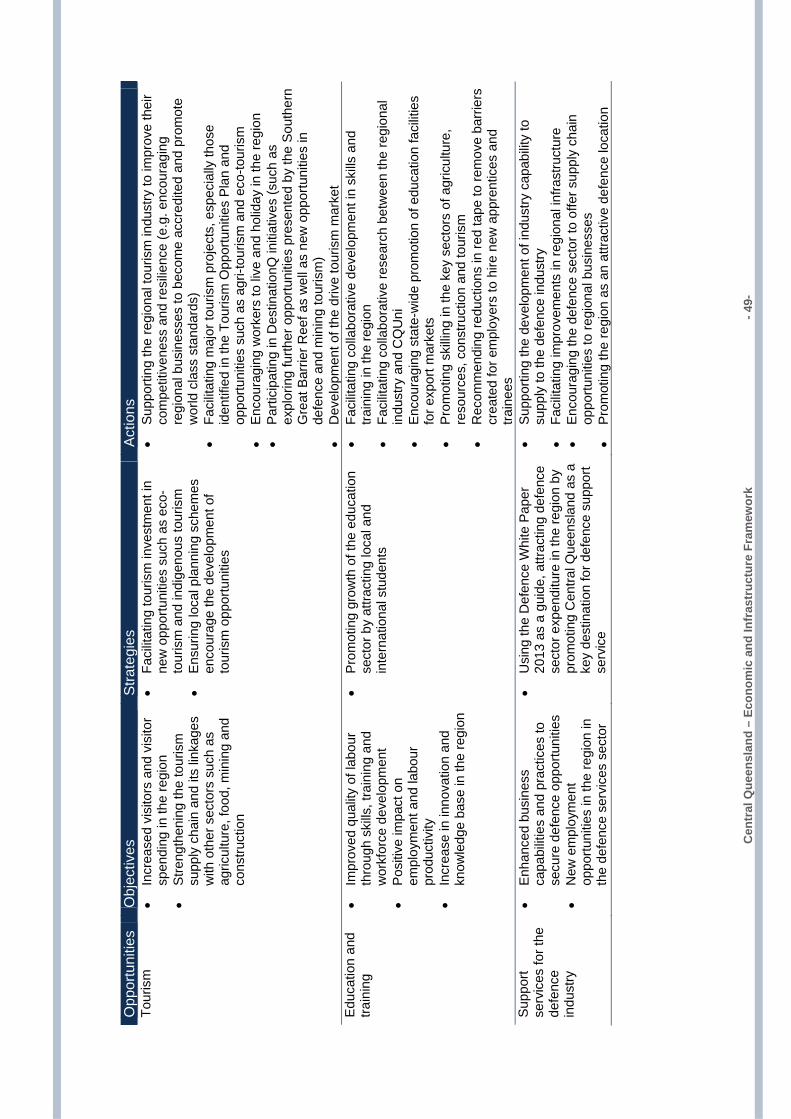
Cen
tral
Que
ensl
and
– Ec
onom
ic a
nd In
fras
truc
ture
Fra
mew
ork
�
- 49-
Opp
ortu
nitie
s O
bjec
tives
S
trate
gies
A
ctio
ns
Tour
ism
•
Incr
ease
d vi
sito
rs a
nd v
isito
r sp
endi
ng in
the
regi
on
• S
treng
then
ing
the
tour
ism
su
pply
cha
in a
nd it
s lin
kage
s w
ith o
ther
sec
tors
suc
h as
ag
ricul
ture
, foo
d, m
inin
g an
d co
nstru
ctio
n
• Fa
cilit
atin
g to
uris
m in
vest
men
t in
new
opp
ortu
nitie
s su
ch a
s ec
o-to
uris
m a
nd in
dige
nous
tour
ism
•
Ens
urin
g lo
cal p
lann
ing
sche
mes
en
cour
age
the
deve
lopm
ent o
f to
uris
m o
ppor
tuni
ties
• S
uppo
rting
the
regi
onal
tour
ism
indu
stry
to im
prov
e th
eir
com
petit
iven
ess
and
resi
lienc
e (e
.g. e
ncou
ragi
ng
regi
onal
bus
ines
ses
to b
ecom
e ac
cred
ited
and
prom
ote
wor
ld c
lass
sta
ndar
ds)
•
Faci
litat
ing
maj
or to
uris
m p
roje
cts,
esp
ecia
lly th
ose
iden
tifie
d in
the
Tour
ism
Opp
ortu
nitie
s Pl
an a
nd
oppo
rtuni
ties
such
as
agri-
tour
ism
and
eco
-tour
ism
•
Enc
oura
ging
wor
kers
to li
ve a
nd h
olid
ay in
the
regi
on
• P
artic
ipat
ing
in D
estin
atio
nQ in
itiat
ives
(suc
h as
ex
plor
ing
furth
er o
ppor
tuni
ties
pres
ente
d by
the
Sou
ther
n G
reat
Bar
rier R
eef a
s w
ell a
s ne
w o
ppor
tuni
ties
in
defe
nce
and
min
ing
tour
ism
) •
Dev
elop
men
t of t
he d
rive
tour
ism
mar
ket
Edu
catio
n an
d tra
inin
g
• Im
prov
ed q
ualit
y of
labo
ur
thro
ugh
skill
s, tr
aini
ng a
nd
wor
kfor
ce d
evel
opm
ent
•
Pos
itive
impa
ct o
n em
ploy
men
t and
labo
ur
prod
uctiv
ity
• In
crea
se in
inno
vatio
n an
d kn
owle
dge
base
in th
e re
gion
• P
rom
otin
g gr
owth
of t
he e
duca
tion
sect
or b
y at
tract
ing
loca
l and
in
tern
atio
nal s
tude
nts
• Fa
cilit
atin
g co
llabo
rativ
e de
velo
pmen
t in
skills
and
tra
inin
g in
the
regi
on
• Fa
cilit
atin
g co
llabo
rativ
e re
sear
ch b
etw
een
the
regi
onal
in
dust
ry a
nd C
QU
ni
• E
ncou
ragi
ng s
tate
-wid
e pr
omot
ion
of e
duca
tion
faci
litie
s fo
r exp
ort m
arke
ts
• P
rom
otin
g sk
illing
in th
e ke
y se
ctor
s of
agr
icul
ture
, re
sour
ces,
con
stru
ctio
n an
d to
uris
m
• R
ecom
men
ding
redu
ctio
ns in
red
tape
to re
mov
e ba
rrie
rs
crea
ted
for e
mpl
oyer
s to
hire
new
app
rent
ices
and
tra
inee
s
Sup
port
serv
ices
for t
he
defe
nce
indu
stry
• E
nhan
ced
busi
ness
ca
pabi
litie
s an
d pr
actic
es to
se
cure
def
ence
opp
ortu
nitie
s
• N
ew e
mpl
oym
ent
oppo
rtuni
ties
in th
e re
gion
in
the
defe
nce
serv
ices
sec
tor
• U
sing
the
Def
ence
Whi
te P
aper
20
13 a
s a
guid
e, a
ttrac
ting
defe
nce
sect
or e
xpen
ditu
re in
the
regi
on b
y pr
omot
ing
Cen
tral Q
ueen
slan
d as
a
key
dest
inat
ion
for d
efen
ce s
uppo
rt se
rvic
e
• S
uppo
rting
the
deve
lopm
ent o
f ind
ustry
cap
abilit
y to
su
pply
to th
e de
fenc
e in
dust
ry
• Fa
cilit
atin
g im
prov
emen
ts in
regi
onal
infra
stru
ctur
e
• E
ncou
ragi
ng th
e de
fenc
e se
ctor
to o
ffer s
uppl
y ch
ain
oppo
rtuni
ties
to re
gion
al b
usin
esse
s
• P
rom
otin
g th
e re
gion
as
an a
ttrac
tive
defe
nce
loca
tion
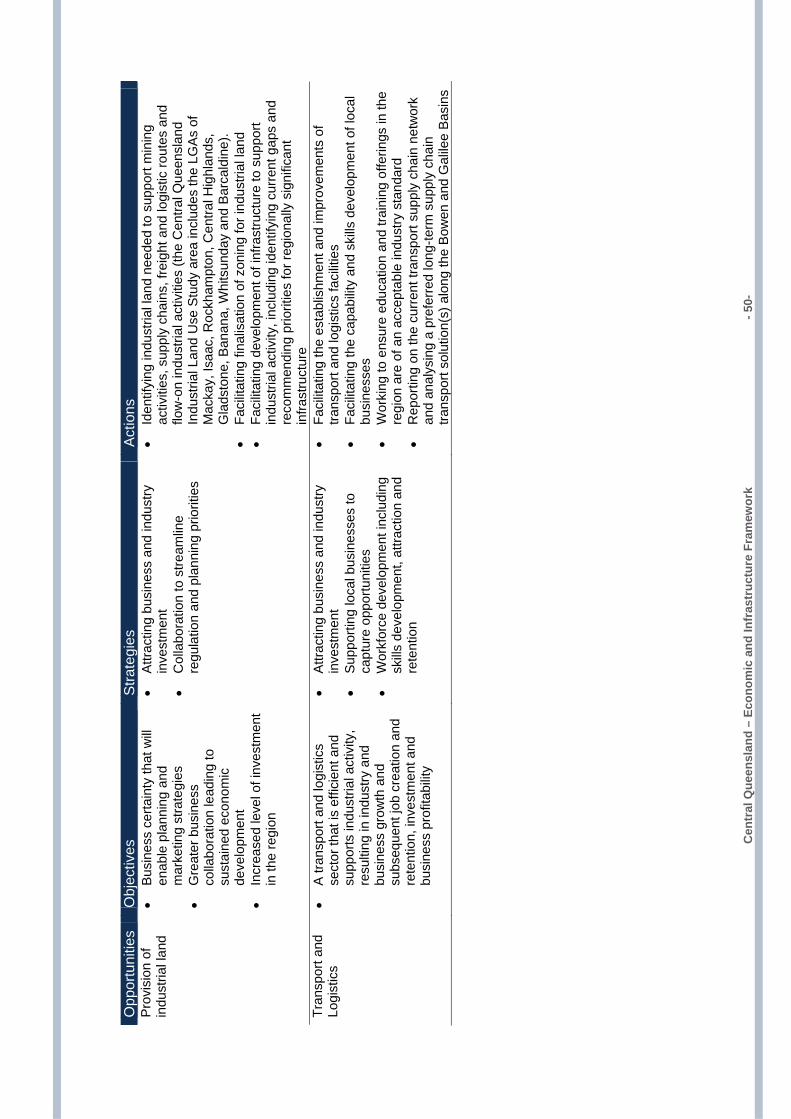
Cen
tral
Que
ensl
and
– Ec
onom
ic a
nd In
fras
truc
ture
Fra
mew
ork
�
- 50-
Opp
ortu
nitie
s O
bjec
tives
S
trate
gies
A
ctio
ns
Pro
visi
on o
f in
dust
rial l
and
•
Bus
ines
s ce
rtain
ty th
at w
ill en
able
pla
nnin
g an
d m
arke
ting
stra
tegi
es
• G
reat
er b
usin
ess
colla
bora
tion
lead
ing
to
sust
aine
d ec
onom
ic
deve
lopm
ent
• In
crea
sed
leve
l of i
nves
tmen
t in
the
regi
on
• A
ttrac
ting
busi
ness
and
indu
stry
in
vest
men
t
• C
olla
bora
tion
to s
tream
line
regu
latio
n an
d pl
anni
ng p
riorit
ies
• Id
entif
ying
indu
stria
l lan
d ne
eded
to s
uppo
rt m
inin
g ac
tiviti
es, s
uppl
y ch
ains
, fre
ight
and
logi
stic
rout
es a
nd
flow
-on
indu
stria
l act
iviti
es (t
he C
entra
l Que
ensl
and
Indu
stria
l Lan
d U
se S
tudy
are
a in
clud
es th
e LG
As
of
Mac
kay,
Isaa
c, R
ockh
ampt
on, C
entra
l Hig
hlan
ds,
Gla
dsto
ne, B
anan
a, W
hits
unda
y an
d B
arca
ldin
e).
• Fa
cilit
atin
g fin
alis
atio
n of
zon
ing
for i
ndus
trial
land
•
Faci
litat
ing
deve
lopm
ent o
f inf
rast
ruct
ure
to s
uppo
rt in
dust
rial a
ctiv
ity, i
nclu
ding
iden
tifyi
ng c
urre
nt g
aps
and
reco
mm
endi
ng p
riorit
ies
for r
egio
nally
sig
nific
ant
infra
stru
ctur
e
Tran
spor
t and
Lo
gist
ics
• A
tran
spor
t and
logi
stic
s se
ctor
that
is e
ffici
ent a
nd
supp
orts
indu
stria
l act
ivity
, re
sulti
ng in
indu
stry
and
bu
sine
ss g
row
th a
nd
subs
eque
nt jo
b cr
eatio
n an
d re
tent
ion,
inve
stm
ent a
nd
busi
ness
pro
fitab
ility
• A
ttrac
ting
busi
ness
and
indu
stry
in
vest
men
t •
Sup
porti
ng lo
cal b
usin
esse
s to
ca
ptur
e op
portu
nitie
s
• W
orkf
orce
dev
elop
men
t inc
ludi
ng
skills
dev
elop
men
t, at
tract
ion
and
rete
ntio
n
• Fa
cilit
atin
g th
e es
tabl
ishm
ent a
nd im
prov
emen
ts o
f tra
nspo
rt an
d lo
gist
ics
faci
litie
s •
Faci
litat
ing
the
capa
bilit
y an
d sk
ills d
evel
opm
ent o
f loc
al
busi
ness
es
• W
orki
ng to
ens
ure
educ
atio
n an
d tra
inin
g of
ferin
gs in
the
regi
on a
re o
f an
acce
ptab
le in
dust
ry s
tand
ard
• R
epor
ting
on th
e cu
rren
t tra
nspo
rt su
pply
cha
in n
etw
ork
and
anal
ysin
g a
pref
erre
d lo
ng-te
rm s
uppl
y ch
ain
trans
port
solu
tion(
s) a
long
the
Bow
en a
nd G
alile
e B
asin
s
Central Queensland – Economic and Infrastructure Framework � - 51-
Economic development issues Competition for labour and skills shortages Resources and associated infrastructure projects in Central Queensland are creating regional skills shortages, with particularly high demand for workers with appropriate qualifications.
The growing resources and energy sectors will continue to offer competitive employment opportunities in the region, leading to increasing demand for labour in other industries such as agriculture, public administration, retail, hospitality and tourism. However insufficient affordable housing in centres such as Gladstone and Emerald is impacting the ability of local non-resources employers to attract skilled workers to the region.
The availability of a skilled workforce is not only critical to the growth of large industries, but is particularly important for the continued viability of SMEs. The lack of labour supply (both skilled and unskilled) has the potential to affect the region’s ability to respond to new opportunities. The attraction and retention of a suitable workforce is vital to reinforce the region’s attractiveness as a place to live and work.
Infrastructure to support economic development
Economic infrastructure Natural disasters have highlighted the deficiencies in regional infrastructure which have impacted on regional connectivity (see Infrastructure Baseline section). To build stronger and resilient infrastructure, the state government announced the Betterment Fund in March 2013.
Existing economic infrastructure such as roads (including stock routes), rail, power, water and waste treatment will be under additional pressure to meet the increased demand, as a result of rapid growth in the region. The region has long-standing deficiencies in east-west linkages (including air) and secondary rural roads which are vital for primary industry exports.
Despite these challenges, the established transport and logistics industry, along with the nature of the major economic sectors and the pivotal position of the major centres in the region, means there will continue to be opportunities for development in the transport and logistics sector. For this reason, transport is also identified as an economic development opportunity in this document.
Communications Efficient communication that boosts competitiveness is essential for capitalising on opportunities presented by the digital economy and promoting overall regional economic development.
Central Queensland – Economic and Infrastructure Framework � - 52-
Unreliable and inadequate telecommunications across the region continue to limit economic growth and make business and industry more vulnerable. For example, where exchanges are at capacity, businesses are referred to wireless connections, which in some cases doe not provide sufficient speed, work with hardware located in concrete buildings or enable hosting of a website. In addition, severe weather events have previously caused disruptions to services in the region. The rollout of the NBN has commenced and could offer a solution for telecommunications in the medium to long term.
Social infrastructure Gladstone is facing issues with insufficient social services and infrastructure to meet the demands of its rapidly growing population as a result of the resources boom. Education facilities, social support services including childcare and health care, and community facilities including sport and recreation are all under significant pressure. The long term liveability of the region is being impacted which in turn will affect the region’s ability to attract a suitable workforce.
The increasing prevalence of FIFO/DIDO staffing arrangements in recent years has created additional demand for social services.
Housing There are pressures on housing affordability and availability in the region. The Government has declared areas within Blackwater, Tannum Sands, Clinton and Toolooa and Central Queensland University campus in Rockhampton as Priority Development Areas (PDAs). Development Schemes have been approved for the Toolooa and Central Queensland University PDAs. To ease housing pressures, the State Government has committed $15 million to fast-track the release of 185 blocks of land in some of the worst affected mining towns of Blackwater and Moranbah (in the neighbouring Isaac region).
Managing competition for land and water With new resource developments being identified in Central Queensland, competition for suitable land and other resources between the mining and agriculture sectors could affect economic development in the region.
Availability of water can also be a potential constraint and exert cost pressures. There is potential for competition for water supplies between sectors, but there may also be some opportunities for sharing water resources between sectors (for instance, the potential use of CSG water for irrigation).
There is also potential for pressure on land from urban encroachment as well as transport and energy infrastructure as population grows rapidly in the region.
Central Queensland – Economic and Infrastructure Framework � - 53-
Economic resilience Bolstering economic resilience of the Central Queensland region is an important aspect of sustained economic development. The strategy identifies a range of factors such as business flexibility, efficient and effective regulation, infrastructure, communications, workforce and skills development, and productivity that assist in promoting economic resilience. Maintaining secure, reliable and cost effective energy supply will also increase the region’s ability to attract and retain businesses and industries.
Flooding in early 2013 caused significant damage across Queensland. Within the region there has been damage to properties, agriculture production, transport infrastructure as well as disruptions to businesses and losses/delays to coal exports. Natural disasters in 2011 and 2008 also had significant impacts on the region’s economy. The 2011 events caused substantial losses of production in agriculture and mining industries as well as damage to infrastructure. The region recovered strongly from these disasters, although there are ongoing issues related to legacy mine water issue and the potential threat of bushfires. Similarly, the 2008 events impacted on mines in the Bowen Basin, agriculture in Central Highlands and business and industry, particularly in Emerald.
Looking ahead, the agricultural sector is particularly vulnerable to natural disasters but other sectors such as mining can also be impacted due to disruption to production, interrupted transport links and damage to infrastructure. The Queensland Government is developing a framework for the regulation of levees as part of an integrated program to improve flood management in response to the Flood Commission of Inquiry. The Betterment Fund has also been established to assist recovery from natural disasters. The Fund will allow councils to rebuild damaged infrastructure such as bridges, roads and culverts to an improved standard that will survive future flood events.
Desired outcomes, strategies and actions The major economic development issues have been identified to promote economic development. Table 12 has been populated in consultation with state government agencies and stakeholders involved in the regional planning process. The actions contained within this table represent identified activities that will help mitigate economic development issues. It is important to note that this is not an action plan for Government, rather a direction for regional stakeholders to progress economic growth in the region. For this reason the table does not identify timeframes or responsible parties.
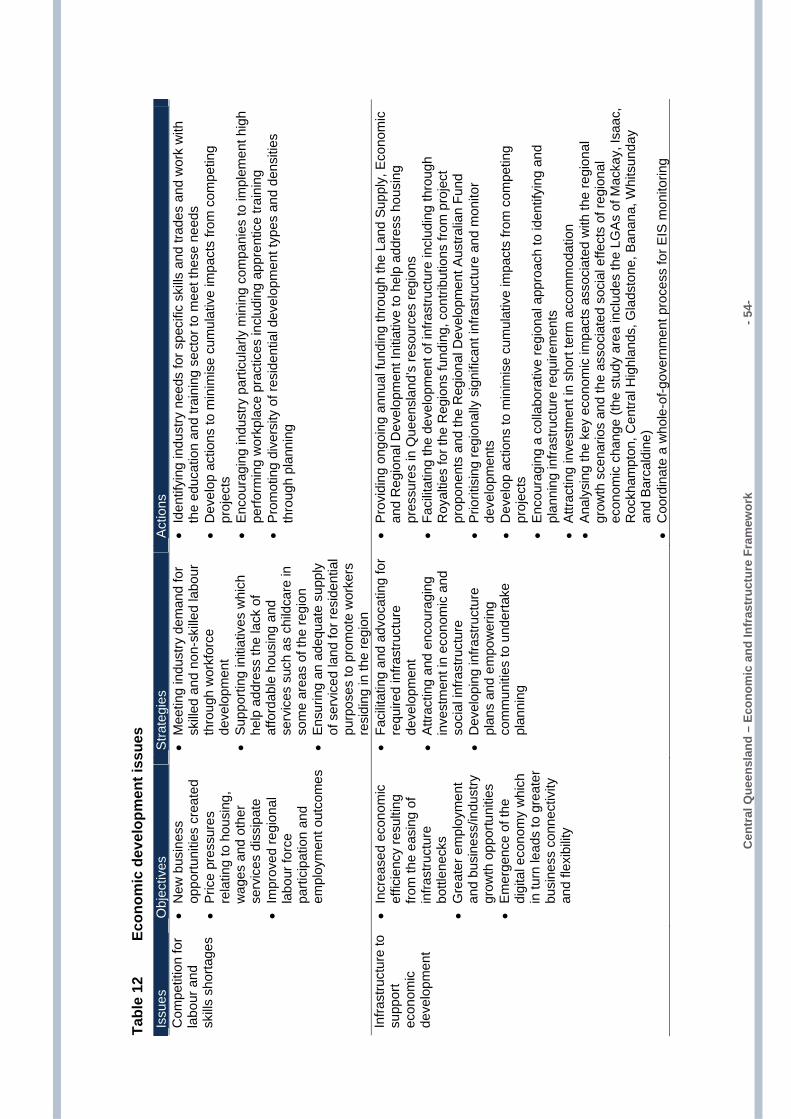
Cen
tral
Que
ensl
and
– Ec
onom
ic a
nd In
fras
truc
ture
Fra
mew
ork
�
- 54-
Tabl
e 12
Ec
onom
ic d
evel
opm
ent i
ssue
s
Issu
es
Obj
ectiv
es
Stra
tegi
es
Act
ions
C
ompe
titio
n fo
r la
bour
and
sk
ills s
horta
ges
• N
ew b
usin
ess
oppo
rtuni
ties
crea
ted
•
Pric
e pr
essu
res
rela
ting
to h
ousi
ng,
wag
es a
nd o
ther
se
rvic
es d
issi
pate
•
Impr
oved
regi
onal
la
bour
forc
e pa
rtici
patio
n an
d em
ploy
men
t out
com
es
• M
eetin
g in
dust
ry d
eman
d fo
r sk
illed
and
non-
skille
d la
bour
th
roug
h w
orkf
orce
de
velo
pmen
t •
Sup
porti
ng in
itiat
ives
whi
ch
help
add
ress
the
lack
of
affo
rdab
le h
ousi
ng a
nd
serv
ices
suc
h as
chi
ldca
re in
so
me
area
s of
the
regi
on
• E
nsur
ing
an a
dequ
ate
supp
ly
of s
ervi
ced
land
for r
esid
entia
l pu
rpos
es to
pro
mot
e w
orke
rs
resi
ding
in th
e re
gion
• Id
entif
ying
indu
stry
nee
ds fo
r spe
cific
ski
lls a
nd tr
ades
and
wor
k w
ith
the
educ
atio
n an
d tra
inin
g se
ctor
to m
eet t
hese
nee
ds
• D
evel
op a
ctio
ns to
min
imis
e cu
mul
ativ
e im
pact
s fro
m c
ompe
ting
proj
ects
•
Enc
oura
ging
indu
stry
par
ticul
arly
min
ing
com
pani
es to
impl
emen
t hig
h pe
rform
ing
wor
kpla
ce p
ract
ices
incl
udin
g ap
pren
tice
train
ing
• P
rom
otin
g di
vers
ity o
f res
iden
tial d
evel
opm
ent t
ypes
and
den
sitie
s th
roug
h pl
anni
ng
Infra
stru
ctur
e to
su
ppor
t ec
onom
ic
deve
lopm
ent
• In
crea
sed
econ
omic
ef
ficie
ncy
resu
lting
fro
m th
e ea
sing
of
infra
stru
ctur
e bo
ttlen
ecks
•
Gre
ater
em
ploy
men
t an
d bu
sine
ss/in
dust
ry
grow
th o
ppor
tuni
ties
• E
mer
genc
e of
the
digi
tal e
cono
my
whi
ch
in tu
rn le
ads
to g
reat
er
busi
ness
con
nect
ivity
an
d fle
xibi
lity
• Fa
cilit
atin
g an
d ad
voca
ting
for
requ
ired
infra
stru
ctur
e de
velo
pmen
t •
Attr
actin
g an
d en
cour
agin
g in
vest
men
t in
econ
omic
and
so
cial
infra
stru
ctur
e
• D
evel
opin
g in
frast
ruct
ure
plan
s an
d em
pow
erin
g co
mm
uniti
es to
und
erta
ke
plan
ning
• P
rovi
ding
ong
oing
ann
ual f
undi
ng th
roug
h th
e La
nd S
uppl
y, E
cono
mic
an
d R
egio
nal D
evel
opm
ent I
nitia
tive
to h
elp
addr
ess
hous
ing
pres
sure
s in
Que
ensl
and’
s re
sour
ces
regi
ons
• Fa
cilit
atin
g th
e de
velo
pmen
t of i
nfra
stru
ctur
e in
clud
ing
thro
ugh
Roy
altie
s fo
r the
Reg
ions
fund
ing,
con
tribu
tions
from
pro
ject
pr
opon
ents
and
the
Reg
iona
l Dev
elop
men
t Aus
tralia
n Fu
nd
• P
riorit
isin
g re
gion
ally
sig
nific
ant i
nfra
stru
ctur
e an
d m
onito
r de
velo
pmen
ts
• D
evel
op a
ctio
ns to
min
imis
e cu
mul
ativ
e im
pact
s fro
m c
ompe
ting
proj
ects
•
Enc
oura
ging
a c
olla
bora
tive
regi
onal
app
roac
h to
iden
tifyi
ng a
nd
plan
ning
infra
stru
ctur
e re
quire
men
ts
• A
ttrac
ting
inve
stm
ent i
n sh
ort t
erm
acc
omm
odat
ion
• A
naly
sing
the
key
econ
omic
impa
cts
asso
ciat
ed w
ith th
e re
gion
al
grow
th s
cena
rios
and
the
asso
ciat
ed s
ocia
l effe
cts
of re
gion
al
econ
omic
cha
nge
(the
stud
y ar
ea in
clud
es th
e LG
As
of M
acka
y, Is
aac,
R
ockh
ampt
on, C
entra
l Hig
hlan
ds, G
lads
tone
, Ban
ana,
Whi
tsun
day
and
Bar
cald
ine)
•
Coo
rdin
ate
a w
hole
-of-g
over
nmen
t pro
cess
for E
IS m
onito
ring
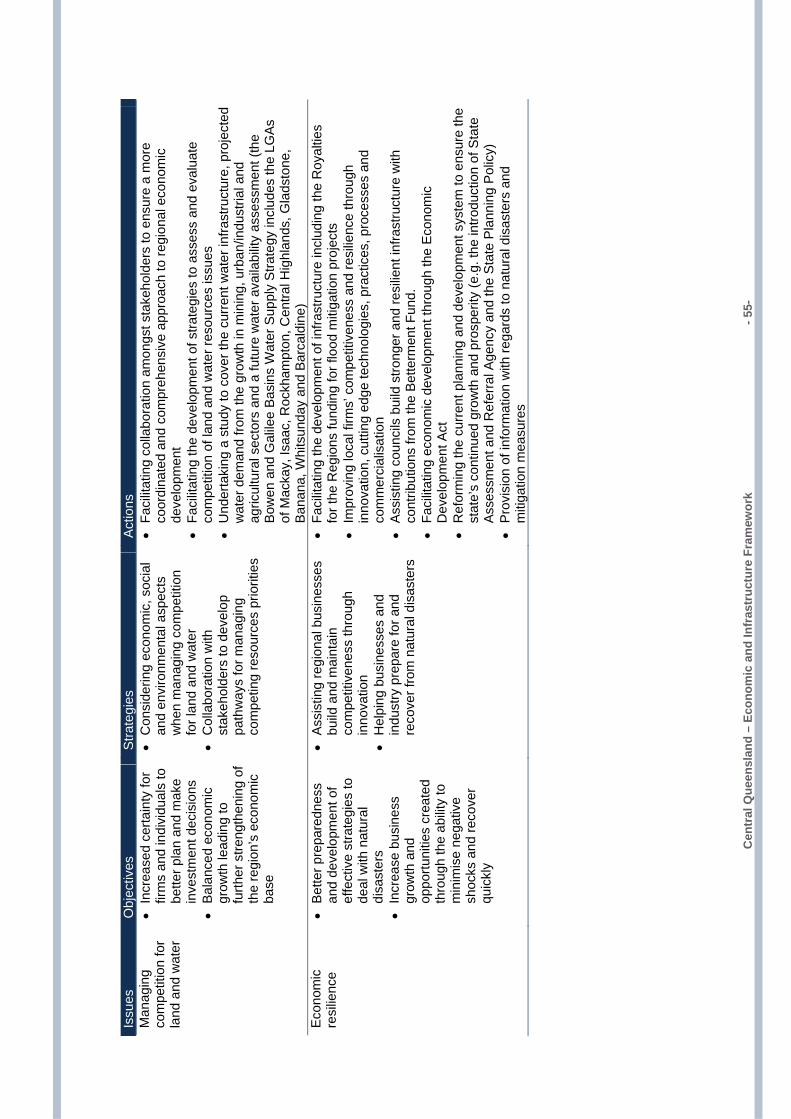
Cen
tral
Que
ensl
and
– Ec
onom
ic a
nd In
fras
truc
ture
Fra
mew
ork
�
- 55-
Issu
es
Obj
ectiv
es
Stra
tegi
es
Act
ions
M
anag
ing
com
petit
ion
for
land
and
wat
er
• In
crea
sed
certa
inty
for
firm
s an
d in
divi
dual
s to
be
tter p
lan
and
mak
e in
vest
men
t dec
isio
ns
• B
alan
ced
econ
omic
gr
owth
lead
ing
to
furth
er s
treng
then
ing
of
the
regi
on’s
eco
nom
ic
base
• C
onsi
derin
g ec
onom
ic, s
ocia
l an
d en
viro
nmen
tal a
spec
ts
whe
n m
anag
ing
com
petit
ion
for l
and
and
wat
er
• C
olla
bora
tion
with
st
akeh
olde
rs to
dev
elop
pa
thw
ays
for m
anag
ing
com
petin
g re
sour
ces
prio
ritie
s
• Fa
cilit
atin
g co
llabo
ratio
n am
ongs
t sta
keho
lder
s to
ens
ure
a m
ore
coor
dina
ted
and
com
preh
ensi
ve a
ppro
ach
to re
gion
al e
cono
mic
de
velo
pmen
t •
Faci
litat
ing
the
deve
lopm
ent o
f stra
tegi
es to
ass
ess
and
eval
uate
co
mpe
titio
n of
land
and
wat
er re
sour
ces
issu
es
• U
nder
taki
ng a
stu
dy to
cov
er th
e cu
rrent
wat
er in
frast
ruct
ure,
pro
ject
ed
wat
er d
eman
d fro
m th
e gr
owth
in m
inin
g, u
rban
/indu
stria
l and
ag
ricul
tura
l sec
tors
and
a fu
ture
wat
er a
vaila
bilit
y as
sess
men
t (th
e B
owen
and
Gal
ilee
Bas
ins
Wat
er S
uppl
y S
trate
gy in
clud
es th
e LG
As
of M
acka
y, Is
aac,
Roc
kham
pton
, Cen
tral H
ighl
ands
, Gla
dsto
ne,
Ban
ana,
Whi
tsun
day
and
Barc
aldi
ne)
Eco
nom
ic
resi
lienc
e
• B
ette
r pre
pare
dnes
s an
d de
velo
pmen
t of
effe
ctiv
e st
rate
gies
to
deal
with
nat
ural
di
sast
ers
• In
crea
se b
usin
ess
grow
th a
nd
oppo
rtuni
ties
crea
ted
thro
ugh
the
abilit
y to
m
inim
ise
nega
tive
shoc
ks a
nd re
cove
r qu
ickl
y
• A
ssis
ting
regi
onal
bus
ines
ses
build
and
mai
ntai
n co
mpe
titiv
enes
s th
roug
h in
nova
tion
•
Hel
ping
bus
ines
ses
and
indu
stry
pre
pare
for a
nd
reco
ver f
rom
nat
ural
dis
aste
rs
• Fa
cilit
atin
g th
e de
velo
pmen
t of i
nfra
stru
ctur
e in
clud
ing
the
Roy
altie
s fo
r the
Reg
ions
fund
ing
for f
lood
miti
gatio
n pr
ojec
ts
• Im
prov
ing
loca
l firm
s’ c
ompe
titiv
enes
s an
d re
silie
nce
thro
ugh
inno
vatio
n, c
uttin
g ed
ge te
chno
logi
es, p
ract
ices
, pro
cess
es a
nd
com
mer
cial
isat
ion
•
Ass
istin
g co
unci
ls b
uild
stro
nger
and
resi
lient
infra
stru
ctur
e w
ith
cont
ribut
ions
from
the
Bet
term
ent F
und.
•
Faci
litat
ing
econ
omic
dev
elop
men
t thr
ough
the
Eco
nom
ic
Dev
elop
men
t Act
•
Ref
orm
ing
the
curr
ent p
lann
ing
and
deve
lopm
ent s
yste
m to
ens
ure
the
stat
e’s
cont
inue
d gr
owth
and
pro
sper
ity (e
.g. t
he in
trodu
ctio
n of
Sta
te
Ass
essm
ent a
nd R
efer
ral A
genc
y an
d th
e S
tate
Pla
nnin
g P
olic
y)
• P
rovi
sion
of i
nfor
mat
ion
with
rega
rds
to n
atur
al d
isas
ters
and
m
itiga
tion
mea
sure
s
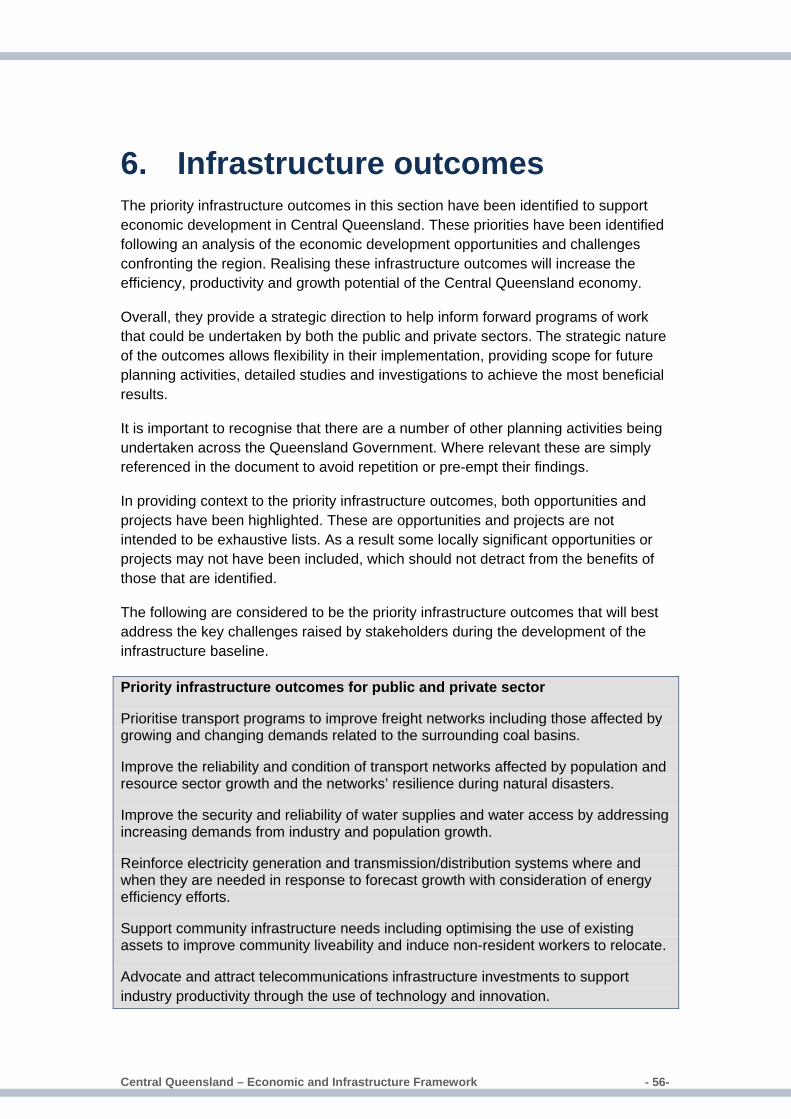
Central Queensland – Economic and Infrastructure Framework � - 56-
6. Infrastructure outcomes The priority infrastructure outcomes in this section have been identified to support economic development in Central Queensland. These priorities have been identified following an analysis of the economic development opportunities and challenges confronting the region. Realising these infrastructure outcomes will increase the efficiency, productivity and growth potential of the Central Queensland economy.
Overall, they provide a strategic direction to help inform forward programs of work that could be undertaken by both the public and private sectors. The strategic nature of the outcomes allows flexibility in their implementation, providing scope for future planning activities, detailed studies and investigations to achieve the most beneficial results.
It is important to recognise that there are a number of other planning activities being undertaken across the Queensland Government. Where relevant these are simply referenced in the document to avoid repetition or pre-empt their findings.
In providing context to the priority infrastructure outcomes, both opportunities and projects have been highlighted. These are opportunities and projects are not intended to be exhaustive lists. As a result some locally significant opportunities or projects may not have been included, which should not detract from the benefits of those that are identified.
The following are considered to be the priority infrastructure outcomes that will best address the key challenges raised by stakeholders during the development of the infrastructure baseline.
Priority infrastructure outcomes for public and private sector
Prioritise transport programs to improve freight networks including those affected by growing and changing demands related to the surrounding coal basins.
Improve the reliability and condition of transport networks affected by population and resource sector growth and the networks’ resilience during natural disasters.
Improve the security and reliability of water supplies and water access by addressing increasing demands from industry and population growth.
Reinforce electricity generation and transmission/distribution systems where and when they are needed in response to forecast growth with consideration of energy efficiency efforts.
Support community infrastructure needs including optimising the use of existing assets to improve community liveability and induce non-resident workers to relocate.
Advocate and attract telecommunications infrastructure investments to support industry productivity through the use of technology and innovation.
Central Queensland – Economic and Infrastructure Framework � - 57-
Fiscal environment and initiatives In considering these priority outcomes it is important to recognise the fiscally constrained environment that the State is currently operating in. Choosing the optimal financing and sequencing options for infrastructure investments is crucial in this environment to achieve the best outcomes for the Central Queensland region and Queensland as a whole.
In addition to maximising the use of existing infrastructure, potential new infrastructure investments and alternative funding models are also important considerations, including strategies to attract further federal funding.
Ensuring appropriate and sustainable levels of investment in infrastructure is also important to ensure that capital programs minimise investment spikes which can lead to higher costs. In the future, infrastructure investments will be made when and where they are needed most to deliver the best outcomes for the region and the State’s economy.
The Queensland Government has a number of complementary initiatives to improve the way infrastructure is planned and delivered in this fiscally constrained environment (outlined below).
Infrastructure for economic development The Government is addressing the challenges for the provision of economic infrastructure in Queensland. Through a suite of reforms to infrastructure planning, prioritisation and financing, the Government in partnership with the private sector will be better positioned to deliver highly productive infrastructure to drive the economic development of the State and regions.
Infrastructure Queensland Infrastructure Queensland is an advisory group drawing on expert advice from highly regarded private sector representatives and heads of key government departments to drive the State’s infrastructure projects. The group provides advice to the State Government on long-term planning and priorities for infrastructure and help the government make the hard choices that need to be made.
Projects Queensland Projects Queensland is focussed on fostering investment partnerships that deliver positive infrastructure outcomes. This body helps to drive cooperative funding models that maximise private investment, and ensure major projects are built on time and to budget. Projects Queensland is committed to service delivery, encouraging innovative private investment in a pipeline of new projects and reducing costs and red tape.
Central Queensland – Economic and Infrastructure Framework � - 58-
Regional environment With the diversity of the region, its industries and infrastructure, numerous other planning initiatives and activities have or are being undertaken. These are integral to ensuring the complexities of the region and future scenarios are adequately assessed.
As a result of the regions complexities it is important to highlight that this document is not intended to address all matters within the region, focusing instead on matters of regional significance. The state government would also like to recognise the important role local governments and the private sector continue to play in planning for the region.
Where possible, other initiatives have contributed in the preparation of this regional framework. However some initiatives will be considered in future revisions of this framework, due to their timing and progress.
The following are recent initiatives related to infrastructure planning of notable relevance to the Central Queensland region. These infrastructure frameworks will provide certainty for stakeholders regarding the Queensland Government's required or preferred infrastructure outcomes in these Basins.
Bowen Basin Infrastructure Framework (BBIF) This framework aims to provide an integrated overarching infrastructure planning framework, that will maximise the Bowen Basin’s economic growth opportunities. It will identify key bottlenecks in the infrastructure networks and resource industry supply chains, and inform infrastructure policy and prioritisation.
Galilee Basin Infrastructure Framework (GBIF) The GBIF is a whole-of-government framework that aims to guide decision-making on the coordinated and cost-effective provision of infrastructure to meet the needs of the coal mining industry in the Galilee Basin to the west of the Central Queensland region.
Surat Basin Infrastructure Framework (SBIF) The SBIF is a whole-of-government framework that aims to guide decision-making on the coordinated, timely and cost-effective provision of infrastructure to meet the needs of resource projects in the region, particularly those related to the coal mining industry. This document focuses on infrastructure solutions for the growing the coal and CSG sectors within the basin with an understanding that these solutions must also enhance the growth of existing and developing sectors.
Central Queensland – Economic and Infrastructure Framework � - 59-
Strategic priorities Prioritise transport programs to improve freight networks including those affected by growing and changing demands related to the surrounding coal basins
A key priority for infrastructure in the region is enabling the transportation of goods and resources. While the region’s economy generally relies on products being transported to market particularly through coastal ports, there is also inwards logistics supporting business to consider – particularly the region’s agricultural and resources sectors. Improving the region’s freight transportation networks also has significant potential to deliver flow on benefits to other network users particularly residents in urban areas and tourists using the region’s road networks.
Transport programs should be prioritised to improve the efficiency, capacity and reliability of freight networks. In particular this prioritisation should strive to improve freight networks challenged by resource sector activity relating to the surrounding coal basins. Temporary increases in heavy vehicle traffic related to construction activities should also be recognised and appropriately managed. Economic benefits and facilitation of economic development, along with overall safety of the network, must be key factors informing this prioritisation.
Freight transport programs must also be outcome focussed enabling the consideration of non-infrastructure solutions (e.g. vehicle technologies which reduce pavement impacts) and alternative modes of transport which may achieve better value for money. These programs must also consider the inter-relationship of varying mode of transport when considering improvements. As an example, the capacity of a port and the linkages to the port must be considered holistically.
A significant number of resource projects have been proposed, particularly in the Galilee Basin. The cumulative impact of these and other resource projects will put increasing pressure on major freight routes should all projects proceed. Development of the Galilee Basin could likely see a sharp increase in freight movement, while expansion of the Bowen Basin is anticipated to see more gradual increases. The growth in agricultural sector will further contribute to this pressure. In addition to land based transportation these sectors may also require greater port capacity.
Population growth is affecting the efficiency of key freight routes like those around Gladstone which are increasingly being used for local trips. Improvements to these networks should also strive to reduce conflict between freight and other network users.
Opportunities
Planning for emerging transport routes An opportunity exists for business groups to work with Government to better model and identify emerging transport issues that may be created by mining in the Galilee, Bowen and Surat Basins. Future transport demand may be characterised by strong
Central Queensland – Economic and Infrastructure Framework � - 60-
growth in heavy vehicle traffic, particularly freight efficient vehicles. Key road routes that may be impacted include links between Alpha, Clermont, Emerald, Blackwater, Taroom and Wandoan connecting to the coastal activity centres and ports including those around Rockhampton and Gladstone. To the west of Emerald, narrow formation width road networks and bridges could also be reviewed.
Capacity improvements Undertaking capacity and safety upgrades along key freight routes can support the region’s economic development by reducing the cost of transport and raising competitiveness. Strategic investment in sections like the Capricorn Highway between Rockhampton and Gracemere can improve the safety and efficiency catering for increased freight. Working closely with proponents and supporting capacity upgrades to existing rail systems will also be important in responding to growth constraints.
Surat Basin Rail Project The proposed Surat Basin Rail Project supports an aspirational modal shift towards increased rail use, with potential to reduce heavy vehicle impacts on road networks and alleviate capacity constraints on the Port of Brisbane and the Western Rail System in the Darling Downs. This project is also a step towards providing further export opportunities for regional producers with connections through to the Port of Gladstone. To maximise these opportunities, consideration would need to be given to improvements to connecting rail networks.
Unlocking the Galilee Basin The development of the Galilee Basin to the west as a major centre for coal mining, processing and export is of great strategic importance to the future economic prosperity of the State. Rail access to the Galilee Basin from coastal ports is integral to unlocking the coal in the basin and potential corridors may pass through and benefit Central Queensland. The Galilee Basin Infrastructure Framework defines the rail outcomes sought by the State Government in regards to the Galilee Basin.
Alternative heavy vehicle routes In the longer term, alternative heavy vehicle routes including bypasses provide opportunities to reduce heavy vehicle movements through major centres, such as Rockhampton, Gladstone and Emerald. Benefits for the community could be realised through improving accessibility to destinations and improved safety and amenity. There are also benefits for efficient freight movement that avoids congestion on the existing highways, especially during peak times.
Planning for over size movement routes There is a need to identify and protect regional over dimension vehicle routes to allow the efficient movement of over size loads between the deep water ports and mining areas. The identified routes should have appropriate vertical and horizontal clearance protected from encroaching and/or competing infrastructure to facilitate movement of over dimensioned loads, improve road safety and minimise disruption to other road users.

Central Queensland – Economic and Infrastructure Framework � - 61-
Port infrastructure A number of port infrastructure projects underway or proposed near Gladstone would significantly increase the region’s export capacity, supporting coal exports from the Bowen, Surat and Galilee Basins including the Wiggins Island Coal Export Terminal
Related initiatives
Great Barrier Reef Ports Strategy The Queensland Ports Strategy will outline the Governments strategic approach and principles towards guiding future port planning and development for Queensland ports. The strategy aims to ensure that the ports’ planning framework facilitates the development of ports and associated land transport infrastructure that optimises the Queensland ports’ network to support economic development and maintain environmental sustainability.
Improve the reliability and condition of transport networks affected by population and resource sector growth and the networks’ resilience during natural disasters
Improving the reliability and condition of the region’s transport networks is a key strategy to enable the economy to operate smoothly and without interruption.
Reliability improvements to these networks, with greater resilience during flood events, are important to help reduce network interruptions. Improving the resilience of airstrips and airports susceptible to flooding, like the Rockhampton airport, should be considered in addition to road and rail infrastructure.
Improving the condition and safety of road assets can also reduce disruptions to economic activity, particularly on routes affected by increased heavy vehicle traffic. The maintenance schedules of some of these assets may require review in light of expected increases in heavy vehicles use.
Transport networks in and around larger urban centres like Rockhampton, Gladstone and Emerald are experiencing strong population growth and increased urban traffic. This is affecting the reliability of networks in these areas which could be improved.
Opportunities
Reducing vulnerabilities to flooding Opportunities exist to reduce the vulnerability of the Central Queensland economy to disruption from flooding through targeted construction of upgrades, including the Bruce Highway crossing of the Yeppen flood plain.
Central Queensland – Economic and Infrastructure Framework � - 62-
Passenger transport There is an opportunity to review the current public transport network through evidence based planning to identify corridors that could benefit from improved public transport services and target markets to encourage public transport usage. This also extends to supporting and encouraging private sector opportunities, like chartered bus services to major industrial precincts, mines or resource communities. In particular linking coastal communities such as Yeppoon to resource centres, reducing the number of individual DIDO vehicles.
Targeted improvements to road condition Targeted investments to improve the condition and safety of existing assets could significantly benefit the region. State controlled roads for particular consideration include the Capricorn Highway, Burnett Highway, Dawson Highway, and the Bruce Highway.
Planned development patterns With the strong population growth projected for the region, the preferred development patterns of urban areas should be planned with collaboration between the State and Local Government to reduce the impact on the road networks. This collaborative planning can enable the optimal use of existing infrastructure, delaying the need for costly investments, or where necessary, planning ahead to increase capacity in line with increased demand. Development can also be planned such that it results in minimal conflict along key freight routes, reducing these impacts to the region’s economy.
Inappropriately located or sequenced development for this population growth could result in further impacts to the network’s reliability. This may be important for key urban areas like Rockhampton, Emerald and Gladstone. Gladstone in particular is already affected by challenges associated with population growth and also has significant future growth projections.
Related initiatives
Royalties for the Regions The Queensland government is giving back to the communities that support resource projects through its Royalties for the Regions initiative. Over its first four years, the program will invest $495 million in new and improved community infrastructure, roads and floodplain security projects that benefit those who live, work and invest in Queensland’s resource regions. In the following years there will be an ongoing commitment of $200 million each year.
Central Queensland – Economic and Infrastructure Framework � - 63-
Bruce Highway Action Plan The Bruce Highway Action Plan sets out a detailed program of works which will improve the safety, flood immunity and capacity of the Bruce Highway, over the next ten years. Federal funding is being sought to turn the Bruce Highway into a safe, resilient and efficient key state road corridor with projects including:
Yeppen Floodplain South Upgrade
Rockhampton Northern Access Upgrade Stage 1
Plan and Preserve the Rockhampton Bypass
Improve the security and reliability of water supplies and access by addressing increasing demands from industry and population growth Reinforcing the security and reliability of water supplies is a key priority to allow the region to continue to support its growth and access water. Population growth will see an increased demand on community water supplies in particular in Gladstone and Rockhampton.
Improving water security and reliability is also particularly important to cater for resource sector worker camps. Improvements should however be flexible having regard to the temporary nature of some of these camps while having regard to the importance of water quality. Improved coordination and collaboration with the resources sector will also be important for the region to manage the impacts of fluctuations in non-resident workforce populations on community water supplies.
Opportunities
Opportunities to aggregate and distribute CSG water The continuing expansion of the CSG industry, particularly in the Surat Basin, is resulting in increasing quantities of CSG water being generated. Opportunities exist to aggregate and distribute treated CSG water in some areas, with the water being supplied to appropriate end users. Aggregation and distribution pipelines could later be supplied from alternative water supplies.
Extending the life of existing infrastructure Infrastructure built solely or primarily to supply water to the mining industry may be used for other purposes once mining activities have ceased or relocated. If appropriate funding arrangements are established, it may be possible for that same infrastructure to supply water for industrial and rural users in the future, thereby extending the lifetime of the infrastructure and providing opportunities for expansion of other economic activity.
Catchments in neighbouring regions The Central Queensland region benefits significantly from the presence of the Fitzroy River’s very large catchment. Water supplies are available on a large scale and are generally reliable providing that adequate infrastructure is in place to capture, store and manage them. Additionally, the proximity of other large catchments in
Central Queensland – Economic and Infrastructure Framework � - 64-
neighbouring regions, in particular the Burdekin River, allows unallocated water to be transferred into the Central Queensland region to meet the supply requirements of many mining activities and urban communities.
Water Trading within Water Supply Schemes Voluntary participation in water markets provides existing water allocation holders with the opportunity to restructure or exit enterprises as circumstances change. Water markets also provide opportunities for new developments, encourage increased water use efficiency, and promote the movement of water to higher value uses.
The provision of medium to high water allocation conversion in the Nogoa Mackenzie Water Supply Scheme, in accordance with the water allocation change rules in the Fitzroy Basin Resource Operations Plan, allows for additional high priority secure water supplies for the mining industry and town water supplies as required.
Unallocated water reserves for new infrastructure The Water Resource (Fitzroy Basin) Plan 2011 provides strategic infrastructure reserves of additional water (referred to as unallocated water) for potential new water infrastructure.
Related initiatives
Queensland’s Water Sector: A 30-year Strategy The Queensland Government wants to create a strong and resilient water sector to help deliver Queensland’s economic and lifestyle goals. In support of this, a long-term strategy is being developed to create a Queensland water sector which will deliver integrated catchment-based, recreation, water supply, sanitation, irrigation and environmental services at the lowest cost.
This strategy is being developed in two phases. Phase 1 is the release of the water sector discussion paper for public consultation; Phase 2 will be the development of the strategy itself in 2013.
Central Queensland Regional Water Supply Strategy This strategy includes solutions to meet Central Queensland's urban, rural and industrial water needs over the long term, and was developed in partnership with local governments and other stakeholders to deliver optimal environmental, social and economic outcomes. The strategy, covers the major regional centres of Biloela, Emerald, Gladstone, Moranbah, Rockhampton and the Capricorn Coast including Yeppoon. It complements the existing water resource and resource operations plans for the Central Queensland region.
Lower Fitzroy River Infrastructure An unallocated water reserve of up to 76 000 megalitres per annum associated with the proposed Lower Fitzroy River Infrastructure project, has been provided for in the Water Resource (Fitzroy Basin) Plan 2011. The project is intended to address the potential demands from industry, agriculture and urban populations along the Capricorn Coast including Rockhampton and Gladstone.

Central Queensland – Economic and Infrastructure Framework � - 65-
The staged project proposal involves the raising of Eden Bann Weir located approximately 45 km north-west of Rockhampton, and the construction of a new weir located at Rookwood about 50 km from Rockhampton on the Fitzroy River.
Woleebee Creek to Glebe Weir Pipeline The proposed Woleebee Creek to Glebe Weir Pipeline project is intended to supply treated CSG water to agricultural and commercial customers around Wandoan and in the Dawson Valley Water Supply Scheme. The proposed 120 km-long pipeline from QGC’s water treatment plant at Woleebee Creek, west of Wandoan, to Glebe Weir on the Dawson River near Taroom, will be capable of transporting up to 36 500 megalitres of treated CSG water each year.
Nathan Dam and Pipelines The Nathan Dam and Pipelines project is aimed at providing long-term, reliable water supplies to mining, power, urban and existing agricultural customers in the Surat Coal Basin and the Dawson-Callide sub-region. The proposed Nathan Dam site is located just upstream of Nathan Gorge on the Dawson River, 315 km upstream of the confluence of the Dawson and Fitzroy rivers. If the project goes ahead, the dam is expected to have a capacity of up to 888 000 megalitres.
Connors River Dam and Pipelines Project The Connors River Dam and Pipelines Project was aiming to meet water supply needs of coal mining customers and the local communities in the Bowen and Galilee Basins. In July 2012 SunWater deferred any further project development work on the proposed Connors River Dam and associated Pipeline project due to inadequate and uneconomic volume of customer sign-up.
Reinforce electricity generation and transmission/distribution systems where and when they are needed in response to forecast growth with consideration of energy efficiency efforts The region’s electricity system powers the Central Queensland economy and as such, maintaining adequate power supply is integral to ensuring the region’s economy can operate without interruption.
Augmenting the electricity system for bulk users will be important for the region, particularly in the Galilee and Bowen Basin where large numbers of resource projects have been proposed. Reinforcing existing networks will also be important to service anticipated population and industry growth.
Advances in energy generation technologies should be monitored for efficiency improvements. Adopting more efficient and alternative technologies will be important considerations in the future.
Monitoring and scenario planning for changes in consumer behaviour and energy consumption are also important. Consumers are increasingly becoming more energy conscious in their homes. However, the 2012 Queensland Household Energy Survey
Central Queensland – Economic and Infrastructure Framework � - 66-
revealed that households are also purchasing more white goods and electrical appliances which could put an upward pressure on energy demand.
Opportunities
Reliable access to electricity Proposed development of high voltage transmission infrastructure into certain resource areas like the Galilee Basin may provide opportunities for other proponents to access reliable electricity from the National Electricity Market (NEM).
Energy generation potential The Central Queensland region is well positioned to grow its energy generation capabilities to service the needs of the region and the Bowen Basin, and help open up the Galilee Basin. The region has abundant resources suitable for fuel (e.g. coal), and a well established energy sector and existing transmission network.
Localised energy generation Localised energy generation can be a viable option for consideration in some situations rather than or in addition to, connections to the transmission or distribution networks. There may also be opportunities for localised gas-fired generating plants in some areas to supply electricity directly to certain customers.
Related initiatives
The 30-year Electricity Strategy To proactively meet emerging challenges, the Queensland Government has embarked on an ambitious path that will deliver a 30-year strategy for the state’s electricity sector. The government is putting the entire electricity supply chain under the microscope to identify challenges and opportunities, target efficiencies and ultimately ensure that Queenslanders are getting the most secure, reliable and cost-effective supply of electricity possible.
Galilee Basin Transmission Project Several mining proponents are proposing to develop large-scale coal mines in the Galilee Basin region, which would require a substantial increase in electricity demand. To meet this potential growth, Powerlink is proposing to extend its existing network into the region via two stages. The proposed first stage includes a new substation near Alpha to the west of the region with a transmission line running to it from Lilyvale Substation North East of Emerald.
Calvale and Stanwell Powerlink is currently constructing a new 275 kilovolts transmission line between its Calvale and Stanwell substations. This line will be located mostly on existing easements beside an existing 275 kilovolts line that runs between Calvale and Stanwell. The new 275 kilovolts transmission line is being constructed to meet anticipated long-term electricity demand in the Central and Northern Queensland regions. Completion is anticipated in 2013.
Central Queensland – Economic and Infrastructure Framework � - 67-
Aldoga Power Station Aldoga Power Station is a gas-fired power station proposed by Energy Australia (formerly TRUenergy). The power station is proposed to be built on land within a 26 000-hectare state development area in Gladstone. Aldoga power station is intended to help meet increasing demand for energy from Queensland households, business and industry. The power stations development proposal is staged to match the projected growth in electricity demand. Initially it is expected to produce around 600 megawatts, later increasing to a total capacity of up to 1500 megawatts. When completed, Aldoga is expected to produce around 10 per cent of Queensland’s electricity supply.
Support community infrastructure needs including optimising the use of existing assets to improve community liveability and induce non-resident workers to relocate Community infrastructure plays an important role in servicing a wide variety of local needs throughout the region. Supporting the regions communities and their needs through adequate community infrastructure and social services is an important priority for the region now and in the future. In addition, it is also important to deliver efficiencies and innovations that are capable of delivering the most from existing investments and support fluctuations in non-resident populations.
Various economic opportunities are driving growth in the region. Of particular note is the resources sector which has brought an influx of non-resident workers to the region. As a result of this economic growth and the growth of non-resident and resident populations, there are increasing demands on community infrastructure and social services. Quality community infrastructure and services improve liveability and can assist in encouraging non-resident workers to relocate.
While it is important to recognise this priority for communities in the Central Queensland, due to the regional economic focus of this framework, priorities are better identified through other processes such as planning for the delivery of local services.
Opportunities
Leveraging off of the opportunities from significant projects The opportunities from significant resources projects could be maximised to provide additional or different kinds of social infrastructure to support residents and non-resident population (e.g. skills training). Longer term opportunities also exist where the legacy infrastructure provided for significant resources projects could support the growth of other industries. This applies to both community and non-community infrastructure.
Central Queensland – Economic and Infrastructure Framework � - 68-
Supporting and attracting worker relocation Supporting regional communities to develop the attractiveness and long term sustainability of resource towns, through development of social and local infrastructure and services, is likely to encourage more workers to relocate their families to resource communities. This provides the resource industry with convenient access to a specialised local workforce and builds the social capital in these communities, while reducing transportation and accommodation costs for employers. It is important to note however that it may not be practical to support the relocation of large numbers of non-resident workers to some smaller resource communities.
Temporary solutions for temporary needs Innovative solutions could be investigated and planned to manage temporary increases in demand mitigating the need for costly permanent infrastructure. In some instances, additional capacity in community infrastructure or social services is only required for a temporary period due to non resident workforce fluctuations. As an example, peaks can often occur during the construction phase of significant projects. Using isolated work camps which are highly self-sufficient can also reduce some non-resident worker impacts on community infrastructure.
Related initiatives
Queensland Schools Planning Commission The Queensland government established the Queensland Schools Planning Commission to streamline and coordinate the processes of planning, establishing and expanding government and non-government schools across Queensland with the collaboration of all three school sectors and other key groups.
The Commission will provide advice and recommendations to government, drawing on evidence, expertise and consultation with key stakeholders. It will also analyse the current infrastructure planning and financial systems of schools and make recommendations on how to increase their efficiency and cut red tape.
The Commission will also examine population trends and school capacities to guide future planning, and produce a school infrastructure demand map which identifies schools that are most in need of infrastructure funding and support.
Health reform Australia's health system performs well by international standards, however, the growing burdens of an ageing population and escalating chronic disease are putting it under increasing pressure. This means that Queensland needs to change the way the health system operates. Commonwealth, state and territory governments have agreed to transform the Australian health system so that decision-making and accountability are more responsive to local health priorities. This provides greater ability for the new Hospital and Health Services to meet the service needs of their communities.
Central Queensland – Economic and Infrastructure Framework � - 69-
Bowen Basin and Surat Basin Population Reports The Bowen Basin and Surat Basin Population Reports quantify the number of FIFO/DIDO workers living in these regions and their use of commercial accommodation (see Appendix A for data and analysis on non-resident workers in Central Queensland).
Advocate and attract telecommunication infrastructure investments to support industry productivity innovations through technology and provide more certainty Public and private sectors should continue to advocate and attract telecommunications infrastructure investments within the region, with industry and telecommunications providers working together to closely plan future investment.
Technology can play a significant role in driving innovation and productivity, and the connectedness of newer technologies is increasing reliance on fixed and mobile services and the demand for telecommunications infrastructure.
Continual improvements and expansions to the region’s telecommunications infrastructure benefits industry, encouraging the increased adoption of connected technologies. Deploying technologies like telemetry can allow businesses to monitor or manage remote operations, driving operational efficiencies. In a community context, improved telecommunications also reduces isolation and enables services to be provided remotely (e.g. education and health services).
The intent of this priority is also to ensure telecommunication providers and their customers are in tune with each other. This enables customers to benefit from technological advances while potentially enabling providers to mitigate access limitations or delays to telecommunications infrastructure. This collaboration can also enhance network providers’ demand forecasting and help them avoid capacity constraints on their networks.
A key focus of the collaboration between the telecommunications industry and other industries should be to provide certainty regarding the delivery of telecommunications infrastructure and services. Where appropriate, federal government involvement is also important to address regulator issues and instances of market failure.
Opportunities
Co-investment in telecommunication infrastructure Opportunities exist for co-investment in telecommunications infrastructure to expand the coverage of existing networks or bring forward proposed new investment.
Transparent telecommunications infrastructure and services Providing further transparency regarding future investment in telecommunications infrastructure and services will provide certainty to other industries and support their planning for future operation. This is particularly the case where these operations are

Central Queensland – Economic and Infrastructure Framework � - 70-
dependent on the availability of reliable and modern telecommunications infrastructure or services.
Group buying power The group buying model, with a group of customers in sufficient numbers, could encourage telecommunication infrastructure providers to extend or upgrade their network in an area. Under this model a contractual commitment to use a telecommunications service by multiple businesses and individuals may provide a successful business case for the telecommunications provider to investment in infrastructure.
Related initiatives
Improving the reach of the National Broadband Network While the National Broadband Network is proposed to cover all of Australia, not everyone will receive high speed fibre or high speed wireless with some households limited to satellite access. The National Broadband Network Co encourages communities, businesses or individuals to consider co-investment to extend either their fibre or mobile broadband network.
Central Queensland – Economic and Infrastructure Framework � - 71 -
7. Conclusion This framework broadly maps out the actions and infrastructure outcomes needed to position the Central Queensland regional economy for future growth. The economic development vision is to achieve a diversified and prosperous regional economy capitalising on regional competitive strengths and opportunities in resources, agriculture, and related manufacturing, as well as related supply chains, tourism and services to support a growing population.
Central Queensland’s resource and agricultural sectors are benefiting from record investment linked to rising global demand for metals, mineral, coal and food. The region has potentials to further develop construction, tourism, education and training, benefiting from an expanding resources sector. There are also opportunities for support services for the defence industry, oil shale and renewable energy and transport and logistics. The provision of industrial land in GSDA and the Gracemere Stanwell Corridor for industrial development provides growth opportunities for manufacturing and mining related services industries.
The competitive strengths of the Central Queensland region across a range of sectors make it an attractive place to invest. However, it is important to ensure that regulatory and other barriers do not unnecessarily impede this investment and critical issues affecting regional competitiveness, including skills availability, are addressed effectively.
The framework also acknowledges that economic prospects are not uniform across Central Queensland region. The majority of people live in major regional centres, each responding to different growth drivers and facing their own individual economic development challenges.
Recognising the economic future of the region is very much linked to a dynamic global environment, the framework does not take a prescriptive approach that would limit flexibility and responsiveness. Rather it identifies high-level strategic actions and priority infrastructure outcomes to address the economic development and infrastructure challenges confronting Central Queensland. The framework has also been a key input in the development of the Central Queensland Regional Plan which improves certainty for communities and business through specific land use mapping.
The framework will be reviewed every five years in line with the regional plan to ensure it remains consistent with changing market forces and community expectations.
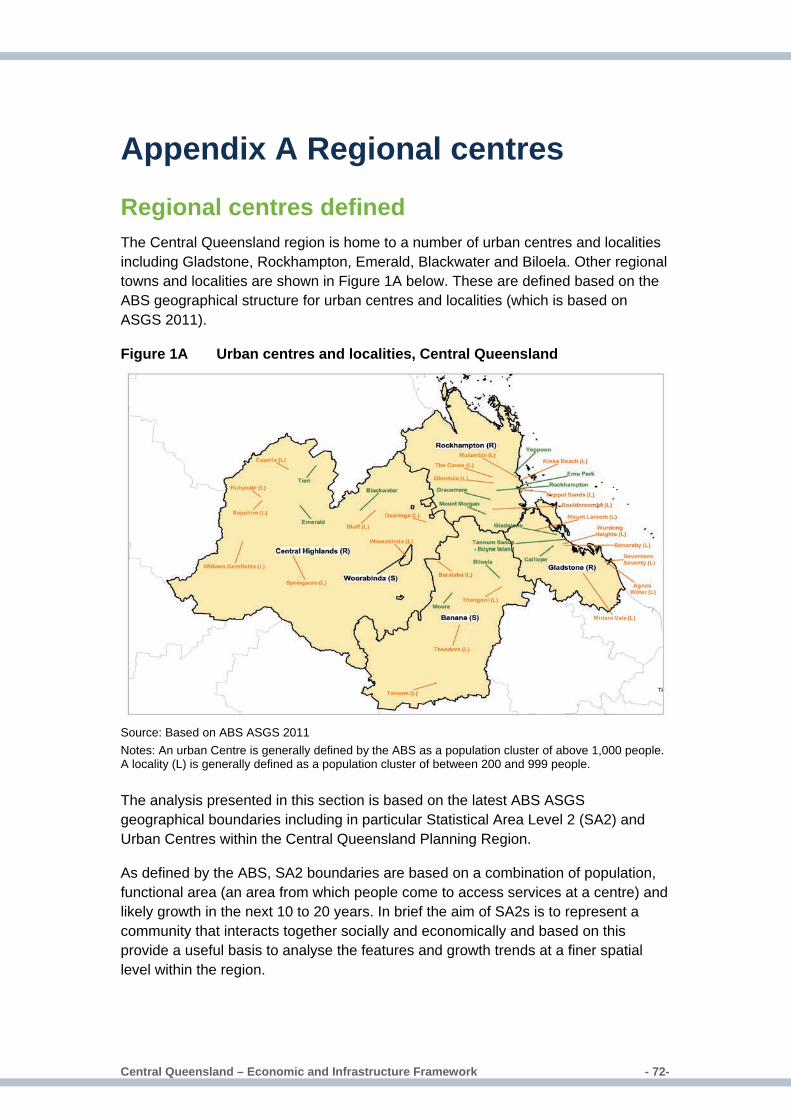
Central Queensland – Economic and Infrastructure Framework � - 72-
Appendix A Regional centres
Regional centres defined The Central Queensland region is home to a number of urban centres and localities including Gladstone, Rockhampton, Emerald, Blackwater and Biloela. Other regional towns and localities are shown in Figure 1A below. These are defined based on the ABS geographical structure for urban centres and localities (which is based on ASGS 2011).
Figure 1A Urban centres and localities, Central Queensland
Source: Based on ABS ASGS 2011 Notes: An urban Centre is generally defined by the ABS as a population cluster of above 1,000 people. A locality (L) is generally defined as a population cluster of between 200 and 999 people.
The analysis presented in this section is based on the latest ABS ASGS geographical boundaries including in particular Statistical Area Level 2 (SA2) and Urban Centres within the Central Queensland Planning Region.
As defined by the ABS, SA2 boundaries are based on a combination of population, functional area (an area from which people come to access services at a centre) and likely growth in the next 10 to 20 years. In brief the aim of SA2s is to represent a community that interacts together socially and economically and based on this provide a useful basis to analyse the features and growth trends at a finer spatial level within the region.
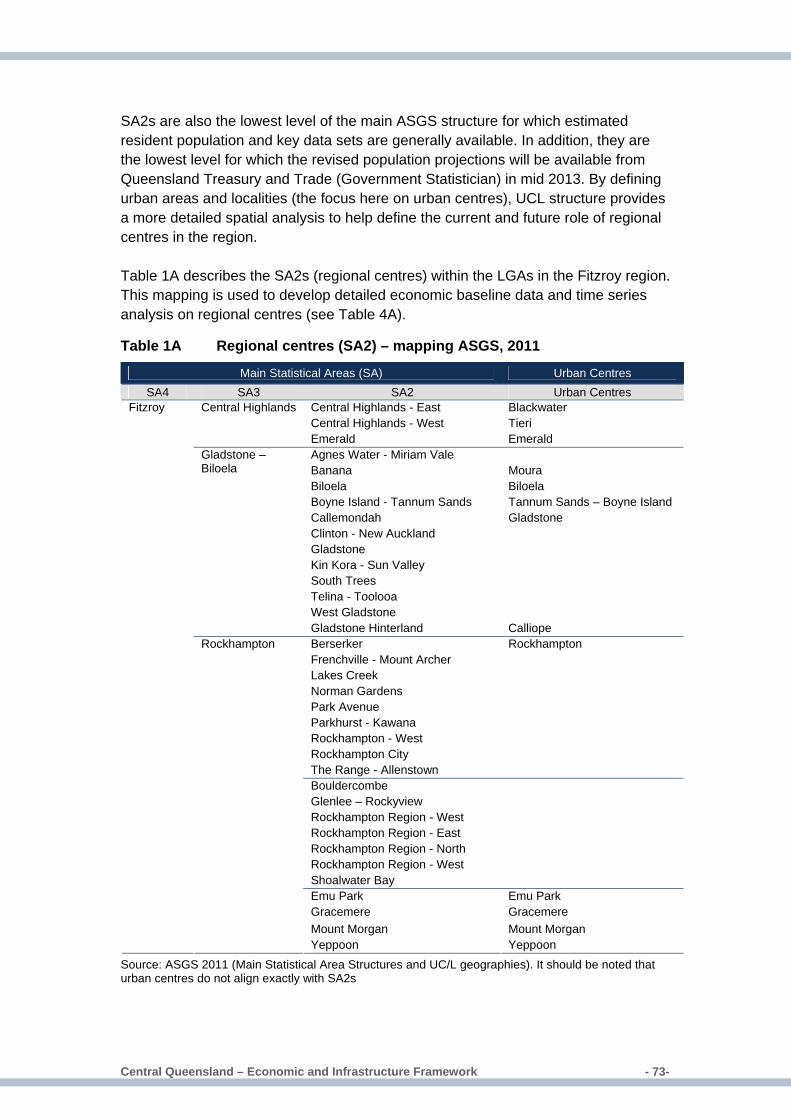
Central Queensland – Economic and Infrastructure Framework � - 73-
SA2s are also the lowest level of the main ASGS structure for which estimated resident population and key data sets are generally available. In addition, they are the lowest level for which the revised population projections will be available from Queensland Treasury and Trade (Government Statistician) in mid 2013. By defining urban areas and localities (the focus here on urban centres), UCL structure provides a more detailed spatial analysis to help define the current and future role of regional centres in the region. Table 1A describes the SA2s (regional centres) within the LGAs in the Fitzroy region. This mapping is used to develop detailed economic baseline data and time series analysis on regional centres (see Table 4A).
Table 1A Regional centres (SA2) – mapping ASGS, 2011
Main Statistical Areas (SA) Urban Centres SA4 SA3 SA2 Urban Centres
Central Highlands - East Blackwater Central Highlands - West Tieri
Central Highlands
Emerald Emerald Agnes Water - Miriam Vale Banana Moura Biloela Biloela Boyne Island - Tannum Sands Tannum Sands – Boyne Island Callemondah Clinton - New Auckland Gladstone Kin Kora - Sun Valley South Trees Telina - Toolooa West Gladstone
Gladstone
Gladstone – Biloela
Gladstone Hinterland Calliope Berserker Frenchville - Mount Archer Lakes Creek Norman Gardens Park Avenue Parkhurst - Kawana Rockhampton - West Rockhampton City The Range - Allenstown
Rockhampton
Bouldercombe Glenlee – Rockyview Rockhampton Region - West Rockhampton Region - East Rockhampton Region - North Rockhampton Region - West Shoalwater Bay Emu Park Emu Park Gracemere Gracemere Mount Morgan Mount Morgan
Fitzroy
Rockhampton
Yeppoon Yeppoon Source: ASGS 2011 (Main Statistical Area Structures and UC/L geographies). It should be noted that urban centres do not align exactly with SA2s
Central Queensland – Economic and Infrastructure Framework � - 74-
Role and outlook of major regional centres Rockhampton Role: Rockhampton is the largest city within Central Queensland. Rockhampton is a key and diversified service centre for Central Queensland providing the area with the largest scale retail, cultural, education, health and transport services as well as energy and utilities. Rockhampton is also an established services and support base for resource developments (with a growing role as a FIFO/DIDO base) in the Bowen and Surat Basins. The Capricorn Highway provides direct access to the Bowen and Galilee Basins while the Rockhampton Airport is a central access point for FIFO mine workers.
Outlook: Continued population growth will support the growth of the region’s large services base and continue to support the centre’s role in providing key services for Central Queensland residents, visitors, businesses and industries as well as surrounding areas. Growth opportunities are expected to be driven by the region’s key strengths including support services to resources, agriculture and food processing and the services sector more broadly including education and health. Opportunities for further diversification in the future are linked to the growth potential of defence support services in Shoalwater Bay which is located approximately 170 km north of Rockhampton.
The Gracemere and Yeppoon urban centres are also closely linked to Rockhampton and both have experienced strong population growth over the past decade.
Gracemere has traditionally been driven by agriculture although it is transforming into a commuter centre, providing shorter term accommodation for workers in the construction and mining industries given its proximity to and recent cost advantages over Gladstone. Now that heavy transport access from the Capricorn Highway has been completed, the Gracemere Stanwell Corridor provides opportunities for industrial development, in particular in industries that service the resources sector. The development of the Gracemere Industrial Area within the Corridor is gathering pace with several recent investments.
Yeppoon functions as a tourist hub and recreational area for Central Queensland’s residents as well as visitors. It also offers a number of important services to those in surrounding areas including education, retail and government services.
Gladstone Role: Gladstone is the key trade and transport hub for Central Queensland and in particular, plays a significant role in the resources sector within Central Queensland as well as on a national and international scale due to its large port and associated infrastructure and the area’s connectedness to the surrounding resources projects. The city provides the region with well-developed infrastructure and services including education. Gladstone and its surrounds are home to the world’s largest alumina refineries.
Central Queensland – Economic and Infrastructure Framework � - 75-
Outlook: Strong population growth will drive employment opportunities in the services industries, particularly in the Gladstone urban centre where the bulk of businesses and households are located. Gladstone’s major role within the transport, resources and energy industries provides significant supply chain and employment opportunities, supported by a strong investment pipeline of major projects. There are also opportunities for industrial expansion due to the availability of industrial land and the supporting transport infrastructure that connects the GSDA to port facilities among other locations. This will stimulate manufacturing and related services industries.
Linked strongly to Gladstone is Tannum Sands – Boyne Island as well as the dormitory role of Calliope in supporting industrial development in both Gladstone and Tannum Sands – Boyne Island. As a result, potential focus should be on facilitating connectivity within the region.
Tannum Sands – Boyne Island is in close proximity to Gladstone city and the coast (Great Barrier Reef) with a growing role in tourism, leisure and other services including retail trade, residential land property, health and business services. Boyne Smelter is located at Boyne Island and is a major employer. It is also home to a large number of residents and visitors with the skill sets to support resources development including professional, scientific and technical services and construction in Central Queensland.
Emerald Role: Emerald is the largest urban centre of the Central Highlands LGA and provides support to economic activity including mining and mining services including supply chain and training.
Outlook: There are significant opportunities in mining and mining services as Emerald is an established service centre for mining as well as a growing tourism market (including business related tourism). There are opportunities for expansion in agricultural industries in the region and a cropping area south of Emerald known as the golden triangle (small towns including Orion, Gindie, Rolleston and Springsure) due to generally favourable market conditions and supporting local factors including infrastructure and natural resources.
Biloela Role: The centre is driven by agricultural and food manufacturing with mining playing a growing role. This has led to the town airport providing services regularly utilised by FIFO workers. The FIFO and DIDO workforce of Biloela is relatively large and is expected to grow. Accommodating this transient workforce will be critical to the future of the town. In 2012, the number of non-resident workers on shift rose to 360 persons, an increase of 110 on a year ago.18
18 Source: Bowen Basin Population Report, 2012. Queensland Treasury and Trade (Government Statistician)
Central Queensland – Economic and Infrastructure Framework � - 76-
Outlook: The region’s established food manufacturing and agricultural base provides ongoing growth opportunities in line with favourable market conditions over the medium term. Biloela is a smaller mining centre and the growth of the LNG industry offers some prospects for local supply chain opportunities.
Blackwater Role: The centre predominantly acts as a mining hub. Six large-scale open-cut coal mines and one underground mine operate in the areas surrounding Blackwater and provide its main employment opportunities. Rapid growth of the surrounding resources industry and increasing population in and around the town, mostly as a result of resources sector employees and families, both permanent and temporary, impacts service and facility provision and ongoing strategic planning and development. Blackwater is one of the top five urban centres/localities in the Bowen Basin in terms of the number of non-resident workers on shift. In 2012, the number of non-resident workers on shift rose to 1885 persons, from 1650 persons in 2011.19
Outlook: Harnessing the potential in surrounding resources developments will continue to provide key growth opportunities. The provision of infrastructure and services and developing appropriate, affordable housing are the most prominent growth challenges facing the town in the near future. The region also has established agricultural industries which provide incremental growth opportunities.
Socio-economic profile This section provides a snapshot and baseline data which will assist in better understanding the trends and roles of regional centres.
Estimated Resident Population Table 2A reports analysis of long term growth in the estimated resident population of the urban centres and localities within the LGAs that comprise the Central Queensland region.20 The Banana LGA, Biloela and Moura are the two urban centres with Biloela the larger of the two in terms of estimated resident population. Biloela experienced moderate growth while Moura experienced a slight decline (localities in the Banana LGA also experienced a decline over the 10 years to 2011 on average). In the Central Highlands LGA, Emerald is the largest urban centre. Emerald also experienced strong growth in estimated resident population over the decade to 2011 (an average annual growth rate of 2.6 per cent which was above the state average over the same period). Blackwater is the second largest urban centre in the Central Highlands LGA and experienced an increase in resident population between 2001 and 2011 (although this declined over the five years to 2011 on average). In the
19 Ibid. 20 The Urban Centres and Localities (UCL) structure provides a definition of urban centres and localities. In this section the focus of the analysis is on the larger urban centres. The level of statistical information at this level is less detailed than the SA2 level and as a result, to provide a more detailed assessment of growth within the region, much of the analysis presented in this section is focused on SA2s (in particular those that have a major urban centre located within them).

Central Queensland – Economic and Infrastructure Framework � - 77-
Gladstone LGA there are three urban centres, Gladstone, Tannum Sands – Boyne Island and Calliope.
Table 2A Estimated resident population – urban centres and localities Estimated Resident Population 2001 to 2011 2006 to 2011 Urban Centres by LGA 2001 2006 2011 CAGR Change CAGR Change Banana (S) Biloela 5,689 5,892 5,987 0.5 298 0.3 95 Moura 1,844 1,892 1,744 -0.6 -100 -1.6 -148 Localities 1,766 1,811 1,635 -0.8 -131 -2.0 -176 Central Highlands (R) Blackwater 4,763 5,381 5,052 0.6 289 -1.3 -329 Emerald 10,220 12,105 13,243 2.6 3,023 1.8 1,138 Tieri 1,557 1,731 1,511 -0.3 -46 -2.7 -220 Localities 3,448 3,741 3,763 0.9 315 0.1 22 Gladstone (R) Calliope 1,391 1,789 3,123 8.4 1,732 11.8 1,334 Gladstone 26,682 30,650 32,954 2.1 6,272 1.5 2,304 Tannum Sands - Boyne Island 7,872 9,103 9,600 2.0 1,728 1.1 497 Localities 1,888 2,317 2,711 3.7 823 3.2 394 Rockhampton (R) Emu Park 2,762 3,155 3,808 3.3 1,046 3.8 653 Gracemere 4,460 5,794 8,335 6.5 3,875 7.5 2,541 Mount Morgan 2,621 2,684 2,617 0.0 -4 -0.5 -67 Rockhampton 60,047 64,143 63,634 0.6 3,587 -0.2 -509 Yeppoon 11,898 14,074 15,537 2.7 3,639 2.0 1,463 Localities 2,799 3,035 3,279 1.6 480 1.6 244 Woorabinda (S) Woorabinda (L) 1,027 918 975 -0.5 -52 1.2 57
Source: Data accessed from Queensland Treasury and Trade, Government Statistician and based on ABS, Regional Population Growth, Australia, 2011, (Cat. No. 3218.0), ASGS 2011 Notes: Population estimates for 2001 to 2006 are final. Estimates for 2007 to 2011 are preliminary rebased, based on the results of the 2011 Census and final estimates for these years will be released in August 2013, CAGR: compound annual growth rate, (L): locality
Non-resident workers The Gladstone urban centre accounts for the majority of the estimated resident population and experienced a similar growth rate to Tannum Sands-Boyne Island over the decade to 2011. Calliope experienced very fast growth, albeit from a small base over the same period. The Rockhampton LGA has five urban centres with the fastest growth rates recorded in the Gracemere, Emu Park and Yeppoon urban centres over the 10 years to 2011. However, the Rockhampton urban centre still accounts for the vast majority of the resident population growth in the regional council.
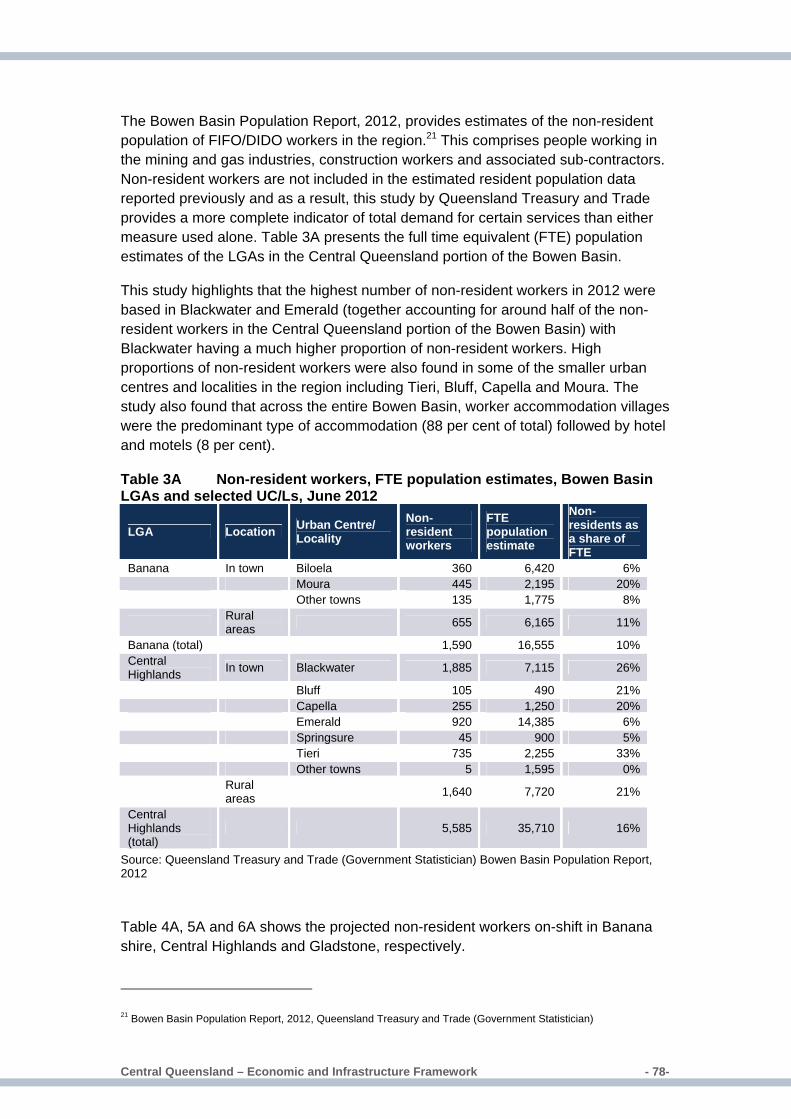
Central Queensland – Economic and Infrastructure Framework � - 78-
The Bowen Basin Population Report, 2012, provides estimates of the non-resident population of FIFO/DIDO workers in the region.21 This comprises people working in the mining and gas industries, construction workers and associated sub-contractors. Non-resident workers are not included in the estimated resident population data reported previously and as a result, this study by Queensland Treasury and Trade provides a more complete indicator of total demand for certain services than either measure used alone. Table 3A presents the full time equivalent (FTE) population estimates of the LGAs in the Central Queensland portion of the Bowen Basin.
This study highlights that the highest number of non-resident workers in 2012 were based in Blackwater and Emerald (together accounting for around half of the non-resident workers in the Central Queensland portion of the Bowen Basin) with Blackwater having a much higher proportion of non-resident workers. High proportions of non-resident workers were also found in some of the smaller urban centres and localities in the region including Tieri, Bluff, Capella and Moura. The study also found that across the entire Bowen Basin, worker accommodation villages were the predominant type of accommodation (88 per cent of total) followed by hotel and motels (8 per cent).
Table 3A Non-resident workers, FTE population estimates, Bowen Basin LGAs and selected UC/Ls, June 2012
LGA Location Urban Centre/ Locality
Non-resident workers
FTE population estimate
Non-residents as a share of FTE
Banana In town Biloela 360 6,420 6% Moura 445 2,195 20% Other towns 135 1,775 8%
Rural areas 655 6,165 11%
Banana (total) 1,590 16,555 10% Central Highlands In town Blackwater 1,885 7,115 26%
Bluff 105 490 21% Capella 255 1,250 20% Emerald 920 14,385 6% Springsure 45 900 5% Tieri 735 2,255 33% Other towns 5 1,595 0%
Rural areas 1,640 7,720 21%
Central Highlands (total)
5,585 35,710 16%
Source: Queensland Treasury and Trade (Government Statistician) Bowen Basin Population Report, 2012
Table 4A, 5A and 6A shows the projected non-resident workers on-shift in Banana shire, Central Highlands and Gladstone, respectively.
21 Bowen Basin Population Report, 2012, Queensland Treasury and Trade (Government Statistician)
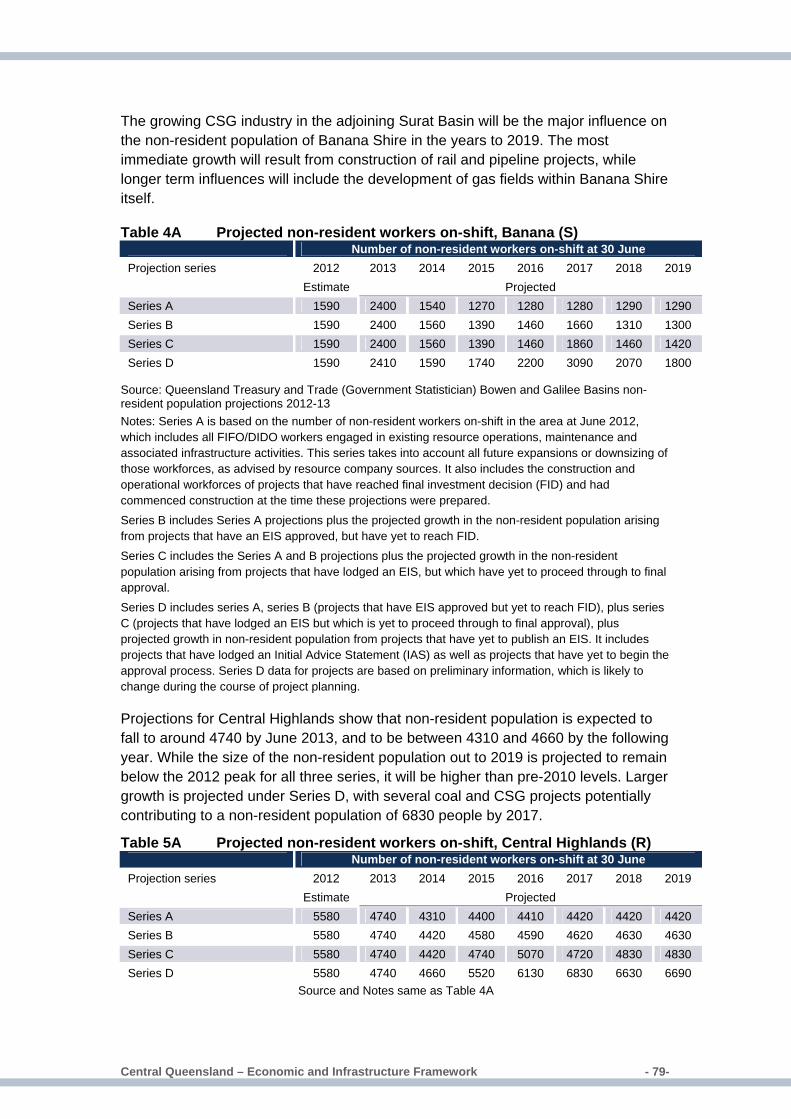
Central Queensland – Economic and Infrastructure Framework � - 79-
The growing CSG industry in the adjoining Surat Basin will be the major influence on the non-resident population of Banana Shire in the years to 2019. The most immediate growth will result from construction of rail and pipeline projects, while longer term influences will include the development of gas fields within Banana Shire itself.
Table 4A Projected non-resident workers on-shift, Banana (S) Number of non-resident workers on-shift at 30 June Projection series 2012 2013 2014 2015 2016 2017 2018 2019 Estimate Projected Series A 1590 2400 1540 1270 1280 1280 1290 1290 Series B 1590 2400 1560 1390 1460 1660 1310 1300 Series C 1590 2400 1560 1390 1460 1860 1460 1420 Series D 1590 2410 1590 1740 2200 3090 2070 1800
Source: Queensland Treasury and Trade (Government Statistician) Bowen and Galilee Basins non-resident population projections 2012-13 Notes: Series A is based on the number of non-resident workers on-shift in the area at June 2012, which includes all FIFO/DIDO workers engaged in existing resource operations, maintenance and associated infrastructure activities. This series takes into account all future expansions or downsizing of those workforces, as advised by resource company sources. It also includes the construction and operational workforces of projects that have reached final investment decision (FID) and had commenced construction at the time these projections were prepared. Series B includes Series A projections plus the projected growth in the non-resident population arising from projects that have an EIS approved, but have yet to reach FID. Series C includes the Series A and B projections plus the projected growth in the non-resident population arising from projects that have lodged an EIS, but which have yet to proceed through to final approval. Series D includes series A, series B (projects that have EIS approved but yet to reach FID), plus series C (projects that have lodged an EIS but which is yet to proceed through to final approval), plus projected growth in non-resident population from projects that have yet to publish an EIS. It includes projects that have lodged an Initial Advice Statement (IAS) as well as projects that have yet to begin the approval process. Series D data for projects are based on preliminary information, which is likely to change during the course of project planning.
Projections for Central Highlands show that non-resident population is expected to fall to around 4740 by June 2013, and to be between 4310 and 4660 by the following year. While the size of the non-resident population out to 2019 is projected to remain below the 2012 peak for all three series, it will be higher than pre-2010 levels. Larger growth is projected under Series D, with several coal and CSG projects potentially contributing to a non-resident population of 6830 people by 2017.
Table 5A Projected non-resident workers on-shift, Central Highlands (R) Number of non-resident workers on-shift at 30 June Projection series 2012 2013 2014 2015 2016 2017 2018 2019 Estimate Projected Series A 5580 4740 4310 4400 4410 4420 4420 4420 Series B 5580 4740 4420 4580 4590 4620 4630 4630 Series C 5580 4740 4420 4740 5070 4720 4830 4830 Series D 5580 4740 4660 5520 6130 6830 6630 6690
Source and Notes same as Table 4A
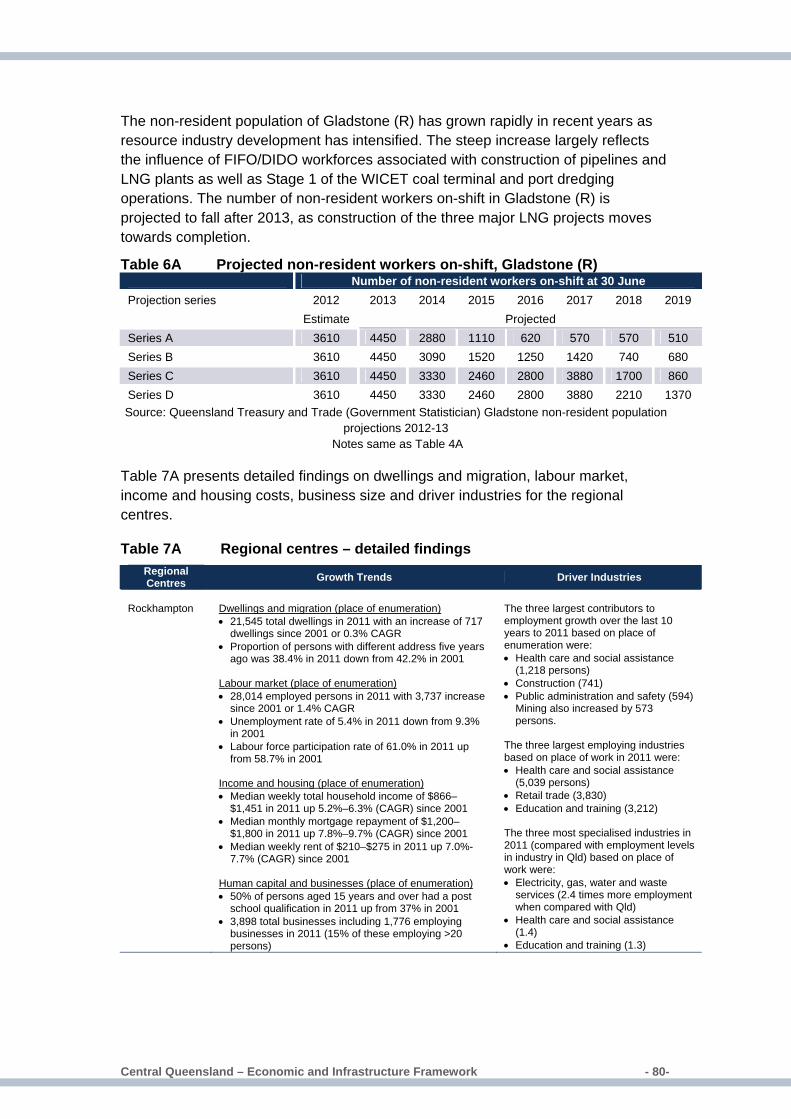
Central Queensland – Economic and Infrastructure Framework � - 80-
The non-resident population of Gladstone (R) has grown rapidly in recent years as resource industry development has intensified. The steep increase largely reflects the influence of FIFO/DIDO workforces associated with construction of pipelines and LNG plants as well as Stage 1 of the WICET coal terminal and port dredging operations. The number of non-resident workers on-shift in Gladstone (R) is projected to fall after 2013, as construction of the three major LNG projects moves towards completion.
Table 6A Projected non-resident workers on-shift, Gladstone (R) Number of non-resident workers on-shift at 30 June Projection series 2012 2013 2014 2015 2016 2017 2018 2019 Estimate Projected Series A 3610 4450 2880 1110 620 570 570 510 Series B 3610 4450 3090 1520 1250 1420 740 680 Series C 3610 4450 3330 2460 2800 3880 1700 860 Series D 3610 4450 3330 2460 2800 3880 2210 1370 Source: Queensland Treasury and Trade (Government Statistician) Gladstone non-resident population
projections 2012-13 Notes same as Table 4A
Table 7A presents detailed findings on dwellings and migration, labour market, income and housing costs, business size and driver industries for the regional centres.
Table 7A Regional centres – detailed findings Regional Centres Growth Trends Driver Industries
Rockhampton
Dwellings and migration (place of enumeration) • 21,545 total dwellings in 2011 with an increase of 717
dwellings since 2001 or 0.3% CAGR • Proportion of persons with different address five years
ago was 38.4% in 2011 down from 42.2% in 2001 Labour market (place of enumeration) • 28,014 employed persons in 2011 with 3,737 increase
since 2001 or 1.4% CAGR • Unemployment rate of 5.4% in 2011 down from 9.3%
in 2001 • Labour force participation rate of 61.0% in 2011 up
from 58.7% in 2001 Income and housing (place of enumeration) • Median weekly total household income of $866–
$1,451 in 2011 up 5.2%–6.3% (CAGR) since 2001 • Median monthly mortgage repayment of $1,200–
$1,800 in 2011 up 7.8%–9.7% (CAGR) since 2001 • Median weekly rent of $210–$275 in 2011 up 7.0%-
7.7% (CAGR) since 2001 Human capital and businesses (place of enumeration) • 50% of persons aged 15 years and over had a post
school qualification in 2011 up from 37% in 2001 • 3,898 total businesses including 1,776 employing
businesses in 2011 (15% of these employing >20 persons)
The three largest contributors to employment growth over the last 10 years to 2011 based on place of enumeration were: • Health care and social assistance
(1,218 persons) • Construction (741) • Public administration and safety (594)
Mining also increased by 573 persons.
The three largest employing industries based on place of work in 2011 were: • Health care and social assistance
(5,039 persons) • Retail trade (3,830) • Education and training (3,212) The three most specialised industries in 2011 (compared with employment levels in industry in Qld) based on place of work were: • Electricity, gas, water and waste
services (2.4 times more employment when compared with Qld)
• Health care and social assistance (1.4)
• Education and training (1.3)
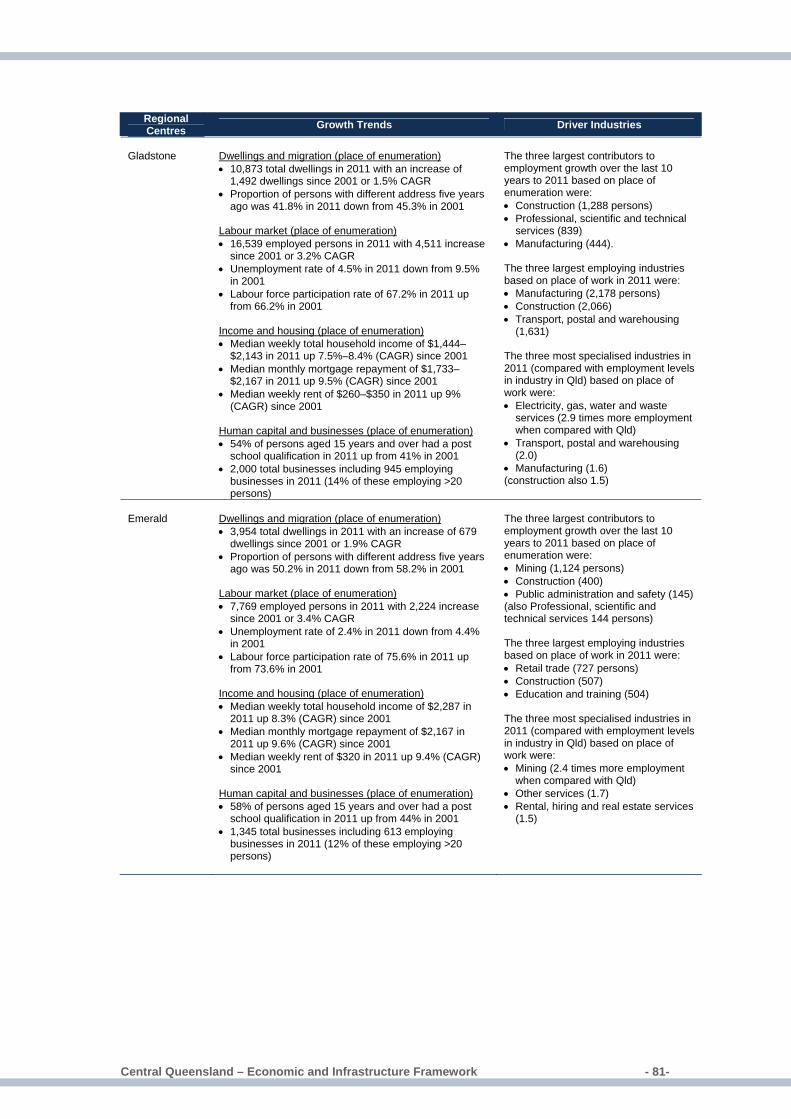
Central Queensland – Economic and Infrastructure Framework � - 81-
Regional Centres Growth Trends Driver Industries
Gladstone
Dwellings and migration (place of enumeration) • 10,873 total dwellings in 2011 with an increase of
1,492 dwellings since 2001 or 1.5% CAGR • Proportion of persons with different address five years
ago was 41.8% in 2011 down from 45.3% in 2001 Labour market (place of enumeration) • 16,539 employed persons in 2011 with 4,511 increase
since 2001 or 3.2% CAGR • Unemployment rate of 4.5% in 2011 down from 9.5%
in 2001 • Labour force participation rate of 67.2% in 2011 up
from 66.2% in 2001 Income and housing (place of enumeration) • Median weekly total household income of $1,444–
$2,143 in 2011 up 7.5%–8.4% (CAGR) since 2001 • Median monthly mortgage repayment of $1,733–
$2,167 in 2011 up 9.5% (CAGR) since 2001 • Median weekly rent of $260–$350 in 2011 up 9%
(CAGR) since 2001 Human capital and businesses (place of enumeration) • 54% of persons aged 15 years and over had a post
school qualification in 2011 up from 41% in 2001 • 2,000 total businesses including 945 employing
businesses in 2011 (14% of these employing >20 persons)
The three largest contributors to employment growth over the last 10 years to 2011 based on place of enumeration were: • Construction (1,288 persons) • Professional, scientific and technical
services (839) • Manufacturing (444). The three largest employing industries based on place of work in 2011 were: • Manufacturing (2,178 persons) • Construction (2,066) • Transport, postal and warehousing
(1,631) The three most specialised industries in 2011 (compared with employment levels in industry in Qld) based on place of work were: • Electricity, gas, water and waste
services (2.9 times more employment when compared with Qld)
• Transport, postal and warehousing (2.0)
• Manufacturing (1.6) (construction also 1.5)
Emerald
Dwellings and migration (place of enumeration) • 3,954 total dwellings in 2011 with an increase of 679
dwellings since 2001 or 1.9% CAGR • Proportion of persons with different address five years
ago was 50.2% in 2011 down from 58.2% in 2001 Labour market (place of enumeration) • 7,769 employed persons in 2011 with 2,224 increase
since 2001 or 3.4% CAGR • Unemployment rate of 2.4% in 2011 down from 4.4%
in 2001 • Labour force participation rate of 75.6% in 2011 up
from 73.6% in 2001 Income and housing (place of enumeration) • Median weekly total household income of $2,287 in
2011 up 8.3% (CAGR) since 2001 • Median monthly mortgage repayment of $2,167 in
2011 up 9.6% (CAGR) since 2001 • Median weekly rent of $320 in 2011 up 9.4% (CAGR)
since 2001 Human capital and businesses (place of enumeration) • 58% of persons aged 15 years and over had a post
school qualification in 2011 up from 44% in 2001 • 1,345 total businesses including 613 employing
businesses in 2011 (12% of these employing >20 persons)
The three largest contributors to employment growth over the last 10 years to 2011 based on place of enumeration were: • Mining (1,124 persons) • Construction (400) • Public administration and safety (145) (also Professional, scientific and technical services 144 persons) The three largest employing industries based on place of work in 2011 were: • Retail trade (727 persons) • Construction (507) • Education and training (504) The three most specialised industries in 2011 (compared with employment levels in industry in Qld) based on place of work were: • Mining (2.4 times more employment
when compared with Qld) • Other services (1.7) • Rental, hiring and real estate services
(1.5)
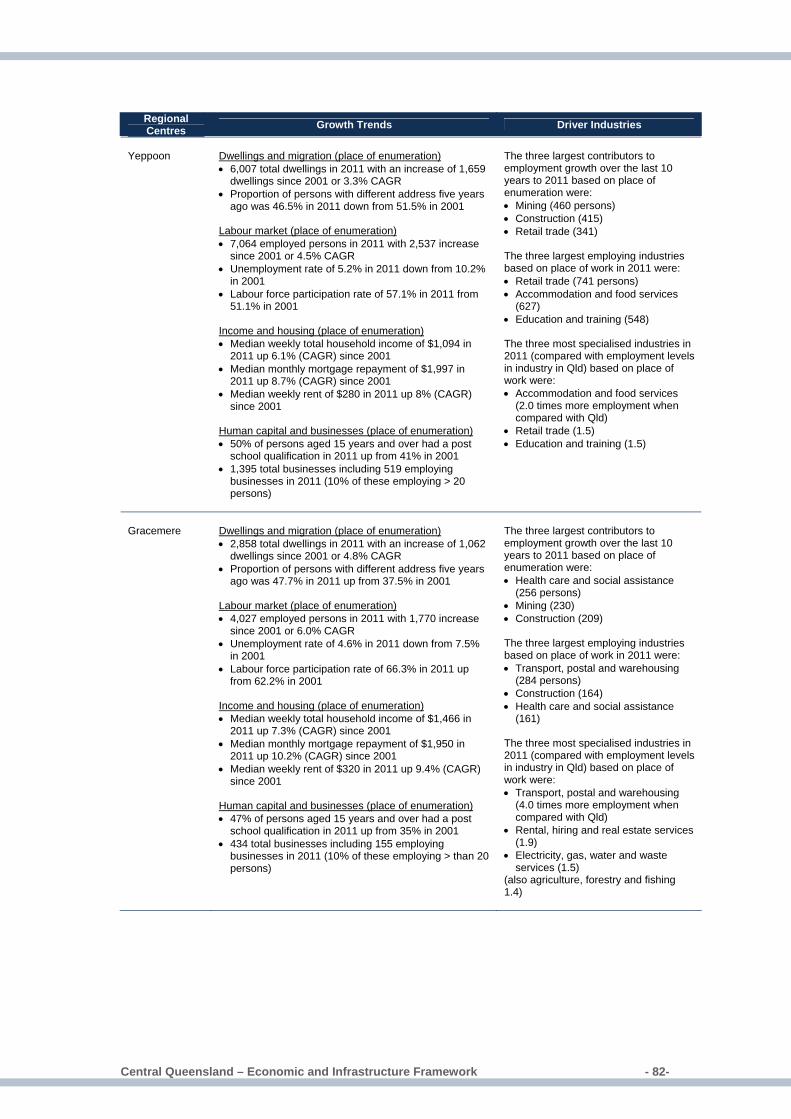
Central Queensland – Economic and Infrastructure Framework � - 82-
Regional Centres Growth Trends Driver Industries
Yeppoon
Dwellings and migration (place of enumeration) • 6,007 total dwellings in 2011 with an increase of 1,659
dwellings since 2001 or 3.3% CAGR • Proportion of persons with different address five years
ago was 46.5% in 2011 down from 51.5% in 2001 Labour market (place of enumeration) • 7,064 employed persons in 2011 with 2,537 increase
since 2001 or 4.5% CAGR • Unemployment rate of 5.2% in 2011 down from 10.2%
in 2001 • Labour force participation rate of 57.1% in 2011 from
51.1% in 2001 Income and housing (place of enumeration) • Median weekly total household income of $1,094 in
2011 up 6.1% (CAGR) since 2001 • Median monthly mortgage repayment of $1,997 in
2011 up 8.7% (CAGR) since 2001 • Median weekly rent of $280 in 2011 up 8% (CAGR)
since 2001 Human capital and businesses (place of enumeration) • 50% of persons aged 15 years and over had a post
school qualification in 2011 up from 41% in 2001 • 1,395 total businesses including 519 employing
businesses in 2011 (10% of these employing > 20 persons)
The three largest contributors to employment growth over the last 10 years to 2011 based on place of enumeration were: • Mining (460 persons) • Construction (415) • Retail trade (341) The three largest employing industries based on place of work in 2011 were: • Retail trade (741 persons) • Accommodation and food services
(627) • Education and training (548) The three most specialised industries in 2011 (compared with employment levels in industry in Qld) based on place of work were: • Accommodation and food services
(2.0 times more employment when compared with Qld)
• Retail trade (1.5) • Education and training (1.5)
Gracemere
Dwellings and migration (place of enumeration) • 2,858 total dwellings in 2011 with an increase of 1,062
dwellings since 2001 or 4.8% CAGR • Proportion of persons with different address five years
ago was 47.7% in 2011 up from 37.5% in 2001 Labour market (place of enumeration) • 4,027 employed persons in 2011 with 1,770 increase
since 2001 or 6.0% CAGR • Unemployment rate of 4.6% in 2011 down from 7.5%
in 2001 • Labour force participation rate of 66.3% in 2011 up
from 62.2% in 2001 Income and housing (place of enumeration) • Median weekly total household income of $1,466 in
2011 up 7.3% (CAGR) since 2001 • Median monthly mortgage repayment of $1,950 in
2011 up 10.2% (CAGR) since 2001 • Median weekly rent of $320 in 2011 up 9.4% (CAGR)
since 2001 Human capital and businesses (place of enumeration) • 47% of persons aged 15 years and over had a post
school qualification in 2011 up from 35% in 2001 • 434 total businesses including 155 employing
businesses in 2011 (10% of these employing > than 20 persons)
The three largest contributors to employment growth over the last 10 years to 2011 based on place of enumeration were: • Health care and social assistance
(256 persons) • Mining (230) • Construction (209) The three largest employing industries based on place of work in 2011 were: • Transport, postal and warehousing
(284 persons) • Construction (164) • Health care and social assistance
(161) The three most specialised industries in 2011 (compared with employment levels in industry in Qld) based on place of work were: • Transport, postal and warehousing
(4.0 times more employment when compared with Qld)
• Rental, hiring and real estate services (1.9)
• Electricity, gas, water and waste services (1.5)
(also agriculture, forestry and fishing 1.4)
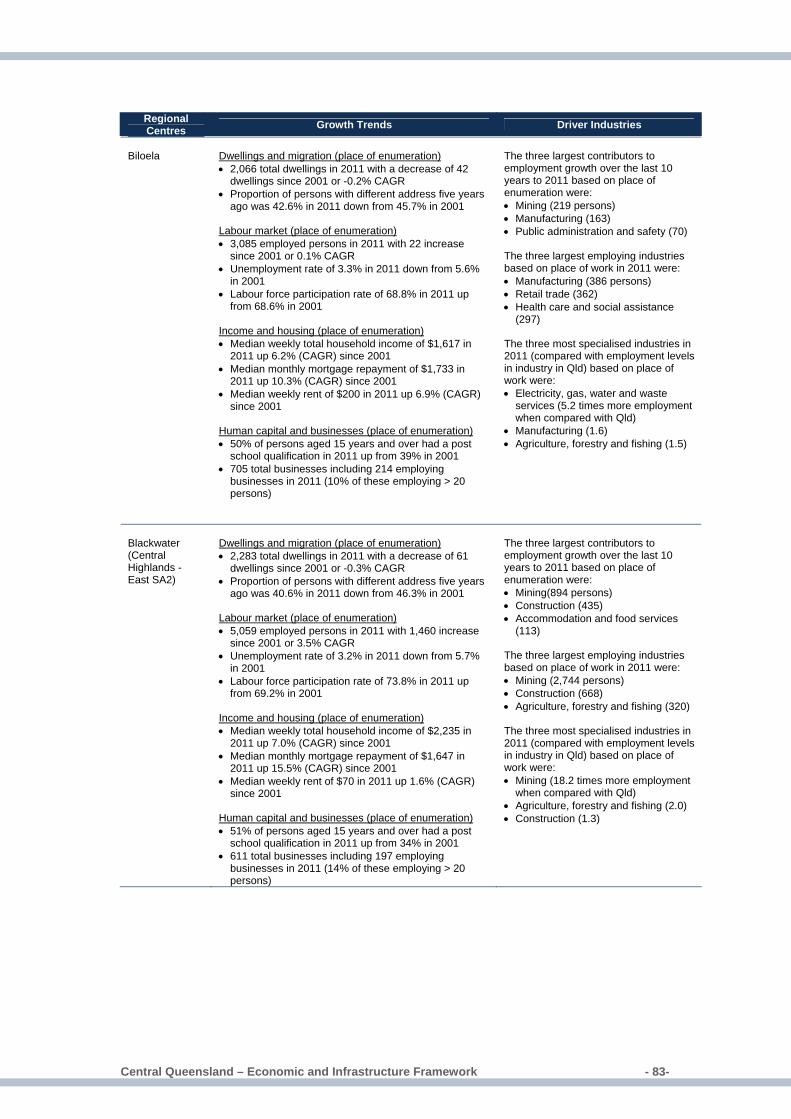
Central Queensland – Economic and Infrastructure Framework � - 83-
Regional Centres Growth Trends Driver Industries
Biloela
Dwellings and migration (place of enumeration) • 2,066 total dwellings in 2011 with a decrease of 42
dwellings since 2001 or -0.2% CAGR • Proportion of persons with different address five years
ago was 42.6% in 2011 down from 45.7% in 2001 Labour market (place of enumeration) • 3,085 employed persons in 2011 with 22 increase
since 2001 or 0.1% CAGR • Unemployment rate of 3.3% in 2011 down from 5.6%
in 2001 • Labour force participation rate of 68.8% in 2011 up
from 68.6% in 2001 Income and housing (place of enumeration) • Median weekly total household income of $1,617 in
2011 up 6.2% (CAGR) since 2001 • Median monthly mortgage repayment of $1,733 in
2011 up 10.3% (CAGR) since 2001 • Median weekly rent of $200 in 2011 up 6.9% (CAGR)
since 2001 Human capital and businesses (place of enumeration) • 50% of persons aged 15 years and over had a post
school qualification in 2011 up from 39% in 2001 • 705 total businesses including 214 employing
businesses in 2011 (10% of these employing > 20 persons)
The three largest contributors to employment growth over the last 10 years to 2011 based on place of enumeration were: • Mining (219 persons) • Manufacturing (163) • Public administration and safety (70) The three largest employing industries based on place of work in 2011 were: • Manufacturing (386 persons) • Retail trade (362) • Health care and social assistance
(297) The three most specialised industries in 2011 (compared with employment levels in industry in Qld) based on place of work were: • Electricity, gas, water and waste
services (5.2 times more employment when compared with Qld)
• Manufacturing (1.6) • Agriculture, forestry and fishing (1.5)
Blackwater (Central Highlands - East SA2)
Dwellings and migration (place of enumeration) • 2,283 total dwellings in 2011 with a decrease of 61
dwellings since 2001 or -0.3% CAGR • Proportion of persons with different address five years
ago was 40.6% in 2011 down from 46.3% in 2001 Labour market (place of enumeration) • 5,059 employed persons in 2011 with 1,460 increase
since 2001 or 3.5% CAGR • Unemployment rate of 3.2% in 2011 down from 5.7%
in 2001 • Labour force participation rate of 73.8% in 2011 up
from 69.2% in 2001 Income and housing (place of enumeration) • Median weekly total household income of $2,235 in
2011 up 7.0% (CAGR) since 2001 • Median monthly mortgage repayment of $1,647 in
2011 up 15.5% (CAGR) since 2001 • Median weekly rent of $70 in 2011 up 1.6% (CAGR)
since 2001 Human capital and businesses (place of enumeration) • 51% of persons aged 15 years and over had a post
school qualification in 2011 up from 34% in 2001 • 611 total businesses including 197 employing
businesses in 2011 (14% of these employing > 20 persons)
The three largest contributors to employment growth over the last 10 years to 2011 based on place of enumeration were: • Mining(894 persons) • Construction (435) • Accommodation and food services
(113) The three largest employing industries based on place of work in 2011 were: • Mining (2,744 persons) • Construction (668) • Agriculture, forestry and fishing (320) The three most specialised industries in 2011 (compared with employment levels in industry in Qld) based on place of work were: • Mining (18.2 times more employment
when compared with Qld) • Agriculture, forestry and fishing (2.0) • Construction (1.3)
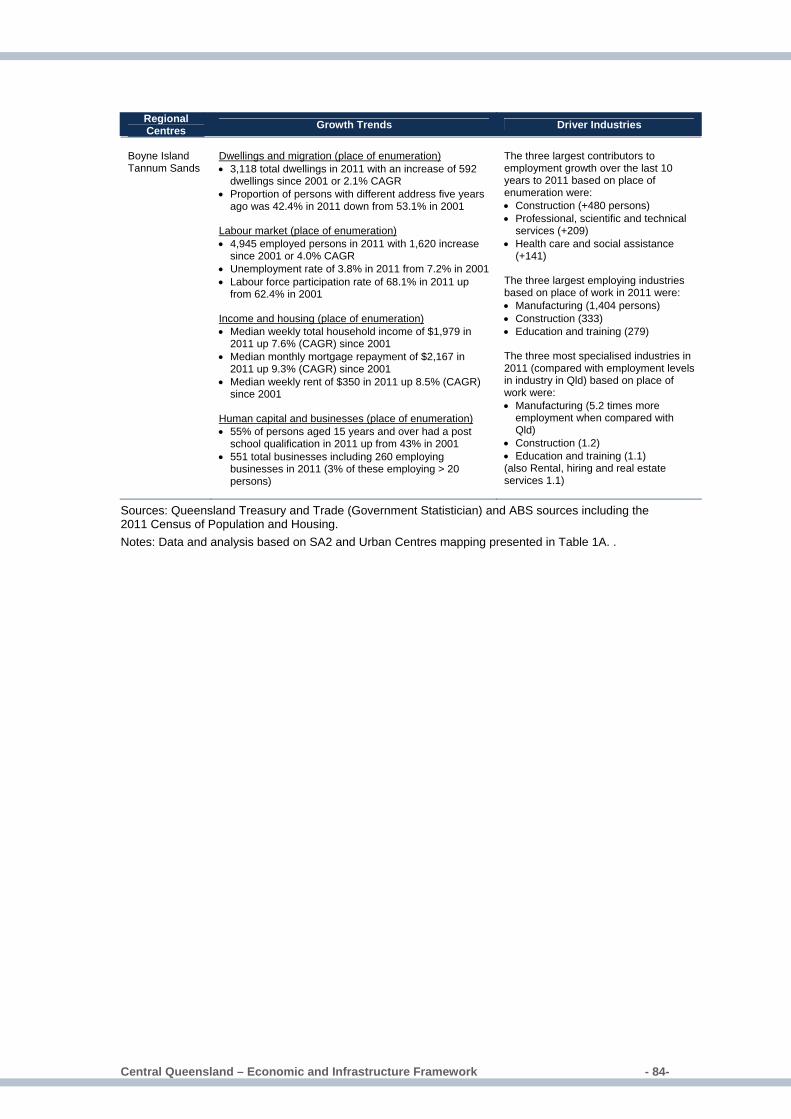
Central Queensland – Economic and Infrastructure Framework � - 84-
Regional Centres Growth Trends Driver Industries
Boyne Island Tannum Sands
Dwellings and migration (place of enumeration) • 3,118 total dwellings in 2011 with an increase of 592
dwellings since 2001 or 2.1% CAGR • Proportion of persons with different address five years
ago was 42.4% in 2011 down from 53.1% in 2001 Labour market (place of enumeration) • 4,945 employed persons in 2011 with 1,620 increase
since 2001 or 4.0% CAGR • Unemployment rate of 3.8% in 2011 from 7.2% in 2001 • Labour force participation rate of 68.1% in 2011 up
from 62.4% in 2001 Income and housing (place of enumeration) • Median weekly total household income of $1,979 in
2011 up 7.6% (CAGR) since 2001 • Median monthly mortgage repayment of $2,167 in
2011 up 9.3% (CAGR) since 2001 • Median weekly rent of $350 in 2011 up 8.5% (CAGR)
since 2001 Human capital and businesses (place of enumeration) • 55% of persons aged 15 years and over had a post
school qualification in 2011 up from 43% in 2001 • 551 total businesses including 260 employing
businesses in 2011 (3% of these employing > 20 persons)
The three largest contributors to employment growth over the last 10 years to 2011 based on place of enumeration were: • Construction (+480 persons) • Professional, scientific and technical
services (+209) • Health care and social assistance
(+141) The three largest employing industries based on place of work in 2011 were: • Manufacturing (1,404 persons) • Construction (333) • Education and training (279) The three most specialised industries in 2011 (compared with employment levels in industry in Qld) based on place of work were: • Manufacturing (5.2 times more
employment when compared with Qld)
• Construction (1.2) • Education and training (1.1) (also Rental, hiring and real estate services 1.1)
Sources: Queensland Treasury and Trade (Government Statistician) and ABS sources including the 2011 Census of Population and Housing. Notes: Data and analysis based on SA2 and Urban Centres mapping presented in Table 1A. .
Central Queensland – Economic and Infrastructure Framework � - 85-
Abbreviations ABS Australian Bureau of Statistics ADF Australian Defence Force ANZSIC Australian and New Zealand Standard Industrial Classification ASGC Australian Standard Geographical Classification ASGS Australian Statistical Geography Standard BBIF Bowen Basin Infrastructure Framework BREE Bureau of Resources and Energy Economics CAGR Compound annual growth rate CBD Central business district CQUni Central Queensland University CSG Coal seam gas DNRM Department of Natural Resources and Mines DSDIP Department of State Development, Infrastructure and Planning EPR Estimated resident population FIFO/DIDO Fly-in-fly-out / drive-in-drive-out FTE Full-time equivalent GBIF Galilee Basin Infrastructure Framework GFC Global financial crisis GRP Gross regional product GSDA Gladstone State Development Area GVA Gross value added ICN Industry Capability Network Km Kilometres kv Kilovolts LGA Local Government Area LNG Liquefied natural gas LQ Location quotient MW Megawatt NBN National Broadband Network NEM National Energy Market OSOM Over size over mass pp Percentage point QEMP Queensland Energy Management Plan RADS Regional Airport Development Scheme SMEs Small and medium enterprises SBIF Surat Basin Infrastructure Framework SWBTA Shoalwater Bat Training Area UC/L Urban Centres/Localities WICET Wiggins Island Coal Export Terminal $B Dollar billion $M Dollar million n/a Not applicable n.p. Not provided

Department of State Development, Infrastructure and Planning tel 13 QGOV (13 74 68) [email protected] www.dsdip.qld.gov.au