Calculation of UV attenuation and colored dissolved ... · Absorbance by CDOM at visible...
13
Calculation of UV attenuation and colored dissolved organic matter absorption spectra from measurements of ocean color S. C. Johannessen 1 Institute of Ocean Sciences, Contaminant Chemistry, North Saanich, British Columbia, Canada W. L. Miller and J. J. Cullen Department of Oceanography, Dalhousie University, Halifax, Nova Scotia, Canada Received 27 June 2000; revised 22 August 2001; accepted 24 February 2003; published 25 September 2003. [1] The absorption of ultraviolet and visible radiation by colored or chromophoric dissolved organic matter (CDOM) drives much of marine photochemistry. It also affects the penetration of ultraviolet radiation (UV) into the water column and can confound remote estimates of chlorophyll concentration. Measurements of ocean color from satellites can be used to predict UV attenuation and CDOM absorption spectra from relationships between visible reflectance, UV attenuation, and absorption by CDOM. Samples were taken from the Bering Sea and from the Mid-Atlantic Bight, and water types ranged from turbid, inshore waters to the Gulf Stream. We determined the following relationships between in situ visible radiance reflectance, L u /E d (l) (sr 1 ), and diffuse attenuation of UV, K d (l) (m 1 ): K d (323nm) = 0.781[L u /E d (412)/L u /E d (555)] 1.07 ; K d (338nm) = 0.604[L u /E d (412)/L u /E d (555)] 1.12 ; K d (380 nm) = 0.302[L u /E d (412)/L u / E d (555)] 1.24 . Consistent with published observations, these empirical relationships predict that the spectral slope coefficient of CDOM absorption increases as diffuse attenuation of UV decreases. Excluding samples from turbid bays, the ratio of the CDOM absorption coefficient to K d is 0.90 at 323 nm, 0.86 at 338 nm, and 0.97 at 380 nm. We applied these relationships to SeaWiFS images of normalized water-leaving radiance to calculate the CDOM absorption and UV attenuation in the Mid-Atlantic Bight in May, July, and August 1998. The images showed a decrease in UV attenuation from May to August of approximately 50%. We also produced images of the areal distribution of the spectral slope coefficient of CDOM absorption in the Georgia Bight. The spectral slope coefficient increased offshore and changed with season. INDEX TERMS: 4552 Oceanography: Physical: Ocean optics; 4850 Oceanography: Biological and Chemical: Organic marine chemistry; 4275 Oceanography: General: Remote sensing and electromagnetic processes (0689); KEYWORDS: remote sensing, SeaWiFS, colored dissolved organic matter, diffuse attenuation of downwelling radiation, K d , ultraviolet radiation Citation: Johannessen, S. C., W. L. Miller, and J. J. Cullen, Calculation of UV attenuation and colored dissolved organic matter absorption spectra from measurements of ocean color, J. Geophys. Res., 108(C9), 3301, doi:10.1029/2000JC000514, 2003. 1. Introduction [2] Colored or chromophoric dissolved organic matter in the ocean is a strong absorber of ultraviolet radiation and the precursor for many photochemical reactions. Photochemical oxidation of colored dissolved organic matter (CDOM), may explain the hitherto unknown fate of a large portion of the terrestrially derived dissolved organic carbon that enters the ocean [Kieber et al., 1989; Mopper et al., 1991]. Its photochemical products include dissolved inorganic carbon, DIC (CO 2 , HCO 3 , and CO 3 2 ); [Chen et al., 1978; Miles and Brezonik, 1981; Allard et al., 1994; Va ¨ha ¨talo et al., 2000; Miller and Zepp, 1995; Grane ´li et al., 1996; Moore, 1999], CO [Kettle, 1994; Valentine and Zepp, 1993], H 2 O 2 [Sikorski and Zika, 1993a, 1993b; Miller and Kester, 1994; Moore et al., 1993], OH . [Zhou and Mopper, 1990; Mopper and Zhou, 1990], oxygen radicals [Cooper et al., 1989; Blough and Zepp, 1995], and many small, biologically labile organic molecules [Bushaw et al., 1996; Moran and Zepp, 1997]. [3] Since CDOM is responsible for much of the atten- uation of ultraviolet radiation (UV) in the ocean [Bricaud et al., 1981], changes in the spectral CDOM absorption coefficient, a CDOM ,(l) can change the depth of penetration of UV. This is of interest to biologists, because UV is known to inhibit phytoplankton productivity [Cullen and Neale, 1994] and to damage bacteria [Jeffrey et al., 1996; Kaiser and Herndl, 1997; Jeffrey et al., 2000]. JOURNAL OF GEOPHYSICAL RESEARCH, VOL. 108, NO. C9, 3301, doi:10.1029/2000JC000514, 2003 1 Formerly at Department of Oceanography, Dalhousie University, Halifax, Nova Scotia, Canada. Copyright 2003 by the American Geophysical Union. 0148-0227/03/2000JC000514$09.00 17 - 1
-
Upload
duongxuyen -
Category
Documents
-
view
216 -
download
0
Transcript of Calculation of UV attenuation and colored dissolved ... · Absorbance by CDOM at visible...
Calculation of UV attenuation and colored dissolved organic matter
absorption spectra from measurements of ocean color
S. C. Johannessen1
Institute of Ocean Sciences, Contaminant Chemistry, North Saanich, British Columbia, Canada
W. L. Miller and J. J. CullenDepartment of Oceanography, Dalhousie University, Halifax, Nova Scotia, Canada
Received 27 June 2000; revised 22 August 2001; accepted 24 February 2003; published 25 September 2003.
[1] The absorption of ultraviolet and visible radiation by colored or chromophoricdissolved organic matter (CDOM) drives much of marine photochemistry. It also affectsthe penetration of ultraviolet radiation (UV) into the water column and can confoundremote estimates of chlorophyll concentration. Measurements of ocean color fromsatellites can be used to predict UV attenuation and CDOM absorption spectra fromrelationships between visible reflectance, UV attenuation, and absorption by CDOM.Samples were taken from the Bering Sea and from the Mid-Atlantic Bight, and water typesranged from turbid, inshore waters to the Gulf Stream. We determined the followingrelationships between in situ visible radiance reflectance, Lu/Ed (l) (sr
�1), and diffuseattenuation of UV, Kd(l) (m
�1): Kd(323nm) = 0.781[Lu/Ed(412)/Lu/Ed(555)]�1.07;
Kd(338nm) = 0.604[Lu/Ed(412)/Lu/Ed(555)]�1.12; Kd(380 nm) = 0.302[Lu/Ed(412)/Lu/
Ed(555)]�1.24. Consistent with published observations, these empirical relationships
predict that the spectral slope coefficient of CDOM absorption increases as diffuseattenuation of UV decreases. Excluding samples from turbid bays, the ratio of the CDOMabsorption coefficient to Kd is 0.90 at 323 nm, 0.86 at 338 nm, and 0.97 at 380 nm. Weapplied these relationships to SeaWiFS images of normalized water-leaving radiance tocalculate the CDOM absorption and UV attenuation in the Mid-Atlantic Bight in May,July, and August 1998. The images showed a decrease in UV attenuation from May toAugust of approximately 50%. We also produced images of the areal distribution of thespectral slope coefficient of CDOM absorption in the Georgia Bight. The spectral slopecoefficient increased offshore and changed with season. INDEX TERMS: 4552 Oceanography:
Physical: Ocean optics; 4850 Oceanography: Biological and Chemical: Organic marine chemistry; 4275
Oceanography: General: Remote sensing and electromagnetic processes (0689); KEYWORDS: remote sensing,
SeaWiFS, colored dissolved organic matter, diffuse attenuation of downwelling radiation, Kd, ultraviolet
radiation
Citation: Johannessen, S. C., W. L. Miller, and J. J. Cullen, Calculation of UV attenuation and colored dissolved organic matter
absorption spectra from measurements of ocean color, J. Geophys. Res., 108(C9), 3301, doi:10.1029/2000JC000514, 2003.
1. Introduction
[2] Colored or chromophoric dissolved organic matter inthe ocean is a strong absorber of ultraviolet radiation and theprecursor for many photochemical reactions. Photochemicaloxidation of colored dissolved organic matter (CDOM),may explain the hitherto unknown fate of a large portionof the terrestrially derived dissolved organic carbon thatenters the ocean [Kieber et al., 1989; Mopper et al., 1991].Its photochemical products include dissolved inorganiccarbon, DIC (CO2, HCO3
�, and CO3�2); [Chen et al.,
1978; Miles and Brezonik, 1981; Allard et al., 1994;Vahatalo et al., 2000; Miller and Zepp, 1995; Graneli etal., 1996; Moore, 1999], CO [Kettle, 1994; Valentine andZepp, 1993], H2O2 [Sikorski and Zika, 1993a, 1993b;Millerand Kester, 1994; Moore et al., 1993], OH. [Zhou andMopper, 1990; Mopper and Zhou, 1990], oxygen radicals[Cooper et al., 1989; Blough and Zepp, 1995], and manysmall, biologically labile organic molecules [Bushaw et al.,1996; Moran and Zepp, 1997].[3] Since CDOM is responsible for much of the atten-
uation of ultraviolet radiation (UV) in the ocean [Bricaudet al., 1981], changes in the spectral CDOM absorptioncoefficient, aCDOM,(l) can change the depth of penetrationof UV. This is of interest to biologists, because UV isknown to inhibit phytoplankton productivity [Cullenand Neale, 1994] and to damage bacteria [Jeffrey et al.,1996; Kaiser and Herndl, 1997; Jeffrey et al., 2000].
JOURNAL OF GEOPHYSICAL RESEARCH, VOL. 108, NO. C9, 3301, doi:10.1029/2000JC000514, 2003
1Formerly at Department of Oceanography, Dalhousie University,Halifax, Nova Scotia, Canada.
Copyright 2003 by the American Geophysical Union.0148-0227/03/2000JC000514$09.00
17 - 1

Absorbance by CDOM at visible wavelengths can alsointerfere with estimates of chlorophyll concentration madefrom remotely sensed data [Carder et al., 1989; Michaelsand Siegel, 1996]. To evaluate all these processes quantita-tively, it is essential to know the shape and magnitude ofthe CDOM absorption spectrum, which varies widelyamong locations and seasons [Michaels and Siegel, 1996;Højerslev, 1998].[4] A number of researchers have developed algorithms
to relate remotely sensed properties to in situ absorption orfluorescence by CDOM or to the concentration of dissolvedorganic carbon, DOC [Fenton et al., 1994; Vodacek et al.,1995; Ferrari et al., 1996]. Hochman et al. [1994] andHoge et al. [1995] used the water-leaving radiance at 443nm calculated from CZCS (Coastal Zone Color Scanner)data together with an assumed CDOM absorption spectralslope coefficient to determine aCDOM in situ. Kahru andMitchell [2001] used a ratio of SeaWiFS (Sea-viewing WideField-of-view Sensor) normalized water-leaving radiance at443 and 510 nm to calculate aCDOM at 300 nm, which theysuggested could be used with an assumed spectral slope tocalculate the full absorption spectrum.[5] In addition to the CZCS channels, SeaWiFS has a
detector for upwelling radiance at 412 nm. One of thereasons for including this sensor was to facilitate remoteestimates of dissolved organic matter [Nelson, 1997]. Here,we present empirically derived relationships that make useof measurements at 412 nm to allow the accurate calculationof aCDOM(l), the slope coefficient of the aCDOM spectrum,and UV attenuation from remotely sensed reflectance data,without the assumption of a single spectral shape for theCDOM absorption spectrum.
2. Methods
2.1. Approach
[6] Austin and Petzold [1981] showed that the diffuseattenuation coefficient for downwelling visible irradiance,Kd(l) (m�1), could be estimated from the ratio of theupwelling radiance, Lu(l), at two wavelengths measuredby CZCS. The wavelength ratio approach is also appliedto the prediction of chlorophyll concentration in surfacewaters [Gordon et al., 1983; Aiken et al., 1992], andimages of global ocean chlorophyll concentrations andK(490) are now produced routinely from SeaWiFS data(SeaWiFS Project, http://seawifs.gsfc.nasa.gov/SEAWIFS.html (verified 12 May 2000)). SeaWiFS does not have UVdetectors; atmospheric interference makes direct satellitemeasurements of UV upwelling radiance from the oceanextremely difficult. However, it seems reasonable to applythe reflectance ratio method to the UV, since the componentsof seawater which absorb UV radiation also absorb visibleradiation.[7] To produce synoptic estimates of aCDOM (l) and of
photochemical production rates from remotely sensed data,Cullen et al. [1997] suggested an approach in several stepswhich would make use of the 412 nm sensor: (1) relatesatellite measurements of water-leaving radiance to in situradiance reflectance, defined as the ratio of upwellingradiance to downwelling irradiance; (2) find empiricalrelationships between the ratio of reflectance at two visiblewavelengths (412 nm and 555 nm) and Kd at several UV
wavelengths; (3) calculate spectrally resolved total UVabsorption from Kd(UV); (4) determine the magnitude ofabsorption by particles, particularly phytoplankton; (5)subtract absorption due to particles and water from the totalto calculate the CDOM absorption; and (6) apply an actionspectrum to calculate photochemical production. The esti-mates of absorption and attenuation could be combined withmeasurements or estimates of surface irradiance to calculateabsorption by CDOM as a function of depth. We modifiedthe Cullen et al. [1997] approach by finding direct, empir-ical relationships between Kd(UV) and aCDOM atcorresponding wavelengths rather than calculating aCDOMby difference.
2.2. Sample Locations
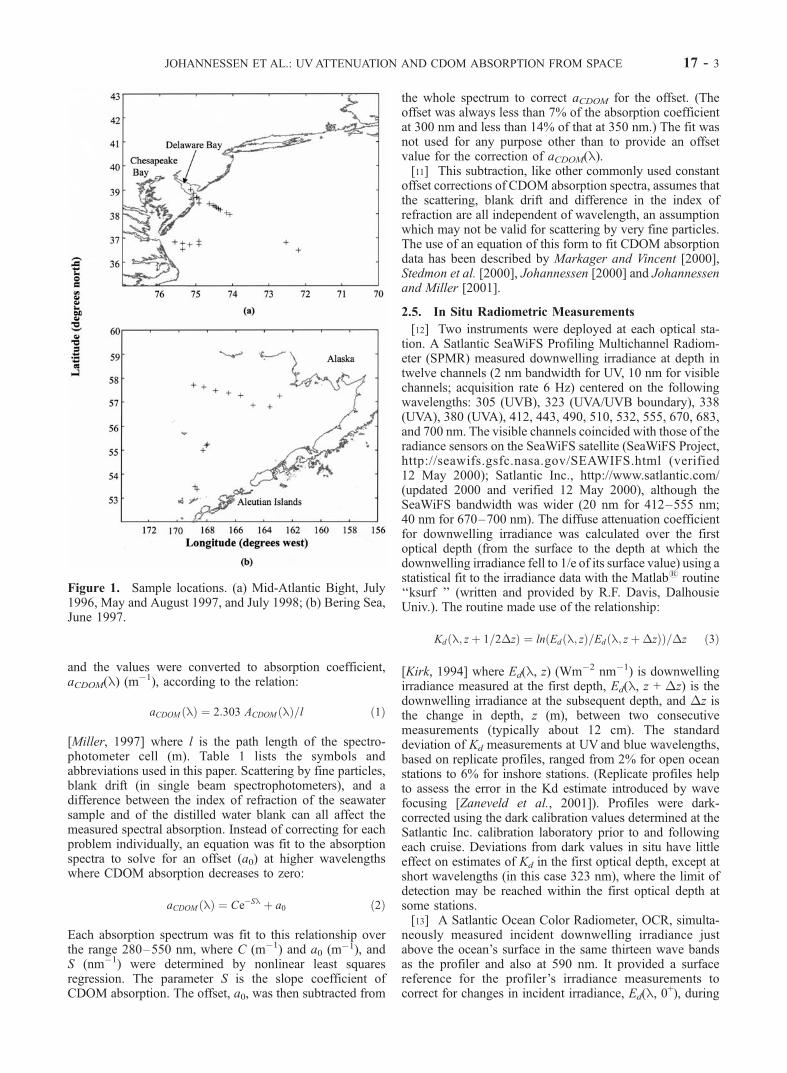
[8] Four cruises were undertaken in the Mid-AtlanticBight in the summers of 1996, 1997, and 1998 and one inthe Bering Sea in June 1997. Sample locations are shown inFigure 1. During the July 1997 cruise aboard the R/VSeward Johnson, optical casts were made at five stationsalong cross-shelf transects. Optical casts were made aboardthe R/V Cape Henlopen in May and August 1997 and inJuly 1998 at 11, 24, and 37 stations, respectively. In theBering Sea aboard the R/V Wecoma, optical casts weremade at 13 stations along a cross-shelf transect.
2.3. Sample Collection and Storage
[9] At each station water was collected from the surface,and at many stations samples were also collected frombelow the mixed layer using a CTD rosette. Water sampleswere filtered to remove particles, including bacteria; duringthe first Mid-Atlantic Bight cruise in 1997, samples werefiltered on board through Whatman GF/F (nominal pore size0.7 mm) filters and then refiltered through 0.2 mm Schleicherand Schuell Nylon 66 membrane filters on return to the lab.Water taken during the other cruises was immediatelyfiltered through 0.2 mm Schleicher and Schuell Nylon 66filters. During the August 1997 cruise, samples werepressure-filtered using a peristaltic pump with a 0.2 mmin-line filter; samples from the other cruises were vacuum-filtered. Water samples were stored for less than a year inthe dark at 4�C in amber glass bottles to minimize biologicalactivity and photochemical breakdown of CDOM. Relatedstudies on seawater have shown no measurable change inabsorption at 350 nm over three months of storage underthese conditions: measurements of CDOM absorption madeon 0.2-mm-filtered water from the Suwannee River inGeorgia showed no measurable change in absorbance afterat least three years of storage (W. L. Miller, unpublisheddata, 1995); water filtered through GF/F filters, stored forup to three months and then refiltered through 0.2 mm filterswas found to have the same absorption coefficient at 350and 440 nm as water filtered through 0.2 mm filters andmeasured immediately (S. C. Johannessen, unpublisheddata, 1997).
2.4. Absorption Measurements
[10] Spectral absorption was measured in a 10 cm quartzflow cell in a Hewlett Packard HP 8453 diode arrayspectrophotometer, blanked against Barnstead NanopureUV-treated distilled water. Spectral absorption, ACDOM(l)(dimensionless) was measured from 190 nm to 1100 nm,
17 - 2 JOHANNESSEN ET AL.: UV ATTENUATION AND CDOM ABSORPTION FROM SPACE
and the values were converted to absorption coefficient,aCDOM(l) (m
�1), according to the relation:
aCDOM lð Þ ¼ 2:303 ACDOM lð Þ=l ð1Þ
[Miller, 1997] where l is the path length of the spectro-photometer cell (m). Table 1 lists the symbols andabbreviations used in this paper. Scattering by fine particles,blank drift (in single beam spectrophotometers), and adifference between the index of refraction of the seawatersample and of the distilled water blank can all affect themeasured spectral absorption. Instead of correcting for eachproblem individually, an equation was fit to the absorptionspectra to solve for an offset (a0) at higher wavelengthswhere CDOM absorption decreases to zero:
aCDOM lð Þ ¼ Ce�Sl þ a0 ð2Þ
Each absorption spectrum was fit to this relationship overthe range 280–550 nm, where C (m�1) and a0 (m�1), andS (nm�1) were determined by nonlinear least squaresregression. The parameter S is the slope coefficient ofCDOM absorption. The offset, a0, was then subtracted from
the whole spectrum to correct aCDOM for the offset. (Theoffset was always less than 7% of the absorption coefficientat 300 nm and less than 14% of that at 350 nm.) The fit wasnot used for any purpose other than to provide an offsetvalue for the correction of aCDOM(l).[11] This subtraction, like other commonly used constant
offset corrections of CDOM absorption spectra, assumes thatthe scattering, blank drift and difference in the index ofrefraction are all independent of wavelength, an assumptionwhich may not be valid for scattering by very fine particles.The use of an equation of this form to fit CDOM absorptiondata has been described by Markager and Vincent [2000],Stedmon et al. [2000], Johannessen [2000] and Johannessenand Miller [2001].
2.5. In Situ Radiometric Measurements
[12] Two instruments were deployed at each optical sta-tion. A Satlantic SeaWiFS Profiling Multichannel Radiom-eter (SPMR) measured downwelling irradiance at depth intwelve channels (2 nm bandwidth for UV, 10 nm for visiblechannels; acquisition rate 6 Hz) centered on the followingwavelengths: 305 (UVB), 323 (UVA/UVB boundary), 338(UVA), 380 (UVA), 412, 443, 490, 510, 532, 555, 670, 683,and 700 nm. The visible channels coincided with those of theradiance sensors on the SeaWiFS satellite (SeaWiFS Project,http://seawifs.gsfc.nasa.gov/SEAWIFS.html (verified12 May 2000); Satlantic Inc., http://www.satlantic.com/(updated 2000 and verified 12 May 2000), although theSeaWiFS bandwidth was wider (20 nm for 412–555 nm;40 nm for 670–700 nm). The diffuse attenuation coefficientfor downwelling irradiance was calculated over the firstoptical depth (from the surface to the depth at which thedownwelling irradiance fell to 1/e of its surface value) using astatistical fit to the irradiance data with the Matlab1 routine‘‘ksurf ’’ (written and provided by R.F. Davis, DalhousieUniv.). The routine made use of the relationship:
Kd l; zþ 1=2�zð Þ ¼ ln Ed l; zð Þ=Edð l; zþ�zð ÞÞ=�z ð3Þ
[Kirk, 1994] where Ed(l, z) (Wm�2 nm�1) is downwellingirradiance measured at the first depth, Ed(l, z + �z) is thedownwelling irradiance at the subsequent depth, and �z isthe change in depth, z (m), between two consecutivemeasurements (typically about 12 cm). The standarddeviation of Kd measurements at UV and blue wavelengths,based on replicate profiles, ranged from 2% for open oceanstations to 6% for inshore stations. (Replicate profiles helpto assess the error in the Kd estimate introduced by wavefocusing [Zaneveld et al., 2001]). Profiles were dark-corrected using the dark calibration values determined at theSatlantic Inc. calibration laboratory prior to and followingeach cruise. Deviations from dark values in situ have littleeffect on estimates of Kd in the first optical depth, except atshort wavelengths (in this case 323 nm), where the limit ofdetection may be reached within the first optical depth atsome stations.[13] A Satlantic Ocean Color Radiometer, OCR, simulta-
neously measured incident downwelling irradiance justabove the ocean’s surface in the same thirteen wave bandsas the profiler and also at 590 nm. It provided a surfacereference for the profiler’s irradiance measurements tocorrect for changes in incident irradiance, Ed(l, 0
+), during
Figure 1. Sample locations. (a) Mid-Atlantic Bight, July1996, May and August 1997, and July 1998; (b) Bering Sea,June 1997.
JOHANNESSEN ET AL.: UV ATTENUATION AND CDOM ABSORPTION FROM SPACE 17 - 3

the profile. The OCR also measured upwelling radiance justbelow the water’s surface (depth ranged from 0 to 15 cmbelow the surface) in the same fourteen channels. Radiancereflectance (sr�1) was calculated as the ratio of upwellingradiance, Lu(l, 0�) (Wm�2 nm�1 sr�1) just below thesurface, to downwelling irradiance, Ed(l, 0+) (Wm�2
nm�1) just above the surface [from Kirk, 1994]:
Radiance reflectance lð Þ ¼ Lu l; 0�ð Þ=Ed l; 0þð Þ ð4Þ
3. Results
3.1. Calculation of Kd(L) From Reflectance
[14] The diffuse attenuation coefficient for downwellingirradiance at each of 323, 338 and 380 nm was plottedagainst several ratios of visible reflectance to find thestrongest correlation. Of the ratios tried, the ratio ofreflectance at 412 nm to reflectance at 555 nm predictedKd at 323, 338, and 380 nm most robustly (Figure 2).(Although by convention the y axis is reserved for thedependent variable, the purpose of the plot was to find anequation that could be used to predict Kd from reflec-tance.) For clarity, error bars (see ‘‘Methods’’ section) areomitted from Figure 2. Reflectance at 412 nm alonepredicted Kd at 323, 338 and 380 nm fairly well for thosestations outside of the very turbid Delaware and Ches-apeake Bays (data not shown). However, the Lu/Ed(412)/Lu/Ed(555) ratio allowed the inclusion of all stations in a
single relationship. Regressions on these data yielded thefollowing empirical relationships (n = 53):
Kd 323nmð Þ ¼ 0:781 Lu=Ed 412ð Þ=Lu½ =Ed 555ð Þ��1:07r2 ¼ 0:91
ð5Þ
Kd 338nmð Þ ¼ 0:604 Lu=Ed 412ð Þ=Lu½ =Ed 555ð Þ��1:12r2 ¼ 0:91
ð6Þ
Kd 380nmð Þ ¼ 0:302 Lu=Ed 412ð Þ=Lu½ =Ed 555ð Þ��1:24r2 ¼ 0:95
ð7Þ
3.2. Calculation of CDOM Absorption CoefficientFrom Kd
[15] CDOM is thought to be responsible for most of theUV attenuation in the ocean [Bricaud et al., 1981]. Todetermine the proportion of Kd(UV) due to CDOM, and toinvestigate how that proportion varied with location,measured aCDOM was plotted against measured Kd atcorresponding wavelengths for all stations (Figure 3). Kd
predicts aCDOM well at 323 and 338 nm, and reasonablywell at 380 nm; the correlation breaks down at longerwavelengths where other components, particularly phyto-
Table 1. Notation
Variable Definition
a(l) Total spectral absorption coefficient (m�1)a0 Spectrophotometric absorption coefficient offset (m�1)aCDOM(l) Spectral absorption coefficient of CDOM (m�1)aCDOM(fit)(l) Spectral absorption coefficient of CDOM (m�1) calculated from the
statistical fit used to determine the spectrophotometric offsetaCDOM(spec)(l) Spectral absorption coefficient of CDOM (m�1) calculated from ACDOM(l)
and not yet corrected for spectrophotometric offsetACDOM(l) Spectral absorption by CDOM measured in spectrophotometer (dimensionless)b(l) Total spectral scattering (m�1)C Constant in absorption coefficient correction equation (m�1)CDOM Colored or chromophoric dissolved organic matterD Julian day (January 1 = 1)DIC Dissolved inorganic carbone Eccentricity of the Earth’s orbit around the Sun (dimensionless)Ed(l) Incident (downwelling) spectral irradiance (W m�2 nm�1 or moles photons m�2 s�1)Ed( l, 0
+) Incident (downwelling) spectral irradiance just above the surface of the ocean(W m�2 nm�1 or moles photons m�2 s�1)
Ed(l, z) Incident (downwelling) spectral irradiance at depth (W m�2 nm�1 or moles photons m�2 s�1)Fo(l) Mean extraterrestrial spectral solar irradiance corrected for Earth-Sun distance
and orbital eccentricity (W m�2 nm�1)Ho(l) Mean extraterrestrial solar spectral irradiance (W m�2 nm�1)Kd(l) Spectral diffuse attenuation coefficient for downwelling irradiance (m�1)l Wavelength (nm)l Path length (m) in a spectrophotometerLu(l, 0
�) Upwelling spectral radiance just below the surface of the ocean (W m�2 nm�1 sr�1)Lu(l)/Ed(l) Spectral radiance reflectance (sr�1)Lw(l, 0
+) Upwelling (water-leaving) spectral radiance just above the surface of the ocean(W m�2 nm�1 sr�1)
�md (l) Average cosine of downwelling irradiance (dimensionless)
nLw(l) Normalized water-leaving spectral radiance (W m�2 nm�1 sr�1)S Slope coefficient of CDOM absorption (nm�1)SKd Slope coefficient of Kd (nm
�1)SeaWiFS Sea-viewing Wide Field-of-view SensorUV Ultraviolet radiationz Depth (m)
17 - 4 JOHANNESSEN ET AL.: UV ATTENUATION AND CDOM ABSORPTION FROM SPACE

plankton pigments, absorb more strongly. Kd and aCDOMseem to be related linearly. The following regression equa-tions were determined for water taken from a wide varietyof environments—from coastal to off shelf, blue waters inthe Bering Sea and from the coast to the Gulf Stream in theMid-Atlantic Bight (n = 33):
aCDOM 323ð Þ ¼ 0:904 Kd 323ð Þ � 0:00714; r2 ¼ 0:93 ð8Þ
aCDOM 338ð Þ ¼ 0:858 Kd 338ð Þ � 0:0190; r2 ¼ 0:92 ð9Þ
aCDOM 380ð Þ ¼ 0:972 Kd 380ð Þ � 0:0171; r2 ¼ 0:66 ð10Þ
Table 2 gives 95% confidence intervals for the slopecoefficients and intercepts given in equations (8)–(13). Theintercept values above are within the uncertainty of theabsorption measurements, and Table 2 shows that 0 is wellwithin their 95% confidence intervals. This suggests that ateach UV wavelength, CDOM absorption contributes aconstant proportion of attenuation. (A small negative
intercept is consistent with contributions to absorption fromother sources.) We found that the six samples from insidethe turbid Delaware and Chesapeake Bays did not fit theabove relationships. However, while the number of baysamples was too low to give convincing statistics, the plotsof aCDOM versus Kd for these samples were also strikinglylinear (Figure 3 inset). The equations of the best fitregression lines to the bay data are:
aCDOM 323ð Þ ¼ 0:308 Kd 323ð Þ þ 0:0463; r2 ¼ 0:97; n ¼ 5
ð11Þ
aCDOM 338ð Þ ¼ 0:259 Kd 338ð Þ þ 0:171; r2 ¼ 0:94; n ¼ 6 ð12Þ
aCDOM 380ð Þ ¼ 0:183 Kd 380ð Þ þ 0:400; r2 ¼ 0:97; n ¼ 5 ð13Þ
[16] The lower proportion of Kd attributable to CDOMinside the bays probably results from absorption of UV by
Figure 2. In situ diffuse attenuation coefficient for downwelling irradiance at three UV wavelengthsversus the ratio of in situ reflectances at 412 and 555 nm (n = 53) on a log-log scale. Trend lines representequations (5)–(7) in the text.
JOHANNESSEN ET AL.: UV ATTENUATION AND CDOM ABSORPTION FROM SPACE 17 - 5

organic or organically coated particles and from increasedparticle backscattering.
3.3. Calculation of Kd and CDOM AbsorptionCoefficient From Satellite Data
[17] The empirical relationships described in equations(5)–(7) were applied to three SeaWiFS archive data scenesto evaluate their use as predictors of Kd. The satellite datawere level 3, monthly binned images with 9 � 9 km
resolution from May, July, and August 1998. The satellitewas not operational during the 1996 and 1997 cruises, butthe July 1998 image includes the period of the last cruise.[18] Images of normalized water-leaving radiance at 412
and 555 nm from the Distributed Active Archive Center(from the August–September 1998 reprocessing; http://daac.gsfc.nasa.gov/(updated 10 May 2000 and verified12 May 2000)), were used to calculate a reflectance ratio(Lu/Ed (412)/Lu/Ed (555)) at each pixel as described below.
Figure 3. Absorption coefficient of CDOM versus in situ diffuse attenuation coefficient fordownwelling irradiance at three UV wavelengths (n = 33). ‘‘Bay’’ data from Delaware and ChesapeakeBays are inset. Trend lines represent equations (8)–(13) in the text. See Table 2 for confidence intervals.
17 - 6 JOHANNESSEN ET AL.: UV ATTENUATION AND CDOM ABSORPTION FROM SPACE

Normalized water leaving radiance, nLw (Wm�2 nm�1 sr�1),is related to water-leaving radiance, Lw(0
+) (Wm�2 nm�1
sr�1), by the following equation (modified from Fraser etal. [1997]):
nLw ¼ Lw 0þð Þ Fo=Ed 0þð Þð Þ ð14Þ
where Fo is mean extraterrestrial solar irradiance correctedfor Earth-Sun distance and orbital eccentricity(Wm�2 nm�1), and Ed (0+) is downwelling irradiancemeasured just above the surface of the ocean (Wm�2 nm�1).(The wavelength dependence of the variables is left implicitto simplify the equations.) Since the OCR referencemeasures upwelling radiance just below the surface of theocean, Lu(0
�) (Wm�2 nm�1 sr�1), was calculated fromLw(0
+), according to Gordon and Clark [1981]:
Lw 0þð Þ ¼ 0:57 Lu 0�ð Þ ð15Þ
Substituting for Lw(0+) in equation (14), the ratio of water-
leaving radiance at 412 nm to that at 555 nm was related tothe ratio of the measurable, in situ reflectance at thosewavelengths:
nLw 412ð ÞnLw 555ð Þ ¼
0:57 F0 412ð ÞLu 412; 0�ð Þ=Ed 412; 0þð Þ0:57 F0 555ð ÞLu 555; 0�ð Þ=Ed 555; 0þð Þ ð16Þ
Fo(412) and Fo(555) were calculated according to Gordonet al. [1983].
Fo lð Þ ¼ Ho lð Þ 1þ e cos 2 p D� 3ð Þðð =365ÞÞ2 ð17Þ
where Ho(l) is the mean extraterrestrial solar irradiance(Wm�2 nm�1), and e is the eccentricity of the Earth’s orbit(0.0167) [Gordon et al., 1983]. Gregg and Carder [1990]give the following values for Ho(l):
Ho 412ð Þ ¼ 1:812 Wm�2nm�1
Ho 555ð Þ ¼ 1:896 Wm�2nm�1
[19] Using the empirical relationships described in earliersections of this paper and the reflectance ratio Lu/Ed (412)/Lu/Ed (555) calculated from the SeaWiFS normalized water-leaving radiance values at each pixel, Kd and aCDOM werecalculated at 323, 338 and 380 nm. Figure 4 shows maps of
calculated Kd at 323 nm for May, July, and August 1998 inthe Mid-Atlantic Bight. SeaWiFS images are unreliable inareas with high concentrations of particles in the water[Kahru and Mitchell, 1999], because the algorithm used tocalculate nLw(412) relies on the assumption that all theradiation at 670 nm incident on the surface of the water isabsorbed [Fraser et al., 1997]. That assumption is not validin areas of high particle concentration. The problem is oftenmanifested in negative nearshore nLw(412) values. For thisstudy, an arbitrary cutoff value of 2.0 � 10�3 Wm�2 nm�1
sr�1 was chosen, and all pixels with nLw(412) or nLw(555)below that value were masked. Masked pixels are shown inblack in Figure 4, as is land. (Of course, the in situmeasurements of reflectance at 412 nm are not subject toatmospheric interference, so they provide a way to groundtruth the satellite measurements.)[20] While most of the in situ data were collected before
the SeaWiFS satellite was operational, values of Kd mea-sured at 323, 338, and 380 nm at three stations during theJuly 1998 cruise compared well with those calculated at thenearest pixel from the monthly binned, July 1998 SeaWiFSimage (Table 3). The stations were chosen to representmidshelf, shelf break and offshelf waters. We also comparedKd values determined in August 1997 in the Gulf Streamwith those calculated for the nearest pixel in August 1998(Table 3). The modeled Kd at 323 nm was within 10% of themeasured value at each station. The modeled values of Kd at338 and 380 nm were within 30% of the measured values atthe midshelf station and within 6% in the Gulf Stream. Atthe midshelf and shelf break stations the modeled Kd valueswere all higher than the actual values, probably as a result ofproblems with the atmospheric correction in the presence ofparticles or of a high concentration of CDOM (as explainedabove).[21] A Kd slope coefficient was calculated for each
station, using an exponential regression on the three UVKd values both modeled and determined in situ (Table 3;Figure 5). The Kd values calculated in equations (5)–(7) arenot independent of one another; they can be derived fromone another by rearranging the equations, and thus theequations specify one slope coefficient for each reflectanceratio. In fact, the slope coefficient for Kd(l) is almost exactlydescribed by the relationship, SKd = 0.0166 + 0.00674log(Lu/Ed(412)/Lu/Ed(555)), as shown in Figure 5. Thereis a unique slope for every magnitude of Kd at a givenwavelength. The slope coefficient determined for each
Table 2. Coefficients and Confidence Intervals for Relationships Between aCDOM and Kd at Three UV
Wavelengths for Offshore (n = 33) and Bay (n = 6) Samplesa
SlopeCoefficient
Slope Lower95% CL
Slope Upper95% CL Intercept
Intercept Lower95% CL
Intercept Upper95% CL
323 nmOffshore 0.904 0.809 0.998 �0.00712 �0.0771 0.0628Bay 0.308 0.203 0.414 0.0463 �0.556 0.648
338 nmOffshore 0.858 0.760 0.956 �0.0190 �0.0751 0.0370Bay 0.259 0.167 0.351 �0.171 �0.682 0.340
380 nmOffshore 0.972 0.699 1.25 �0.0171 �0.0964 0.0622Bay 0.183 0.121 0.244 0.400 0.191 0.610
aSee equations (8)– (13) in the text and Figure 3.
JOHANNESSEN ET AL.: UV ATTENUATION AND CDOM ABSORPTION FROM SPACE 17 - 7

9 km � 9 km bin using the modeled Kd values was within20% of that determined from the in situ Kd values atthe station in the same area. Clearly, the relationshipspresented above give a good estimate of UV attenuation inthe ocean.[22] We applied the relationships presented in equa-
tions (5)–(10) to produce an image of the areal distribution
Figure 4. Diffuse attenuation coefficient for downwellingirradiance (m�1) at 323 nm in the Mid-Atlantic Bight,calculated from SeaWiFS normalized water-leaving radi-ance data, binned to 9 km � 9 km, monthly resolution:(a) May 1998, (b) July 1998, and (c) August 1998.
Table
3.ComparisonofKdValues
Determined
inSituandCalculatedFrom
aSeaWiFSOcean
ColorIm
agea
Station
Station
Location
Satellite
Image
Pixel
Location
InSitu
R412/R
555
Modeled
R412/R555
%RDiff.
(Model
�In
Situ)/In
Situ
Wavelength,
nm
InSitu
Kd,m
�1
Modeled
Kd,m
�1
%KdDiff.
(Model
�In
Situ)/In
Situ
InSituKd
SlopeCoeff.,
nm
�1
Modeled
Kd
SlopeCoeff.,
nm
�1
%Slope
Coeff.Difference
(Model
�In
Situ)/In
Situ
M9807-7
38.36�N
,74.47�W
38.26�N
,74.43�W
0.827
0.672
�19
323
1.09
1.20
90.0155
0.0178
15
338
0.722
0.942
31
380
0.380
0.494
30
M9807-37
38.00�N
,74.04�W
37.85�N
,74.03�W
1.91
1.70
�11
323
0.405
0.444
10
0.0182
0.0185
2
338
0.279
0.334
20
380
0.138
0.157
14
M9807-14
37.12�N
,72.93�W
36.84�N
,73.03�W
2.27
1.78
�22
323
0.446
0.422
�6
0.0229
0.0183
�20
338
0.324
0.317
�2
380
0.122
0.148
21
M9708-15
36.02�N
,72.29�W
36.33�N
,72.23�W
7.46
6.29
�16
323
0.105
0.109
30.0200
0.0215
8
338
0.0797
0.0770
�3
380
0.0338
0.0319
�6
aFortheM9807stations,both
themeasurementsandthesatelliteim
ageweretaken
inJuly
1998.TheKdvalues
forstationM9708-15(G
ulfStream)werecalculatedfrom
insitu
measurementsin
August1997and
from
asatelliteim
ageofAugust1998.
17 - 8 JOHANNESSEN ET AL.: UV ATTENUATION AND CDOM ABSORPTION FROM SPACE

of the CDOM absorption slope coefficient in the GeorgiaBight in January and July 1999 (Figure 6) from SeaWiFSarchive images. The slope coefficients are based on theCDOM absorption coefficient at 323 and 338 nm. (SeaDAS,the program used to make the image, does not do nonlinearregressions.) Pixels where the normalized water-leavingradiance at 412 nm is unreliable, as described for Figure 4,are masked in black.[23] Using equations (5)–(10), calculated aCDOM slope
coefficients, and in situ reflectance data, we compared ourpredicted aCDOM at 350 nm with the measured absorptioncoefficients for the same station. The nonzero intercepts ofequations (8)–(10) make the determination of aCDOM andthe slope coefficient of aCDOM less certain in clear waters,where the calculated absorbance values converge to theequation intercepts. However, the aCDOM at 350 nm calcu-lated using the slope coefficients agreed with the measuredvalues to within 6–50% at various stations. We alsocompared our extrapolated aCDOM at 300 nm with thatpredicted by the Kahru and Mitchell [2001] model. Thetwo models agreed to within 10% in blue water, and 30–40% in coastal water.
4. Discussion
[24] The relationships between reflectance and Kd applyto all five cruises, over the whole summer in the Mid-Atlantic Bight, and in June in the Bering Sea (Figure 2).They describe variability over a wide range of water types,from turbid, inshore waters to clear, oligotrophic, offshorewaters, although the Bering Sea samples seem to fall as agroup somewhat lower in Kd (323 and 338 nm) than do theMid-Atlantic Bight samples. The difference between theoceans may be the result of differences in the spectralbackscattering and absorption ratios due to increased pig-ment packaging effects and/or a lower ratio of detrital tophytoplankton absorption in high-latitude than in midlati-tude waters [e.g., Mitchell, 1992; Reynolds et al., 2001].The general relationships represent the central trends for theconditions in the regions considered. They will likely be
widely applicable, although they require further testing inthe winter and in other locations.[25] The relationships between aCDOM and Kd appear to
be linear at 338 and 323 nm (Figure 3). (A linear relation-ship can also be applied to the data at 380 nm, but with lessconfidence.) Some of the scatter in Figure 3 might be due tothe variety of times of day and latitudes at which the Kd
measurements were made, which would change the geom-etry of the irradiance entering the water.[26] Kd is not the same as total absorption. It depends on
the geometric distribution of radiation, which is influencedby scattering, Sun angle and atmospheric conditions. Theaverage cosine of downwelling irradiance, md , is used toconvert from Kd(l) to a(l) according to the followingrelation [Kirk, 1994]:
a lð Þ ¼ Kd lð Þmd lð Þ ð18Þ
The relationships between aCDOM and Kd presented inequations (8)–(10) show that if md in equation (18) weretaken to be approximately 0.7 as is usual for visible radiation[seeCiotti et al., 1999], aCDOMwould be greater than the totalabsorption coefficient calculated as Kd(l)md(l). (Table 2shows that the slopes of equations (8)–(10) are significantlygreater than 0.7.) Previous work has shown the sameparadox [Morris et al., 1995; DeGrandpre et al., 1996;Mitchell et al., 2002].[27] Empirical and theoretical evidence suggests that
md must be higher than the values normally used fordiffuse visible radiation. Measurements with a HobiLabsHydroRad-4 in Lake Superior, where optical conditions aresimilar to those in the midshelf region of the Mid-AtlanticBight, show that md is higher at shorter wavelengths and is0.9 at 400 nm (A. Vodacek, personal communication, 2001).Mitchell et al. [2002] also found high values of md for UVradiation. This result is supported by theory. Kirk [1994]and Bannister [1992] show with Monte Carlo simulationsthat the asymptotic md increases as the ratio of scattering,b(l) (m�1), to total absorption, a(l) (m�1), decreases, and
Figure 5. (a) Slope coefficient of the diffuse attenuation coefficient versus diffuse attenuationcoefficient at 323 nm. The regression equation is SKd = 0.0159 � 0.00632 log(Kd(323)); r
2 = 0.9997.(b) Slope coefficient of the diffuse attenuation coefficient versus the ratio of Lu(412)/Ed(412) to Lu(555)/Ed(555). The regression equation is SKd = 0.0166 + 0.00674 log(Lu:Ed(412)/Lu:Ed(555)); r
2 = 0.9997.Both plots show the monotonic increase in the slope coefficient as attenuation decreases and reflectanceincreases. The trend is consistent with published observations.
JOHANNESSEN ET AL.: UV ATTENUATION AND CDOM ABSORPTION FROM SPACE 17 - 9

approaches 1 as b(l)/a(l) approaches 0 for verticallyincident light. The ratio b(l)/a(l) must be lower for UVthan for visible radiation: absorption increases exponentially(proportional to el)with decreasing wavelength, whilescattering only increases (with decreasing wavelength)proportionally to wavelength to the power of 0–1 [Gordon
et al., 1988] or 2 [Sathyendranath et al., 1989]. FromBannister’s [1992] model, a md of 0.9–0.97 for UV radia-tion is quite possible. The relationships between aCDOM andKd presented in equations (8)–(10) are consistent with thisrange of values of md for UV radiation. (Where individualvalues of md exceed 1, there must be an error associated with
Figure 6. Slope coefficient for CDOM absorption spectra (nm�1) in the Georgia Bight, calculated fromSeaWiFS normalized water-leaving radiance data, binned to 9 km � 9 km, monthly resolution: (a)January 1999 and (b) July 1999.
17 - 10 JOHANNESSEN ET AL.: UV ATTENUATION AND CDOM ABSORPTION FROM SPACE

the absorption and/or Kd measurements, possibly due towave focusing [e.g., Zaneveld et al., 2001].)[28] Accepting that md might be close to 1 for UV
radiation, CDOM appears to absorb about 90% of theincident UV radiation (equations (8)–(10)) in the offshoresamples. This does not seem unreasonable in the open oceanwhere most of the CDOM comes from the decomposition ofphytoplankton [Kalle, 1966], the only other open oceancomponent whose UV absorption varies seasonally. In theDelaware and Chesapeake Bays, CDOM is responsible formuch less of the total attenuation than it is offshore. Bothbays are visibly turbid, so particles probably absorb andscatter much of the incident radiation.[29] The variation among the ratios aCDOM/Kd reported at
323, 338, and 380 nm requires some explanation. It mightresult from errors in the determination of Kd, wavelength-dependent variation of md or of the b/a ratio, or fromabsorption by other components, such as the photoprotec-tive mycosporine-like amino acid pigments, MAAs. Thesepigments are produced by some phytoplankton and absorbmost strongly between 300 and 360 nm [Karentz et al.,1991; Vernet and Whitehead, 1996]. Interactions of thisnature could represent a limitation to the remote determi-nation of CDOM absorption coefficients, since, in a phyto-plankton bloom which produces a high concentration ofMAAs, the relationships developed above might not apply.The particularly high ratio of aCDOM to Kd reported for380 nm should be used with caution because of the lowcorrelation coefficient of that relationship (r2 = 0.66).[30] Figure 4 shows a distinct seasonal change in UV
attenuation. Kd at 323 nm appears to have decreased byabout 50% from May to August. Overall, the areas of lowattenuation seem to have moved northward. Both coastaland offshore areas became more transparent to UV through-out the summer, although it is not possible from theseimages to determine whether the change was due more toin situ photobleaching of water or to decreased terrestrialrunoff. Attenuation at 338 and 380 nm follows the samepattern, as does the CDOM absorption coefficient (data notshown), which is tied directly to Kd in the equations used togenerate the images. Vodacek et al. [1997] attributed ameasured summertime decrease in surface layer absorbanceby CDOM to photobleaching associated with prolongedshallow stratification of the surface layer. Increased pene-tration of UV combined with a shallowing of the surfacemixed layer must result in higher exposures of phytoplank-ton and bacteria to UV in late summer.[31] Figure 6 illustrates several points. As for Kd, the
simple relationships derived in this work do not require theassumption of a single slope coefficient for all CDOMabsorption spectra. There is a unique slope for everymagnitude of the CDOM absorption coefficient at a givenwavelength. The calculated slope coefficient of the loglinearized CDOM absorption coefficient spectrum increaseswith distance from shore in the Georgia Bight (Figure 5),from about 0.014 nm�1 close to shore to about 0.028 nm�1
offshore, which is consistent with in situ measurements byVodacek et al. [1997] (�0.01 to �0.034 nm�1 in the Mid-Atlantic Bight) and Johannessen [2000]. Seasonal changesare also apparent in this figure. In July the slope coefficientis generally higher than it is in January, and it increasesmore quickly and less smoothly with distance from shore.
Our method cannot predict changes in slope coefficientindependent of changes in the magnitude of UVattenuation.However, it is relevant that the higher slope coefficientoffshore may be due to photobleaching, as suggested byVodacek et al. [1997] for the Mid-Atlantic Bight. The moredistinct zonation apparent in the July figure may relate tolower terrestrial runoff and increased stability of the watercolumn, but it is difficult to ascertain the causes of thepatterns in these remote measurements.
5. Conclusion
[32] The empirical relationships reported here may beused to calculate UV attenuation and CDOM absorptioncoefficients from remotely sensed visible reflectance data.The relationships specify an increase of the spectral slopecoefficients for both attenuation and CDOM absorption asattenuation and absorption decrease, although the spectralslope coefficient of CDOM absorption should be used withcaution in waters with low Kd. The empirical relationshipswe describe apply over a wide range of water types, in twooceans. Their application to the Mid-Atlantic Bight shows adistinct seasonal change in UVattenuation. The aCDOM slopecoefficient image produced for the Georgia Bight shows thatthey give reasonable remote estimates for this importantoptical property. The main uses of these relationships willprobably be to correct chlorophyll algorithms, to calculatephotochemical reaction rates, and to help determine whereand when to study in situ changes in optical properties.
[33] Acknowledgments. We would like to thank R. F. Davis,C. Dempsey, R. J. Moore, J.-P. Parkhill, L. Ziolkowski, C. Fichot and theofficers and crew of the R/V Wecoma, the R/V Seward Johnson, and the R/VCape Henlopen for technical and computer assistance. Drs. J. Berwald, R.Zepp, A. Vodacek and A. Ciotti, and Mr. Y. Huot provided usefuldiscussions. We thank Dr. M. Lewis, M. MacDonald and K. Baith for helpwith the acquisition and manipulation of SeaWiFS data. We appreciate theconstructive comments of four anonymous reviewers and Assistant EditorB. G. Mitchell. The SeaWiFS Project (Code 970.2) and the DistributedActive Archive Center (Code 902) at the Goddard Space Flight Center,Greenbelt, MD 20771, under the sponsorship of NASA’s Mission to PlanetEarth Program, produced and distributed the satellite data. NSERC inCanada and ONR-Environmental Optics in the United States providedfunding for this research.
ReferencesAiken, J., G. F. Moore, and P. M. Holligan, Remote sensing of oceanicbiology in relation to global climate change, J. Phycol., 28, 579–590,1992.
Allard, B., H. Boren, C. Pettersson, and G. Zhang, Degradation of humicsubstances by UV irradiation, Environ. Int., 20, 97–101, 1994.
Austin, R. W., and T. J. Petzold, The determination of the diffuse attenua-tion coefficient of sea water using the coastal zone color scanner, inOceanography From Space, edited by J. F. R. Gower, pp. 239–256,Plenum, New York, 1981.
Bannister, T. T., Model of the mean cosine of underwater radiance andestimation of underwater scalar irradiance, Limnol. Oceanogr., 37,773–780, 1992.
Blough, N. V., and R. G. Zepp, Reactive oxygen species in natural waters,in Active Oxygen in Chemistry, edited by C. S. Foote et al., pp. 280–333,Chapman and Hall, New York, 1995.
Bricaud, A., A. Morel, and L. Prieur, Absorption by dissolved organicmatter of the sea (yellow substance) in the UV and visible domains,Limnol. Oceanogr., 26, 43–55, 1981.
Bushaw, K. L., R. G. Zepp,M. A. Tarr, D. Schulz-Jander, R. A. Boubonniere,R. E. Hodson,W. L.Miller, D. A. Bronk, andM. A.Moran, Photochemicalrelease of biologically labile nitrogen from dissolved organic matter, Nat-ure, 381, 400–404, 1996.
Carder, K. L., R. G. Steward, G. R. Harvey, and P. B. Ortner, Marine humicand fulvic acids: Their effects on remote sensing of ocean chlorophyll,Limnol. Oceanogr., 34, 68–81, 1989.
JOHANNESSEN ET AL.: UV ATTENUATION AND CDOM ABSORPTION FROM SPACE 17 - 11

Chen, Y., S. U. Khan, and M. Schnitzer, Ultraviolet irradiation of dilutefulvic acid solutions, Soil Sci. Soc. Am. J., 42, 292–296, 1978.
Ciotti, A. M., J. J. Cullen, and M. R. Lewis, A semi-analytical model of theinfluence of phytoplankton community structure on the relationshipbetween light attenuation and ocean color, J. Geophys. Res., 104,1559–1578, 1999.
Cooper, W. J., R. G. Zika, R. G. Petasne, and A. M. Fischer, Sunlight-induced photochemistry of humic substances in natural waters: Majorreactive species, in Aquatic Humic Substances: Influence on Fate andTreatment of Pollutants, edited by I. H. Suffet and P. McCarthy, pp. 332–362, Am. Chem. Soc., Washington, D. C., 1989.
Cullen, J. J., and P. J. Neale, Ultraviolet radiation, ozone depletion, andmarine photosynthesis, Photosynth. Res., 39, 303–320, 1994.
Cullen, J. J., R. F. Davis, J. S. Bartlett, and W. L. Miller, Toward remotesensing of UVattenuation, photochemical fluxes, and biological effects ofUV in surface waters, paper presented at Current and Emerging Issues inAquatic Science: Aquatic Sciences Meeting, Am. Soc. of Limnol. andOceanogr., Santa Fe, N. M., 1997.
DeGrandpre, M. D., A. Vodacek, R. K. Nelson, E. J. Bruce, and N. V.Blough, Seasonal seawater optical properties of the U. S. Middle AtlanticBight, J. Geophys. Res., 101, 22,727–22,736, 1996.
Fenton, N., J. Priddle, and P. Tett, Regional variations in bio-optical proper-ties of the surface waters in the Southern Ocean, Antarctic Sci., 6, 443–448, 1994.
Ferrari, G. M., M. D. Dowell, S. Grossi, and C. Targa, Relationshipbetween the optical properties of chromophoric dissolved organic matterand total concentration of dissolved organic carbon in the southern BalticSea region, Mar. Chem., 55, 299–316, 1996.
Fraser, R. S., S. Mattoo, E.-N. Yeh, and C. R. McClain, Algorithm foratmospheric and glint corrections of satellite measurements of oceanpigment, J. Geophys. Res., 102, 17,107–17,118, 1997.
Gordon, H. R., and D. K. Clark, Clear water radiances for atmosphericcorrection of Coastal Zone Color Scanner imagery, Appl. Opt., 20,4175–4180, 1981.
Gordon, H. R., D. K. Clark, J. W. Brown, O. B. Brown, R. H. Evans, andW. W. Broenkow, Phytoplankton pigment concentrations in the MiddleAtlantic Bight: Comparison of ship determinations and CZCS estimates,Appl. Opt., 22, 20–36, 1983.
Gordon, H. R., O. B. Brown, R. H. Evans, J. W. Brown, R. C. Smith, K. S.Baker, and D. K. Clark, A semianalytic radiance model of ocean color,J. Geophys. Res., 93, 10,909–10,924, 1988.
Graneli, W., M. Lindell, and L. Tranvik, Photo-oxidative production ofdissolved inorganic carbon in lakes of different humic content, Limnol.Oceanogr., 41, 698–706, 1996.
Gregg, W. W., and K. L. Carder, A simple spectral solar irradiance modelfor cloudless maritime atmospheres, Limnol. Oceanogr., 35, 1657–1675,1990.
Hochman, H. T., F. E. Muller-Karger, and J. J. Walsh, Interpretation of theCoastal Zone Color Scanner signature of the Orinoco River plume,J. Geophys. Res., 99, 7443–7455, 1994.
Hoge, F. E., M. E. Williams, R. N. Swift, J. K. Yungel, and A. Vodacek,Satellite retrieval of the absorption coefficient of chromophoric dissolvedorganic matter in continental margins, J. Geophys. Res., 100, 24,847–24,854, 1995.
Højerslev, N. K., Spectral light absorption by Gelbstoff in coastal watersdisplaying highly different concentrations, paper presented at OceanOptics XIV, Off. of Nav. Res., NASA, Honolulu, Hawaii, 1998.
Jeffrey, W. H., R. J. Pledger, P. Aas, S. Hager, R. Von Haven, and D. L.Mitchell, Diel and depth profiles of DNA photodamage in bacterioplank-ton exposed to ambient solar ultraviolet radiation, Mar. Ecol. Prog. Ser.,137, 283–291, 1996.
Jeffrey, W. H., J. P. Kase, and S. W. Wilhelm, UV radiation effects onheterotrophic bacterioplankton and viruses in marine ecosystems, inThe Effects of UV Radiation in the Marine Environment, edited byS. de Mora, S. Demers, and M. Vernet, pp. 206–236, Cambridge Univ.Press, New York, 2000.
Johannessen, S. C., A photochemical sink for dissolved organic carbon in theocean, Ph.D. diss., 176 pp., Dalhousie Univ., Halifax, N. S., Canada, 2000.
Johannessen, S. C., and W. L. Miller, Quantum yield for the photochemicalproduction of dissolved inorganic carbon in seawater, Mar. Chem., 76,271–283, 2001.
Kahru, M., and B. G. Mitchell, Empirical chlorophyll algorithm and pre-liminary SeaWiFS validation for the California Current, Int. J. RemoteSens., 20, 3423–3429, 1999.
Kahru, M., and B. G. Mitchell, Seasonal and nonseasonal variability ofsatellite-derived chlorophyll and colored dissolved organic matter concen-tration in the California Current, J. Geophys. Res., 106, 2517–2529, 2001.
Kaiser, E., and G. J. Herndl, Rapid recovery of marine bacterioplanktonafter inhibition by UV radiation in coastal waters, Appl. Environ. Micro-biol., 63, 4026–4031, 1997.
Kalle, K., The problem of Gelbstoff in the sea, Oceanogr. Mar. Biol. Annu.Rev., 4, 91–104, 1966.
Karentz, D., F. S. McEuen, M. C. Land, and W. C. Dunlop, Survey ofmycosporine-like amino acid compounds in Antarctic marine organisms:Potential protection from ultraviolet exposure, Mar. Biol., 108, 157–166,1991.
Kettle, A. J., A model of the temporal and spatial distribution of carbonmonoxide in the mixed layer, M. S. diss., Woods Hole Oceanogr. Inst.,Woods Hole, Mass., 1994.
Kieber, D. J., J. McDaniel, and K. Mopper, Photochemical source of bio-logical substrates in seawater: Implications for carbon cycling, Nature,341, 637–639, 1989.
Kirk, J. T. O., Light and Photosynthesis in Aquatic Ecosystems, CambridgeUniv. Press, New York, 1994.
Markager, S., and W. F. Vincent, Spectral light attenuation and the absorp-tion of UV and blue light in natural waters, Limnol. Oceanogr., 45, 642–650, 2000.
Michaels, A. F., and D. A. Siegel, Quantification of non-algal light attenua-tion in the Sargasso Sea: Implications for biogeochemistry and remotesensing, Deep Sea Res., Part II, 43, 321–345, 1996.
Miles, C. J., and P. L. Brezonik, Oxygen consumption in humic-coloredwaters by a photochemical ferrous-ferric catalytic cycle, Environ. Sci.Technol., 15, 1089–1095, 1981.
Miller, W. L., Effects of UV radiation on aquatic humus: Photochemicalprinciples and experimental considerations, in Aquatic Humic Sub-stances: Ecology and Biochemistry, edited by D. Hessen and L. Tranvik,pp. 125–143, Springer-Verlag, New York, 1997.
Miller, W. L., and D. Kester, Photochemical iron reduction and iron bioa-vailability in seawater, J. Mar. Res., 52, 325:343, 1994.
Miller, W. L., and R. G. Zepp, Photochemical production of dissolvedinorganic carbon from terrestrial organic matter: Significance to the ocea-nic organic carbon cycle, Geophys. Res. Lett., 22, 417–420, 1995.
Mitchell, B. G., Predictive bio-optical relationships for polar oceans andmarginal ice zones, J. Mar. Syst., 3, 91–105, 1992.
Mitchell, B. G., M. Kahru, J. Wieland, and M. Stramska, Determination ofspectral absorption coefficients of particles, dissolved material and phy-toplankton for discrete water samples, in Ocean Optics Protocols forSatellite Ocean Color Sensor Validation, Revision 3, Volume 2, editedby J. L. Muller and G. S. Fargion, NASA Tech. Memo., NASA/TM-2002-210004/Re3-Vol2, 231–257, 2002.
Moore, C. A., C. T. Farmer, and R. G. Zika, Influence of Orinoco Riverwater on hydrogen peroxide distribution and production in the easternCaribbean, J. Geophys. Res., 98, 2289–2298, 1993.
Moore, R. J., Photochemical degradation of colored dissolved organic mat-ter in two Nova Scotian lakes, M. S. diss., Dalhousie Univ., Halifax, N. S.,Canada, 1999.
Mopper, K., and X. Zhou, Hydroxyl radical photoproduction in the sea andits potential impact on marine processes, Science, 250, 661–664, 1990.
Mopper, K., X. Zhou, R. J. Kieber, D. J. Kieber, R. J. Sikorski, and R. D.Jones, Photochemical degradation of dissolved organic carbon and itsimpact on the oceanic carbon cycle, Nature, 353, 60–62, 1991.
Moran, M. A., and R. G. Zepp, Role of photochemistry in the formation ofbiologically labile compounds from dissolved organic matter, Limnol.Oceanogr., 42, 1307–1316, 1997.
Morris, D. P., H. Zagarese, C. E. Williamson, E. G. Balseiro, B. R.Hargreaves, B. Mondenutti, R. Moeller, and C. Queimalinos, Theattenuation of solar UV radiation in lakes and the role of dissolvedorganic carbon, Limnol. Oceanogr., 40, 1381–1391, 1995.
Nelson, N. B., Watching the world from above, in Annual Report of theBermuda Biological Station Research, pp. 11–12, Bermuda Biol. Stn.Res., St. George’s, 1997.
Reynolds, R. A., D. Stramski, and B. G. Mitchell, A chlorophyll-dependentsemianalytical reflectance model derived from field measurements ofabsorption and backscattering coefficients within the Southern Ocean,J. Geophys. Res., 106, 7125–7138, 2001.
Sathyendranath, S., L. Prieur, and A. Morel, A three-component model ofocean color and its application to remote sensing of phytoplankton pig-ments in coastal waters, Int. J. Remote Sens., 10, 1373–1394, 1989.
Sikorski, R. J., and R. G. Zika, Modeling mixed-layer photochemistry ofH2O2: Optical and chemical modeling of production, J. Geophys. Res.,98, 2315–2328, 1993a.
Sikorski, R. J., and R. G. Zika, Modeling mixed-layer photochemistry ofH2O2: Physical and chemical modeling of distribution, J. Geophys. Res.,98, 2329–2340, 1993b.
17 - 12 JOHANNESSEN ET AL.: UV ATTENUATION AND CDOM ABSORPTION FROM SPACE

Stedmon, C. A., S. Markager, and H. Kaas, Optical properties and signa-tures of chromophoric dissolved organic matter (CDOM) in Danish coast-al waters, Estuarine Coastal Shelf Sci., 51, 267–278, 2000.
Vahatalo, A. V., M. Salkinoja-Salonen, P. Taalas, and K. Salonen, Spectrumof quantum yield for photochemical mineralization of dissolved organiccarbon in a humic lake, Limnol. Oceanogr., 45, 664–676, 2000.
Valentine, R. L., and R. G. Zepp, Formation of carbon monoxide from thephotodegradation of terrestrial dissolved organic carbon in natural waters,Environ. Sci. Technol., 27, 409–412, 1993.
Vernet, M., and K. Whitehead, Release of ultraviolet-absorbing compoundsby the red-tide dinoflagellate Lingulodinium polyhedra, Mar. Biol., 127,35–44, 1996.
Vodacek, A., F. Hoge, R. N. Swift, J. K. Yungel, E. T. Peltzer, and N. V.Blough, The use of in situ and airborne fluorescence measurements todetermine UV absorption coefficients and DOC concentrations in surfacewaters, Limnol. Oceanogr., 40, 411–415, 1995.
Vodacek, A., N. V. Blough, M. D. DeGrandpre, E. T. Peltzer, and R. K.Nelson, Seasonal variation of CDOM and DOC in the Middle Atlantic
Bight: Terrestrial inputs and photooxidation, Limnol. Oceanogr., 42,674–686, 1997.
Zaneveld, J. R. V., E. Boss, and A. Barnard, Influence of surface waves onmeasured and modeled irradiance profiles, Appl. Opt., 40, 1442–1449,2001.
Zhou, X., and K. Mopper, Determination of photochemically producedhydroxyl radicals in the sea and its potential impact on marine processes,Mar. Chem., 30, 71–88, 1990.
�����������������������J. J. Cullen and W. L. Miller, Department of Oceanography, Dalhousie
University, Halifax, Nova Scotia, Canada, B3H 4J1.S. C. Johannessen, Institute of Ocean Sciences, 9860W. Saanich Rd., P.O.
Box 6000, Sidney, British Columbia, Canada V8L 4B2. ([email protected])
JOHANNESSEN ET AL.: UV ATTENUATION AND CDOM ABSORPTION FROM SPACE 17 - 13

![mechanism gas in aqueous medium through an unexpected ... · (7.5 μM) with [NBu4]F in MeCN. Inset: The corresponding plots of absorbance at indicated wavelengths versus additional](https://static.fdocuments.net/doc/165x107/5ecc2d14cc1c27130c0037b5/mechanism-gas-in-aqueous-medium-through-an-unexpected-75-m-with-nbu4f.jpg)