MAURI ORA, 1967, 14: 25-ZB SPECTRAL PROPERTIES … · K. J. COLLIER Department of Zoology,...
8
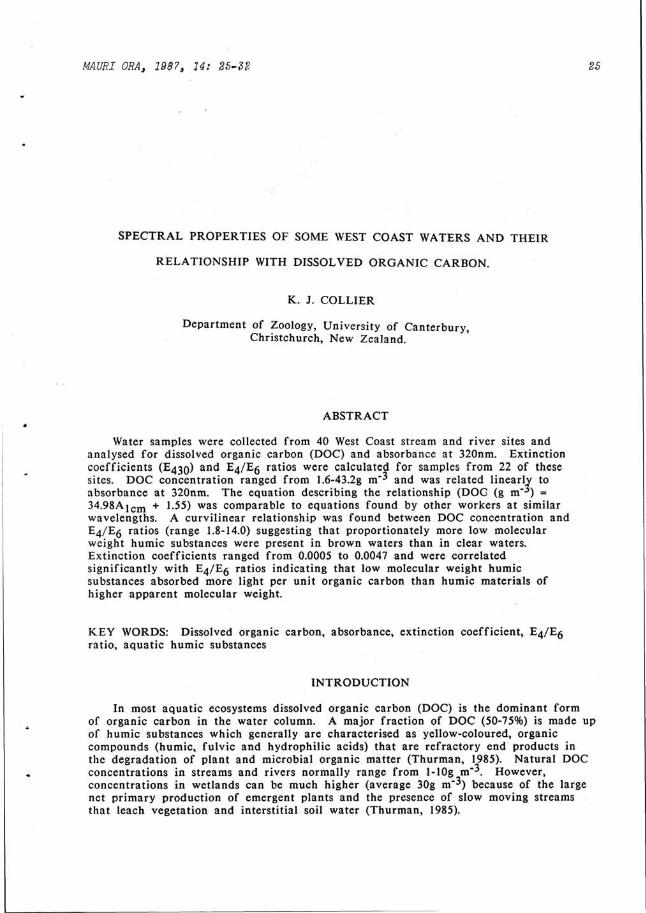
MAURI ORA, 1967, 14: 25-ZB SPECTRAL PROPERTIES OF SOME WEST COAST WATERS AND THEIR RELATIONSHIP WITH DISSOLVED ORGANIC CARBON. K. J. COLLIER Department of Zoology, University of Canterbury, Christchurch, New Zealand. ABSTRACT Water samples were collected from 40 West Coast stream and river sites and analysed for dissolved organic carbon (DOC) and absorbance at 320nm. Extinction coefficients (E430) and E4/E6 ratios were calculated for samples from 22 of these sites. DOC concentration ranged from 1.6-43.2g m"^ and was related linearly to absorbance at 320nm. The equation describing the relationship (DOG (g m"^) = 34.98A] cm + 1.55) was comparable to equations found by other workers at similar wavelengths. A curvilinear relationship was found between DOC concentration and E4/E5 ratios (range 1.8-14.0) suggesting that proportionately more low molecular weight humic substances were present in brown waters than in clear waters. Extinction coefficients ranged from 0.0005 to 0.0047 and were correlated significantly with E4/E5 ratios indicating that low molecular weight humic substances absorbed more light per unit organic carbon than humic materials of higher apparent molecular weight. KEY WORDS: Dissolved organic carbon, absorbance, extinction coefficient, E4/E5 ratio, aquatic humic substances INTRODUCTION In most aquatic ecosystems dissolved organic carbon (DOC) is the dominant form of organic carbon in the water column. A major fraction of DOC (50-75%) is made up of humic substances which generally are characterised as yellow-coloured, organic compounds (humic, ful vic and hydrophilic acids) that are refractory end products in the degradation of plant and microbial organic matter (Thurman, 1985). Natural DOC concentrations in streams and rivers normally range from l-10g m"**. However, concentrations in wetlands can be much higher (average 30g m"^) because of the large net primary production of emergent plants and the presence of slow moving streams that leach vegetation and interstitial soil water (Thurman, 1985).
Transcript of MAURI ORA, 1967, 14: 25-ZB SPECTRAL PROPERTIES … · K. J. COLLIER Department of Zoology,...
MAURI ORA, 1967, 14: 25-ZB
SPECTRAL PROPERTIES OF SOME WEST COAST WATERS AND THEIR
RELATIONSHIP WITH DISSOLVED ORGANIC CARBON.
K. J. COLLIER
Department of Zoology, University of Canterbury, Christchurch, New Zealand.
ABSTRACT
Water samples were collected from 40 West Coast stream and river sites and analysed for dissolved organic carbon (DOC) and absorbance at 320nm. Extinction coefficients (E430) and E4/E6 ratios were calculated for samples from 22 of these sites. DOC concentration ranged from 1.6-43.2g m"̂ and was related linearly to absorbance at 320nm. The equation describing the relationship (DOG (g m"̂ ) = 34.98A] c m + 1.55) was comparable to equations found by other workers at similar wavelengths. A curvilinear relationship was found between DOC concentration and E4/E5 ratios (range 1.8-14.0) suggesting that proportionately more low molecular weight humic substances were present in brown waters than in clear waters. Extinction coefficients ranged from 0.0005 to 0.0047 and were correlated significantly with E4/E5 ratios indicating that low molecular weight humic substances absorbed more light per unit organic carbon than humic materials of higher apparent molecular weight.
KEY WORDS: Dissolved organic carbon, absorbance, extinction coefficient, E4/E5 ratio, aquatic humic substances
INTRODUCTION
In most aquatic ecosystems dissolved organic carbon (DOC) is the dominant form of organic carbon in the water column. A major fraction of DOC (50-75%) is made up of humic substances which generally are characterised as yellow-coloured, organic compounds (humic, ful vic and hydrophilic acids) that are refractory end products in the degradation of plant and microbial organic matter (Thurman, 1985). Natural DOC concentrations in streams and rivers normally range from l-10g m"**. However, concentrations in wetlands can be much higher (average 30g m"̂ ) because of the large net primary production of emergent plants and the presence of slow moving streams that leach vegetation and interstitial soil water (Thurman, 1985).
26 MAURI ORA, 1987, Vol. 14
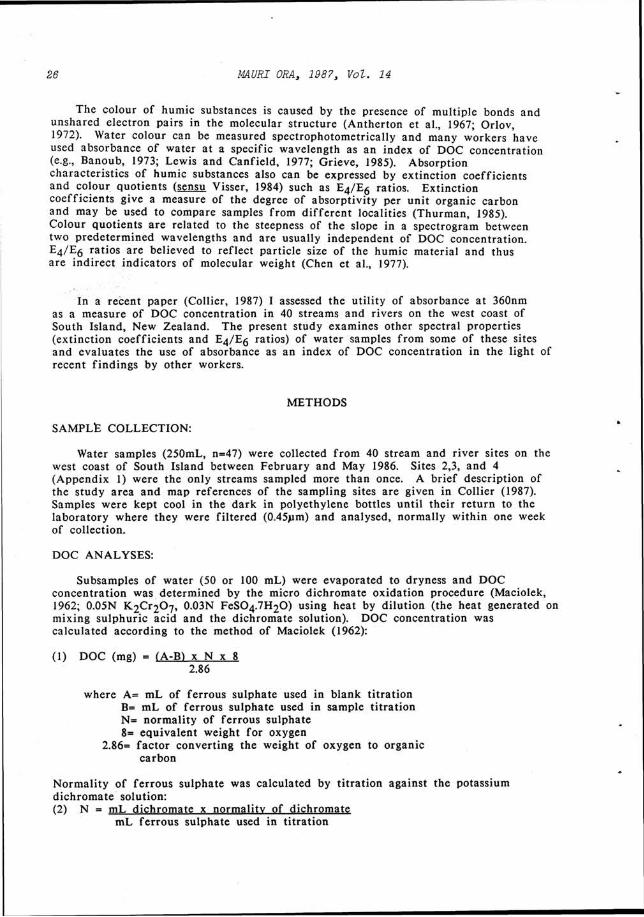
The colour of humic substances is caused by the presence of multiple bonds and unshared electron pairs in the molecular structure (Antherton et al., 1967; Orlov, 1972). Water colour can be measured spectrophotometrically and many workers have used absorbance of water at a specific wavelength as an index of DOC concentration (e.g., Banoub, 1973; Lewis and Canfield, 1977; Grieve, 1985). Absorption characteristics of humic substances also can be expressed by extinction coefficients and colour quotients (sensu Visser, 1984) such as E 4 /E 6 ratios. Extinction coefficients give a measure of the degree of absorptivity per unit organic carbon and may be used to compare samples from different localities (Thurman, 1985). Colour quotients are related to the steepness of the slope in a spectrogram between two predetermined wavelengths and are usually independent of DOC concentration. E4/E5 ratios are believed to reflect particle size of the humic material and thus are indirect indicators of molecular weight (Chen et al., 1977).
In a recent paper (Collier, 1987) I assessed the utility of absorbance at 360nm as a measure of DOC concentration in 40 streams and rivers on the west coast of South Island, New Zealand. The present study examines other spectral properties (extinction coefficients and E4/E5 ratios) of water samples from some of these sites and evaluates the use of absorbance as an index of DOC concentration in the light of recent findings by other workers.
METHODS
SAMPLfe COLLECTION:
Water samples (250mL, n=47) were collected from 40 stream and river sites on the west coast of South Island between February and May 1986. Sites 2,3, and 4 (Appendix 1) were the only streams sampled more than once. A brief description of the study area and map references of the sampling sites are given in Collier (1987). Samples were kept cool in the dark in polyethylene bottles until their return to the laboratory where they were filtered (0.45um) and analysed, normally within one week of collection.
DOC ANALYSES:
Subsamples of water (50 or 100 mL) were evaporated to dryness and DOC concentration was determined by the micro dichromate oxidation procedure (Maciolek, 1962; 0.05N K 2 Cr 2 0 7 , 0.03N FeS04 .7H20) using heat by dilution (the heat generated on mixing sulphuric acid and the dichromate solution). DOC concentration was calculated according to the method of Maciolek (1962):
(1) DOC (mg) = (A-B) x N x 8 2.86
where A= mL of ferrous sulphate used in blank titration B= mL of ferrous sulphate used in sample titration N= normality of ferrous sulphate 8= equivalent weight for oxygen
2.86= factor converting the weight of oxygen to organic carbon
Normality of ferrous sulphate was calculated by titration against the potassium dichromate solution: (2) N = mL dichromate x normality of dichromate
mL ferrous sulphate used in titration

COLLIER - WEST COAST STREAMS 27
The technique was calibrated by ashing beech (Nothofagus) detritus and tannic acid (Mallinkcrodt analytical reagent) overnight at 500°C and comparing ash free dry weight with the amount of organic carbon extracted by dichromate oxidation. Organic matter was assumed to be 50% carbon (Maciolek, 1962).
SPECTROPHOTOMETRIC ANALYSES:
Absorbance spectra (200-650nm) of 4 representative water samples (Sites 3,10,29, and 37) and absorbance at 320nm (all samples) were measured using a Kontron Uvicon 860 spectrophotometer (1cm quartz cell). Absorbances of water samples from 22 of the sites were measured at 430, 460, and 660nm in a 10cm glass cell (Varian DMS 100 spectrophotometer). Distilled water blanks were used when making all absorbance measurements. E4/E5 ratios were obtained from the quotient of absorbance at 460 and 660nm and extinction coefficients were calculated by dividing absorbance at 430nm (per cm of cell path length) by the weight of organic carbon (g rn-3) in the sample. Gjessing (1974) proposed 430nm as a standard wavelength for comparing water colour. However, wavelengths used by other workers for calculating extinction coefficients vary from 400nm (Thurman, 1985) to 540nm (Visser, 1984)
RESULTS
DOC ANALYSES:
(a) Oxidation efficiency Calibration of the heat by dilution dichromate oxidation procedure showed that
it retrieved an average of 83% of the organic carbon in tannic acid and beech detritus (Table 1). Maciolek (1962) recommended immersing the acid/ dichromate mixture in a boiling water bath for 3 hours to facilitate maximum oxidation of the organic carbon. This step was omitted in the present study to enable rapid analysis of a large number of samples. DOC concentrations calculated from Equation 1 therefore needed to be multiplied by 1.20 to provide a more accurate estimate of total DOC (Table 1). The equation used to calculate DOC can be simplified to:
(3) DOC (mg) = (A-B) x N x 3.36
Lee et al. (1983) used heat by dilution dichromate oxidation to measure the organic carbon content of some South Pacific soils. They compared carbon values obtained by this method with estimates obtained using a high frequency induction furnace and found that corrections equivalent to those used in Equation 3 were necessary to give accurate estimates of organic carbon content.
(b) DOC concentrations in stream waters DOC concentrations of water samples collected from the 40 sites ranged from 1.6
to 43.2g nT3 and were highest in streams draining pakahi (wetland) catchments in Larrys Creek Experimental Area (Sites 2-4), north of Reefton (Appendix 1). DOC concentrations at most sites (70%) were below lOg rn"-* and at 48% of the sites were less than 5g m"3.
SPECTROPHOTOMETRIC ANALYSES:
Absorbance (A) at 320nm was related linearly to DOC concentration (r2=0.92). The relationship is expressed by the equation:
(4) DOC (g nT3) = 34.98A l c m + 1.55
28 MAURI ORA, 1987, Vol. 14
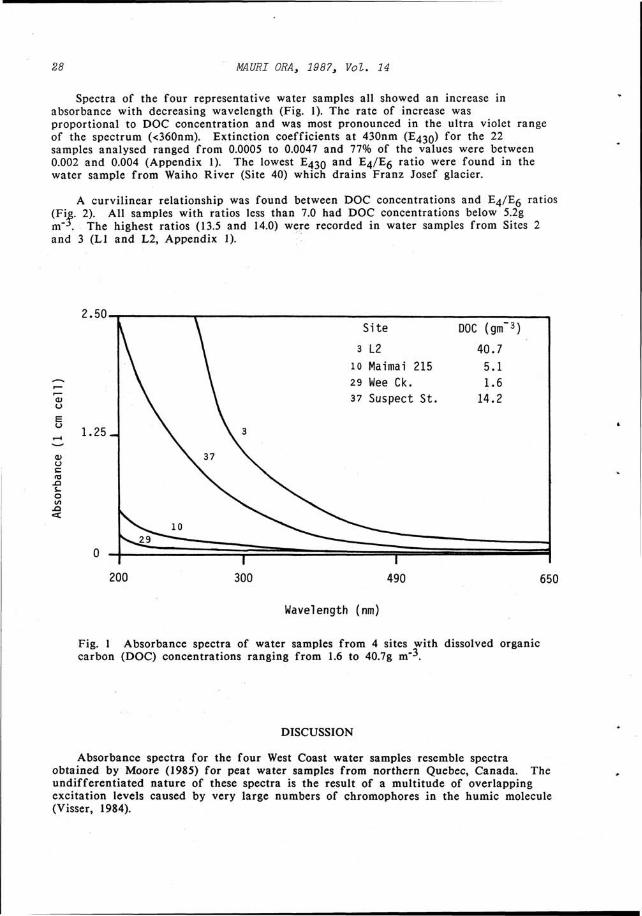
Spectra of the four representative water samples all showed an increase in absorbance with decreasing wavelength (Fig. 1). The rate of increase was proportional to DOC concentration and was most pronounced in the ultra violet range of the spectrum (<360nm). Extinction coefficients at 430nm (E430) for the 22 samples analysed ranged from 0.0005 to 0.0047 and 77% of the values were between 0.002 and 0.004 (Appendix 1). The lowest E430 and E4/E5 ratio were found in the water sample from Waiho River (Site 40) which drains Franz Josef glacier.
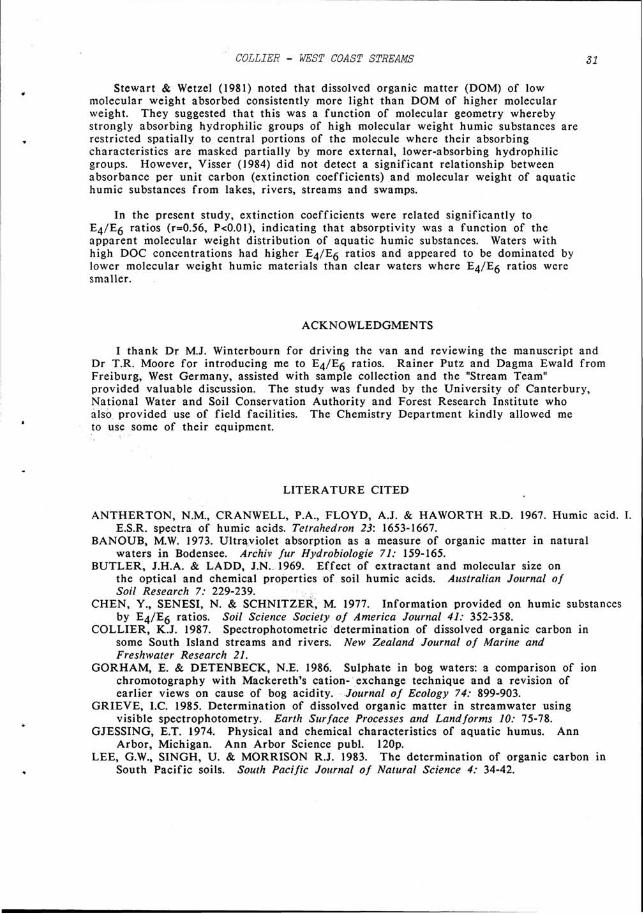
A curvilinear relationship was found between DOC concentrations and E4/E5 ratios (Fig. 2). All samples with ratios less than 7.0 had DOC concentrations below 5.2g nT* The highest ratios (13.5 and 14.0) were recorded in water samples from Sites 2 and 3 (Ll and L2, Appendix 1).
-Ct s-o co .a «=C
1.25-
n u —
^ 2 9 10
37
V 3
~l
Site
3 L2
10 Maimai 215
29 Wee Ck.
37 Suspect St.
1
DOC (gm"3) 1
40.7
5.1
1.6
14.2
200 300 490 650
Wavelength (nm)
Fig. 1 Absorbance spectra of water samples from 4 sites with dissolved organic carbon (DOC) concentrations ranging from 1.6 to 40.7g m"̂ .
DISCUSSION
Absorbance spectra for the four West Coast water samples resemble spectra obtained by Moore (1985) for peat water samples from northern Quebec, Canada. The undifferentiated nature of these spectra is the result of a multitude of overlapping excitation levels caused by very large numbers of chromophores in the humic molecule (Visser, 1984).

COLLIER - WEST COAST STREAMS 29
TABLE 1 Percent organic carbon recovered from tannic acid and beech detritus using heat by dilution dichromate, oxidation. The right hand column gives factors by which organic carbon values obtained by the Maciolek (1962) calculation must be multiplied to correct for inefficiency in oxidation. AFDW = initial ash free dry weight of the compound oxidised.
Compound
Tannic acid
Beech detritus
+ SD
AFDW (mg)
17.6 20.0 19.0
28.7 28.7 28.7
% recovery
80.6 85.1 84.2
86.2 82.6 79.1
83.0 + 2.7
Multiplication factor
1.24 1.18 1.19
1.16 1.21 1.26
1.20 ± 0.03
14_
io H
6 H
• •• •••
15 25 35 — I 45
DOC (g.rrr3)
Fig. 2 Relationship between dissolved organic carbon (DOC) concentrations and E4/E5 ratios of water samples collected from 22 streams and rivers on the west coast of South Island.

30 MAURI ORA, 1987 3 Vol. 14
Regression equations expressing relationships between DOC concentration and absorbance at 320 or 330nm in several studies including this one are given in Table 2. Slopes of all equations are similar (34.98-45.49) but intercepts vary from 1.39 to 7.46. The equation expressing the relationship between DOC concentration and absorbance at 360nm for Sites 1-40 is very similar to that given by Lewis & Canfield (1977) who measured absorbance at 360nm in some Venezuelan and southeastern United States waters (see Collier, 1987).
Chen et al. (1977) observed that water pH had a pronounced effect on E4/E5 ratios which reached maxima between pH 6 and 8. The pH of the West Coast water samples used to calculate E4/E5 ratios ranged from 4.1 to 7.8 (Appendix 1). In this pH range, Chen et al. (1977) showed that E4/E5 ratios changed by no more than 0.5 units and, thus, water pH is unlikely to have affected ratio estimates in the present study. Using a temporally extensive data set (24 weekly samples), Moore (in press) recorded mean E4/E5 ratios of 7.3 for Sites 5-10 and 11.1 for Sites 2-4. These compare favourably to 7.4 and 12.2, respectively, calculated from spot samples taken in the present study. Several workers have shown that E4/E6 ratios are related inversely to molecular weight of the humic material (Butler & Ladd 1969, Chen et al. 1977, Visser 1984). Thus, high ratios such as those recorded in samples from Sites 2 and 3 (13.5 and 14.0, respectively) infer enrichment by low molecular weight humic substances relative to samples with smaller ratios. Chen et al. (1977) recorded an E4/E5 ratio of 13.7 at pH 4 for a fulvic acid fraction with a molecular weight of 833, and all fractions with ratios less than 8 had molecular weights greater than 2109. Increasing DOC concentrations in the West Coast waters sampled appeared to be associated with decreases in the apparent molecular weight of the humic material.
TABLE 2 Details of dissolved organic carbon (DOC)/ absorbance relationships at 320 and 330nm from contrasting natural waters. A = absorbance in a lern ce l l .
Source Wavelength DOC range r2 Equation (nm) (g nT3) (DOC (g nT3)=)
This study
Gorham & Detenbeck 0 19861
Moore 19852
Moore in press3
Moore in press^
320
320
330
330
330
1.6-43.
16.7-83,
1-51
2-18
18-55
CVJ
9
0.92
0.73
0.84
0.92
0.88
34.98A + 1.55
42.8A + 5.1
45.05A + 1.80
45.49A + 1.39
38.87A + 7.46
North American bog water Canadian peat water Sites 5-10 of this study Sites 2-4 of this study
COLLIER - WEST COAST STREAMS 31
Stewart & Wetzel (1981) noted that dissolved organic matter (DOM) of low molecular weight absorbed consistently more light than DOM of higher molecular weight. They suggested that this was a function of molecular geometry whereby strongly absorbing hydrophilic groups of high molecular weight humic substances are restricted spatially to central portions of the molecule where their absorbing characteristics are masked partially by more external, lower-absorbing hydrophilic groups. However, Visser (1984) did not detect a significant relationship between absorbance per unit carbon (extinction coefficients) and molecular weight of aquatic humic substances from lakes, rivers, streams and swamps.
In the present study, extinction coefficients were related significantly to E4/E5 ratios (r=0.56, P<0.01), indicating that absorptivity was a function of the apparent molecular weight distribution of aquatic humic substances. Waters with high DOC concentrations had higher E4/E5 ratios and appeared to be dominated by lower molecular weight humic materials than clear waters where E4/E5 ratios were smaller.
ACKNOWLEDGMENTS
I thank Dr MJ. Winterbourn for driving the van and reviewing the manuscript and Dr T.R. Moore for introducing me to E4/E5 ratios. Rainer Putz and Dagma Ewald from Freiburg, West Germany, assisted with sample collection and the "Stream Team" provided valuable discussion. The study was funded by the University of Canterbury, National Water and Soil Conservation Authority and Forest Research Institute who also provided use of field facilities. The Chemistry Department kindly allowed me to use some of their equipment.
LITERATURE CITED
ANTHERTON, N.M., CRANWELL, P.A., FLOYD, A.J. & HAWORTH R.D. 1967. Humic acid. I E.S.R. spectra of humic acids. Tetrahedron 23: 1653-1667.
BANOUB, M.W. 1973. Ultraviolet absorption as a measure of organic matter in natural waters in Bodensee. Archiv fur Hydrobiologie 71: 159-165.
BUTLER, J.H.A. & LADD, J.N. 1969. Effect of extractant and molecular size on the optical and chemical properties of soil humic acids. Australian Journal of Soil Research 7: 229-239.
CHEN, Y., SENESI, N. & SCHNITZER, M. 1977. Information provided on humic substances by E4/E5 ratios. Soil Science Society of America Journal 41: 352-358.
COLLIER, K.J. 1987. Spectrophotometric determination of dissolved organic carbon in some South Island streams and rivers. New Zealand Journal of Marine and Freshwater Research 21.
GORHAM, E. & DETENBECK, N.E. 1986. Sulphate in bog waters: a comparison of ion chromotography with Mackereth's cation- exchange technique and a revision of earlier views on cause of bog acidity. Journal of Ecology 74: 899-903.
GRIEVE, LC. 1985. Determination of dissolved organic matter in streamwater using visible spectrophotometry. Earth Surface Processes and Landforms 10: 75-78.
GJESSING, E.T. 1974. Physical and chemical characteristics of aquatic humus. Ann Arbor, Michigan. Ann Arbor Science publ. 120p.
LEE, G.W., SINGH, U. & MORRISON R.J. 1983. The determination of organic carbon in South Pacific soils. South Pacific Journal of Natural Science 4: 34-42.
32 MAURI ORA, 1987, Vol. 14
LEWIS, W.M. & CANFIELD, D. 1977. Dissolved organic carbon in some dark Venezuelan waters and a revised equation for spectrophotometric determination of dissolved organic carbon. Archiv fur Hydrobiologie 79: 441-445.
MACIOLEK, J.A. 1962. Limnological organic analysis by quantitative wet oxidation. United States Fisheries and Wildlife research report no. 60. 61p.
MOORE, T.R. 1985. The spectrophotometric determination of dissolved organic carbon in peat waters. Soil Science Society of America Journal 49: 1590-1592.
MOORE, T.R. in press. An assessment of a simple spectrophotometric method for the determination of dissolved organic carbon in freshwaters. New Zealand Journal of Marine and Freshwater Research.
ORLOV, D.S. 1972. Modern chemical and physical techniques for studying the nature and structure of soil humic substances. Soviet Soil Science 1972: 461-467.
STEWART, A.J. & WETZEL, R.G. 1981. Assymetrical relationships between absorbance, fluoresence and dissolved organic carbon. Limnology and Oceanography 26: 590-597.
THURMAN, E.M. 1985. Organic geochemistry of natural waters. Dordrecht. Martinus Njhoff/ Dr W. Junk Publishers. 497p.
VISSER, S.A. 1984. Seasonal changes in the concentration and colour of humic substances in some aquatic environments. Freshwater Biology 14: 79-87.
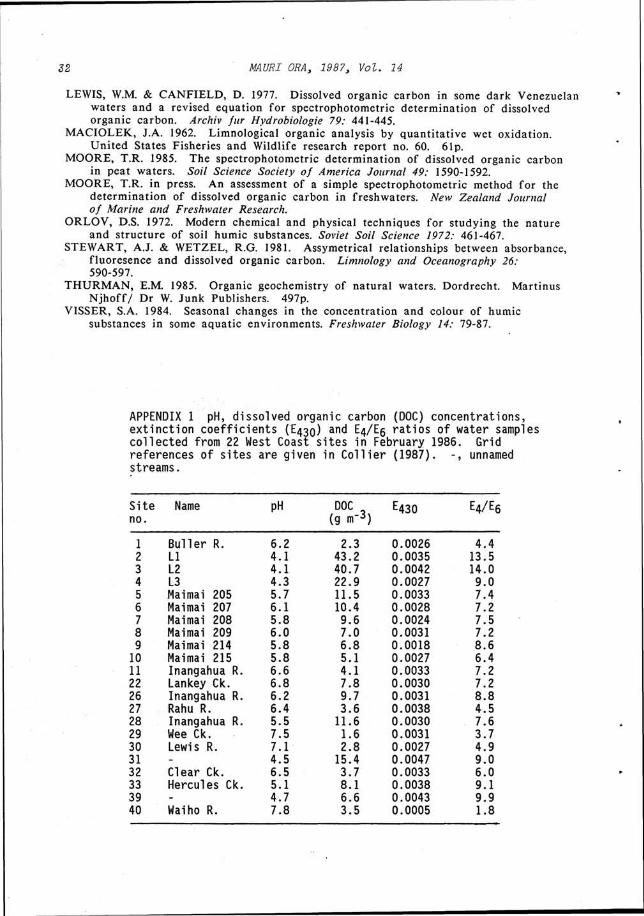
APPENDIX 1 pH, dissolved organic carbon (DOC) concentrations, ex t inc t ion coef f ic ients (E430) and E4/E5 ra t ios of water samples col lected from 22 West Coast s i tes in February 1986. Grid references of s i tes are given in C o l l i e r (1987) . - , unnamed streams.
S i te no.
Name pH DOC o
(9 nr3) E430 E4/E6
1 2 3 4 5 6 7 8 9 10 ll 22 26 27 28 29 30 31 32 33 39 40
Buller R. Ll L2 L3 Maimai 205 Maimai 207 Maimai 208 Maimai 209 Maimai 214 Maimai 215 Inangahua R. Lankey Ck. Inangahua R. Rahu R. Inangahua R. Wee Ck. Lewis R. -Clear Ck. Hercules Ck. -Waiho R.
6.2 4.1 4.1 4.3 5.7 6.1 5.8 6.0 5.8 5.8 6.6 6.8 6.2 6.4 5.5 7.5 7.1 4.5 6.5 5.1 4.7 7.8
2.3 43.2 40.7 22.9 11.5 10.4 9.6 7.0 6.8 5.1 4.1 7.8 9.7 3.6 11.6 1.6 2.8 15.4 3.7 8.1 6.6
0.0026 0.0035 0.0042 0.0027 0.0033 0.0028 0.0024 0.0031 0.0018 0.0027 0.0033 0.0030 0.0031 0.0038 0.0030 0.0031 0.0027 0.0047 0.0033 0.0038 0.0043
4.4 13.5 14.0 9.0 7.4 7.2 7.5 7.2 8.6 6.4 7.2 7.2 8.8 4.5 7.6 3.7 4.9 9.0 6.0 9.1 9.9
3.5 0.0005 1.8