Calculation Cover Sheet CRWMS/M&O
96
CRWMS/M&O Calculation Cover Sheet Complete only applicable items. 1. QA:L Page: I Of: 21 2. Calculation Title Post Closure Open-Loop Natural Ventilation 3. Document Identifier (including Revision Number) 4. Total Pages BCAD00000-0 1717-0210-00002, Rev. 00 21 5. Total Attachments 6. Attachment Numbers - Number of pages in each 9 1-8, 11-24, 111-29, IV-3, V-I, V!-l, VII-1, IX-3 Print Name Signature Date SRomeo Jurani .L - ý T q 7. Originator Norman E. Kramer-9 7-,q 'y- q7 8. Checker John F. Beesley 0,e. • "• J, 3, 9. Lead Jeff Steinhoff A/ 10 Remarks 10. Remarks - The authors shared equally in the preparation of this calculation. Attachment I was contributed by Alan Linden. The following TBVs were used in the calculation: TBV-276 TBV-333 Revision History 1 1 Rpvi~iinn Ncv 00 1 2. Description of Revision Initial Issue DWORMA1"O Copy LAM VEGAS DOCUMET CONTOL I i 0 3 11 ý AP 3 1 5 (t~t, X,v- 02'15 '9l 11 Revision No I VL•J IT•TV. • . ... ql
Transcript of Calculation Cover Sheet CRWMS/M&O

CRWMS/M&OCalculation Cover Sheet
Complete only applicable items.1. QA:L
Page: I Of: 21
2. Calculation Title Post Closure Open-Loop Natural Ventilation
3. Document Identifier (including Revision Number) 4. Total Pages
BCAD00000-0 1717-0210-00002, Rev. 00 21
5. Total Attachments 6. Attachment Numbers - Number of pages in each
9 1-8, 11-24, 111-29, IV-3, V-I, V!-l, VII-1, IX-3
Print Name Signature Date
SRomeo Jurani .L - ý T q
7. Originator Norman E. Kramer-9 7-,q 'y- q7
8. Checker John F. Beesley 0,e. • "• J, 3,
9. Lead Jeff Steinhoff A/ 10 Remarks10. Remarks -
The authors shared equally in the preparation of this calculation. Attachment I was contributed by Alan Linden.
The following TBVs were used in the calculation:
TBV-276 TBV-333
Revision History
1 1 Rpvi~iinn Ncv
00
1 2. Description of Revision
Initial Issue
DWORMA1"O Copy LAM VEGAS DOCUMET CONTOL
I i 0 3 11 ýAP 3 1 5 (t~t, X,v- 02'15 '9l
11 Revision No I
VL•J IT•TV. • . ...ql
1. PURPOSE
The purpose of this calculation is to provide information to the Performance Assessment
organization. The Performance Assessment organization will be requested to determine
the waste package degradation, over 10,000 years, under the following conditions:
"* Repository is not sealed and ventilation air can circulate in the emplacement drifts (open-loop conditions).
"* Ventilation pressure provided by the heat of the waste packages (natural ventilation).
In order to provide the waste package degradation, the Performance Assessment organization requires the expected ventilation air temperature, the relative humidity of the ventilation air, and the waste package skin temperature over the 10,000 year period.
This information is required at points 100, 300, 500 and 600 m from the start of the emplacement area in the emplacement drifts. This calculation serves as the basis for this information.
2. METHOD
This calculation will be a combination of previously published analyses and new
information developed in this calculation. However, information from prior analyses must be adapted or expanded for the specific conditions mentioned above.
A recent analysis, Repository Subsurface Waste Emplacement and Thermal Management Strategy (CRWMS M&O 1998e), determined the expected air temperature in the emplacement drifts for a period of 300 years. This information has been extended to
10,000 years by using engineering judgement as explained in Section 5.3.
The Multiple WP Emplacement Thermal Response- Suite I (CRWMS M&O 1998c) calculation determined the waste package side temperature over 10,000 years, but for the no ventilation condition. This information has been adjusted for natural ventilation conditions. Natural ventilation will allow air movement through the emplacement drifts
and thus the information in Multiple WP Emplacement Thermal Response- Suite I
(CRWMS M&O 1998c) has been adjusted downward to reflect the cooling effect of the air.
The amount of moisture carried by the air in the repository is composed of the moisture
of the air outside the repository and moisture added to the outside air from the drift walls. The moisture from the drift walls is due to infiltration of precipitation from the surface. The relative humidity of the air in the emplacement drifts is determined by the amount of moisture and the air temperature.
To check the reasonableness of the airflows within the repository, the natural ventilation
pressure expected was calculated. As a necessary step in the airflow reasonability determination, the ventilation network within the repository was simulated using the VNETPC ventilation program.
BCA D00000-01717-0210-00002, Rev. 00 Julyv 9, 1999
3. ASSUMPTIONS
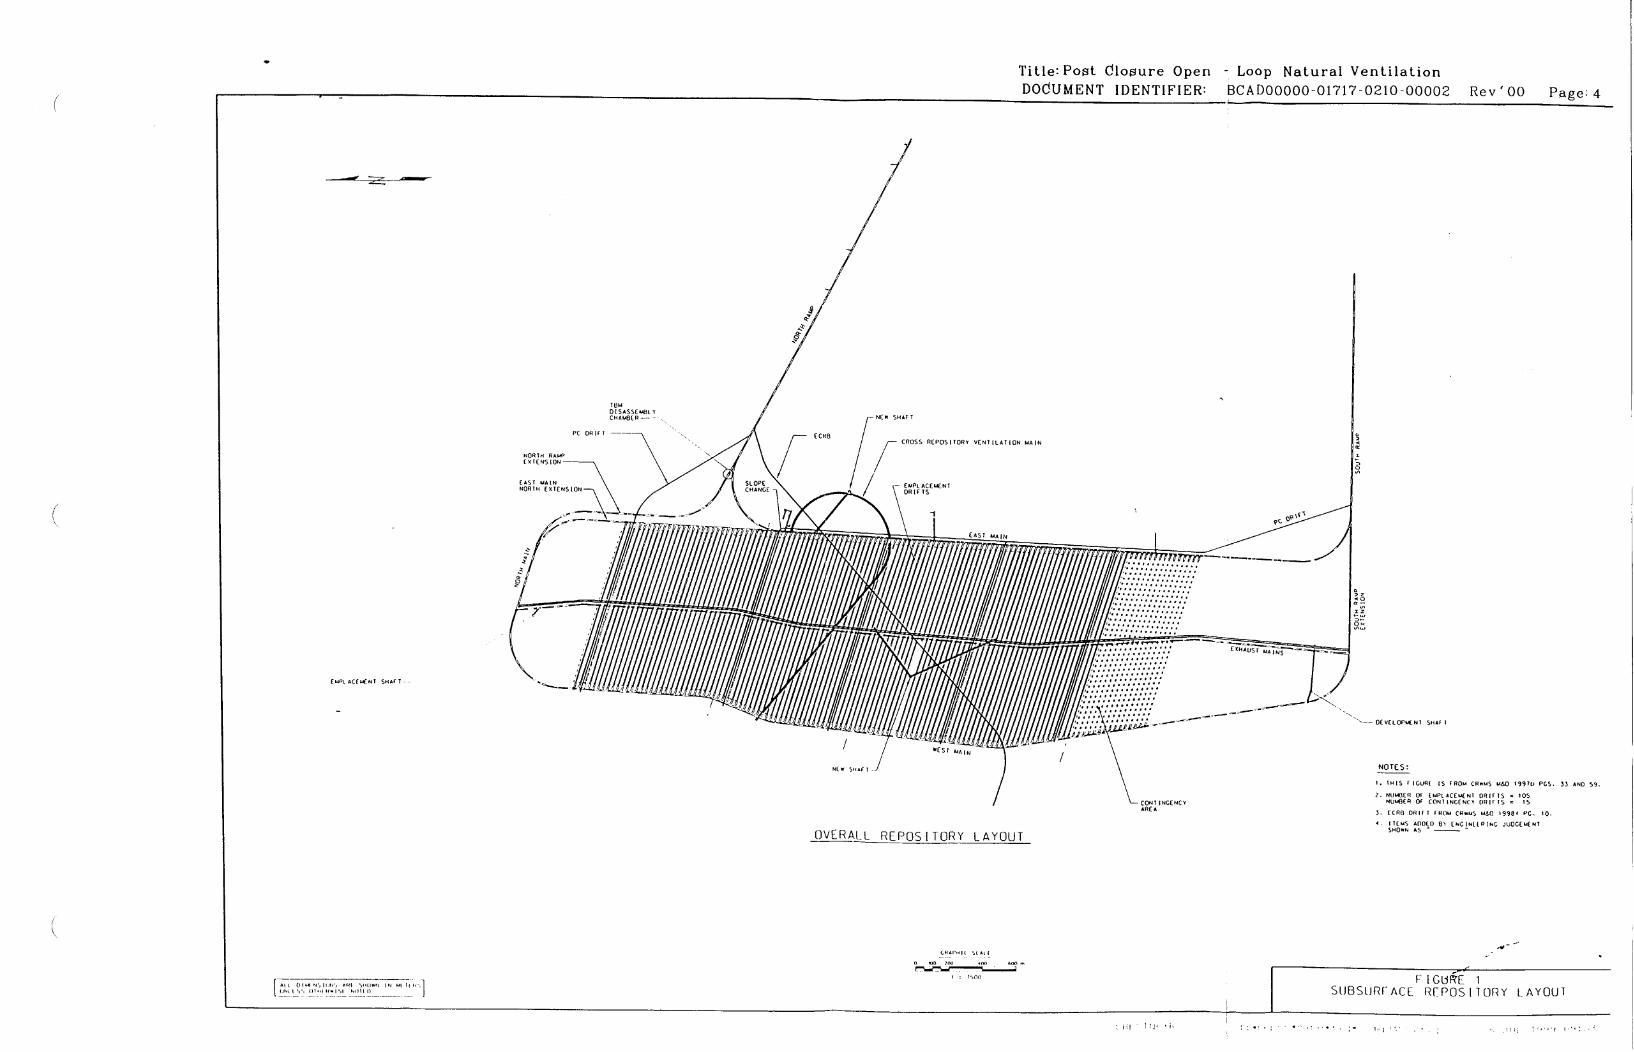
3.1 Repository Layout The repository layout is similar to the VA reference design and contains the
following features, as shown in Figure 1. The layout is more fully described in the
Repository Subsurface Layout Configuration Analysis (CRWMS M&O 1997b). The page numbers below reflect the specific information source in the reference.
"* Long parallel emplacement drifts with 28m center-to-center spacing (TBV276) (pg 33) and 5.5m in diameter (TBV-333) (pg 74);
"* In-drift waste package emplacement (pg 65); "* Two ventilation shafts (6.7m diameter) (TBV-333) (pg 80) and two ramps
(7.62m diameter) (TBV-333) (pg 66 & 67); "* A thermal loading of 85 metric tonnes of uranium/acre (mtu/acre) (pg 11); "* Ventilation raises (2.Om diameter) (TBV-333) between Exhaust Main (7.62m
diameter) (TBV-333) and Emplacement Drifts (pg 79); and "* Five (5) performance confirmation drifts (5.5m diameter) (TBV-333) (pg 59).
Included on Figure 1 is the Enhanced Characterization of the Repository Block (ECRB) Drift from the East-West Cross Drift Starter Tunnel Layout Analysis
(CRWMS M&O 1998f). The ventilation model has assumed certain connections based on engineering judgement, such as, connections between the ECRB (5.0m diameter) (CRWMS MI&O 1998f, pg 12) and the Exhaust Main. An additional Exhaust Main, additional shafts, and mains have also been included based on engineering judgement. [Used Throughout]
3.2 Nodes and Lengths Used for Modeling Attachment I shows the nodes and lengths used in the ventilation modeling for
this calculation. The number and location of the nodes is based on engineering judgement. The nodes are located at the midpoint of the drift between the crown and invert. All distances are measure from node-to-node to allow the ventilation circuits to be closed. The node-to-node lengths are based on the Repository
Subsurface Layout Configuration Analysis (CRWMS M&O 1997b) as shown in Figure 1. In order to preclude inconsistencies between the ventilation network
and other layout drawings, the figures used are included in Attachment I. All
horizontal node-to-node lengths can be determined from these figures. Vertical node-to-node lengths are calculated as shown in Attachment I. [Used in Attachments I, II, and III]
3.3 Airway Resistance, Effective Area, and Perimeter of Mains and Drifts Table 1 shows the airway resistance (K-factor), effective area, and perimeter of mains and drifts used in the model. The values are based on engineering judgement and the references cited beneath Table 1. [Used in Attachments II, and 1111
BCAD00000-01717-0210-00002, Rev. 00 Riky 9, 1999)
Title: Poist CJlooure Opennod ý JIL : IrM T I L 114 1 1r 1J ln JktiPu:k- I( I ."-k'-I kJ -t Il.C K v N.J.J age: 4
- Loop Natural Ventilation
RlEPOSITORY VENTILATION MAIN
.OPT. RM4P C 1(1NS ION -
EMPI. ACE MENT OR IF1T
//
-CONW INGENCY ARE A
OVERALL REPOSITORY LAYOUT
O(V(LOr.&NI 01211I
NOTES:
1. TIS FI GuRC IS FRO. CIIIMS AO I1991t, CT. 33 AND 59. 2. NU1H1(R Of EMPLACCMCNT DRifIFS FOS0
NU.*IfRlOf ION! INGENC 0DRfIFS -15
3. ((10O DRI IFTFR .CA..MS M0O19138f PC. 10.
4. ITEMýS 100(0 81 ENGINIRING JUOCEW NT SH0OWN AS -
CRAIlIl SOIL
I I I .00
ALL 0114 Nt. LI, All SLLU-'L OIL LII LI I C LIRE I
S[JBSLJRFACL REPOS I lORY LAYOUT
11, ' .
...
. .
(
TOM D IS ASS( WE Y CHAMBER---N
PC OR If T
WSHAFT
Rd.%7, on P.--'
E.PL ACE IICNT S-F T

(
Table 1. Airway Resistance, Effective Area, and Perimeter
0 0;
-..2 ,0
0,
I..)
,0
ApplicabilityGeneral Description of Repository Airway
Waste Ramp Tuff Ramp
Service Main Drifts
Exhaust Mainft Service Drift Service Drift E mpjlacement Drift I p Em.._placement Drift Empt Tp
Service Drift Service Drift
Emplacement Raise
ServiceNent Raise
Horiz. Raise (Same as above)_ VA Emplacement Shaft VA Development Shaft
Access Drift
LADS-EDA Shaft 6.9m
LADS-EDA Shaft 6.9m LADS-EDA Shaft 9.9m Connector Drift
Airway Resistance K-Factor
(kg/mi)
0.0056(a) 0.0111(a) 0.0130(a)
0.0111(a) 0.01 30(a) 0.0130(a) 0.0158(a) 0.0158(a) 0.0130(a) 0.0130(a)
0.0037
(lb min/ft4 xl 10"1) 30 60 70
60 70 70
85 70 70 70
20 -(b)
Airway Effective Area (d)
36.1700 36.1700 36.1700
37.3000 19.6300 16.5000 15.6200 18.7600 19.6300 18.7600
2.2700
(ft3.
389.33 389.33 389.33
401.49 211.30
177.60 168.13 201.93 211.30 201.93
24.43
Effective Radius or Dimension (e)
(m) (ft)
r=3.51 r=3.51 r=3.51
r=3.51 r=2.55 r-2.35 r=2.55 r-2.55 r=2.55 r=2.55 r=0.85
11.516 11.516 11.516
11.516 8.366 7.710 8.366 8.366 8.366 8.366 2.789
North Ramp_& North Ramp Ext South Ram & South Ramp Ext East Main & Extension, West Main, & North Main
East & West Exhaust Mains
Perf Con (PC) Main & PC Drifts
Enhanced Char Repository Block
Emplacement Drifts Empt Emlacement Drifts Cross-block Drift Stand-b Drift Exhaust Main to Emplacement Drift Exhaust Main to PC/Stand-by/ Cross-block Drifts Exhaust Main Connector Emplacement Vent Shaft Development Man/Materials Shaft 7m x 8m Horse-shoe Shaped Shaft Connecting Drift (g)
Emplacement Vent Shaft
Development Shaft
LADS-EDA Shaft Access Drift to Exhaust Main/ West Main/ East Main
0.0037 20 (b• 2.2700 24.43 rr=0.85 2.789 1 17.52 0.0046 25 (c) 29.0300 312.48 r3.05 10.007 62.87
0.0176(a)
0.0046
05.-0046 0.0176 0.0046 0.0046
25 (c) 41.4842(g) 446.53(g)
25 (c) 37.3900(f) 37.3900rni
402.49(f) 402.49(f)
w=7.4(g) h=2.7(g) r=3.7(g)
3.45()
3.45(t)
w=24.28(g) h=8.86(g) r=12.14(g)
11.319(f)
11.319(f)
25 (c) 76.9771(f 828.57(f) 1=r4.95(f) 16.240(f) 1 102.04 25 (c) 36.1700(f) 389.33(f r=3.51(f) 11.516(f) 72.36
Notes: a) From Controlled Design Assumptions Document (CRVVMS M&O 1998b, pg 7-16).
b) From Hartman (1997, pg 155) for straight, smooth lined, slightly obstructed.
c) From Hartman (1997, pg 155) for straight, smooth lined, slightly obstructed, maximum value.
d) Effective areas from Calculation of Effective Areas of Subsurface Openings During Emplacement Mode (CRWMS M&O 1999b, pg50) except as noted.
e) Radius or Dimension from (CRWMS M&O 1999b, pgs 27, 31, 34, 37, 43, 46, and 47) except as noted.
f) Assumption for LADS-EDA items is based on engineering judgement and is consistent with airways sized to handle projected requirements.
g) The horse-shoe shaped access drift is 7m high x 8m wide and is sized by engineering judgement to ensure it does not restrict the air flow from the shaft. The
drift is reduced to 6.4m x 7,4m after installation of ground support.
h) The 'K" factor value for the man/materials shaft during preclosure is used continually for postclosure. The fixtures for the men and materials capability of the
shaft are retained to accommodate transition and future use of the shaft.
',C
(
0.0037 20 (b) 2.2700 24.43 1=0.85 2.789 17.52
Calculated Perimeter (ft)
72.36 72.36 72.36
72.36
52.57 48.44 52.57 52.57 52.57 52.57 17.52
80.1380.13
71.12 71.12
•"(m,) I
O-,..UU IU.UUI29.0300 JIZ.14095 (h)

3.4 Relative Humidity of Air and Barometric Pressure The relative humidity of air reporting to the entrance to the emplacement drifts varies from 20 to 40% in the Overall Development and Emplacement Ventilation Systems (CRWMS M&O 1997a, pg 20). This is based on current experience of the ESF and NTS tunnels during the winter and summer season. This calculation will use a representative value of 30% relative humidity.
Barometric pressure at the repository horizon of about 1 100m Repository Subsurface Layout Configuration Analysis (CRWMS M&O 1997b, pg 33) is about 26.2 inches of Hg (88.72 kPa) (Hartman et al., pg 663). These values are existing data and do not require confirmation as they will not be used for construction, fabrication, or procurement of an item. [Used in Attachments VI, VII, VIII and Section 5.5]
3.5 Equivalent Resistance of Stoppings/ Regulators/ Doors The VNETPC model requires input of the resistance units expected for stoppings
or ventilation control devices. These units are equivalent to 1/10 in.min /ft6 =
0.11 17x10 9 Ns 2/m8. The specific values used in this calculation range from 0.001 to 99,000 units (see the Attachment for specific values). Note that for dummy branches a zero (0) resistance is assumed. [Used in Attachments II & III]
3.6 Average Underground Air Temperature The average undergrotand air temperature, before the ventilation air has entered the emplacement drifts, is 25TC. An average air temperature value of 231.5°C was calculated in Air Quality Control Design Analysis (CRWMS M&O 1998a, pg 19). This analysis will use a slightly higher value because heat from the waste packages will have increased the rock temperature. This value is existing data and does not require confirmation as it will not be used for construction, fabrication, or procurement. [Used in Section 5.1 and Attachment VIII]
3.7 Emplacement Drift Flow Rates Flow rates of 0.1 and 1.0 m3/sec were assumed to flow in each emplacement drift. If a flow rate of 0.1 m3/sec is assumed then additional shafts and an exhaust main (3.1) will not be required. Additional shafts and an exhaust main will be required
for a flow rate of 1.0 m3/sec. These values are considered reasonable for this calculation. [Used in Attachments I, III, and Sections 5.2 and 5.5.1]
3.8 Elevations of Shafts and Ramps The following elevations are assumed for shaft collars and ramp portals: Item Elevation (m) Source for Elevation
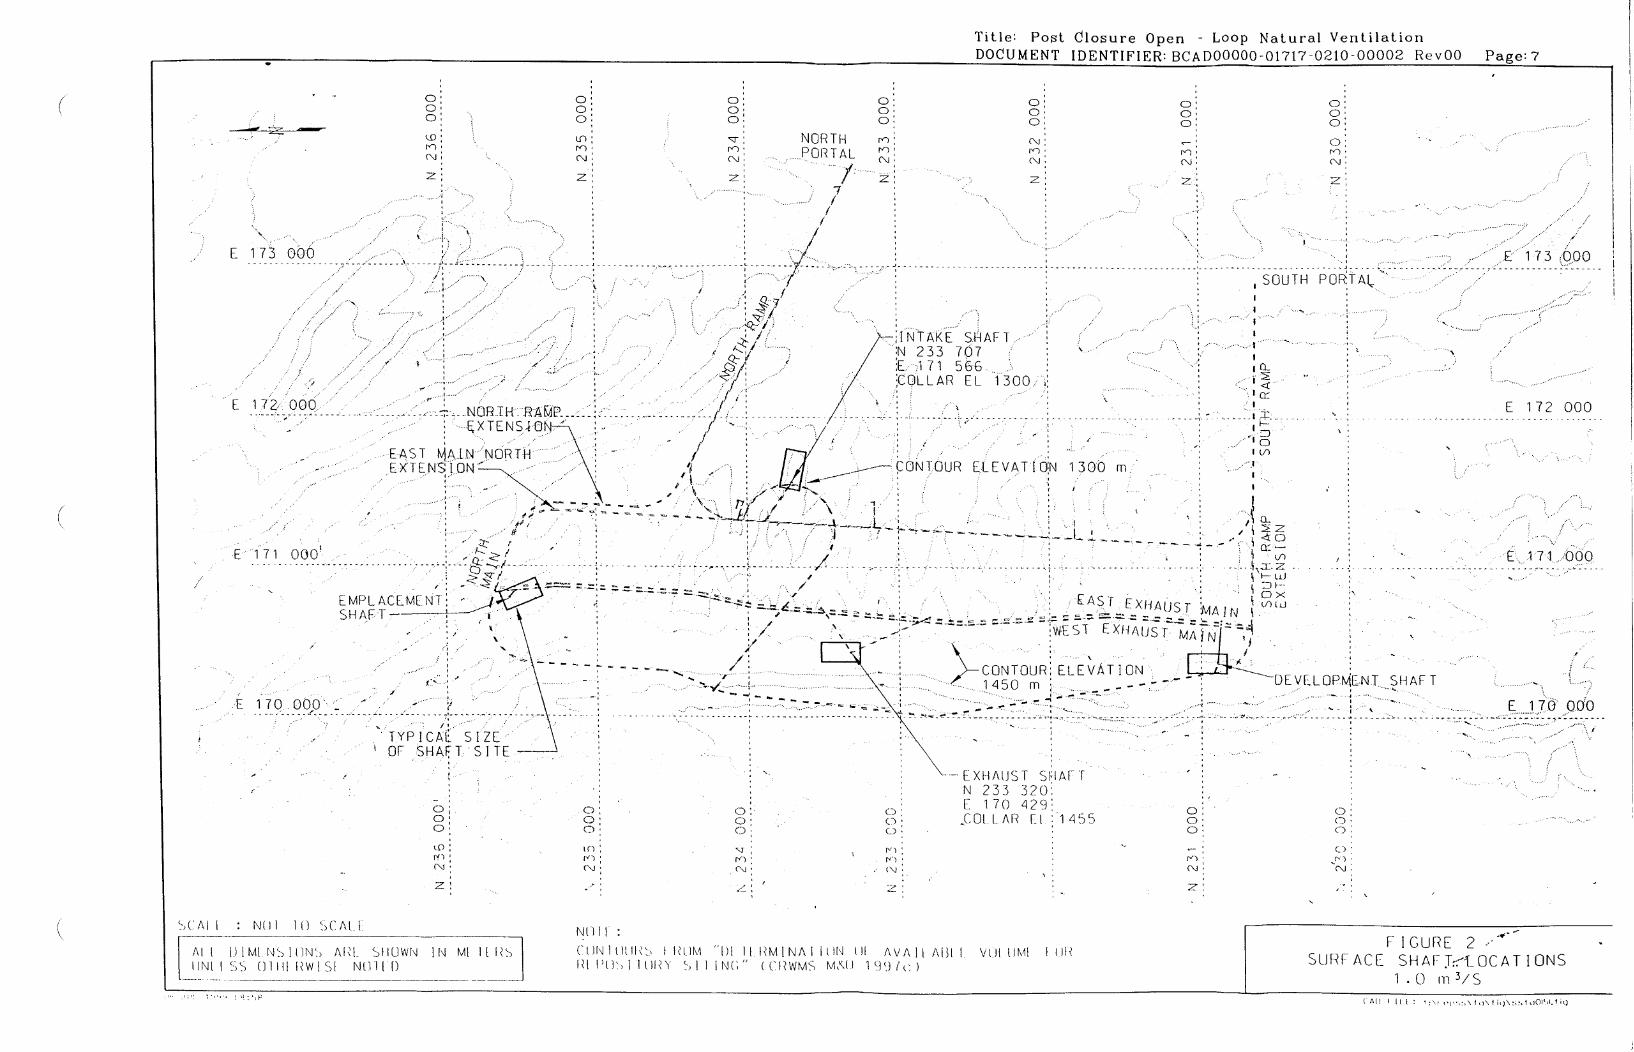
North Ramp 1123 CRWMS M&O 1996a, pg 27 South Ramp 1160 CRWMS M&O 1996a, pg 27 Development Shaft 1452 CRWMS M&O 1997b, Fig. 7-1 Emplacement Shaft 1455 CRWMS M&O 1997b, Fig. 7-1 Additional Intake Shaft 1300 Estimated from Figure 2 Additional Exhaust Shaft 1455 Estimated from Figure 2
BCAD00000-01717-0210-00002, Rev. 00 July1 9, 19996
Title: PoPL Closure Open - Loop Natural Ventilation DOCUMENT IDENTIFIER: BCADOOOOO-01717-0210-00002 RevOO
a'
(0'
(N
E 173 000
E 172.:000ý
E 1*7.1000k
a a a
r�) (N
- - -- - -- --- -
-,NOR-TH RAMP -----
EXTENSION"-
EMPLACEM[NT!
El170.000
TYPICAL OF SHAFT1
si zr SI 11F
C' a' aD
tn:
fN-)
CD::0.:0 : 0'
NORTH C\ N'
PORTAL
SOUTH POR:TAI
A INTAKE S.HA FT. ýZ7 :N 233 707
:E. 171 566. .
-COLLAR E L 1300.a:
-,r
- f - - - - - -- " - - I- ' - - - - - - - - - - - - - - - - -
* I I L Z -' TUR LEV T I Y N 130
t ----
T X
-~ A' .IT.MAIS .vHALu
/ V -:WEST E XHAtjS I-MI
. .. . CONTOUR; ELEVATION L~L ... ........ m....- -DELVFLOP.MLN1, S
.. .... . 1 4 5
EXHAUST SH~AF I N 233 320:
C)-C OLLAFR [1 :1455a0:
(\,J aj a - Cz
.E173 000o
E 172 000
E ,17 1-:0 0 0
'H AF T
E1,7.0 9000
(-('l A : NH I IH SCAtI[
C ,[H I~tiiI.2I' 1\rx4 '"M 11IM INA] ill (HI AVAIL A131 I VIJii tN~II iFlIC U FE 2
SURFACE, SHAI Th-IOCAT IONS 1 .0 1113/S
Page: 7
KAl [ W) IMI NS I tIN' ') AHI' SI ILIWNI"' NL MI I [lW) IINI I SS () I IIIHW I Sl NO I I P

This calculation used the software package Vulcan Version 3.3 (TBV) to develop the layouts for the repository for both the VA reference design and the 1 m3/sec per emplacement drift ventilation models. The Vulcan Model used the Subsurface Repository Slopes analysis (CRWMS M&O 1997d) as input for the layout and the Repository Subsurface Layout Configuration Analysis (CRWMS M&O 1997b) as input for the shaft coordinates. The following elevations are assumed based on the Vulcan Model:
Item Elevation (in) Development Shaft 1089.69 Emplacement Shaft 1020.32 Additional Intake Shaft 1055.86 Additional Exhaust Shaft 1043.20
The elevations for the North and South Ramps are from the Exploratory Study Facilities (ESF) design. The other elevations are existing data and do not require confirmation as they will not be used for construction, fabrication, or procurement. [Used in Section 5.5.1 and Attachment I]
3.9 Average Infiltration Rate The average infiltration rate for the repository is 5-10 mm/yr from the NearField/Altered-Zone Models Report (Hardin et al., pg 1-5). This range of flux values is existing data and does not require confirmation. It is conservative to equate the average seepage flux into an emplacement drift to the average infiltration flux at the surface. A range of values is provided because there is variability in the measurement of infiltration flux over an area the size of the repository. [Used in Section 5.5]
3.10 Average Length of Emplacement Drift An average emplacement drift is 600m long. This value is approximate and is based on a review of the Repository Subsurface Layout Configuration Analysis (CRWMS M&O 1997b, Table 1-3). This value is existing data and does not require confirmation as it will not be used for construction, fabrication, or procurement. [Used Throughout]
3.11 Psychrometric Properties of Air Psychrometric properties of air, under various conditions, have been calculated in the Overall Development and Emplacement Ventilation Systems (CRWMS M&O
BCAI){}0000-01717-0210-00002, Rev. 00 July 9, 19998

1997a, pg V-3). The relative humidity (30%), specific humidity moisture (52.263 gr/lb of air), and specific volume (15.7 ft3/lb air) values are existing data and do not require confirmation as they will not be used for construction, fabrication, or procurement. [Used in Attachments VI, VII, & Section 5.5.1]
3.12 Precipitation Over 10,000 Year Period (To Be Verified) (TBV) This calculation will use an influx rate of 60 mm/yr as representative of the worst case expected and will base its conclusions upon this value. As, shown in Assumption 3.9 the current precipitation is in the range of 5-10 mm/yr. The choice of the 60mm/yr value is an engineering judgement as to the worst case conditions expected over the 10,000 year period and is considered conservative. [Used in Section 5.5 and Attachment VIII]
3.13 Control of Ventilation Air Ventilation air will be controlled by regulators. Regulators will be required in
order to split the -air as needed to ventilate the emplacement drifts and other repository areas (Hartman et al., pg 255). For this calculation, ventilation air will be assumed to travel the shortest path from entrance to exit. That is, entrance and exit for ventilation air will be relatively close to each other. For example, the air from the North Ramp will generally exit at the Emplacement Shaft and not at other locations. This assumption is a reasonable one as it would be impractical to transfer the ventilation air long distances in the repository. [Used in Attachments II, III, and Section 5.1]
3.14 Rock Wall Temperature Over 10,000 Years (TBV) An estimate of the drift wall and air temperatures for years 1 through 300 with a ventilation rate of 1 m 3/s is available from Repository Subsurface Emplacement
and Thermal Management Strategy (CRWMS M&O 1998e, Pg 1-42). This data for locations 100, 300. 500 and 600 meters from the intake end of the emplacement drift is shown in Attachment IV, Table IV-1. An estimate of the temperatures on the side of the waste packages and at the rock wall for years I through 10.000 (with no ventilation) are available from Multiple TP Emplacement Thermal Response - Suite I (CRWMS M&O 1998c. pg 28). The data in these two tables are used as input to estimate the air and drift wall temperatures that would exist if the emplacement drift were ventilated from 300 to 10,000 years after emplacement. The assumption used in the estimation is that the data can be plotted and the curves for data from Assumption 3.20 can be
extended by a hand sketch to be parallel to the unventilated Assumption 3.21 data. The results of the plots are shown in Attachment IV, Figures IV-1 and IV- 2. The
output of the estimation is shown in Attachment IV, Table IV-1.The method is considered adequate for this conceptual work. Methods using computer models may appear to be more accurate. However. there is a great deal of uncertainty in the inputs for the computer models when a prediction of conditions 10.000 years in the future is required. [Used throughout]
t1CA D00000-01717-0210-00002. Rev. 00 9 Jully 9, 1999
3.15 Waste Package Side Temperatures (TBV) The assumption used to determine the waste package side temperature is that the
ratio of the waste package skin temperature over the wall rock temperature is
constant whether it occurs under no ventilation conditions or under ventilated
conditions. The assumption is based on engineering judgement. The input for the
waste package side temperature calculation is contained in Assumption 3.21.
[Used in Attachment V and Section 5.4]
3.16 Minimum Pillar Width Drifts crossing underneath one another will have a minimum pillar width of 10 m, similar to the pillar between the emplacement drifts and the Exhaust Main shown in the Repository Subsurface Layout Configuration Analysis (CRWMS M&O
1997b, pg 79). Performance Confirmation drifts, including the ECRB, shall be
located 15-20m above the emplacement drifts as per the Subsurface Facility System Description Document (CRWMS M&O 1998g, Volume I, Item 1.2.1.19). This calculation will use 20m for conservative reasons. This information is existing data and does not have to be confirmed as it will not be used for
construction, fabrication or procurement. [Used in Attachments I, II, and III]
3.17 Alcove Dimensions Alcoves can be many different sizes. For this calculation, alcove dimensions for
intake and exhaust raises are 7m high x 8m wide x 10m long to accommodate
raise-boring equipmerlt. Raises are located in the center of the alcoves to take
into account any deviation of the pilot hole. All dimensions are based on engineering judgement. This information is existing data and does not have to be confirmed as it will not be used for construction, fabrication, or procurement. [Used in Attachments I, II, and III]
3.18 Gas Constant The gas constant "'R" is 53.35 ft lb/lb mass 'R from Hartman et al'., pg 13. [Used in Section 5.5]
3.19 Distance Between Exhaust Mains The center-to-center distance between Exhaust Mains shall be at least three drift
diameters for ground stability (or about 23m for this calculation). This
assumption conforms to the advice in Jaeger & Cook (1976, pg. 497). This information is existing data and does not have to be confirmed as it will not be
used for construction, fabrication, or procurement. [Used in Attachments I, IL, and LII]
3.20 Emplacement Drift Air and Rock Wall Temperature (TBV) Table 2 is from Repository Subsurface W1aste Emplacement and Thermal
Management Strategy (CRWMS M&O 1998e, pg 1-42).
RCA D00000-01717-0210-00002, Rev. 00 10 July 9, 1999

Table 2. Emplacement Drift Air and Rock Wall Temperatures with Ventilation Time after Temperature 'C Emplm't Air Wall Air Wall Air Wall Air Wall (Years) @ loom @ lOOm @ 300m @ 300m @ 500m @ 500m @ 600m @ 600m
1 34.53 74.19 44.93 77.92 49.44 79.54 50.62 79.96 5 46.81 88.37 72.85 101.67 86.00 109.52 89.80 111.65 10 50.47 93.10 84.79 114.80 104.64 126.49 110.93 130.11 20 51.46 93.47 90.44 121.08 114.81 136.84 123.03 141.91
30 50.86 89.97 91.31 119.84 118.3 137.74 127.83 143.85 40 49.33 85.57 88.87 115.95 116.71 135.33 126.90 142.15 50 47.60 81.09 85.44 111.25 113.37 131.64 123.91 138.98 60 45.93 76.91 81.87 106.39 109.51 127.56 120.21 135.26 70 44.39 73.15 78.38 101.55 105.56 123.40 116.31 131.35
80 43.01 69.80 75.18 97.52 101.74 119.37 112.46 127.47 90 41.80 66.88 72.33 93.71 98.18 115.59 108.82 123.81 100 40.73 64.30 69.74 90.26 94.81 111.98 105.37 120.32 150 38.58 55.80 64.62 79.48 88.01 99.96 98.47 109.66 200 35.97 50.83 58.06 71.60 78.90 90.16 88.87 99.58 250 34.41 47.71 53.58 66.07 72.14 82.97 81.16 91.26 300 33.37 45.51 50.45 62.07 67.23 77.65 75.35 85.09
[Used in Section 5.4 and Attachments IV, V, VII, and VIII]
3.21 Waste Package Side and Rock Wall Temperature (TBV) Table 3 is from Multiple WP Emplacement Thermal Response - Suite ] (CRWMS M&O 1998c, pg 28).
Table 3. Waste Package Side and Rock Wall Temperature w/o Ventilation
Year After Emplacement WP Side (uC) Rock Wall ("C) 1 135 97 5 166 139 10 184 163 20 198 181 30 198 184 40 197 185 50 195 183 60 192 182 70 189 180 80 185 177 90 183 175 100 180 173 200 170 165 300 164 160 400 160 156 500 157 154 1000 146 144 1500 139 137 2000 133 132 3000 128 127 4000 129 128 5000 130 129 6000 130 129 7000 130 129 8000 129 129 10000 127 127
[Used in Attachment IV and Section 5.4]
[ICA D00000-01717-0210-00002, Rev. 00 R1l% (), 1999I I
3.22 Bottom of Shaft Elevation for VA Design The bottom of the emplacement shaft elevation for the VA design is 1038.09m as
shown in Repository Subsurface Layout Configuration Analysis (CRWMS M&O
1997b, pg IV-2). The bottom of the development shaft is 1110.27m (CRWMS
M&O 1997b, pg IV-1). [Used in Attachment I]
3.23 10% Added to All Lengths A 10% factor has been added to all lengths used in the ventilation models to
account for joints and minor misalignments. The factor is based on the lower
range specified in Hartman et al., pg 160 for shock losses and ensures a
conservative calculation. [Used in Attachments II & III]
3.24 Fan Curves A Joy-M144-79-590 type fan is used in the VA ventilation model. A Joy-M132
79-710 type fan is used in the 1 m3/sec ventilation model. The choice of these
fans is by engineering judgement. Fan curves from the Joy Axivane Fans Mining
Catalog J-670 are included in Attachments II and III. The permission letter is
included in Attachment IX.
3.25 Fan Efficiency and Power Cost A fan efficiency of 75% has been allowed in the ventilation models. This fan
efficiency is conservative and is industry experience for primary fan estimation
purposes. A power cost of $0.10 per kilowatt hour has been allowed in the
ventilation models. This value is considered reasonable for estimation purposes.
Both values are existing data and do not have to be confirmed as they will not be
used for construction, fabrication, or procurement. [Used in Attachments II and 111]
3.26 Maximum Grade for Excavation
The maximum grade for excavation is ± 3 % from the Subsurface FacilitY System
Description Document (CRWMS M&O 1998g, Item 1.2.4.2). [Used in Attachment I]
3.27 Turning Radius for a Tunnel Boring Machine (TBM)
The minimum turning radius for a TBM is 305m from the Subsurface
Construction and Development Analysis (CRWMS M&O 1998i, pg 11-5). This
value provides the radius for curves used in Figure 1-4. This radius is existing
data and does not have to be confirmed as it will not be used for construction, fabrication, or procurement.
4. USE OF COMPUTER SOFTWARE
Word processing (Microsoft Word) and spreadsheet (Microsoft Excel) software were
used for the main body of this calculation. The use of common, off-the-shelf computer
programs do not require validation and verification under the applicable M&O procedures.
•ICA D00000-0 1717-021 0-00002. Rev. 00 12 Jul\' 9, 1999

A simulation of the repository ventilation network was constructed using VNETPC Software, Windows Version 1.0a. The software was appropriate for this use and used only within its validated range as described in the Software Qualification Report for VNETPC for Windows: Version 1.0a (CRWMS M&O 1999a). This software was obtained from and designated by the Software Configuration Manager with an identifier of CSCI 30029 VI.0a. This program was run on a Gateway 2000 computer, model P5166. The input and output for this program are shown in Attachments I, II, III, and are discussed in Section 5.2.
The conceptual layouts in this calculation were developed on the Vulcan Software. Vulcan Version 3.3 (TBV) is an unqualified software program. This software was run on a Silicon Graphics Indigo 2 computer system (CPU# 700592) with a Unix operating system. Since this software is unqualified, the layouts are considered to be TBV and are not to be used to support construction, fabrication, or procurement. The software was originally acquired to specifically perform this type of work and the software is appropriate for its application to this engineering calculation.
5. CALCULATION
This calculation is divided into several sections. The first section discusses how the natural ventilation pressure is determined. The next section discusses the output and other aspects of the VNETPC ventilation simulation. A section is devoted to a discussion of how the air temperature,thermal information was extended from the Repository Subsuiface Waste Emplacement and Thermal Management Strategy (CRWMS M&O 1998e). A section discusses how the waste package skin temperature, calculated in the Multiple WP Emplacement Thermal Response- Suite I (CRWMS M&O 1998c) (with no ventilation), was modified to the present situation that does include ventilation. A section is included that discusses how the air moisture was determined. The final section summarizes the air temperature, air moisture, and waste package skin temperature over a 10.000 year period.
5.1 Determination of Natural Ventilation Pressure
A determination of natural ventilation pressure can be made using the formula contained in Hartman et al., p 298.
H- = 44 Pa! I 0C/ I 00m or H, = 0.03 in/ 100F/ 100 ft (Equation #1)
This means that 44 Pascals of natural ventilation pressure will be developed for each difference in air temperature of 10C and each l00m difference in elevation.
Natural ventilation pressure (NVP) can change with the temperature differences caused by the seasons. For this calculation, ambient conditions of natural rock temperature, seasonal surface temperature and barometric fluctuations will be neglected. These simplifications ensure the calculation will be conservative, as only the temperature
BCAI)00000-01717-0210-00002. Rev. 00 13 July 9. 1999

difference in the emplacement drift and elevation change between intake and exhaust will be considered. Table 4 is a simplified version of the NVP expected in the repository.
Table 4. Simplified Natural Ventilation Pressure Table
Path A Elev (m) (3.8) A Temperature ("C) NVP (Pa) Calculation N. Ramp-E. Shaft 1455-1123=332 35 511 44(35110)(3321100) S. Ramp-D. Shaft 1452-1160=292 35 450 44(35/10)(292/100) New I. Shaft -New 1455-1300=155 35 239 44(35/10)(155/100) E. Shaft
Note: For this example, intake temperature = 25TC (3.6) and exhaust temperature = 60TC. The 60TC air temperature is used as an example in Table 4. The air temperature at the exit will vary over time because the heat generated by the waste package will change. Attachment VIII shows how NVP will vary over time.
5.2 Ventilation Simulation
The repository layout (3.1) shown in Figure 1 was used for this calculation. A simplified version of the layout is shown in Attachment I. The repository layout can be simplified because of the parallel and similar nature of the emplacement drifts. The 105 drifts shown in Figure 1 has been reduced to 19 drifts.
A VNETPC simulation was run that distributed a relatively equal volume of air to the emplacement drifts. This simnulation used mechanical fans to power the system (see Attachment III). The same layout configuration was analyzed using NVP as the driving force. This simulation revealed that a volume of at least 0.1 m3/sec could be achieved in each emplacement drift. However, a volume of I m3/sec could not be achieved with the VA reference design (3.7) over the 10,000 year period for this calculation.
A new layout design was developed by the addition of new intake and exhaust shafts to achieve 1.0 m3/sec per emplacement drift . In addition a new Exhaust Main was added parallel and adjacent to the original Exhaust Main. This additional Exhaust Main will accept all flow from the emplacement drifts, the other Exhaust Main will accept all airflow's from the rest of the repository. The exhaust tubes in the Exhaust Main were removed to reduce the resistance in the main for the new layout.
The air entering the repository under natural ventilation conditions will need to be regulated to ensure that the correct amount of air flows in each emplacement drift (3.13). Although the design of these air regulators is outside the scope of this analysis, it is noted that they will be required to function for up to 10,000 years.
5.3 Determination of Temperatures Over 10,000 Years
Attachment IV is developed using Assumption 3.14. Attachment IV plots temperature information for the period 1-10,000 years from the Multiple WP Emplacement Thermal Response- Suite I (CRWMS M&O 1998c) calculation. This information is for emplacement drifts with no ventilation. This information is used to extend the
BCAI)0000-(-01717-0210-00002, Rev. 00 Ally 9, 199914

emplacement drift temperatures (with ventilation) found in the Repository Subsurface Waste Emplacement and Thermal Management Strategy (CRWMS M&O 1998e) analysis.
5.4 Determination of Waste Package Side Temperature
Waste package side temperature has been determined for the first 10,000 years of repository life with no ventilation (Assumption 3.21). Table 5 shows the calculation of the ratio of WP side temperature over rock wall temperature (Assumption 3.15). Attachment V takes the rock wall temperature shown in Attachment IV and multiplies it by the ratio shown below for 100m, 300m, and 500m intervals for the period 1-10,000 years.
Table 5. Calculation of Waste Package Side Temperature
Temperature °C - 600 m
Year Rock Wall' WP Side" Rock Wall' Ratio (WPIRW) WP Side with vent. wlo vent. wlo vent. Temperature with
ventilation
1 79.96 135 97 1.3918 111 5 111.65 166 139 1.1942 133
10 130.11 184 163 1.1288 147
20 141.91 198 181 1.0939 155 30 143.85 198 184 1.0761 155 40 142.15 197 185 1.0649 151
50 138.98 195 183 1.0656 148 60 135.26 192 182 1.0549 143 70 131.35 189 180 1.0500 138 80 127.47 185 177 1.0452 133 90 123.81 183 175 1.0457 129
100 120.32 180 173 1.0405 125 150 109.66 174" 168* 1.0357 114
200 99.58 170 165 1.0303 103 250 91.26 167* 163* 1.0245 93
300 85.09 164 160 1.0250 87 400 79 160 156 1.0256 81
500 74 157 154 1.0195 75 1000 65 146 144 1.0139 66 1500 59 139 137 1.0146 60
2000 55 133 132 1.0076 55 3000 54 128 127 1.0079 54 4000 53 129 128 1.0078 53 5000 52 130 129 1.0078 52 6000 51 130 129 1.0078 51 7000 50 130 129 1.0078 50 8000 50 129 129 1 50
10000 50 127 127 1 50
Notes: 1) Rock Temperatures from Table 2 (3.20) for the period 1-300 years. Rock Temperatures from Table IV-1 for the period 400-10.000 years.
2) Waste Package Side and Rock Wall temperature from Assumption 3.21. Values shown with an "*" are estimated.
BCA )00000-01717-0210-00002, Rev. 00 15 JRik, 9. 1999

5.5 Air Moisture Determination
A determination of the moisture in the air can be made by adding the moisture contained
in the outside air to the moisture picked up by the air as it travels through the repository.
This is accomplished as will be described below. This section of this calculation will be
calculated in English units and then converted to SI units as this matches the information in Attachments VI and VII.
5.5.1 Mass of Water Added to Air
The average precipitation over the repository is 5-10 mm/year (3.9). This section will use
10 mm/yr as an example. In addition an average emplacement drift is 600m long (3.10)
and 5.5m in diameter (3.1) (TBV-333). The ventilation rate is assumed to be 1.0 m3/sec
(3.7).
Step Name Calculation Result
1) Influx of water 10 mm/yr
2) Influx of water (inches) 10mm/ 25.4mm/in 0.3937 in/yr
3) Influx of water (feet) 0.3937in/ 12in/ft 0.03281 ft/yr
4) Area (ft2) (600m)(5.5m)/(0.3048) 2ft2 /m236,000 ft2
5) Volume of Water 0.03281 ft/yr x 36,000ft2 1181.1 ft3 /yr
6) Mass of Water/Year 1181.1 ft3/yr x 62.4 lb/ft3 73,700 lb/yr
7) Mass of Water/Minute 737001b.yr/(365 x 24 x 60) 0.14022 lb/min
8) Grains of Water/Minute 0.140221b/min x 7000 gr/lb 981.54 gr/min
9) Volume of Air in Drift/Min I m3/sec = 2119 ft3/min 2119 ft3/min
10) Mass of Air in Drift/Minute 21 19ft3/min /15.7ft3/lb air* 134.968 lb/min
11) Grains Water/Pound Air 981.54/134.968 7.272 gr/lb of air
12) Mass of Water @ 30% RH 52.263 gr/lb of air**
13) Total Mass of Water 7.272 + 52.263 59.5 gr/lb of air
Notes: 1)* 15.7 ft'/lb of air (3.11) 2) ** 52.263 gr/lb of air (3.4 & 3.11)
BCADO00000-01717-0210-00002. Rev. 00 Jul". 9. 199916

3) Attachment VI is an expansion of this calculation and uses 60 mm/yr precipitation (3.12). 4) The unit "grains" is used because of the small masses involved in this calculation. Information from Attachment VI will provide input to Attachment VII to determine the
relative humidity of air in the emplacement drifts.
5.5.2 Development of Psychrometric Chart
The following equations are from Hartman et al., pgs 14-16. Pb = Pa + Pv (Equation #2)
Pb = Barometric Pressure in inches of Hg Pa = Partial Pressure of Dry Air (in. Hg) P, = Water Vapor Pressure (in. Hg)
The specific humidity is calculated:
W = 0.622 [Pv/ (Pb - PA)] lb/lb of dry air (Equation #3)
If Equation #3 is multiplied by 7000 the result will be expressed in grains/ lb dry air. An example how to calculate the grains/ lb of dry air was done in Section 5.5.1.
The specific volume is calculated:
v = RTd/ Pa (ft3/lb) (Equation #4)
v = Volume per unit weight of Air Td Absolute Dry-Bulb Temperature (°R) R Gas Constant (53.35 ft lb/lb mass 'R) (3.18) Pa , Partial Pressure of Dry Air (lb/in 2)
The saturation vapor pressure at the dry bulb temperature is calculated:
P, = 0.18079 exp ((I 7 .2 7 td - 552 .6 4 )/(td + 395.14))
P- = Saturation Vapor Pressure- Dry Bulb (in. Hg) td = Dry Bulb Temperature ('F)
(Equation #5)
The saturation vapor pressure at the wet bulb temperature is calculated:
P,' 0.18079 exp((l 7.27t, - 552.64)/(t,, + 395.14))
P,' Saturation Vapor Pressure- Wet Bulb (in. Hg) t,, = Wet Bulb Temperature ()F)
(Equation #6)
13CA D00000-01717-0210-00002. Rev. 00 July. 9. 199917

The partial pressure of water vapor is calculated:
P, = P,' - ((Pb - Ps')(td - tw,)/ (2800 - 1.3t,)) in. Hg (Equation #7)
Equation #6 can be substituted into Equation #7. Given that Partial Pressure of Water Vapor (P,) has already been calculated, the Wet Bulb Temperature (t.)can be determined. This equation is not shown.
The relative humidity is calculated:
Relative Humidity = (PI/P,) x 100% (Equation #8)
Enthalpy is calculated:
h =- 0. 2 4 td + W(1060 + 0. 4 5 td) (Equation #9)
h = Btu/ lb dry air
Attachment VII uses these formulas to determine the relative humidity over the 10,000 year period. Some of the numbers in Attachment VII are not exact, due to rounding of some values.
Attachment VI uses a relative humidity of 30% and a precipitation amount of 60
mm/year. The 30% relative humidity of the emplacement drift inlet air was chosen as per
Assumption 3.4. The 60 mm/yr value (3.12) was chosen in order to be very conservative. This precipitation amount introduces more moisture into the emplacement drift.
The total mass of water calculated in Attachment VI does not exactly match the moisture
shown in column "M" of Attachment VII. Attachment VI was based on the formulas detailed above. The wet bulb temperature (Attachment VII, column "e") was adjusted until the moisture content in column "M" nearly matched the value calculated in Attachment VI. The relative humidity that was determined in Attachment VII (column "K") was the basis for the relative humidity shown in Attachment VIII.
6. RESULTS
A summary of results can be found in Attachment VIII. All results from this calculation are TBV because of the number of assumptions made and because of inputs that are also TBV. The results from this calculation will not be added to the formal To Be Verified/ To Be Determined (TBV/TDB) tracking process because of the conceptual and preliminary nature of the information
13CADOOOOO-01717-02 10-00002. Rev. 00 18 Juky 9. 1999

7. REFERENCES
CRWMS M&O (Civilian Radioactive Waste Management System Management and Operating Contractor) 1996a. ESF Layout Calculation. BABEADOOO-0 1717-0200-00003 REV 04. Las Vegas, Nevada: CRWMS M&O. ACC: MOL. 19960930.0095.
CRWMS M&O 1997a. Overall Development and Emplacement Ventilation Systems. BCAOOOOOO-01717-0200-00015 REV 00. Las Vegas, Nevada: CRWMS M&O. ACC: MOL.19980123.0661.
CRWMS M&O 1997b. Repository Subsurface Layout Configuration Analysis. BCAOOOOOO-01717-0200-00008 REV 00. Las Vegas, Nevada: CRWMS M&O. ACC: MOL.19971201.0879.
CRWMS M&O 1997c. Determination of Available Volume for Repository Siting. BCAOOOOOO-01717-0200-00007 REV 00. Las Vegas, Nevada: CRWMS M&O. ACC: MOL. 19971009.0699.
CRWMS M&O 1997d. Subsurface Repository Slopes. BCAAOOOOO-01717-0200-00007, REV 00. Las Vegas, Nevada: CRWMS M&O. ACC: MOL. 19971125.0578.
CRWMS M&O 1998a. Air Quality Control Design Analysis. BCADOOOOO-01717-020000008 REV 00. Las Vegas, Nevada: CRWMS M&O. ACC: MOL. 19980729.0044.
CRWMS M&O 1998b. Controlled Design Assumptions Document. BOOOOOOOO-017174600-00032 REV 05. Las Vegas, Nevada: CRWMS M&O. ACC: MOL.19980804.0481.
CRWMS M&O 1998c. Multiple WH Emplacement Thermal Response - Suite 1. BBAOOOOOO-01717-0210-00001 REV 00. Las Vegas, Nevada: CRWMS M&O. ACC: MOL. 19980807.0311.
CRWMS M&O 1998d. Not Used.
CRWMS M&O 1998e. Repository Subsurface Waste Emplacement and Thermal Management Strategy. BOOOOOOOO-01717-0200-00173 REV 00. Las Vegas, Nevada: CRWMS M&O. ACC: MOL.19980918.0084.
CRWMS M&O 1998f. East-West Cross Drift Starter Tunnel Layout Analhsis. BABEAFOOO-01717-0200-00008 REV 01. Las Vegas, Nevada: CRWMS M&O. ACC: MOL.19980216.0530.
CRWMS M&O 1998g. Subsurface Facility System Description Document. BCAOOOOOO01717-1705-00014 REV 00. Las Vegas, Nevada: CRWMS M&O. ACC: MOL.19980826.0161.
13CADOOOOO-0 1717-0210-00002, Rev. 00 19 J uyv 9, 1999

CRWMS M&O 1998h. Not Used.
CRWMS M&O 1998i. Subsurface Construction and Development Analysis.
BCAOOOOOO-01717-0200-00014 REV 01. Las Vegas, Nevada: CRWMS M&O. ACC:
MOL.19981124.0367.
CRWMS M&O 1999a. Software Qualification Report for VNETPC for Windows,
Version 1.Oa. 30029-2003 REV 00. Las Vegas, Nevada: CRWMS M&O. ACC:
MOL. 19990105.0206.
CRWMS M&O 1999b. Calculation of Effective Areas of Subsurface Openings During
Emplacement Mode. BCAAOOOOO-01717-0210-00002 REV 00. Las Vegas, Nevada:
CRWMS M&O. ACC: MOL.19990302.0101.
Joy Mining Machinery 1982. Joy Axivane Fans Mining Catalog J-670. New
Philadelphia, Ohio: Joy Mining Machinery. TIC: 244167.
Hardin, E.L.; Blair, S.C.; Bourcier, W.L.; Buscheck, T.A.; Chesnut. D.A.; DeLoach,
L.D.; Glassley, W.E.; Johnson, J.W.; Knapp, R.B.; Knauss, K.G.; Lee, K.; Meike, A.;
Myers, K.; Nitao, J.J.; Palmer, C.E.; Rogers, L.L.; Rosenberg, N.D.; Viani, B.E.;
Wittwer, C.; and Wolery, T.J. Near-Field' Altered-Zone Models Report. UCRL-ID
129179. Milestone Report SP310OM3. Livermore, California: Lavwirence Livermore
National Laboratory. ACC: MOL. 19980630.0560.
Hartman, H.L.; Mutmansky, J.M.; Ramani, R.V.; and Wang Y.J. 1997. Mine Ventilation
and Air Conditioning. Third Edition. New York. New York: John Wiley & Sons. Inc.
TIC: 236391.
Jaeger. J.C. and Cook. N.G.W. 1976. Fundamentals of Rock Mechanics, Second Edition.
John Wiley & Sons. Inc. New York, New York. TIC: 209863.
8. ATTACHMENTS
Attachment I (8 pages) VNETPC Items Common to Both Attachment 11 & III
Attachment 11 (24 pages) VNETPC Ventilation Model for VA Layout
Attachment III (29 pages) VNETPC Developed Ventilation Model for Airflow at 1.0 m3/s per emplacement drift
Attachment IV (3 pages) Air and Rock Wall Temperatures Over 10,000 Years
Attachment V (1 page) Rock Wall and WP Side Temperatures Over 10.000 Years
BCADI0{}0-() 1717-0210-00002, Rev. 00 20 July' 9, 1999

Attachment VI (1 page)
Attachment VII (5 pages)
Attachment VIII (1 page)
Attachment IX (3 pages)
Prediction of Moisture Content for Ventilation Air at Intermediate Location in Emplacement Drift @ Natural Ventilation Airflow = 1.0 m3/s
Predicted Psychrometric Properties of Ventilation Air in Repository Emplacement Side
Air and Drift Wall Temperature, Relative Humidity (RH), and WP Skin Temp Output
Permission Letter to use Curves
13CA )00000-0 1717-0210-00002, Rev. 00 21 Jul". 9. 1999

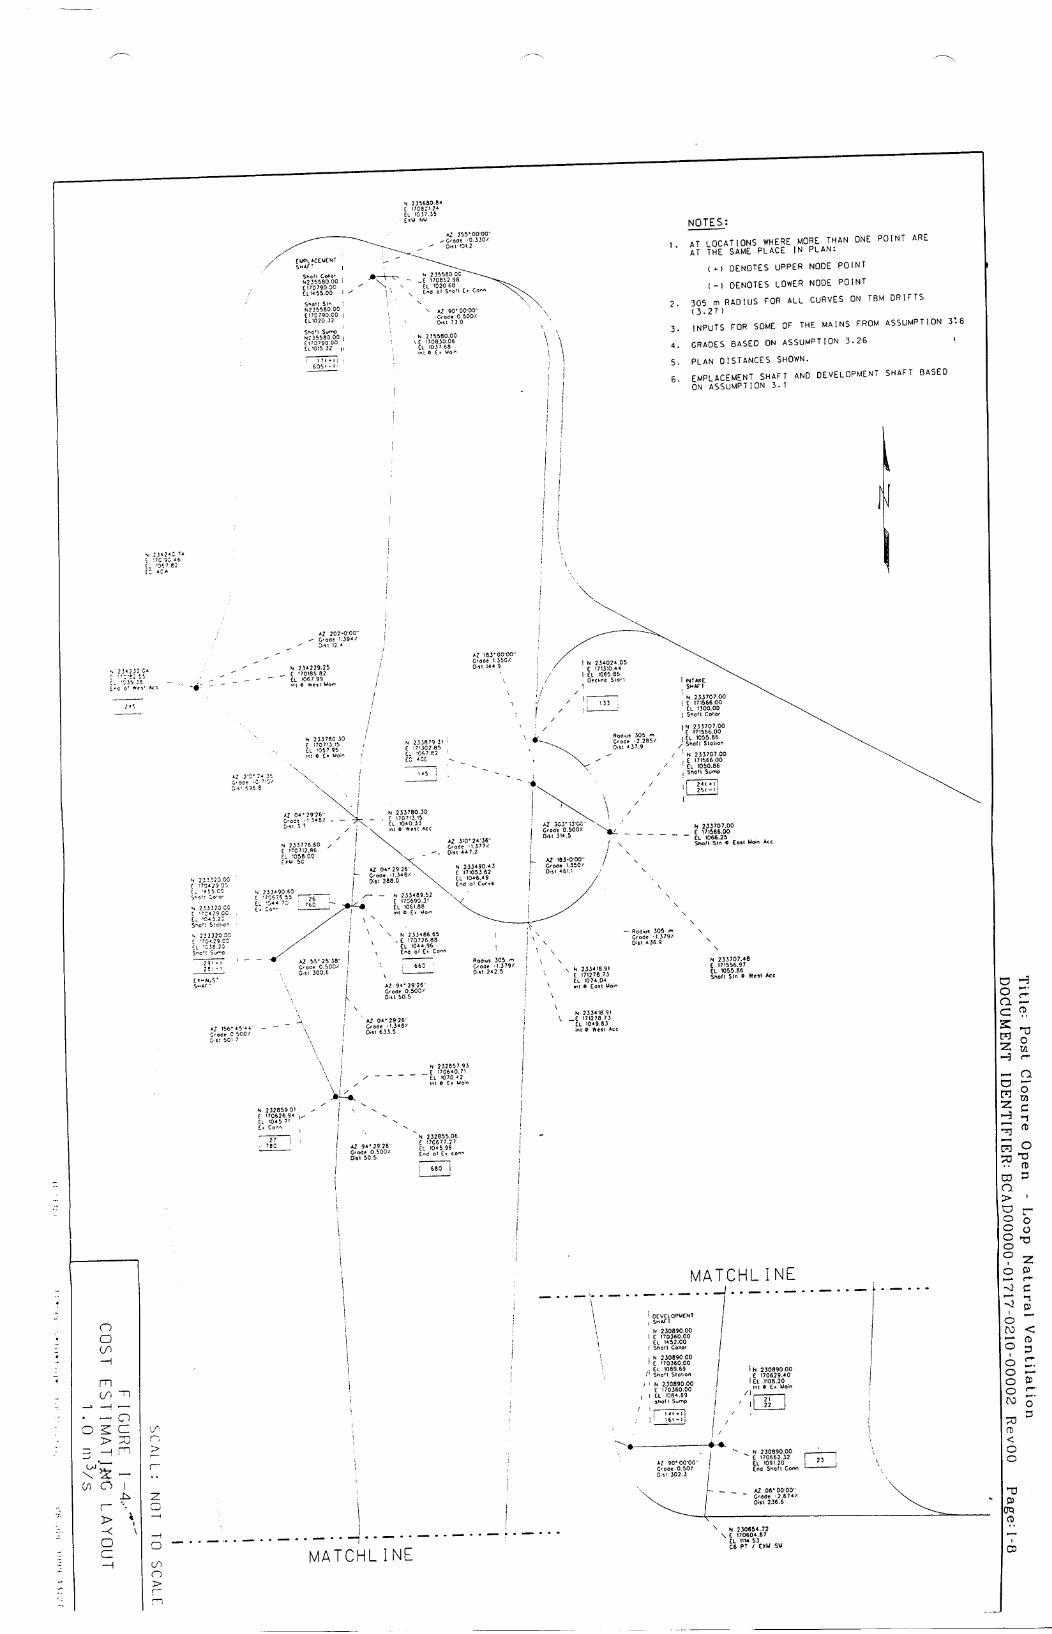
Post Closure Open-Loop Natural Ventilation ATTACHMENT I BCAD00000-01717-0210-00002 Rev 00 Page I-1 of 1-8
Attachment I
VNETPC Items Common to Both Attachments II & III
This attachment includes Figures showing the ventilation layouts for the no ventilation (VA reference design) and the I m3/sec per emplacement drift ventilation simulations. Horizontal distances used in this calculation have been noted on Figure 1-2. The vertical distances and certain other nodes are described below.
1) Emplacement Drift (ED) to Exhaust Main (EM) Raises:
Applies to Nodes : 402-502; 410-510; 415-515; 422-522; 430-530; 438-538; 445-545;
453-553; 460-560; 466-566; 475-575; 495-595; 4105-5105; 4120-5120
Node-to-Node Length:
'/2 ED diameter (Assumption 3.1) + ED to EM pillar (3.16) + '/2 EM diameter (3.1) =
½ (5.5) + 10 + /2 (7.62) = 16.56, varies between 16.6 and 17.3m to maintain line and grade on the mains.
2) Performance Confirmation (PC) to EM Raises
Applies to Nodes: 403-50', 433-533
Node-to-Node Length:
'/2 PC Drift diameter (3.1) + PC to ED pillar (3.16) + ED diameter (3.1) + ED to EM pillar (3.16) + V2 EM diameter (3.1) ½/2 (5.5) + 20 + 5.5 + 10 + ½/2 (7.62) = 42.06m, varies between 42.1 and 42.3m to maintain line and grade on the mains.
3) PC and ECRB to EM Raises
Applies to Nodes: 456-556; 467-567; 480-580, 4103-5 103
Node-to-Node Length
½/2 PC Drift diameter (3.1) + PC to ED pillar (3.16) + ED diameter (3.1) + ED to EM pillar (3.16) + /2 EM diameter (3.1) /2 (5.5) + 20 + 5.5 + 11 + /2 (7.62) = 43.06m, varies between 42.5 and 42.8m to
maintain line and grade on the mains. The ED to EM pillar slightly larger than minimum to preserve line & grade on ED or EM.
4) Horizontal Raise Connector of Exhaust Mains (connects between E & W EM)

Post Closure Open-Loop Natural Ventilation ATTACHMENT I BCAD00000-01717-0210-00002 Rev 00 Page 1-2 of 1-8
Applies to Nodes: 502-602; 503-603; 510-610; 515-615; 522-622; 530-630; 533-633; 538-638; 545-645; 553-653; 556-656; 560-660; 566-666; 567-667; 575-675; 580-680; 595-695; 5103-6103; 5105-6105; 5120-6120 Node-to-Node Length:
Node-to-node lengths are developed on Figure 1-2.
5) Emplacement Shaft for 1 m3/sec Simulation
Applies to Nodes: 17-605
Node-to-Node Length:
Surface Elevation (3.8) - Bottom of Shaft (3.8)- 1/2 Access Drift height (3.3) 1455- 1020.32- / 2 (7) =431.18 rounds to 431.2m
5a) Emplacement Shaft for VA reference design
Applies to Nodes: 17-605
Node-to-Node Length:
Surface Elevation (3.8) - Bottom of Shaft (3.22) - '/2 Access Drift height (3.3) 1455- 1038.09- 1 2 (7) = 413.41 rounds up to 413.5m
6) Development Shaft for I m3/sec Simulation
Applies to Nodes: 16-14
Node-to-Node Length:
Surface Elevation (3.8) - Bottom of Shaft (3.8) - ½ Access Drift height (3.3) 1452-1089.69 - ½/2 (7) = 358.81 rounds to 358.8m
6a) Development Shaft for VA reference design
Applied to Nodes: 16-14
Node-to-Node Length:
Surface Elevation (3.8) - Bottom of Shaft (3.22) - '/2 Access Drift height (3.3) 1452-1110.27- / 2 (7) = 338.23 rounds to 338.2m
7) Intake Shaft for 1 m3/sec Simulation
Applies to Nodes: 24-25
Post Closure Open-Loop Natural Ventilation ATTACHMENT I BCADOOOOO-01717-0210-00002 Rev 00 Page 1-3 of 1-8
Node-to-Node Length:
Surface Elevation (3.8) - Bottom of Shaft (3.8) - ½ Access Drift height (3.3) 1300- 1055.86- 1/2 (7) = 240.64 rounds down to 240.3m
8) Exhaust Shaft for lm 3/sec Simulation:
Applies to Nodes: 28-29
Node-to-Node Length:
Surface Elevation (3.8) - Bottom of Shaft (3.8) - ½ Access Drift height (3.3) 1455- 1043.20- '/½ (7) = 408.3m
9) East EM to West EM Raise (see sketch at bottom)
Applies to Nodes: 660-26; 680-27; 23-21
Node-to-Node Length:
'/2 East EM diameter (3.1) + ½ Alcove length (3.17) + ½ East EM diameter (3.1) + EM to Access Drift pillar (3.16) +- V2 Access Drift height (3.3) + V2 Alcove length (3.17) + ½ East EM diameter (3.1) + distance between East & West EM (3.19) + ½ West EM diameter (3.1) + /2 Alcove length (3.17) V2 (7.62) + 2 (10) + ½2 (7.62) + 10 + ½ (7) + /2 (10) + V2 (7.62) + 23 + V2 (7.62) + ½/2 (10) = 66.74, varies between 66.6 and 67.0m to maintain line and grade on the mains.
10) West EM to Drift Connector (see sketch at bottom)
Applies to Nodes: 22-21; 760-26; 780-27
Node-to-Node Length:
½ West EM diameter (3.1) + /2 Alcove length (3.17) + /2 West EM diameter (3.1) + EM to Access Drift pillar (3.16) + ½ Access Drift height (3.3) ½ (7.62)+-½ (10) + ½ (7.62) + 10 + ½ (7) = 26.12 rounds to 26.1m
E -- -7- L6 - j7,71
A/0,0~ 2tcS -? IjZ ? I
- - v

Post Closure Open-Loop Natural Ventilation ATTACHMENT I BCADO0000-0 1717-0210-00002 Rev 00 Page 1-4 of 1-8
11) Connecting Access Drift
Applies to Nodes: 26-28
Node-to-Node Length:
Distance from Figure 1-4 + '/2 Alcove length (3.17) 300.6 + 5 = 305.6m
12) Connecting Access Drift
Applies to Nodes: 27-28
Node-to-Node Length:
Distance from Figure 1-4 + ½2 Alcove length (3.17) 501.7 + 5 = 506.7m
13) Shaft Connecting Drift
Applies to Nodes: 25-245
Node-to-Node Length:
Distances from Figure 1-4 + approximate elevation difference from Figure 1-4 + ½/:
Alcove length (3.17) + '/2 Drift diameter (3.1)
(696.8+447.2+242.5+436.9) + (1067.99-1035.38) + '/2 (10) + ½/2 (7.62) = 1864.8m
Note for Items 9 & 10:
A pattern of drift or raise construction is shown in the calculation to determine the length of the airway. To simplify the VNETPC simulation, the average feature of a horseshoe shaped connector for nodes 23-21, and 22-21 is used. The other connectors for nodes 660-26, 760-26, 680-27, and 780-27 used an equivalent round access drift similar to a 7.62m diameter main.
Title: Post Closure Open - Loop Natural Ventilation DOdUMENT IDENTIFIER: BCADOOOOO-01717-0210-0000 2 RevOO Page: 1-5
GRAPH IC SCALE
0 100 200
600
�1
I-' '
.' ¶�710( I .
" ---31 IV -.- -... .
?I ° )I ' L -s°() -0i
-J I 4 )4101.
.10(.I
* I41511
-1 42-2.SI 522: 22 -°he -i ... 622(
�IA>Q. �N
��cbQ. cz�
�QA
eQ / QQ.
1 10 000
LEGEND:
.ESF DR I1I I
MAIN DRII 1
FMPL AC M[L NI DR IF T
-PC OR [CRB
VENTILAl ION DRIFT
-[EM)IY DR I I I
4331.1 5331I
tI 'Ill II
141 II
-I i. PQ/3 (14-.
4M
445i• 915 •.8 .1
6 o30(
130 1
(,33( l
I 111
1133 1
II138
!I / Q-,Q
NOTE
AT LOCATIONS WHi[RE MORE THAN ONE POIN1 ARE AT TilE SAMF PLACE IN PLAN:
(•) DENOTES UPP[R NODE POINT
(--) DLNOTES I.OWI-R NODI POIN1N
400 600 800 m
/
{- ._o_
215
212-2
0 Olo
1102 I
610(-)
11031N
1230 2331
110 1-1104 I
I -21 1
I I
05(0130( 1
[ 1 '1 5 -1
SI o 43015301 J
1 245
NOR 111 PORiTAL
122 1
Al44-,
I 1-ii
0#5
I 3}
-w-
"--,I
f
I

IV& y?
�. %/?
II1
F7601 - I]-
1155 ]
1 3667-1]
�6�l]
��1�U?.
116
7
P C "- /,-- :: -:-i.
ii' 480, 580:-l
675. .
Ii
AI 7 , " -. II 9549511
ý/v UIb ONc SEE 7I0I. CUR&'
() )000 400 600 8,00 n (,0.2
F :GUR[ 1 -2 - SU13SLJRF ACELOf POS I 1OR-Y VENI ILA1 ION NODfý,-S - SYSTEM A
DISTANCFS BEIWEUN NODFS
(
503
60323.8
538
63823.1
281
480
180
366.5
290. 1
656.6
[280
615
622
630
633
638
645
653
656
660
666
667
675
680
695
6103
6105
6120
23 7
245 601 .9
445 601.9
145
210 513.3
410 533.3
110
510 23.8
610
202.9
231.8
70.4
154.7
198.2
230.3
72.0
129.6
172.7
33.5
225.6
129.6
450.0
225.1
75. 1
450.2
860.,1
213.4
3 655.7
104 247.5
103
1153 3
23.8
545
645
580
680
295
495
195
23.6
160 ]
5
1457.6 1102 666. 7
179 695.7
155
100
600
700
200
201
202
203
210
215
222
230
233
238
245
253
256
260
266
275
280
292
295
2103
2105
2120
10
9
8
6
1120
1105
1103
1935
180
175
166
160
156
153
145
138
133
1 30
1, I72
I 0 (11 S100
629.0
629.0
29? ]
336.5
25. 1
241 . 7
236. 1
246.5
43.5
217.4
144.9
202.9
230. 1
70.1
154.5
197.1
228.9
71.5
128. 7
171.7
257. 5
128.7
376.2
75.9
235.2
78. 4
470.3
999.2
200.0
227.2
23.1
835.8
1093.1
434.8
72.5
211.4
449.3
130.4
260.9
1713. 9 130.4
72.5
231.9
202.9
159.4
72.5
231-.9
20?.9
144.9
217.4
67,~4.(,
295s
608.4
608.4
23.6515
23.8 615
595 24.7
695
132
131
155
215 533.3
415 533.3
115
553
653
253
453
153
2103 630.8
4103 630.8
1103
225.9
440.8
74S.0
479.4
380.9
403.0
476.3
L "75
2
131
157
467
281
292222
533.3 422
533.3 122
522
23.8 622
230 538. 3
430 538.3
130
5103 24.7
6103
1 79 1
256
637.1 456
556 23.6
656
260
614.1 460 614.1
160
700
701
702
703
710
715
722
730
733
738
745
753
756
760
766
767
775
780
795
7103
1105
7120
2?
8
138. 3
371.6
43.5
217.4
144.9
202.9
230.8
70.4
154.7
198.1
230.3
72.0
129.6
172.7
33.5
225.6
129.6
450.2
225.1
75. 1
450.2
865.8
214.9
1102
1103
2105
595.9 4105 575.7 1105,
(,tAI'l II ( C (C AtI-
179
180
530 23.2 630
233
433
133
5105.
24 7 6105
560
66023.8
31 .6
31.6
31.6
362.9 "
274.2
31.6
1 195 1
I • 1 0 000
576.4
576.4
155
156
157
4562120 546.3
4120 546.3
1120
266 619.0
466 619.0
1 66
NOTE
533
633
202
402
1 02
533. 3
51133 3
5120
6.120
132
133
24.7
23.623. 1
21 7, (567
667
10
II ,
79. 7
249.7
4 1402. 6 5
49.2
6
275 2(,.4 475
(26.4 I 75
1541.0 1110
I t.5
I
I,----- -06's--
1) 1) Ml N',,I IIN I NC (' ID[)[ vi [\ I 1 l,,/ t1 ,

Title: Post Closure Open - Loop Natural VentilationflCUl, rLL'N.TPI LU[r',IrI IDE N iI•Rt: LWAUUUUUU-U 'II (-U0IU-UUUU00 ievUO Page: 1-7
2103
2105
S It 1 II PitR I At
I I I
F I GURE VEN
1 1-3 - SUBSURFACL4tEPOSITORY TILATION NOD1<:- SYSTEM A DISTANCES BETWEEN NODES
I
GRAPHIC SCALE
0 100 200 400 600 800 m
1 10 000
4 1
23509080 O 1708210'
NOTES:S233565808 E 1708,1 2' 'L 1037.35 [6U NV
EL!CE0[2ENT
502*3580
E17079 0010
[L,0o5.32
E 1319o o 0X1I5.32
.2 355,0000' / O.ooo 50330'
23355 0 2 170852.98 EL 7020 68
\ Jz 90"0"O'Do 0', 0 57000 0.0 73 0
N 23558000
S708 30.06 EL 1037 68
0 C 17 0;^
NOTES: 1. AT LOCATIONS WHERE MORE THAN ONE POINT ARE
AT THE SAME PLACE IN PLAN:
(+I DENOTES UPPER NODE POINT
D-I DENOTES LOWER NODE POINT
2. 305 m RADIUS FOR ALL CURVES ON TBM DRIFTS
(3.2?) 3. INPUTS FOR SOME OF THE MAINS FROM ASSUMPTION 318
4. GRADES BASED ON ASSUMPTION 3.26
5. PLAN DISTANCES SHOWN.
6. EMPLACEMENT SHAFT AND DEVELOPMENT SHAFT BASED
ON ASSUMPTION 3.1
7'
I00 202.0"00"
-G Coe 1390 / 3,o7 12 0
N 233229.25 C [70,85 82 EL C 00799 770 N West0Uo
N 233780 30 O 17077 3.15 EL ,057 95 ,i7 O 0g,uo
023'0 " 7. 3 6300.C 73
0.0 188"00300" 0,s7 1447 N 23.02 E 171310 I EL 1065
/
N 233879 3, 0 77730265
E 067.e2 c.E56
)2-M 20 0_ 0.08
s1071 I 007800
- N 233707.00 •5l E 1715066 00
EL 1300.00 i 06011 C~oI
IN 233707.00 O 305171566.00
000 2.285/3. EL 1055.86 0.0 037 .9 / tSl60 1 o io0
N 233707.00
£17 1566.-Go CL 1050.86
SSWoS-
02 0 6 N 233760030
El I 016 3100.0
*0 23377 600 , O1-0712.86
-. E• 305600
EX 50C L &,Z o0.12 .2621$VI288.0
N2330399060
-0404 7- E 100 1690.11 S0 o. -" 7 160 EL '01'80 o 10,11,
E.
N 233-86665
E17,0726088
Q =255- 25 38' * (010.07 "-, ,./, :, , 6 6 0
0,s 300.6 0' , 9 2
AZ94-"29'26" G,0od 0.500, "Dl;t 50.5
N 2328590' EL 700537• )
E. C00
2700
Az 04" 29"26' CroMe •1.3-81 0;s, 633.5
N 2332857193
- -- - E 170640.71
-EL '0700A2
O 232855.00 ! 70677.27
0.2 029"26" •t 7045 2' 0, Me 0.500, IL 00 90
0050.5
12 310"21-36" o-,00 ,13771
OpSt AA•7.2
N 233,90 A3 E 17105362
.L 10000
0,o00 0o500 0$ 31-.5
0Z. 2 1830'00 / DC;,e 1350' 0, o1 001.7 /
CL0
P.6s. 305 17 0.000 -I 3 79/ 30169 01 202.5 . X N 233417
E 171278.
- Rod;,0 305 X Gro0e -1379' 0.61 0.3069
8.91 ý8,733
N 2"8707.00 E 171566.00 CL 1066.25 s-.0t, 0St7 Eo 0M om0Ac.
N N 23370 7.48 E 171556,97 EL 1055.86 Sha0t SiX 0 Welt Vc0
El 2301691
N 233-318,91 -.. E 17127873 EL 1049S3 I71 e 0*,ItACX
MATCHL I NE OF 00 1 0PM0ENI
SoH-F
N 230890.00 I E 170360.00
EL 152.00 C so011.1 Co1
N 23089000 r" 00360.00
EL '10098 9 9IN 230890.00 4 o055101.o E0170629.40 SN 230890.00 J EL 1108.20
21 080 .09 1 0 170360.00 E. i ;o ý
t S-/
EL 109120 0.00.00 4 01 0. v.s 302.3
- z- 086000000'
G,00. -2.6711
Ot0 236.6
MATCE - - -°
MATCHL I NE\\N 230654.72
E17060'.67 EL 1114.53 C6 PT / E9U S00
231232001
2Osl
I. 23''23.00 O 70023 0' 7. ,'55 c
S23'3320 0O
C 370292C " .2 1 707.00
s237320,0o
-1 '•029-, ;0 •38 20 !S-o S.
57 ,oe 0 5
201
C50(700'
-fl
C�) C
mp/"
CD
-- i
nr 0
CF 1
r--
z
C•
0
,17)
30.
0 0 0 0 0
0
0
0
0 0 0 0
CD
0 0
I
\
^

Post Closure Open-Loop Natural Ventilation
BCADOOOOO-01717-0210-00002 REV 00
ATTACHMENT II Page II- 1 of 11-24
VNETPC Ventilation Model for VA Layout
A ventilation model was created in preparation for postclosure natural ventilation mode. At this
stage, a projected normal mechanical ventilation balance was established with the two exhaust
ducts taken out. A diagram of the model was prepared with assigned nodes and branches.
Resistance of the branch representing the airways were calculated through Microsoft Excel
Spreadsheet and used as input to VNETPC. The ventilation model was simulated with a selected
fan curve on the primary ventilation system. From the performance shown by the primary fan
output of VNETPC, the overall system resistance was calculated. The overall resistance was
correlated and applied to natural ventilation pressure of 124 and 248 Pa (0.5 and 1.0 inch Water
Gage) postclosure mode. The results are tabulated below:
the 1.0 m^3/s (2119 cfrn) average airflow per
drift at NVP of 0.5 to 1.0 inch WG.
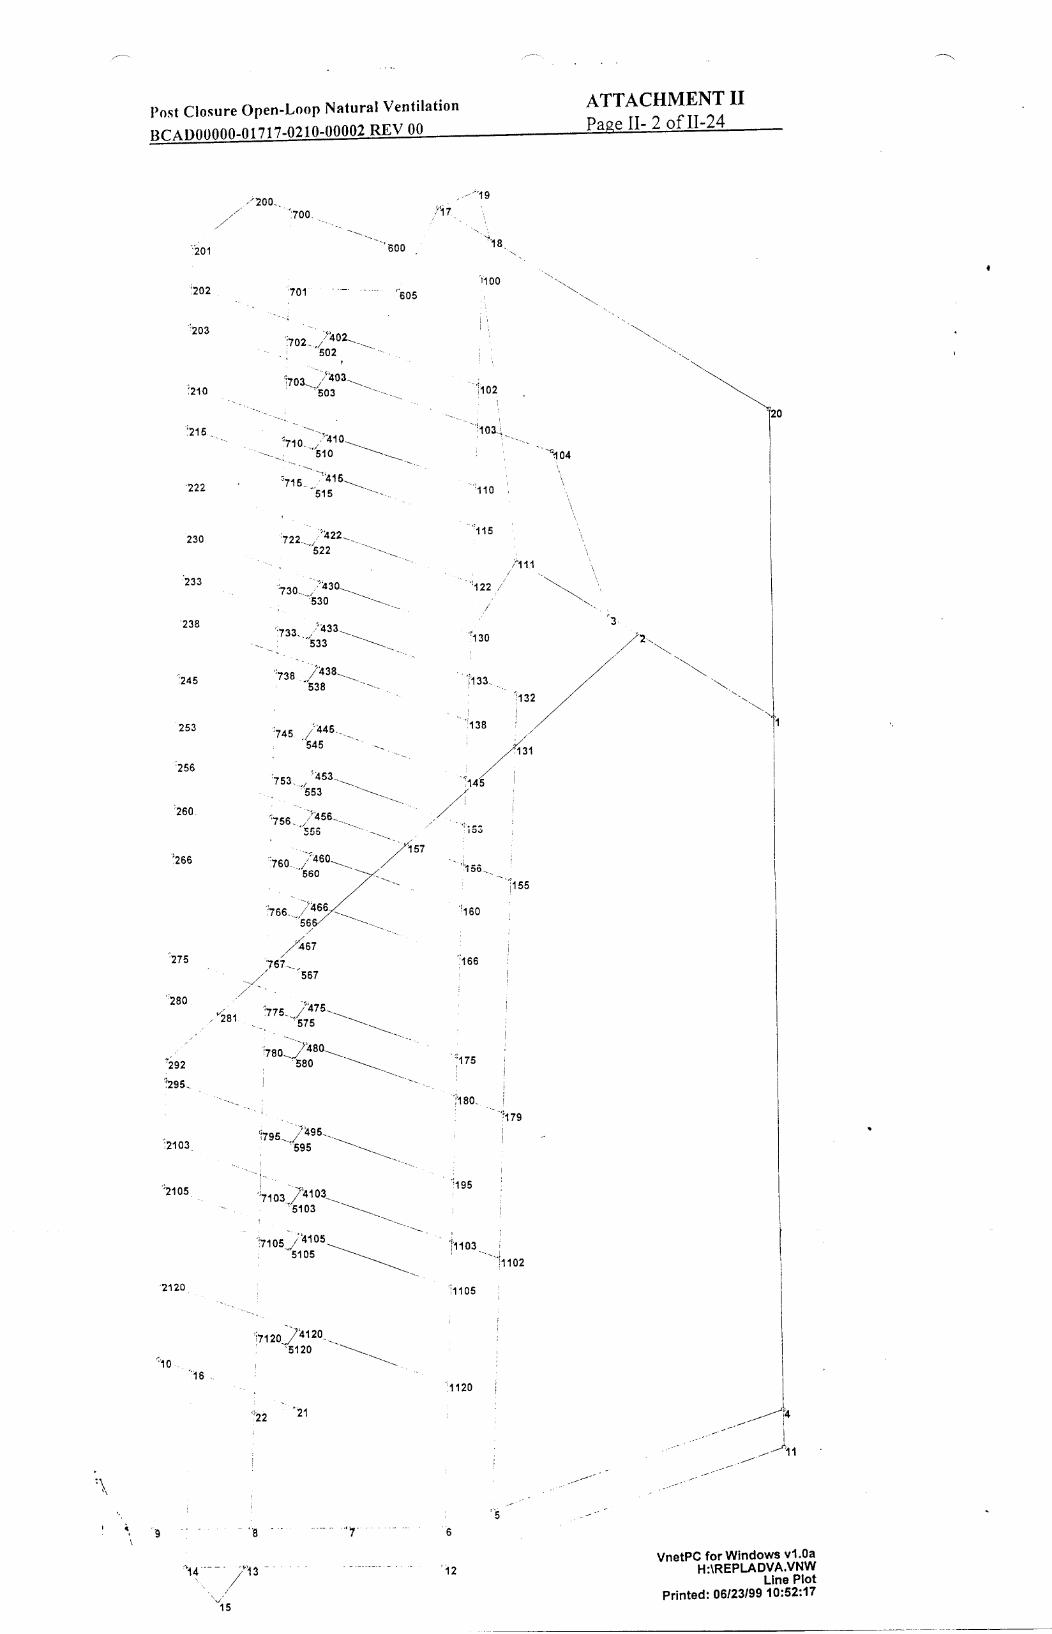
Post Closure Open-Loop Natural Ventilation ATTACHMENT II
BCADOOOOO-01717-0210 -0000 2 REV 00 Pa1e II- 2 of 11-24
',200.
'201
'202
203
'210
!216
222
230
:233
"238
'245
253
256
;260.
'266
275
'280
'292
g295
ý2103
:2105
2120
:10
"16
oj'22
,700
701
600
"605
702-,/ "502
ý703-./ 0 503
-710. •'4"I0 510
'715 515
722-_"ý422-522
:730* ."/,'430 7 530
!733. '433"`533
"738 ',/438_-
538
:745 '4454 "545
:753..,1 453553
:756_ 1/'456--S
556
760- ./460--157 560 '
" '766 466 ,
56
/467
,767-7 567
576
780. J,480 - ._
580
S^-s j496g '595
',7103_/-'4103 5103
'7105 "4105 5105
All 7
18
"100
'102
'10 3"ý
:110
115
"122
3130 '2
' 33'ý132
ý138
'131
l145
'56 '155
'160
.166
":175
'I18o
""179
'I 3 '!1103
`11105
11102
,7120/4120 "5120
'1120
21 4
'5
VnetPC for Windows vl.Oa H :\REPLADVA.VNW Line Plot
Printed: 06123/99 10:52:17
•~0
-"104
";111
i, '9
'1
15
6
12
I ii
!195
'21

tPnt (Chlo,,re Onen-Loop Natural Ventilation ATTACHMENT 11
BCADOOOOO-01717-0 2 10-00002 REV 00 Page II- 3 of11-24
Ne,
12 0)3
109 -,
11 •-i•w.) zŽ
131
(0
Ut)
(0d
C)
- 7 ;ý' U.)
77j
.. • ,,-
177-
134
0')b
7/lb '
77-i 05.j2:'o _.:
87
0O
17 'o874�
130 ,� 783 N
$
'17 • /@•5 _..
.z/ 745,
1 . / ',.
co 3 / -
U-1)
7r7 -. ŽSCO, 18
LI)1l"-
4
� C
F� �
73� -
i(D
�41 CO F (C
* NF (C
83o~
,r. 0)
N--,
74ý9
75�
151-
21 20
31
"Nr~tp' Obliteration of characters in this plot is not quality affecting and
N
LO
'4-)
(03
t0)
Lr) LI')
LI'
'96 (C
191 NC
25C-) N
NN'0
22
28VnetPC for Windows vl.Oa H:\REPLADVA.VNW
Branch Numbers Printed: 06123199 10:53:24
.
776-
j--- {,'7.

Post Closure Open-Loop Natural Ventilation
BCADOOOOO-01717-0210-00002 REV 00
ATTACHMENT II Page II- 4 of 11-24
VnetPC for Windows v1 .0a C:\VNETWIN\REPLADVA.VNW
Fan No.: 1 From: 17
To: 18 Pressure: 6.000 in.w.g. Description: First Empl Shaft Fan
Fan Name: Joy 144-79-590 Fan Setting: 4 tZ 47) Comments: Fan curve #40 C 0" Points: 10 Quanti ressure
200.001 7.0001 Stalling 25 8-0001 Stalling :350.00 9.000 Stalling 470.00 9.500 Max normal operation 520.00 9.000 .Normal operation 620.00 I 7.0001 Normal operation 700.00 5.0001 Normal operation
740.00 ! 4.0001 Normal operation
0 . ormal operation 600.00 I 1.000 Normal operation
Fan No.: 2 From: 14 To: 13 Pressure: 6.000 in.w.g. Description: Former Dev Shaft Fan
Fan Name: Joy 144-79-590 Fan Setting: 4 Comments: Fan curve #40 ,3 OY C- %2-72 Points: 10
-Quantity I Pressure _ _

(
RIF
- .�.--
( (
• • iJ.:i• .•o .... . .. ....::: ... .......
' * :1:5: • - I. .... . ....
"E .... r z --
.... .. . ... ..... .
...•$• .... .... ... ....... .........
.. 77R EP WIR .- , . . .. .
0 0 0 0 0
-4
-4 0
0 0 0 0 0
0 0
C,,
0
0 0
z -I
0=

,
Calculation of Airway Resistances (VA)
Eplad1-05-10-va.xs Folder- Repava: VNETPC INPUT, Design Feature Deve t Case VA. Dd by RS Jurani & A Linden
BRANCH RESISTANCE REGULATOR RESISTANCE AIRWAY FRICTION X-SECT PERIMETER ACTUAL ACTUAL EOUIV.
in PU RESISTANCE in PU RESISTANCE FACTOR K AREA P LENGTH LENGTH LENGTH
VNETPC Input from R R= (x`10.10) Ib- A (Ft) meter (m) L' L=L'+10%
RPUa*RPUb RPUa R= J KLP/(5 2A^3) min^2/tt^4 (Ft^2) (33) (Ft) (Ft) in3PU
0.0051 0.0001C
0.0509
L ______ 4 4- ] I 1 4 4- J V7, '20 l00') (1 5575 71R5 North Ramo
30) 38933 . . 14, 5 Nrnxm
NOTES FOR BRANCH DESCRIPTION
.0004 0.0039 1 30 1 389.331 7 3 1.546.rth -R, . ' _i 389.331 0.0039 0.0394 1 30.6 1543C 5062
0.0039
0,0003 0.0026 1 .70 1 389.331 72.361__ .1 1 1 157 East Main Drift
2 3 4 5 6
8 9
10 11
12
14 15 16 17 18 19 20 21 22 23 24 25 26 27 -28 29 30 31
32 33 34 35 36 37 38 39 40
0.0009
1 0.0014 1 0.0138 7 1 389 33 723 2319 J urns L ~ 'JUR L ~ " 4 ~ *... 2::+ 761 A.......... ~ A
2 0
0
0.0001 0.0015 0.0000
0.0009. . 1 - . . 1 229 .0018 L 0.0178
25 1 44.531 5957 41 5 1. 5 142CoaeetV nrti A 0.014 1 1U
0.0000
0000l__ 01 00 04 04 0]'''000 0 1 .222 2 , : u -e~g LO0-,00 0 0000
00 1 00001 0.0000 0 0 01 g o-n e0.0000
Emplacement ShaftI -2nd fle
FROM I
2-3
Iill 100 102 103 _110
1-22 ill 701
17 18
'18
4 5
144 1
13
12
100
160
214
-2 3
111 100 102 103 110 -115 122 -130 130 605
17 18 19 17 20
5 6
-7
8 9
10 16 21 16 14 13 15
14 12 -11 -4
600 700 200 -201 202
0.0051 0,0001 0,0004 0.0039 0,0039 0.0003 0,0013 0.0009 0.0012 0.0014 00018 0.0001 0.0015 0.0020
1000.0000 1000.0000
00046 0.0072 0.000 0.0040 0.0000 0.0010 0.0010
500000
0 F0020
0.000 0.004 0.0020
1000.0000 1000.0000
0.0040 0.0000
-00000 00000 00000 0.0020 0.0001
0.0014 0.0014 0.0015
0.0015 38.3 72.3 4. 7917 ~rhMi0.0014 0.0015
00144 70 1 3 . ý . ..70 7 7')35 IN eu ivesrma1
72.36 F ' 389.331._ 1 1 1
(
(35)
. . 1 0.0013 0.0130 1 70 1 389.331 7236 2174 713 785 East Mainr
0= 0=
0•
0
-I
0
0.0020 1000.0000 1000.0000
0.0040
0
0
-t
W
,0
f=b
0.0072 0.0716 60 389.331 72.36 1402.6 4602 5062 South Ramp to PC
0,0003 0.0025 60 389.33 72.36 49.2 161 178 South Ramp
3 0.0043 0.0427 60 389.33 72.36 835.8 2742 3016 South Ramp
0.0001 0.0012 60 389,33 72.36 23.1 76 83 South Ramp
0.0012 0.0116 60 389.33 72.36 227.2 745 820 South Ramp
0.0010 0.0102 60 389.33 72.36 200.0 656 722 ]South Ramp Ext Curve
1 50.0000- 0.0001 0.0011 25 446.53 80.13 69.7 229 252 West Main to Development Shaft Drift
0.0000 0.0000 25 446.53 80.13 0.0 0 0 Exhaust Main Connector (Dummy)
0.0004 0.0039 25 446.53 80.13 249.3 818 900 Exhaust Main Connecting Drift to Dev Shaft
0.0046 0.0459 95 312.48 62.87 338.2 1110 1221 Deveopment VA Shaft
0.0020 0.0000 0.0000 0 0 0 0.0 0 0 Primary Fan- Development Shaft
00.00 0.0000 0.0000 0 0 0 0.0 0 0 Leakage 1sat leg 1000.0000 00000 0 0 - - -- 0- - 00 0 0 Leakage - leg
0.0040 0.0000 0.0000 0 0 0 0.0 0 0 Surface Outlet - Evase
0 0.000 0.0000 0 0 0 0.0 0 0 Surface Dummy Connector
0 0.0000 0 0 - 0.0 0 0 Surface Dummy Connector
S0.0000 00000 0 0 0 0.0 0 0 Surface Dummy Connector
S000 0 0 0 0.0 0 Surface Dummy Connector
0.0020 0.0001
0.00 14
[ ___ ___ 4 4-1210 7 3833 7.6 2.1 82 91NrhMi
0
t'J
_______________ I _______________ 1 ____________. ____________ ± _____________ i ___________ _________ __________ ______________________________________________________
0.0144 7075 852 West Main70 389.3: 72.36 236.10.0141
246.5 809 890 1West main0,0147 70 389.3: 72.36
, , , . , 157 North Ramp 0.0011 1 30 1 .33
i . 2 0.0 36 6546
' E t M i Dift 0 0 .0.0012 1 0.0121 1 70 1 389,331 72.361 . ii 666 32 East Main Drift
' 1 , 0 0 0
(
4QQ9 RR•R 71RQ North Rmmo
157 North KamD79 gR d•, R 1434•4 A ROT •A• Nnrvn l-(mmn
•I If'U) hhh•'I I'•D[I[I rt•llrlg EXI
as i Dift E t.I') "4F• •h• h
A'• J• 'f•! I...Ae.f MRIn I JrTr[
7q q• 917A 1"1•1 l IS:'l p'•]ST M•II[I UIIIL
aL•,) •l•b.• pilIIIll IPlll&'-/t•
IT4"J• p-a'l•? Mgln I fFR•+.
/hl •31 r'H•I r•l[] UIIll• o•
•L 2N2, Nth Rmp Curve/•7 ?lh
Q• 4q K7 'IJ4• p Shaft1492 Emplacement VA Shaft•4"9 AI R9 R7 413 R 1357
OX0 U 0 Primary Fan- Emplacement S aftA 0#t^
LeaKage Loop-zng I•gp-2nd legO.0 O U0 0 00 Surface Disc arge - vase Outlet Cone)0 0 0.0 00.0000 0
1104 rLth2Min0.0200 70 389.3; 72.36 336.572.36 25.1 82 911 North Main70 389.3:
389.3: 72.36 241.7 793 872 North Main

Calculation of Airway Resistances (VA)
FILE ft ReIadOl-05-10-va.xis; Folder - Repladva: VNETPC INPUT, Design Feature Deveio m Case VA. a by RSJurani &A Linden
Line BRANCH RESISTANCE REGULATOR RESISTANCE AFRWAY FRICTION X-SECT PERIMETER ACTUAL ACTUAL EQUIV.
in PU RESISTANCE in PU RESISTANCE FACTOR AREA P LENGTH LENGTH LENGTH
VNETPC Input in PU from R R= ixl0A_10) Ib- A (Ft) meter (m) L' L=L'+10%
RPU ÷aRPUb Field Installed RPUa = P/10 KLP/(5 2A^3) min 2 W4 (Ft^2) (3.3i (F (F3)
RPUb In min2ft6 (33)(3.23) (3.5)
FROM TO
S 2 - 0.0003 0.0026 70 389,33 72.36 43.5 143 157
42 203 210 0.0013 0.0013 0.0130 70 389.33 72.36 217.4 713 7
0.0009 0.0009 0.0086 70 389.33 72.36 144.9 475 523 - - 0.0012 -0.0121•
44 215 222 00012 001-002 70 389.33 72.36 20. 6 86 32
.14 00014 00137 7.36 230.1 755 46 2302 23 0,0004 0- 0 0 3 72.36 70.1 230 253
4.9 0.000 0002 70 38933 7-.36-.7- 00 1 - 38931 72.3- 197.1 647 711
48 49 50 51 52 53 54 55 56 57 58 59 60 61 62 63 64 65 66 67 68 69 70 71 72 73 74 75 76 77 78 79 80
238 245 253 256 260
10 220
2105 2103
295 292 280 275 130 133 138 1F45 153 1 56 160
6 1120 1105 1103
195 180 175
2 131
S -1102
179 131
245 253 256 260 266
21l20 2105 2103 295 292 280 275 266 133 138 145 153 156 16 166
1120 1105 1103 195 180
166 131
155
132
_ 0.0012 0.0014 500.0004
0.0008 0.0010 0.0060 0.0028 0.0005 0.0014 0F0005 0.0022 0.0008 0.0015 0.0004 0.0009 0 0012 0.0014
500.0004 0.0008
0.06
00026
0.0004 0.0013 0 0027 00008
00016 0.0313
500 0119 0 0395 0 0180 0.0188 0.0061
500.0000
500.0000
500,0000
0. 0014 0.0004 0.0008 0.0010 0.0060 0.0028 0.0005 0.0014 0.0005 0.0022 0.0008 0.0015 0.0004 0.0009 0.0012 0.0014 0.0004 0.0008 0.0010 0.0065 0.0026 0.0004 0.0013 0.0027 0.0008 0.0016 0.0313 0.0119 00395 0.0180
0 .0188 0 .0061
0.0 136
0.0043 0.0077 0,0102 0.0595 0.0280 0.0047 0.0140 0.0045 0.0224 0.0077 0.0153 0. 004 3 0,0095 0.0121 0.0138 0.0043 0.0078 0.0104 0.0651 0.0259 0.0043
0.0130 0o0268 0.0078
0.0155 0,3130
0.1193 0.3946
0.1805 0,1883 0.0612
~70I
70 70 70 70 70 70 70 70 70
70
70
R707 7000
70 7
0
E70 707 700 70 70 70 70 70 7-0 70 70 70
389.33 389.33 389.33 389.33 389.33 389.33 389.33 389.33 389.33 389.33 389.33 389.33 389.33 389.33 389.33 389.33 389.33 389.33 389.33 389.3 389.33 389.33 389.33 389.33 389.33 177.6 211.30 211.30 211.30 211.30 211.30
72.36 72.36 72.36 72.36 72.36 72.36 72.36 72.36 72.36 72.36 72.36 72.36 72.36 72.36 72.36 72.36 72.36 72.36 72 36 72.36 72.36 72.36 72.36
72.36 72.36 48.44 52.57 52.57 52.57 52.57 52.57
228.9
71.5 128.7 171.7 999.2 470.3 78.4
235.2
75.9 376.2 128.7 257.5 72.5
159.4 202.9 231.9 72.5
130,4 173.9
1093.1 434.8 72.5
449.3 130.4 260.9 745.0 440.8
666.7
695.7
751
422
3278 1543 257 772 249
1234 422 845 238 523 •666 761 238 428 5 71
I 1427 238 713
428 856
2444 1446 4782 2187 2282 7 41
826
620 3606 1697
283
274 1358 464 929 262 575 732 837 262 471 628
3945 1569
262 785
1621 I 471
942 2689 1591 5260 240_ 2511
8`15
"NOTES FOR BRANCH DESCRIPTION
West main
West main West main West main West main West main West main West main West main West main West main West main
West main West main Ws main
Ws main West main West main West main East Main
East Main Es main
East Main Eas M._ain Eas Main Eas M.__ain
Eas Main
( ( (
0o
0
0
0=
0=
zi,,
HH
H.,

(
Calculation of Airway Resistances (VA)
FI L E 0 8 N C R E I T A C R E U A O E I T N E A I R- " W A Y F R I C T IO N X -S E C T P E R IM E T E R A C T UA L T C TA L
Lin'--e in PU RESISTANCE in PU RESISTANCE FACTOR K AREA P LENG TH LENGH
No. VNETPC Input in PU from R R= (X10^-10) Ib- A (Ft) meter (m) L
RPUa÷RPUb Field Installed RPUa = PJ1 0 KLP/(5.2A^3) min2/ft^4 (FtA2) (3.3) (Ft
RPUb In m in^2/ft^6 (3.3)
(3.5) --
8`1' 13 133 ).0009 0.0009 0.0086_ 7 1 257 _ 16 _
8-- 2' 13 157 500.0201 500,0000 0.0201 0.2014 70 177.60-'-' -'- 48.44 4 79.4. 157
- 0.009 0.0 86 70o 2 11-'-30- - -52.57 31.6 10
83---- ; 15 0.0009 - 0'097 113 25 31.6 -0
8"4- 17 180 " 0.0009 0.0009 0.0086 70 1 _
8" 5 - 00 0 0.0009 060086 70 2"-1.---- 52.5 31.6...04
85 -110 1 03 00.000900 0.08 60 41_72.7_.. 67_
9• "- - " .00 0.0009 0.0092 6 "---0--' 81 _
86- 766" 760 0.0008 0.07 0.02 6 4 9 723 12.6 4 25
S722.0 0 2 36
X 87 760 7 E 0.0006 0 .00076.06
60 4--0-1-- . 72 ,6 - 4. .
9•"- - -- 0.02 00000 0.0034 60 4014 72.36 43- _
88-- 75 753 5000.0003 5000.0000 0.0006 0.06 604---•' 7234786._:'
1" ' -- 0.001 1 0.0011 0.0105 60 4014 72.36 23.3 756.._
10"•'• - -- 0.006 0.0006 0.0060 0 1 4 9-• -• • 72.36 19._( _
000 0 414 72.36 19.$ 50.
89073 74 0.0021 0.002 0.215604 910- 73-- --73 0.0010- 0.00107 0.0105 60 36 • - Z23.•.• 1
109-- 73 730 0.0003 0.0003 0.-00335 40 1.49•''-- ' 72.3 704 231
93--- 730- 722 0.0011 0.0011 0.02107 60 401.49 723 230.8 757
10• "-7 - 0.00409 0.00409 0.0040 60 4014 72.3 20. 666
9 710---- - 7-00010 10000007 0.0007 0.0100 60 401.4-9'-' C- Z4_.•' _
- -0.0152 0.0101 6 70 40 .4 72.36! _
9 71-- 0 703 0.0102•53 11-97' 70 702 - - 0.0002 0.0002 0.0020 60 41.4 72.3 43. 143
11---' - -0.10.00116 0.01753 60 40 .4 72.3 371.6-- 21
99• 70 701 0 0.0006 1 0 . 00 0.0006 0,0045 60 401 .4 72.3 138.3., __
11"-- 76 0.0002 Ow 0 oO1 0 414 23 356,
-11"---- 6 7- •007 0.0076 0 307o010 5 60 41 49 723 225 740
-112 77 - 8 00 0 0.0007 0.1867 70 2"--01.-'49- 72.36 01296 425
11---' 79 0020.210.0210 60 419 72 36 408.2 47
1-- 1- 0 - 3 " 0 01039 0.0010 0.39010 5 60 40.4 723 221 3 1"--- 7105 0.0003 0.0003 00025 60 2"0"-'.-4- 72.36 375.1
-1-0 0.0040 o.1603 70 40149--'- 72.3 865.8 _
- 12-" -- 22 0,00016 -
LENGTH
L=L )10% (Ft) (3.23)
114 1730_ 1114 114 114 823 468 2•60 831 715 558 254 833 732 623 785 157
1341 499 121 814 468
1625 812 271
1625 3125 776
1925 021
1925 • 1925
1925 1943 2080 2080 2172 2196 2299 2216
NOTES FOR BRANCH DESCRIPTION
DC•2 E-CRB
PC 3 'DC4 DC 5 Exhaust Main Exhaust Main Exhaust Main
Exhaust Main Exhaust Main
Exhaust Main Exhaust Main Exhaust Main Exhaust Main
Exhaust Main Exhaust Main Exhaust Main Exhaust Main Exhaust Main Rog (North Ramp Side)
Exhaust Main Exhaust Main
Exhaust Main Exhaust Main Exhaust Main
Exhaust Main Exhaust Main Exhaust Main Exhaust Main Rag (South Ramp Side)
Emplacement Drift West Side PC 1 West Side
Emplacement Drift West Side
Emplacement Drift West Side Cross Block 30 West Side
PC 2 West Side Eracen rif West Side
Emplacement Drift West Side (Emptyl
EEm.placement Drift West Side
PC 3 West Side CosBlock 60
(0
0j
I9
0= "01
zI -f
H,1 H
zll H
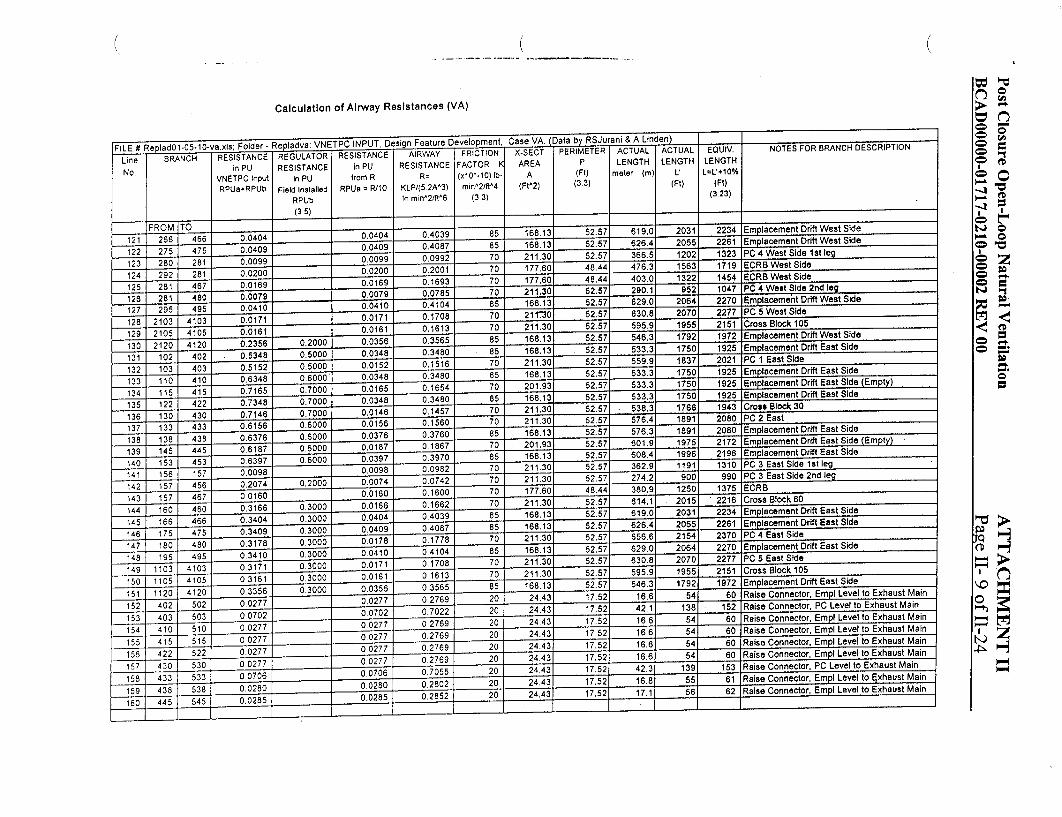
(
Calculation of Airway Resistances (VA)
FILE # Re.lad01-05-10-va xis; Folder- :VNETPC INPUT, Desi n Feature Development, Case VA. Drani &A inden
Line-S-C BRANCH E REGULATOR RESISTANCE AIRWAY FRICTION X-SECT PERIMETER ACTUAL ACTUAL No. in PU RESISTANCE in PU RESISTANCE FACTOR K AREA P LENGTH LENGTH
VNETPC input in PU from R R= (x10^-10) Ib- A (Ft) meter (m) L'
RPUa.RPUb Field Installed RPUa = R/1o KLP/(5 2A^3) min^2/ft^4 (Ft2) (3.3) (Ft)
RPUb In min^2/ft^6 (3.3)
(3.5)
FROM TO
121 266 466 0.0404 0.0404 0.4039 85 168.13 52.57 619.0 2031
120- 5 41 0.25 00 0.0409 0,4087 85 168.13 52.57 526.4 2055
13 0 0 34 .00 004 0.34099 85 216.130 5.7 533 15
123 103 403 0.52 00 0.0152 0.1516 70 211.3---0 52.57 565.5 1202
123 110 410 0.0200 0.0200 0.2001 70 177.68 48.44 576.3 1563 12-5- 28 46 0.0169 0.0169 0.1693 70 177.60-- 48.44 403.01 1322-----
123 215 415 0.0079 0.7000 0079 0.0785 70 211.30 52,57 290.13 951
127- 295 422 0 0748 0.0410 0.4104 85 168.13 52.57 3293. 2064 128 210 410 0.0171 - 0.0171 0.1708 70 211"n 3 52.57 608 27
123 10 4 30 0.0161 000141 0.1457 70 211.30 52.57 5395. 1957
137 213 -43 0.2356 0.2000 0.0156 0.1560 7 •0821130 52.57 576.4 1791
138 18 48 0.5348 0.5000 0.0348 0.3480 85 168.13 52.57 576.3. 189
139 145 45 0.5152 0.5000 0,0152 0,1516 70 211.30 52.57 159.9 1837
130 153 453 0.6348 0.6000 0.0348 0.3480 85 168.13 52.57 633.3 1750
1341 16 415 007165 0.7000 0.0165 0.1654 70 201.93 52.57 533.3 1750
132 1-25 4-56 0.7344 0.7000 0.0348 0.3480 80 16821.30 52.57 33.3 1750
134 160 460 0.7146 0.7000 0.0146 0.1457 70 211.30 52.57 638.31 176
1345 16 466 0.6156 0.6000 0.0156 0.1560 785 11.31 52.57 76.4 18921
136 178 475 0.6376 0.6000 0.0376 0.3760 85 168.13 52.57 676.34 1891
134 180 480 0,6187 0.6000 0.0187 0.1867 70 201.93 52.57 601.9 1975
148 195 495 0.6397 0.6000 0.0397 0.3970 85 168.13 52.57 608.4 1996 14-5- 1-57- 0.0098 0.0098 0.0982 7"-'---- 213-- 25 6.1 1191
149 110 410 0.2074 0.2000 0.0074 0.0742 70 211.30 - 52.57 630.84 200 14"-' 157 4 - .0160 0.0160 0.1600 70•• -- _177.6"-"- 48.44 380.9} 1250
1454 1105 410 0.3166 0.3000 0.0166 0.1662 70 211.30 52.57 5145.9 15
1451- 1120 41 0.335 0.3000 0.0435 0.4039 85 168.13 52.57 619.0 2031
14-6-2 4 5 0.3409 0.3000 0.0409 0.4087 82 168.13 52.57 126.4 2054
1- 1778 70 211.330 52.572 56.61 1
148 410 -5 0.3410 0.3000 00277 0.41049 0 216813 52,57 629.0 2064 149-"• 0-3 1-3- 0,3171 0.3000 0.0171 0,1708 70 211.30 52.57 630.81 2070
155 415 105 0 7 002 0.1613 720 211.30 52.57 195.9 1955
15s, -2 -- 0.3356 0.3000 0.0356 0.3565 85 168.13 52.57 146.3 1792
157 40 530 0.0277 0.0277 0.2769 20 24.43 17.52 16.6 54
158 433 503 00702 0.0706 07022 20 24.43 17.52 42.1 138
159 4- - 3 - 0.0277 0.0277 02769 20 24.43 17.52 16.6 54
15 -4-5 5-5 0 0277 0.0277 0.2769 20 24.43 17.52 16.61 54 15--6- -- 2 52 0.0277 0.0277 0.2-769 20-- + -6 + _24.43- - 17.52 16.61 54
15-7- 430 53 0.0277 0.0277 0.2769 20 4.3 152 16l__ ___4
- - - 0.76 0.7055 2 2.--' 175 42.31 139 15--- 433 53 0.0706 0.70 244 175
1-59-4-8-538 - 0.0280 0.0280 0.2802 20 24.43 17.52 16.81 55
16-- -- 0.065 - 0.025 0.852 2---- 0-' 24.4--3" 17.52 17.1 56
- i
EQUIV. LENGTH
L=L'+10% (FI)
(3.23)
NOTES FOR BRANCH DESCRIPTION
2234 Emplacement Drift West Side
I 2261_•__• Emplacement Drift West Side 1323 PC 4 West Side 1st leg
14104 IEPtRR West Side
1047 PC 4 West Side 2nd leg 2270 Emplacement Drift West Side
2277 PC 5 West Side
2151 Cross Block 105 1972 Emplacement Drift West Side
t :iz� 1925 lbmotacement urirt C55t �Ioe
1925 lEmplacement Drift East Side(Ep)1925 Emplacement Drift East Side (Empty)
2080 PC 2 East
I 2214 IC!!opsB~ckm6 0rHCSL~
21796 :EnIacement Drift East Side (Empty)1 2196 E!m.placement Drift East Side 1310 {PC 3 East Side 1st leg
990 PC 3 East Side 2nd lea
91R 75 .r~ Block
22370 Em 4....... East Side
I 237-0 PC 4 East Side 2270 Emplacement Drift East Side
2277 PC 5 East Side 2151 Cross Block 105 1972 Emplacement Drift East Side
60 Raise Connector, Empl Level to Exhaust Main
152 60 60
Raise Connector, EP Level to Exhaust Main Raise Connector, Empl Level to Exhaust Main
Raise Connector, Empi Level to Exhaust Main
60 Raise Connector, Empl Level to Exhaust Main 601 Raise Connector, FP Level to Exhaust Main
153 61 62
Raise Connectr P evel to Exhaust Main Raise Connector, Empi Level to ýxhaust Main
Raise Connector, Empi Level to Exhaust Main
0=
0
0
0
0
=
0=
1925• Emplacement Drf East Side
208 1 Emproslacmn D30 s Sd
•lfl Cross Btock 60
"2261 Ermn'----a ent Drift East Side
1719 ECR13 West Side
as a
Iw
I
. /
t454 ECRB West •,ide
1925 Emplacement Orwres PaS ide
S.. ... ___.j__..
1925 Emplacement Urlrt t::ast ;::>toe
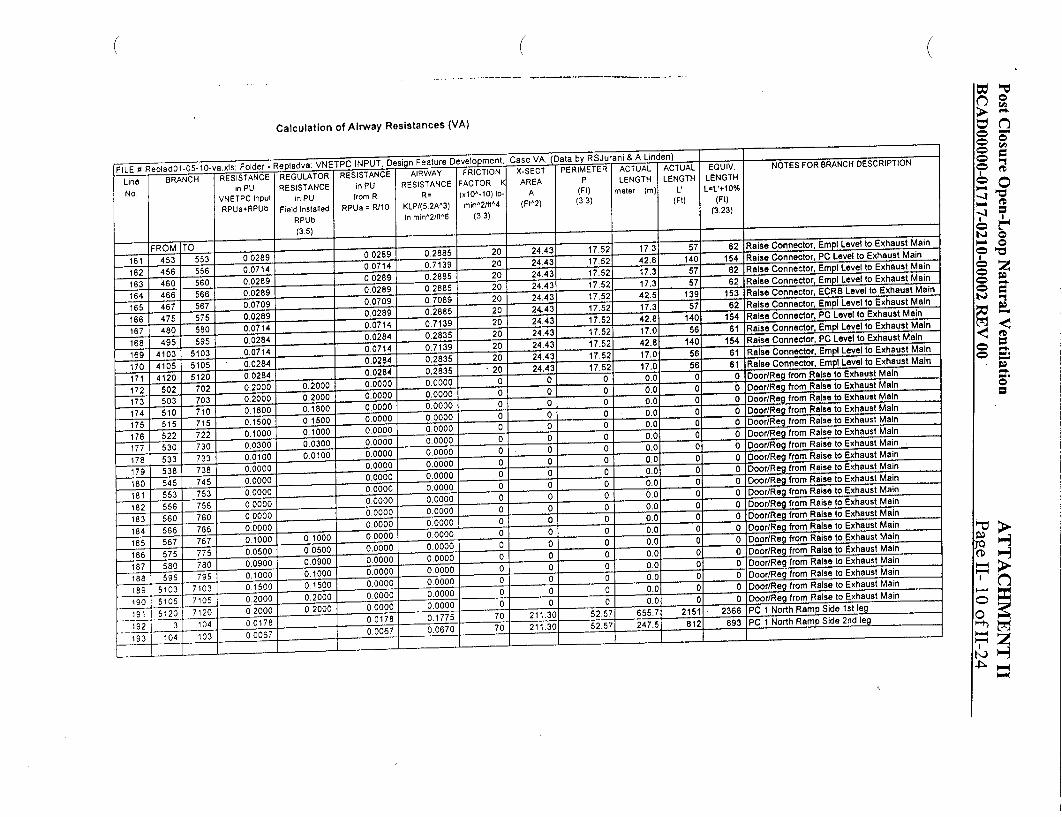
(
Calculation of Airway Resistances (VA)
FILE # epladOl-05-10-va.xis: Folder - ETPC INPUT, Design Feature Dev Case VAD R r A Linden)
Line " BRANCH RESISTANCE REGULATOR RESISTANCE AIRWAY FRICTION X-SECT PERIMETER ACTUAL ACTUA
in PU RESISTANCE in PU RESISTANCE FACTOR K AREA P LENGTH LENGTH
No. VNETPC Input in PU from R R= (x10^.10) Ib- A (Ft) meter (m) L'
RPUa+RPUb Field Installed RPUa = R/1O KLP/(5.2A^3) min^2/fI^4 (FtA2) (33) (Ft)
RPUb in min^2/ft^6 (3 3) (35)
FROM TO 2 57
161 4-53 553 00289 0.0289 0,2885 20 443 17.52 17.3
162 4 5 00714 0.0714 0.7139 20 24.43 17.52 42.8 140
168 456 56• 0.0289 0.0289 0.2885 20 24.43 17.52 17.3 57
164 4-66 566 00289 0.0289 0.2885 20 24.43 17.52 17.3
16---5 - 5 0.0709 0.0709 0.7089 20 24.43 17.52 42.5 139
16•'6 47 575 0.0289 0.0289 0.2885 20--24.43 17.52 17.__._3 5 167 480 580 0.0714 00714 0.7139 20 24.43 17.52 42.8 14
16-8- - 595 0.0284 0.0284 0.2835 20 24.43 17.52 17.0 56
169 41 5103 0.0714 00714 0.7139 20 24.43 17.52 42.8 140
170'4-- 10 -51 0.0284 0.0284 0.2835 20 24.43 17.52 17.0-56
179 3 7E-1038 0.0004 0.0004 0.0030 20024.43 17.02 42.8 140
169- -20 1752 1.0 5
171 5 780 00900 0.0 0 0000 0 0.283 0.
1878 59 705 0.2000 0.1000 0.0000 0.0000 0 0 0 0.0 0
179 5-03 703 01500 0.1500 00000 0.0000 0 0 0 0.0 0
170 510 7105 01000 0.1000 0.0000 0.0000 0 0 0 0.0 0
1791 1 72 02000 0.0300 0.0000 0.0000 0 0 0 0.0 0
7"V6 22 722 0.10100 0.0100 0.0000 0.0000 0 0 0 0WO
12 33 10 0.0100 0.0000 0.0000 0 10 0 0.7 2151
193 14 10 - 0007 0.0000 0.0000 70 0 0 0.5
179 58--- 73 0000 o-oo o-oo ooo "-0 0.
8---6---0.50 050 0.0000 0.0000 0 0 0 0.
18-- 54 7405 90 .00 0.0000 0000 - 0 0.
181--" 55 753 0.00 0000 00 0.0000 0.0000 0 0 0 0.0( o
8---9 - -0.5 0 01 0 0,0000 0,0000 0 0 0 0..___0
- -- 0 .0 0 0 0 .0(
19- 7020 0.1000 0ooooo oooo _-9 _ 0.2000 0.2000 0,0000 0W0000 0 0 0 0.0
192~~~~ ~ ~ 0_ 0 018007 17 •-'- 2 5.0 20
-193 -12 10 020000.200 0.006 0.70' - 70 0 525721.51_•
LENGTH L=L'+10%
(Ft) (3.23)
62 154 62 62
153 62
154
154 61 61
0 0
__ _0 _ _ 0 _ _ _ 0
0 0
o0 0 0 0 o 0__ .
__ 0_ _
S2366
NOT E S FOR B L NCH DESCRIPTION
Raise Connector. EmpC Level to Exhaust Main
Raise Connector, PC Level to Exhaust Main
Raise Connector, Empi Level to Exhaust Main
Raise Connector, EmCR Level to Exhaust Main
Raise Connector, ECRB Level to Exhaust Main
Raise Connector, EmPl Level to Exhaust Main
Raise Connector, PC Level to Exhaust Main
Raise Connector, EmP Level to Exhaust Main Raise Connector, PC Level to Exhaust Main
Raise Connector, Empl Level to Exhaust Main
Raise Connector, Empl Level to Exhaust Main
Door/Rag from Raise to Exhaust Main
Door/Reg from Raise to Exhaust Main
Door/Reg from Raise to Exhaust Main
Door/Re from Raise to Exhaust Main
Door/Re from Raise to Exhaust Main
Door/Re from Raise to Exhaust Main
Door/Re from Raise to Exhaust Main
D from Raise to Exhaust Main
Door/ e from Raise to Exhaust Main
Door/Re from Raise to Exhaust Main
Door/Re from Raise to Exhaust Main
Door/Re from Raise to Exhaust Main
Door/Re from Raise to Exhaust Main
Door/Re from Raise to Exhaust Main
Door/Re from Raise to Exhaust Main
Door/Rag from Raise to Exhaust Main
Door/Reg from Raise to Exhaust Main
Door/Re from Raise to Exhaust Main
Door/Re from Raise to Exhaust Main
DPC 1 rom Raise m Exhaust main
PC 1 North Ramp Side nst leg PC I North Ramp ie2n e
0 0 0
-1 0
0 0 0 0 0
0 0
0
�1
0
0
z
0
"I)
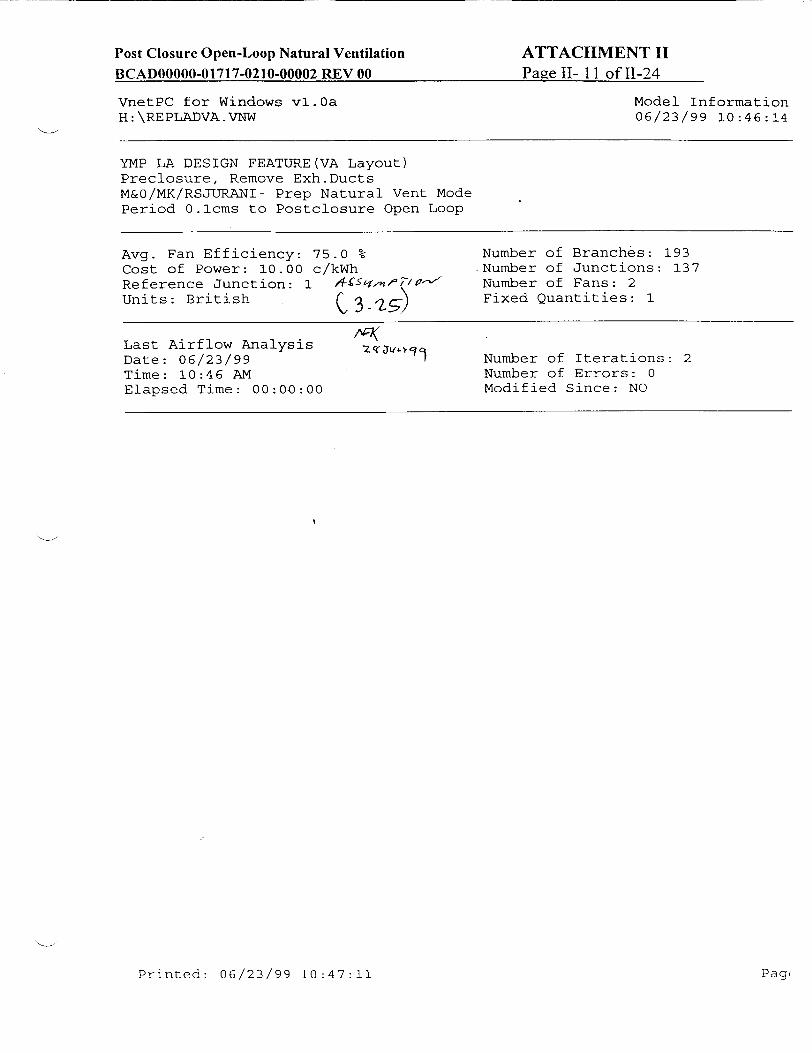
Post Closure Open-Loop Natural Ventilation BCADOOOOO-01717-0210-00002 REV 00
ATTACHMENT II Page II- 11 of 11-24
VnetPC for Windows v1.0a H:\REPLADVA.VNW
Model Information 06/23/99 10:46:14
YMP LA DESIGN FEATURE(VA Layout) Preclosure, Remove Exh.Ducts M&0/MK/RSJURANI- Prep Natural Vent Mode Period 0.1cms to Postclosure Open Loop
Avg. Fan Efficiency: 75.0 % Number of Branches: 193 Cost of Power: 10.00 c/kWh Number of Junctions: 137 Reference Junction: 1 Number of Fans: 2 Units: British Q3-•) Fixed Quantities: 1
Last Airflow Analysis Date: 06/23/99 Number of Iterations: 2 Time: 10:46 AM Number of Errors: 0 Elapsed Time: 00:00:00 Modified Since: NO
Printed: 06/23/99 10:47:11 Paq(

Post Closure Open-Loop Natural Ventilation
BCADOOOOO-01717-0210-00002 REV 00
VnetPC for Windows vl.Oa
H:\REPLADVA.VNW
ATTACHMENT II Page II- 12 of 11-24
Branch Input
06/23/99 10:46:14
IBranch From To F Type - Branch
No. Q Resistance (P.U.)
1 1 2 R 0.00510
2 2 3 R 0.00010
3 3 il1 R 0.00040
4 ill 100 R 0.00390
5 100 102 R 0.00390
6 102 103 R 0.00030
7 103 110 R 0.00130
8 110 115 R 0.00090
9 115 122 R 0.00120
10 122 130 R 0.00000
11 i11 130 R 0.00180
12 701 605 R 0.00010
13 605 17 R 0.00150
14 17 18 F R 0.0020C
15 18 19 RP 1000.0000C
16 19 17 R 1000.OOOOC
17 18 20 R 0.0040C
18 4 5 R 0.0072(
19 5 6 R 0.0003(
20 6 7 R 0.0043(
21 7 8 R 0.0001(
22 8 9 R 0.00121
23 9 10 R 0.00101
24 10 16 R 50.0001'
25 22 21 R 0.0000
26 21 16 R 0.0004
27 16 14 R 0.0046
28 14 13 F R 0.0020
29 13 15 R 1000.0000
30 15 14 R 1000.0000
31 13 12 R 0.0040
32 12 11 R 0.000C
33 11 4 R 0.000C
34 4 1 R 0.000(
35 20 1 Q R 0 0.00C0
36 100 600 R 0.002(
37 600 700 R 0.000ý 38 700 200 R 0.001'
39 200 201 R 0.001'
40 201 202 R 0.001,
41 202 203 R 0.000
42 203 210 R 0.001
43 210 215 R 0.000
44 215 222 R 0.001
45 222 230 R 0.001
46 230 233 R 0.000
47 233 238 R 0.000
48 238 245 R 0.001
49 245 253 R 0.001
50 253 256 R 500.00(
51 256 260 R 0.00(
52 260 266 R 0.00o 53 10 2120 R 0.001
54 2120 2105 R O.oo; 55 2105 2103 R 0.00'
56 2103 295 R 0.00
57 295 ?9. R 0.00
Airflow i Pressurel Friction Resistance Drop I Factor per Length
(kcfm) '(m.in.wg)(xl-10) (R/100Oft)
Printed: 06/2 3/99 10:41:'

Post Closure Open-Loop Natural Ventilation BCADOOOOO-01717-0210-00002 REV 00
ATTACHMENT II Page II- 13 of 11-24
VnetPC for Windows vl.Oa H:\REPLADVA.VNW
Branch Input 06/23/99 10:46:14
!Branch! From To F Type No. Q j ii'
58 59 60 61 62 63 64 65 66 67 68 69 70 71 72 73 74 75 76 77 78 79 80 81 82 83 84 85 86 87 88 89 90 91 92 93 94 95 96 97 98 99
100 101 102 103 104 105 106 107 108 109 110 ill 112 113 114
292 280 275 130 133 138 145 153 156 160
6 1120 1105 1103
195 180 175
2 131
5 1102
179 131 132 131 155 179
1102 766 760 756 753 745 738 733 730 722 715 710 703 702 700 766 767 775 780 795
7103 7105 7120 "8
202 203 210 215 230 "230
280 275 266 133 138 145 153 156 160 166
1120 1105 1103
195 180 175 166 131 155
1102 179 155 132 133 157 156 180
1103 760 756 753 745 738 733 730 722 715 710 703 702 701 701 767 775 780 795
7103 7105 7120
22 22
402 403 410 415 42' 430
R R R R R R R R R R R R R R .R R R R R R R R R R R R R R R R R R R R R R R R R R R R R R R R R R R R R R R R R R R
Branch Resistance
(P.U.) 0.00220 0.00080 0.00150 0.00040 0.00090 0.00120 0.00140
500.00040 0.00080 0.00100 0.00650 0.00260 0.00040 0.00130 0.00270 0.00080 0.00160 0.03130
500.01190 0.03950 0.01800 0.01880 0.00610 0.00090
500.02010 0.00090 0.00090 0.00090 0.00080 0.00060
500.00030 0.00110 0.00090 0.00070
0.00030 0.00110 0.00090 0.00070 0.00100 0.00020 0.00170
1000.00060 0.00020 0.00110 0.00060 0.00210 0.00100 0.00030 0.00210 0.00400
1000.00100 0.03480 0.01520 0.03480 0.01650 0.03480 0.01460
Airflow 'Pressure Friction! Resistance I Drop Factor per Length
(kcfm) !(m.in.wg) (xlO^-10)i (R/1000ft)
i> Inted: 0Di/2 / o ]0: 47: 11

Post Closure Open-Loop Natural Ventilation BCAD00000-01717-0210-00002 REV 00
ATTACHMENT II Page II- 14 of 11-24
VnetPC for Windows vl.0a H:\REPLADVA.VNW
Branch Inpuz 06/23/99 10:46:1-
:Branch! From No. I
115 116 117 118 119 120 121 122 123 124 125 126 127 128 129 130 131 132 133 134 135 136 137 138 139 140 141 142 143 144 145 146 147 148 149 150 151 152 153 154 155 156 157 158 159 160 161 162 163 164 165 166 167 168 169
233 238 245 253 256 260 266 275 280 292 281 281 295
2103 2105 2120
102 103 110 115 122 130 133 138 145 153 156 157 157 160 166 175 180 195
1103 1105 1120
402 403 410 415 422 430 433 438 445 453 456 ý4 60 466 467 475 480 495
4103 4 10, 4 120
To F iQ qi
433 438 445 453 456 460 466 475 281 281 467 480 495
4103 4105 4120
402 403 410 415 422 430 433 438 445 453 157 456 467 460 466 475 480 495
4103 4105 4120
502 503 510 515 522 530 533 538 545 553 556 560 566 567 575 580 595
5103 5105 .120
Type
R R R R R R R R R R R R R
R R R R R R R R R R R R R R R R R R R R R R R R R R R R R R R R R R R R R R R R R R
R
Airflow Pressure! Friction Resistance Drop I Factor per Length
(kcfm) (m.in.wg) (xl0^-10) (R/100Oft)
ý'! t ý(" ,-d 17 ,' - ,0 :4_ 1 1
Branch Resistance
(P.O.)
0.01560 0.03760 0.01870 0.03970 0.01720 0.01660 0.04040 0.04090 0.00990 0.02000 0.01690 0.00790 0.04100 0.01710 0.01610 0.23560 0.53480 0.51520 0.63480 0.71650 0.73480 0.71460 0.61560 0.63760 0.61870 0.63970 0.00980 0.20740 0.01600 0.31660 0.34040 0.34090 0.31780 0.34100 0.31710 0.31610 0.33560 0.02770 0.07020 0.02770 0.02770 0.02770 0.02770 0.07060 0.02800 0.02850 0.02890 0.07140 0.02890 0.02890 0.07090 0.02890 0.07140 0.02840 0.07140 0.02840 0.02840

Post Closure Open-Loop Natural Ventilation BCADOOOOO-01717-0210-00002 REV 00
ATTACHMENT I1 Page II- 15 of II-24
VnetPC for Windows vl.Oa H:\REPLADVA.VNW
Branch From To F Type No. Q
1172 173 174 175 176 177 178 179 180 181 182 183 184 185 186 187 188 189 190 191 192 193
502 503 510 515 522 530 533 538 545 553 556 560 566 567 575 580 595
5103 5105 5120
3 104
702 703 710 715 722 730 733 738 745 753 756 760 766 767 775 780 795
7103 7105 7120
104 103
R R R R R R R R R R R R R R R
R R R R R R R
Branch Resistance
(P.U.) 0.20000 0.20000 0.18000 0.15000 0.10000 0.03000 0.01000 0.00000 0.00000 0.00000 0.00000 0.00000 0.00000 0.10000 0.05000 0.09000 0.10000 0.15000 0.20000 0.20000 0.01780 0.00670
Branch input 06/23/99 10:46:14
Airflow Pressure Friction Resistance i fn Drop Factor per Length i (kcfm) (m.in.wg)(xl0^-10): (R/1000ft)
Pri n:ed: 0()/: /(•q 10: 47:1 lPaq,
Pavae 11- 15 of 11-24

Post Closure Open-Loop Natural Ventilation
BCADOOOOO-01717-0210-00002 REV 00ATTACHMENT II Page II- 16 of 11-24
VnetPC for Windows vl.Oa H:\REPLADVA.VNW
Branch Results 06/23/99 10:46:14
Branchi From To No.
1 2 3 4 5 6 7 8 9
10 11 12 13 14 15 16 17 18 19 20 21 22 23 24 25 26 27 28 29 30 31 32 33 34 35 36 37 38 39 40 41 42 43 44 45 46 47 48 49 50 51
53
54 55
56 ')7
1 2 3
ill 100 102 103 110 115 122 ill 701
605 17 18 19 18
4 5 6 7 8 9
10 22 21 16 14 13 15 13 12 11
4 20
100 600 700 200 201 202 203 210 215 222 230 233 238
"24 S 253 25 6 260
10 2120 2103
203C
2 3
ill 100 102 103 110 115 122 130 130 605
17 18 19 17 20
5 6 7 8 9
10 16 21 16 14 13 15 14 12 11
4 1 1
600 700 200 201 202 203 210 215 222 230 233 238 245 253 256 260 266
2120 2105 2103
2 q') 29n)
F Total I R Resistance B (P.U.)
0.00510 0.00010 0.00040 0.00390 0.00390 0.00030 0.00130 0.00090 0.00120 0.00000 0.00180 0.00010 0.00150
F 0.00200 1000.00000 1000.00000
0.00400 0.00720 0.00030 0.00430 0.00010 0.00120 0.00100
50.00010 0.00000 0.00040 0.00460
F 0.00200 1000.00000 1000.00000
0.00400 0.00000 0.00000 0.00000
R 0.00001 0.00200 0.00010 0.00140 0.00140 0.00150 0.00030 0.00130 0.00090 0.00120 0.00140 0.00040 0.00090 0.00120 0.00140
500.00040 0.00080 0.00100 0.00600 0.00280 0.00050 0.00140 0.00050
Airflow I
Pi .n� �'d: *)L/ -: 3 ?. 3;
(kcfm) 1 612.48 537.02 444.45 201.66 -78.39
-110.86 -51.11 -82.64
-112.93 -144 .10 242.79 608.63 608.63 610.43
1.80 1.80
608.63 542.39 434.76 216.87 216.87 215.20 215.20
7.46 538.78 538.78 546.24 548.22
1.98 1.98
546.24 546.24 546.24
3.85 608.63 280.05 280.05 278.62 278.62 278.62 244.14 216.92 191.58 167.47 145.37 114.89 98.22 63.86 29.63
0.28 -18.61 -56.74 207.74 177.69 151.99 128.03
97. 97
Pressure Drop
(m.in.wg) 1913.2
28.8 79.0
158.6 -24.0
-3.7 -3.4 -6.1
-15.3 0.0
106.1 37.0
555.6 745.2
3223.1 3223.1 1481.7 2118.2
56.7 202.2
4.7 55.6 46.3
2784 .7 0.0
116.1 1372.5
601.1 3917.2 3917.2 1193.5
0.0 0.0 0.0 5.0
156.9 7.8
108.7 108.7 116.4
17.9 61.2 33.0 33.7 29.6
5.3 8.3 4.9 1.2
38.4 -0. 3 -3.2
258. 88 11.
9 0
Air Power Loss (hp) 184.65
2.44 5.53 5.04 0.30 0.06 0.03 0.08 0.27 0.00 4.06 3.55
53.29 71.68 0.91 0.91
142.10 181.04
3.88 6.91 0.16 1.89 1.57 3.27 0.00 9.86
118.14 51.93
1.22 1.22
102.73 0.00 0. 00 0.00 0.48
6. 92 0.34 4 .77 4 .77 5.11 0.69 2.09 1.00 0.80 0. 68 0.10 0.10. 050.0; 0. 1q,
0
0 . 4
Operating Cost ($/yr)
160886 2123 4821 4391
258 56 24 69
237 0
3537 3092
46428 62456
797 797
123817 157741
3385 6021
140 1643 1368 2852
0 8588
102935 45245
1065 1065
89510 0 0 0
418 6033 300
4158 4158 4453 600
1823 868 775 591
84 117
43 0 i
0 25 -7384
"2157 ?42
403 6:)
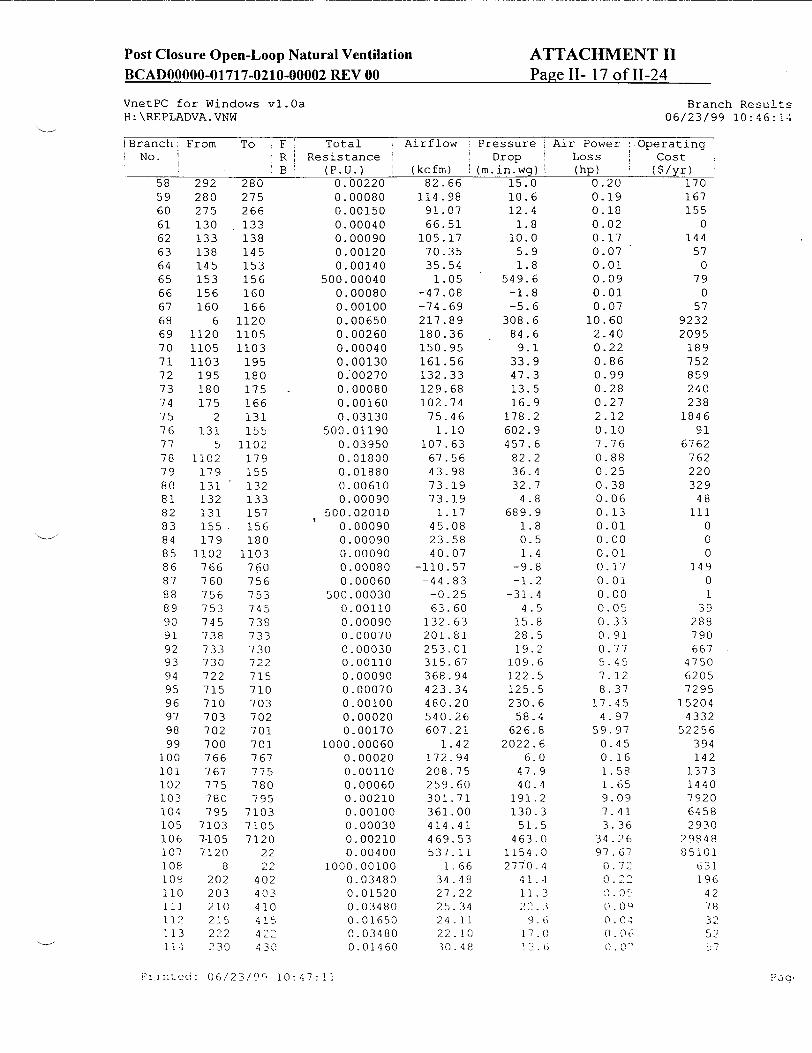
Post Closure Open-Loop Natural Ventilation BCAD00000-01717-0210-00002 REV 00
ATTACHMENT II Pawe II- 17 of 11-24
VnetPC for Windows vl.Oa H:\REPLADVA.VNW
Branch Results 06/23/99 10:46:14
iBranch; From To F No. iR
B58 59 60
61 62 63 64 65 66 67 68 69 70 71 72 73 74 75 76 77 78 79 80 81 82 83 84 85 86 87 88 89 90 91 92 93 94 95 96 97 98 99
100 101 102 103 104 105 106 107 108 1091, 110 111 112 113 1 4 ,
292 280 275 130 133 138 145 153 156 160
6 1120 1105 1103
195 180 175
2 131
5 1102
179 131 132 131 155 179
1102 766 760 756 753 745 738 733 730 722 715 710 703 702 700 766 767 775 780 795
7103 7-105 7120
8 202 203 210 215 222 230
Airflow
Pao.Pr nt d:06/2-3/0c, 10 :47:!I
280 275 266 133 138 145 153 156 160 166
1120 1105 1103
195 180 175 166 131 155
1102 179 155 132 133 157 156 180
1103 760 756 753 745
738 733 730 722 715 710 703 702 701 701 767 775 780 795
7103 7105 7120
22
402 403 410 415 422 4,30
Total Resistance
(P.U.) 0.00220 0.00080 0.00150 0.00040 0.00090 0.00120 0.00140
500.00040 0.00080 0.00100 0.00650 0.00260 0.00040 0.00130 0.00270 0.00080 0.00160 0.03130
500.01190 0.03950 0.01800 0.01880 0.00610 0.00090
500.02010 0.00090 0.00090 0.00090 0.00080 0.00060
500.00030 0.00110 0.00090 0.00070 0.00030 0.00110 0.00090 0.00070 0.00100 0.00020 0.00170
1000.00060 0.00020 0.00110 0.00060 0.00210 0.00100 0.00030 0.00210 0.00400
1000.00100 0.03480 0.01520 0.03480 0.01650 0.03480 0.01460
(kcfm) 82. 66
114. 98 91.07 66.51
105.17 70.35 35.54 1.05
-47.08 -74.69 217.89 180.36 150.95 161.56 132.33 129.68 102.74
75.46 1.10
107.63 67.56 43. 98 73.19 73.19
1.17 45.08 23.58 40.07
-110.57 -44.83
-0.25 63.60
132.63 201.81 253.01 315.67 368.94 423.34 480.20 540.26 607.21
1.42 172.94 208.75 259.60 301.71 361.00 414.41 469.53 537.11
1.66 34 .48 27.22 25.34 24.13 22. 10 30.48
Pressure Drop
(m.in.wg) 15.0 10.6 12.4
1.8 10.0
5.9 1.8
549.6 -1.8 -5.6
308.6 84.6
9.1 33.9 47.3 13.5 16.9
178.2 602.9 457.6
82.2 36.4 32.7
4.8 689.9
1.8 0.5 1.4
-9.8 -1.2
-31.4 4.5
15.8 28.5 19.2
109.6 122.5 125.5 230.6
58.4 626.8
2022.6 6.0
47.9 40.4
191.2 130.3
51.5 463.0
1154.0 2770.4
4 1.4,
11.3 2?.3
9.6 17 .0
Ku.
Air Power Loss (hp)
0.20 0.19 0.18 0.02 0.17 0.07 0.01 0.09 0.01 0.07
10.60 2.40 0.22 0.86 0.99 0.28 0.27 2.12 0.10 7.76 0.88 0.25 0.38 0.06 0.13 0.01 0.00 0.01 0.17 0.01 0.00 0.05 0.33 0.91 0.77 5.45 7.12 8.37
17.45 4.97
59. 97 0.45 0.16 1.58 1.65 9.09 7.41 3.36
34 .26 97. 67
0. 72
0.2
0.04 0.041
0.0
Operating Cost ($/yr)
170
167 155
0 144
57 0
79 0
57 9232 2095
189 752 859 240 238
1846 91
6762 762 220 329
48 ill
0 0 0
149 0 1
39 288 790 667
4750 6205 7295
15204 4332
52256 394 142
1373 1440 7920 6458 2930
29848 85101
631 196
42 78 32 52
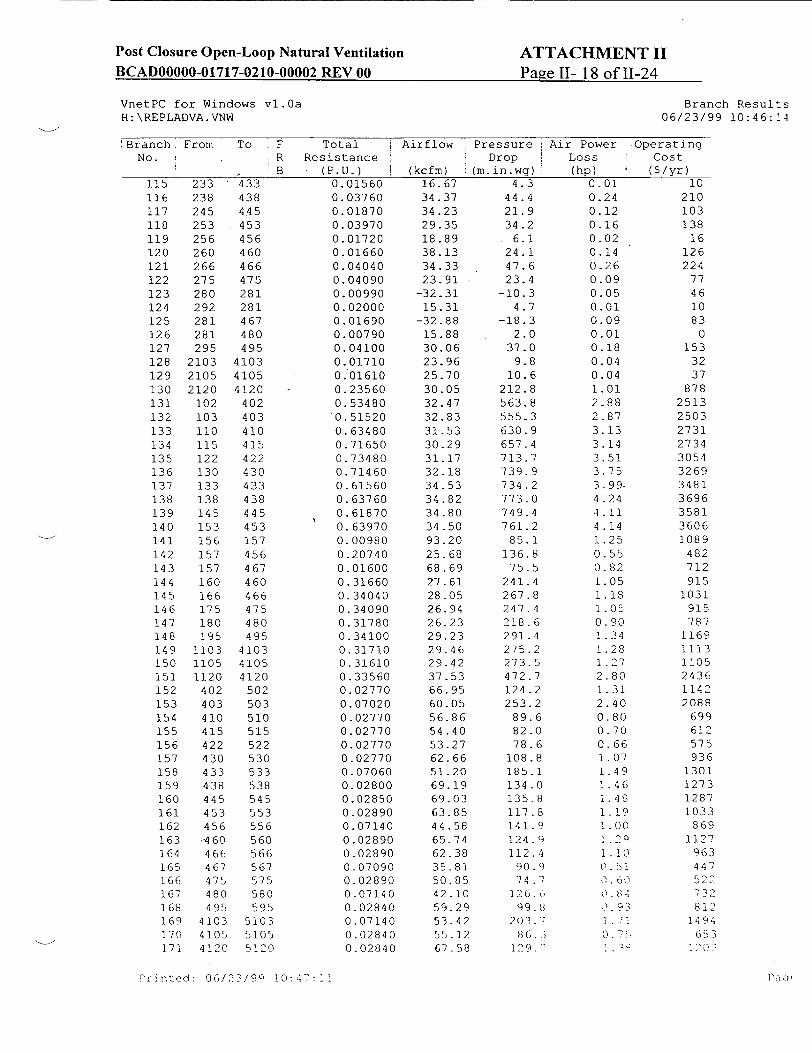
Post Closure Open-Loop Natural Ventilation BCADOOOOO-01717-0210-00002 REV 00
ATTACHMENT II Page II- 18 of 11-24
VnetPC for Windows vl.Oa H:\REPLADVA.VNW
Branch Results 06/23/99 10:46:14
'Branch, From To F Total i Airflow No. R Resistance
B (P.U.) (kcfm)115 116 117 118 119 120 121 122 123 124 125 126 127 128 129 130 131 132 133 134 135 136 137 138 139 140 141 142 143 144 145 146 147 148 149 150 151 152 153 154 155 156 157 158 159 160 161 162 163 164 165 166 167 168 169 170 171
233 238 245 253 256 260 266 275 280 292 281 281 295
2103 2105 2120
102 103 110 115 122 130 133 138 145 153 156 157 157 160 166 175 180 195
1103 1105 1120
402 403 410 415 422 430 433 438 445 453 456
-460 466 467 475 480 495
4103 4105 4120
433 438 445 453 456 460 466 475 281 281 467 480 495
4103 4105 4120
402 403 410 415 422 430 433 438 445 453 157 456 467 460 466 475 480 495
4103 4105 4120
502 503 510 515 522 530 533 538 545 553 556 560 566 567 575 580 595
5103 5105 5120
0.01560 0.03760 0.01870 0.03970 0.01720 0.01660 0.04040 0.04090 0.00990 0.02000 0.01690 0.00790 0.04100 0.01710 0.01610 0.23560 0.53480 0.51520 0.63480 0.71650 0.73480 0.71460 0.61560 0.63760 0.61870 0.63970 0.00980 0. 20740 0.01600 0.31660 0.34040 0.34090 0.31780 0.34100 0.31710 0.31610 0.33560 0.02770 0.07020 0.02770 0. 02770 0.02770 0.02770 0.07060 0.02800 0.02850 0.02890 0.07140 0.02890 0.02890 0.07090 0.02890 0.07140 0.02840 0.07140 0.02840 0.02840
16.67 34. 37 34.23 29.35 18.89 38.13 34.33 23.91
-32.31 15.31
-32.88 15.88 30.06 23.96 25.70 30.05 32.47 32.83 31.53 30.29 31.17 32. 18 34.53 34.82 34 .80 34.50 93.20 25.68 68.69 27.61 28.05 26.94 26.23 29.23 29.46 29.42 37.53 66.95 60.05 56.86 54 .40 53.27 62.66 51.20 69.19 69.03 63.85 44.58 65.74 62.38 35.81 50.85 42.10 59.29 53.42 55.12 67.58
Pressure i Drop
(m. in.wg) 4.3
44.4 21.9 34.2
6.1 24.1 47.6 23.4
-10.3 4.7
-18.3 2.0
37.0 9.8
10.6 212.8 563.8 555.3 630.9 657.4 713.7 739.9 734.2 773.0 749.4 761.2
85.1 136.8
75.5 241.4 267.8 247.4 218.6 291.4 275. 2 273.5 472.7 124.2 253.2
89.6 82.0 78.6
108.8 185.1 134.0 135.8 117.8 141.9 124 .9
112. 90.9 74.7
116.6
q9.8 203.7
8 6. ' 129.'
Operating Cost
($/yr)
P, qPri- ýntIed: 0 6/ /9 10:4 :
Air Power Loss (hp)
0.01 0.24 0.12 0.16 0.02 0.14 0.26 0.09 0.05 0.01 0.09 0.01 0.18 0.04 0.04 1.01 2.88 2.87 3.13 3. 14 3.51 3.75 3.99. 4 .24 4.11 4.14 1.25 0.55 0.82 1.05 1 . 18 1.05 0.90 1.34 1.28 1.27 2.80 1.31 2.40 0.80 0.70 0.66 1.07 1.49 1.46 1.48 1.10
1.00
i. 0
0.51 S6O,
0 84 '0 93
10 210 103 138
16 126 224
77 46 10 83
0 153
32 37
878 2513 2503 2731 2734 3054 3269 3481 3696 3581 3606 1089
482 712 915
1031 915 787
1169 1113 1105 2436 1142 2088
699 612 575 936
1301 1273 1287 1033
869 1127
963 447 522 ,32
812 1494
657

Post Closure Open-Loop Natural Ventilation l('AI)(10000-111717-0210-00002 REV 00
ATTACHMENT II Page II- 19 of 11-24
VnetPC for Windows vl.Oa H:\REPLADVA.VNW
Branch Resul:s 06/23/99 10:46:L4
Branch; From To F Total Airflow Pressure Air Power Operating No. R Resistance Drop i Loss Cost
B (P.U.) (kcfm) (m.in.wg) (hp) ($/yr) 172 502 702 0.20000 66.95 896.5 9.46 8241173 174 175 176 177 178 179 180 181 182 183 184 185 186 187 188 189 190 191 192 193
503 510 515 522 530 533 538 545 553 556 560 566 567 575 580 595
5103 5105 5120
3 104
703 710 715 722 730 733 738 745 753 756 760 766 767 775 780 795
7103 7105 7120
104 103
0.20000 0.18000 0.15000 0.10000 0.03000 0.01000 0.00000 0.00000 0.00000 0.00000 0.00000 0.00000 0.10000 0.05000 0.09000 0.10000 0.15000 0.20000 0.20000 0.01780 0.00670
60.05 56.86 54.40 53.27 62.66 51.20 69.19 69.03 63.85 44.58 65.74 62.38 35.81 50.85 42.10 59.29 53.42 55.12 67.58 92.57 92.57
721.3 582.0 443.9 283.7 117.8
26.2 0.0 0.0 0.0 0.0 0.0 0.0
128.2 129.3 159.5 351.5 428.0 607 .5 913.5 152.5
57.4
6.83 5.21 3.81 2.38 1.16 0.21 0.00 0.00 0.00 0.00 0.00 0.00 0.72 1.04 1.06 3.28 3.60 5.28 9.73 2.22 0.84
5947 4544 3316 2075 1013
184 0 0 0 0 0 0
630 903 922
2861 3139 4598 8476 1938
730

Post Closure Open-Loop Natural Ventilation
BCADOOOOO-01717-0210-00002 REV 00
ATTACHMENT II Pap-e II- 20 of 11-24
VnetPC for Windows vl.Oa H:\REPLADVA.VNW
Branch. From To No.
35 20 1
I Fixed Booster R Airflow Pressure
(kcfm) !(m.in.wg) 608.63
Regulator Branch Resistance Resistance
(P.U.) (P.U.) 0.00001 0.00000
Fixed Quantities 06/23/99 10:46:14
Total Resistance
(P.O.) 0.00001

Post Closure Open-Loop Natural Ventilation ATTACHMENT II
BCADOOOOO-01717-0210-00002 REV 00 Page II- 21 of 11-24
VnetPC for Windows vl.0a Fan Input
H:\REPLADVA.VNW 06/23/99 10:46:14
Fan No.: 1 From: 17 To: 18 Pressure: 6.000 in.w.g. Description: First Empl Shaft Fan
Fan Name: Joy 144-79-590 Fan Setting: 4 Comments: Fan curve #40 Points: 10 Quantity Pressure Description
200.00 7.000 Stalling 250.00 8.000 Stalling 350.00 9.000 Stalling 470.00 9.500 Max normal operation 520.00 9.000 Normal operation 620.00 7.000 Normal operation 700.00 5.000 Normal operation 740.00 4.000 Normal operation 760.00 3.000 Normal operation 800.00 1.000 Normal operation
Fan No.: 2 From: 14 To: 13 Pressure: 6.000 in.w.g. Description: Former Dev Shaft Fan
Fan Name: Joy 144-79-590 Fan Setting: 4 Comments: Fan curve #40 Points: 10 Quantity Pressure Description
200.00 7.000 Stalling 250.00 8.000 Stalling 350.00 9.000 Stalling 470.00 9.500 Max normal operation 520.00 9.000 Normal operation 620.00 7.000 Normal operation 700.00 5.000 Normal operation 740.00 4.000 Normal operation 760.00 3.000 Normal operation 800.00 1.000 Normal operation
PagePrinted: 06/23/99 10:47:11

Post Closure Open-Loop Natural Ventilation BCAD00000-01717-0210-00002 REV 00
ATTACHMENT II Page II- 22 of 11-24
VnetPC for Windows vl.Oa H:\REPLADVA.VNW
Fan Results 06/23/99 10:46:14
Fan From To Fan Fan Fan I Air Operating Fan Description No. Pressure Airflow Curve Power Cost
(in.wg) (kcfm) (hp) ($/yr) 1 17 18 7.192 610.43 On 691.79 602766 First Empl Shaft Fan 2 14 13 8.436 548.22 On 728.75 634975 Former Dev Shaft Fan
PaaePr-int ed: 00)/12319,iq, 10: 42ý: '!'
BCADOOOOO-01717-0210-00002 RE 00

215.20
546.24 -. . .
00
1.66 iK/
217.89
/
207.74*' - 177.69 , 151 .99 128.03"91.7 `82.66
/ ' / ; I .7 \~ ^ ,, . / / 6 .,/\
114.98 56.74 18.6i1 028 "2961 63.86"
/
.
kFD
001 i *
.,.107.63
NJ
,D
N4 13233 N 129.68
102.74
43.98
-
98.J2 "114.89 145.3"7
/ 'I
/
,,., /
-70.35•
"167.0 191 58
,/
/
C.AW
--J/1.10
"216 92 244,14 278. 2
'C', Ck"
A A/
/540.26 67 6).ii'1 1.42~'
//
/ I C')
-6-0 4 i~
78.39
00
0Z
-. ,
4
C9909
(LO000"O)
C,) A
150.95 161.56
\ \
, \
0 ,0
0=
0
0
0_
0..
I
I I
H>
H,,,
I'.)
0
k)
)
/
1062. 74

Post Closure Open-Loop Natural Ventilation
BCADOOOOO-0171 7 -0210-0000 2 REV 00
ATTACHMENT II Page II- 24 of 11-24
CD
F'
N
CD
F'
CD 0'� N
"::22z
/,
/ C , - - ,:r
414
1 1 • 37.0
4 .y
�13 2
0
34.2 .:.2
0'4
cq, O
;c ,0 ,
''.4
IT" N'
1� CD UN
/
0) * CD
'�' 'A 0124� '0' .U
247 .4
½
Clv
Cl'
0
. 1
2914
2 7 3w 0-i
CD
1.4".1
.02
.4
* CD F'
* UN
/
* CD
0 (1)
55.6 " 4.7 - 202.2
(8.436) "o 601.',1 VnetPC for Windows vl.Oa H:\REPLADVA.VNW
Pressure Drop (m.in.w.g.) Printed: 06123199 10:56:30
Note: Obliteration of characters in this plot is not quality affecting and
'0 N
/
630
'ON
'.Ž
N.
� /
c6
('N �Lt�
A
C3 0 0 0 0
0
0 I i
.r . !M
L6 /
c'N 0
qL6 'CD
8'>
'0�
I ('N
C',
0) N N
co co
0
.. 0
60 -S
1 6 '
1ý,. ,
LI?
C'j6 NNN
i
0.0
I

Post Closure Open-Loop Natural Ventilation
BCADOOOOO-01717-0210-00002 REV 00
ATTACHMENT III Page III- 1 of 111-29
VNETPC Ventilation Model for 1.0 mA31s per emplacement drift split
A ventilation model was created in preparation for postclosure natural ventilation mode. At this stage, a projected normal mechanical ventilation balance was established. A diagram of the model
was prepared with assigned nodes and branches. Resistance of the branch representing the
airways were calculated through Microsoft Excel Spreadsheet and used as input to VNETPC. The
ventilation model was simulated with a selected fan curve on the primary system. From the
performance shown by the primary fan output of VNETPC, the overall system resistance was
calculated. The overall resistance was correlated and applied to natural ventilation pressure of 124
and 248 Pa (0.5 and 1.0 inch Water Gage) postclosure mode. The results are tabulated below:
Calculation for R from VNETPC file: REPLAD0l.VNW I With Mechanical Power Predicted Air at NVP Case
I I H - Q R H Nat Vent Q Air Flow
Pressure Air Quan Resistance I inch WG cfm/100000 R = H/QA2 inch WG Q=(H/R)A.5 q=Qx100000
(NVP) cfm
Case NVP = 0.5" Fan 1 7.140 5.818 0.2099389 1 2.18 218250
Fan 2 7.501 5.7497 0.226897 1 2.10 209935
Fan 3 4.390 6.2741 0.1115223 0.5 2.12 211741
Total 639926
Average cfm per drift for 240 split 2666
Observation. New design layout with additional exhaust main, intake & exhaust shafts can exceed
the 1.0 mA3/s (2119 cfm) average airflow per emplacement drift at projected NVP over 10,000
years-

200
201
700-
�70V
""601
1602
ATTACHMENT III Page 111- 2 of 111-29
19
717
18
I00
042
'615
/30 1230-__
* "233,
!29
i238-__
;256
626
,266-
!722-:422'522,-
i730 •430,
T733 7,4331 -"6533.
38 /•4 3 8
545 ,446S 545.
- 1753J'453"---'. •53, ;0
056_ 456. 656__,56
a--. _-.-',60 / 460J><- ' L•_°
26
'276
480,
27
ý2103
12105
t2120
"!10
-75J495ý • . I "'96•
17103/'4103
- .5103,
lj7iO5 74105_ "'5105
0 2 i 20
666
6----667
0_ -!'675
;695
'6103
6105
i622
;630
;633
'638
':645
:653 4
25
'153
565
1155"-160
'166
""175
t80•
F9 5
'ý1 105
179
I1102
221 23
11
"9
"1162
12
VnetPC for Windows vI.Oa C:\VNETWIN\REPLADO0 .VNW Line Plot
Printed: 06/28199 13:38:08
Post Closure Open-Loop Natural Ventilatiot.
BCADOOOOO-01717-0 2 10-0000 2 REV 00
132
"~28
35
-2• z402.
MO8
120

Post Closure Open-Loop Natural Ventilation BCADOOOOO-01717-0210-00002 REV 00
ATTACHMENT III Page 111- 3 of 111-29_
256
*�
'�
(NJ 9
7 134 13
0
�e�j *0
3Q�
to U,
cvc'J to
to F (NJ
p. (0
764;
76� �
4 IC) (0
C, 0) '
to F N-o
(0"�
tO
~~to
Lto 74~ 1
(0I 7ý~
7s�
F3�* ICNJ -.
36' -. 27
IC) ,(NJ ,C') '0 F,
23
'4- 1� - -
30) .33
VnetPC for Windows vl.Oa C:\VNETWIN\REPLADO1 .VNW
Branch Numbers Printed: 06/28199 13:41 :56
259
Note: Obliteration of characters in this plot is not quality affecting and can be traced to the original VNETPC tabulated output. This plot of VNETPC output is only used as a general guide to understand the intricacies of the ventilation model.
cto
0 'to I�3j
747 �303
)�33
43� 304 (NJ 4. to * 33g.
* 743 * C') to 1r� '�
744
(p.
243
id
i 7C3
7,;>4
.0;,
cy)
cot
CN
(NJ
*0 p N
20.2134
0 (0

Post Closure Open-Loop Natural Ventilation
BCAD00000-01717-0210-00002 REV 00
ATTACHMENT III Page 111- 4 of 111-29
VnetPC for Windows vl.0a C:\VNETWIN\REPLAD01 .VNW
Fan No-: 1 From: 17 To: 18 Pressure: 6.000 in.w.g. Description: First Empi Shaft Fan
Fan Name: VNETPC 3.1 #19 Fan Setting: Set 25 deg Comments: JOY-M132-79-710 BLADE SET 25 DEG Points: 10 Quantity I Pressure
50.00 -18.00 Stalling 130.00 15.000 Stalling 2_00.0 12.600 Stalling 1270MU 1T.400 Stalling 325.M =2.0 Stalling 380.00 13-.40 Max normal operation 440.00 12.400 Normal operation 501v.00 10.800B Normal operation 6000. 6.4001 Normal operation 660.00 2.0001 Normal operation
Fan No.: 2 From: 14 To: 13 Pressure: 6.000 in.w.g. Description: Former.Dev Shaft Fan
Fan Namei VNETPC 3.1 #19 Fan Setting: Set 25 deg Comments: JOY-M132-79-710 BLADE SET 25 DEG Points: 10 Quantity I Pressure
5-0b- I t- 18.0 Stalling . T15.00 Stalling
200.00 1.60 Stalling - -270.00 11.4001 Stalling
250 12.6001 ;Stalling
-380-00 13.400 Max normal operation I0 Z U2.400 Normal operation
500.00 10.8001 Normal operation 600.00 6.40 Normal operation
IJ 0U.00 2e.00 Normal operation
Fan No.: 3 From: 29 To: 30 Pressure: 6.000 inrw.g Description: Mid Empl Shaft Fan
Fan Name: VNETPC 3.1 #19 Fan Setting: Set 25 deg Comments: JOY-M132-79-710 BLADE SET 25 DEG Points: 10
-Quantity 1 Pressure
•u.uujt o.uvuu Itaiung 530.300--18.0001 Stalling
21 .0 UU 11.4001 j btalling 1-325.00112E6T0 Sta-ing
----380 0FTO ý3.0041 Max- nm opreatio n_ 44000 - -1 27400i -Normaloperation
.500.00 1, T07800YNormal o-peration * 600 00 -A---.-4000l n.o o6peraIion
660_07 _2._000': Nor-ar ofealion..
I zuu.uut I z.tbUU biauing

Post Closure Open-Loop Natural Ventilation BCADOOOOO-01717-0210-00002 REV 00
ATTACHMENT Ill Page Ill- 5 of 111-29
TI TIl HI , il
~ ~~~lIT!i ,;i: YIlfiIllbY1HIIIII 1 IiiII' 114-1 .11HIHII I t
1.11 I I I I II II I I i
___ r7. ;' Ji , i
C - 8 4 2 F N ~ 1 D E L 1 3 2 - 9 - 7 1
C-8242 FAN WDEL M132-79-710

(
Calculation of Airway Resistances During Caretaker Phase Prior to Postclosure (Going to postclosure natural vent at I mA3/s per drift split)
FILE # Replad01-05-10-Vaxis: Folder- e VNETPC INPUT, Design Feature Devel , Case 1 macement drift. Data r a RSJurani & A Linden)
FLnE BRANCH RESISTANCE REGULATOR RESISTANCE AIRWAY FRICTION XE PERIMETER ACTUAL ACTUAL EOUI NOTES FOR BRANCH DESCRIPTION
nRESISTANCE In PU RESISTANCE FACTOR AREA P LENGTH LENGTH LENGTH Noin PU RE ITN EK(l'1) A(Ft) meter L' L=L'+I 0%
VNETPC Input in PU from R R K (x0 10) A (F) (me Lt L Ft)
RPUauRPUb Field Installed RPUa , R/10 KLP/(5.2A^3) Ib- (33) (m) (Ft) (Ft,)
RPUb In.mln^2/ft^6 min^2/ft^4 (3.23
(3.5) (3 3)
RO0.0051 0.050 30 38933 72,36 1992.0 6535 7189 North Ram
18 18 20 0.0051 0.0000 0.0000 0 0 0. .. 0 Srfa 20 6 0.0003 00001 0.0011 60 389.33 72.36 49.2 16 1 1 21 6 0.003 0.00043 007 0 389.33 72.36 151.48 42 306 NSoth Ram 33 111 0.0004 0.0004 - 5Ex
242 -11 108 0.0030 0.000 0.0394 60 389.33 72.36 1543.01 56 8St em •' 1-• 1"• 0.09 70 3 23•646'----892148 2362" .lEast Main DriftExt.
[' I""/ I-"• .000 • • "---T .- 3 72.3------ 65. 2148 •as
5 1-00 102-' 0.0039 0.0013 0.039 - - 723-'--• 274---• •. atanr
86 102 103 0.0003. 0.0003 0.00286 70-"'-O- 3- 72.3•" --- 6 43. 1437 5 7 I_ ., East Main Drift
2 81 9 0.0012 0.0012 0.0121 70 389.33 72.36 27.2 75 78 East Main Drift
03 1 0.0009 0.0086 7 0 389.33 72.36 201.9 675 572 Eaot Main Drift
08 10 113 00009 - 2!
9 115 12 -0002 -0.01 - .021 0 8933 2.6 02. 66 3 WEast Main Dito eeo mn nt rr
0. 001 107 93 7.3 219 71 87 atM i rf
11 1"- 11 1- 0 E0a0018
0.0018 0.0178 30 ast 72E36 698.5 t2ou C n et 12 6(0 605 0.1001 0.1000 0.0001 0.0010 2----6.53 80.13 670'•- 220 I 242 East Exhaust Main to Em~pl Shaft
0.000 -Too -2- 45 801 57. 189"-'- 208 West Exhaust Main Connector to Ernpi Shaft
13 701 605 _ _ _ .0001 --- 00 0. 0 9 580 1 5 .
"14 6-05 17 0.0008 0.0008 0.0082 25 429 71.12 431,2 1415-- - 155 E'mplacement Shaft (. i.
-1 -17 -1 0.0020 0.0020 0.0000 0.0000 0 - - 0.0 0 0 L ~cement Shaft
17 19 1-7 1000.0000 1000.0000 0.0000 0.0000 0 0 0 0.0'--E • _ : •
1 18 20 003 .00)10 000 0.-" -0" 0 0 ) Surface Discharoe - Evase (Outlet Cone)
19. 4_ 5 0.0072 0.0072 0.0716 60 38.3 2.36 1402.6 4602 50._... ut h RamD O PC
20 -5 6 0.0003- 0.0003 0.0025 60 893 72.36 49.____2 161 - 18 Sot Rm
-21 -6- 7 0.0043 -0.0043 0.0427 60"3-89.33 72.36-'-" ' 835.8 24 '6
:- -- 0010.0001 0.0012 60---6 72.36"--'' 23.1--' 76 83 Sot Ram
.)•- -- g 0.0012 0.0012 0.0116 60 38.3 72.36-"--• 227.2 745 820 Sout Ram
~- ..... An 60 3- 3 72.3"-6---' 200.•0 65"---- 722 • Et uv
15.0000
0.0020
1000.0000 1000.0000
0.0050
0.0001
0. 000 1 0. 0000 0*0004 0.0026 0.0000 0,0000 0.0000
0.0000 0.0000
0.0000 0.0000 0.0020 0.0001 0. 00 14
0.0011 0.0010 0,0004 0.0039 0,0258 0.0000 0.0000 0.0000 0.0000 0,0000 0.0000 0.0000 0.0000 0.0200 0.0015 0.0144
25 25 25 25
95 0 0 0 0 0 0 0 0
70 70 70
446.53 446.53 446.53
402.49 0 0 0 0 0 0 0 0
389.33 389.33 389.33
80.13 80.13 80.13 80.13 71.12
0 0 0 0 0 0 0 0
72.36 72.36 72.36
66.6 26.1
249.3 358.8
0.0 00 0.0 0.0 0.0 0.0 0.0 0.0
336.5 25.1
241.7
.219 86
818 1177
0 0 0 0
0 0 0 0
1104 82
793
25
900 1295
0 0 0 0 0 0 0 0
1214 91 82
West Main to Development bnatt urlrn _East Exhaust Main to Connector West Exhaust Main to Connector Exhaust Main Connectin Drift to Dev Shaft
D'v Shaft (Man/material - 6.9 m die)
Prima Fan- Development Shaft
Leaka li1st leg Leakage 2nd le Surface Outlet - Evase
Surface Dumm Connector
Surface Dummy Connector
Surface Dumm Connector Surface Dummy Connector
North Main North Main NothMain
0=
0=
0
,J 0d
0
0=
0 CA
CA
0 0
z
(
24 25 26 27
28 29 30 31 32 33 34 35 36 37 38 39 40
9 10 23 22 21 16 14 13 15 13 12 11 4
20 100 600 700
10
14
215
14
12 11 4
1
1
600 700 200
0.0010 15.0001
0.0001 0 0000 0.0004 0 0026 0.0020
1000.0000 1000.0000
0 0050 0.0000 0.0000 0.0000 0.0000 0.0020 0.0001 0.0014
/
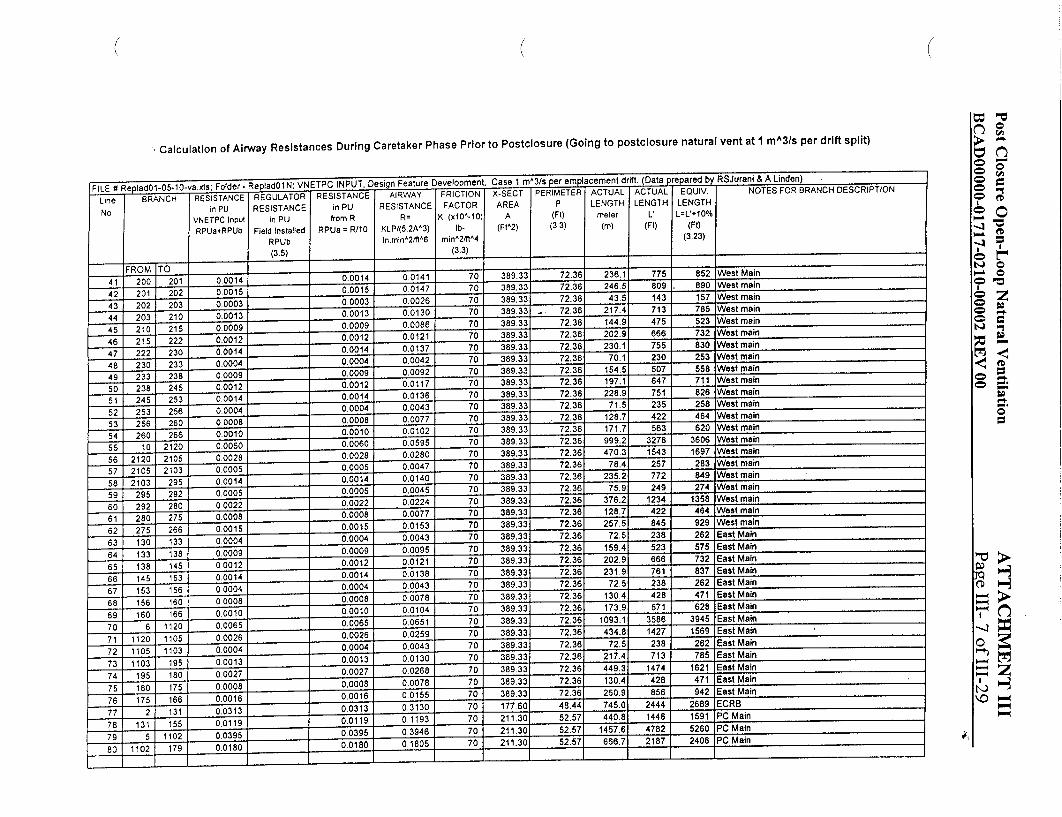
(
Calculation of Airway Resistances During Caretaker Phase Prior to Postclosure (Going to postclosure natural vent at I mA31s per drift split)
FILE 1 Re ladOl-05-10-va.xIs; Folder - Re lad01N: VNETPC INPUT, Design Feature Development, Case 1 m^3/s per emplacement drift. (Data pared by RSJurani & A Linden)
Line BRANCH RESISTANCE REGULATOR RESISTANCE AIRWAY FRICTION X-SECT PERIMETER ACTUAL ACTUAL EOUIV, NOTES FOR BRANCH DESCRIPTION
No in PU RESISTANCE in PU RESISTANCE FACTOR AREA P LENGTH LENGTH LENGTH
VNETPC Input in PU from R R= K (x10'.10) A (Ft) meter L L=L'+10%
RPUa+RPUb Field Installed RPUa = R11O KLP/(5.2A^3) Ib- (FIA2) 1331 (i) (Ft) (Ft)
RPUb In.minA2/t'6 min^2/fIA4 (3.23)
(3.5) (3.3) 1
FROM TO
41 200 201 0.0014 0.0014 0.0141 70 389.33 72.36 236.1 775 852 West Main
42 201 202 0.0015 0.0015 0.0147 70 389.33 72.36 246.5 809 890 West main
43 202 203 0.0003 0.0003 0.0026 70 389.33 72.36 43.5 143 157 West main
44 203 210 0.0013 0.0013 0.0130 70 389.33 - 72.36 217.4 713 785 West main
45 210 215 0ý0009 0.0009 0,0086 70 389.33 72.36 144.9 475 523 West main
46 215 222 0.0012 0.0012 0.0121 70 389.33 72.36 202.9 666 732 West main
47 222 230 0.0014 0.0014 0,0137 70 389.33 72.36 230.1 755 830 West main
48 230 233 0.0004 0.0004 0.0042 70 389.33 72.36 70.1 230 253 West main
49 233 238 0,0009 0.0009 0.0092 70 389.33 72.36 154.5 507 558 West main
50 238 245 0.0012 0.0012 0.0117 70 389.33 72.36 197.1 647 711 West main
51 2-45 253 00014 0.0014 0.0136 70 389.33 72.36 228.9 751 826 West main
256 260
0.0004'T 0.0004 0,0043 70 389.331 72.36 71.51 235 258 west main 0.00080.0008 0.0077 70 389.331 72.36 128.7 422 464 West main S... ^•^• 7 ,50 ,1,I 7• lnI 171 7 563 6 20 iWest main
266 0.0010 0.01U .U~l u i- -u, , 0 33. 7236... ..... ... ... ....... i 2120 0.0060 0.0060 0.0595 70 389.33 72.36 999.2 3278 3606 West main
2105 00028 0.0028 0.0280 70 389.33 72.36 470.3 1543 1697 West main
2103 0.0005 00005 0.0047 70 389.33 72.36 78.4 257 283 West main
295 0.0014 0.0014 0.0140 70 389.33 72.36 235.2 772 649 West main
292 0.0005 0.0005 0.0045 70 389.33 72.36 75.9 249 274 West main
280 0.0022 0.0022 0.0224 70 389.33 72.36 376.2 1234 1358 West main
275 8 0.0008 0.0077 70 389.33 72.36 128.7 422 464 West main
266 000015 0.0015 0.0153 70 389.33 72.36 257.5 845 929 West main
33 .0 0.0004 0.0043 70 389.33 72.36 72.5 238 262 East Main
138 0.0009 0.0009 0.0095 70 389.33 72.36 159.4 523 575 East Main
145 0.0012 0.0012 0.0121 70 389 33 72.36 202.9 666 732 East Main
153 0.0014 0.0014 0,0138 70 389.33 72.36 231.9 761 837 East Main
156 160 166
1120 1105 1103
195
180 175 166 131 155
1102 179
0 0004 0.0004 010043 70 389.33- ( Z:.,•o ý,1. 'A)• East Main .... 0008 0.0008 0 0078 70 389.33 72.36 130.4 428 471 East Main
... ^^• ",,• "so yr "72; r 17•t n 871 I 628 East Main
0.0010 0,0010 u.u Iu, U4,u . , . . .. . . . . . 0.0065 0.0065 0.0651 70 389.33 72.36 1093.1 3586 3945 East Main
0.0026 0.0026 0.0259 70 389.33 72.36 434.8 1427 1569 East Main
0.0004 0.0004 0.0043 70 389.33 72.36 72.5 238 262 East Main
0.0013 0.0013 0.0130 70 389.33 72.36 217.4 713 785 East Main
00027 0.0027 0.0268 70 389.33 72.36 449.3 1474 1621 East Main
00008 0.0008 0.0078 70 389.33 72.36 130.4 428 471 East Main
0.0016 0.0016 0.0155 70 389.33 72.36 260.9 856 942 East Main
0.0313 0,0313 0.3130 70 177.60 48.44 745.0 2444 2689 ECRB
0.0119 0.0119 0.1193 70 211.30 52.57 440.8 1446 1591 PC Main
0.0395 00180
0*0395 0.3946 70 211.30U DZ,.Z," I 1ýuf.v ,o au ,•,,, 0.0180 0.1805 70 211.30 52.571 666.7 2187 1 2406 1PC Main
L-0
oz o=
9
0
52 253 53 256 54 260 55 10 56 2120 57 2105 58 2103 59 295 60 292 61 280 62 275 63 130 64 133 65 138 66 145 67 153 68 156 69 160 70 6 71 1120 72 1105 73 1103 74 195 75 180 76 175 77 2
78 131 79 5
80 1102
/
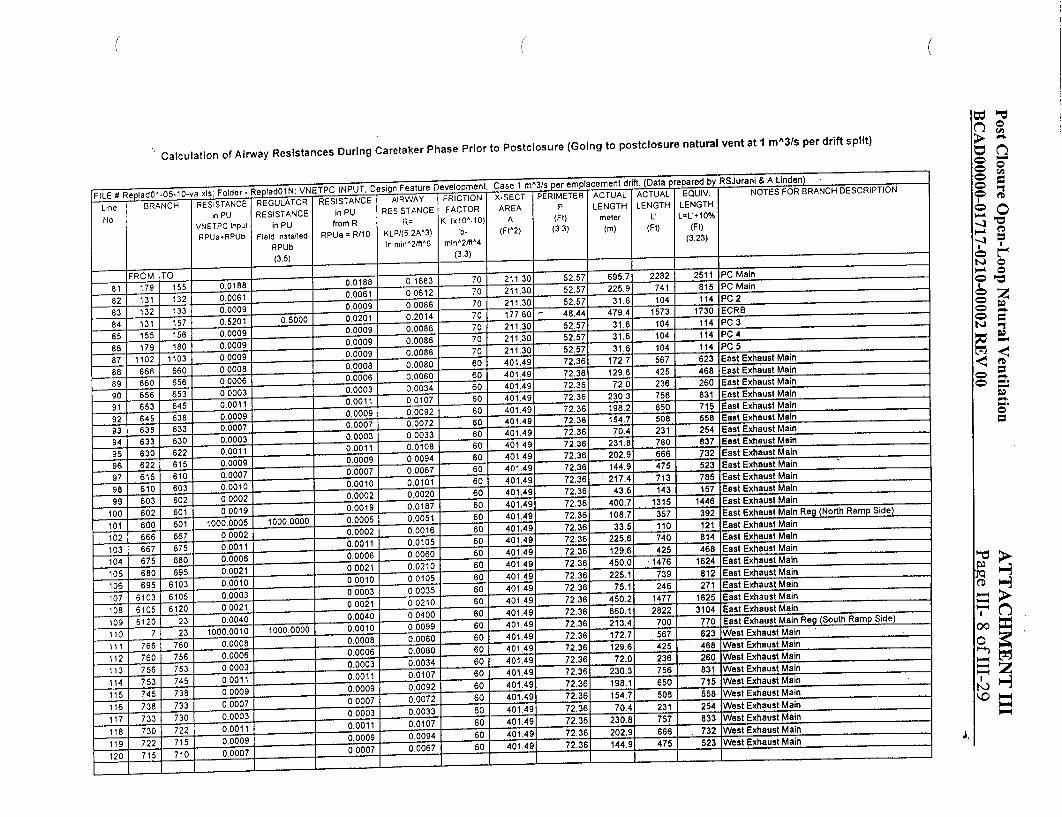
I Ra o N: VNETPC INPUT, Desi'n Feature Development, Case 1 r3s er em laceent drift eared b RSJurani & A Linden.
FLE 0RANCH RETaIRWAY FRICTION X.SECT PERIMETER ACTUAL ACTUAL EQUIV. NOTES FOR BRANCH DESCRIPTION Line I BRANCH RESISTNCE R ,L/T r"
No in PU RESISTANCE in PU RESISTANCE FACTOR AREA P LENGTH LENGTH LENGTH
VNETPC Input in PU from R R= K (x00'10) A (Ft) meter L L=L+10%
RPUa.RPUb Field Installed RPUa - R/t0 KLPI(5.2A^3) Ib- (Ft^2) (33) (m) (Ft) (Ft)
RPUb In min^2/ft^6 min^2/ft^4 (3.23)
(3.5) (3.3) _
"00188 0,1883 70 211.30 52.57 695.7 2282 2511 PC Main
89--- 660 .65 0.0008 0.0006 0.0060 60 414 23 196 45 48EatEhutMi
89 6 653 0.00000003 70 211.30401.49 225.9 741 236 PC Main
982 6310 3 0.0061 006 0 9 0 - 00002 0.0002 0.0020 70 211.304 2.36 31.6 104 15 PC E
83 6 00003 0.0003 000 18" 6 6 00201 0.0021 0.2014 60 417.49 2.3 479.4 1573 1625 ECRBE 854-- 131 ..5 0.501009 00 0.020090186• 516 73 6 73 00007 0.0007 0.002 670 211.304 2.36 31.6 104 558 PCW
179- - - - 0.0.0009 0.0086 70 21.0 5.7 31 14 14P
86 18 .00 9 0.09- 8 112-T0- 0- 0 0.0009 0.0086 70 21.30 52.5 31.6 104 14PC 5
-11 -73 730 0-000 0.0003 0080 60 401.49 72.36 72.4 231 25 Est Exhaust Main
189- 3 - 7 2 0.0006 0.0006 0.0060 60 401.49 72.36 23.8 425 8 East Exhaust Main
19 5 0.0009 0.0003 0.0034 60 401.49 72.36 72.9 2366 76 East Exhaust Main
0 75 7 0.007 0.0087 60 401.49 72.36 230.3 756 53 East Exhaust Main -91 6I 3 6 5 0 1 0.00110.17 6
- - 0.0009 0.0092 60 414 23 198.2 650 75East Exhaust Main
92 6 5 6 8 0.0009 0.0072 E s Ex a s Main
93 63 63 0.0007 0.0007 .07 60 419 23 154.7 508 58Es xas
S- - •- 0.0003 0.0033 60 401.49 723 70.4--- 231 24E'ast Exhaust Main
95 60.2 . 001 0.0011 0.0108 60 401.49 _7.6 231.8 760 87East Exhaust Main
__9 . 63 63 0,00113
96 I 61" 0.0009 0.0009 0.0094 60 414 23 202.9 666 72East Exhaust Main
610• - 0.07 0.0067 60 40.9 23 144.----9 475 523East Exhaust Main
g7 61 5 0.0007 0.000
98"---0--' 03 -- " 0010- .0010 0.0101 60 401.49 7.6 217.4 13.Estxhust Main
9 60 60 0- 00 0.0002 0.0020 60 401.49 723 43.-'-'- 143----- E-ast Exhaust Main
100"-- 60 601 0,0019 0.0019 0.0187 60 401.49 7.6 400.7 1315 144 East Exhaust Main
10i• 6oo 60 1000.0005 100000 0.0005 0.0051 60 40149 7236 108.----7- 35---7 - 392 Eas Exhaust Main Reg NrhRm Side)
10 6-6 667 0.0002 0.0002 0.0016 60 40.9 7.6 33.5 •110 121 Eas Exhaust Main
- -02 0.01 0-10 60 4149 7.6 740 84East Exhaust Main
103 " 667 67 0.00110.0 1 00 5
2 56
10 - - -i .00 0.0006 0.0060 60 401.49 72.3 129.6 425 46 East Exhaust Main
10--' " -- --02 0.0021 002-10 60 401.49 72.3 450.0• ' • 147--- -6' 1624 E'ast Exhaust Main
10"- 6- -9 610 0.0010 0.0010 _ .15 60 401.49"• ' " 72.36 225.1•" •739-'"- 81 East Exhaust Main
107- 610 610 0,0003 0.0003 0.0035 60 401.49 7.6 75.1 246 21East Exhaust Main
710----' - ý 1- -0 0021 0.0021 0,0210 60 40.9 23 450.2 1477 162 East Exhaust Main
10---•" ,•_ • ,0400.0040 000 1 401.49 72.3 860.1 282-'-"2" 31,04 East Exhaust Main
-110 - 7 -23 -71000.0010 100.0000 0.0010 0.0099 7 !60 401.4 -- 2 213.4"-" 70---'0 770 East Exhaust Main Reg Suh aeSide)
11--" " .080.0008 0.0080 60 401.4--9'' 72.3 172.7 56--'--7 62 West Exhaust Main
11"--'' 76 76 • 0.00 0.00 0.0 1 -- 2.---• 4-'-- etEhutMi
112-- 76 756 0.0006 0.0003 -- 72.346• 129. 4•2" 5 43'" 6 8 ' West: Exhaust Main
1• " 7-5 74 0.0011 0.0011 0.0107 60 401.49 7.6 230.31 756 81West Exhaust Main
115 74 -738 0.0009 -0,0009 0.0092• 60 404 7.6 198.1 •650 -715 West Exhaust Main
11--' 738 73 0.0007 0.0007 0,0072 60 401.49 7.6 154.7 508 558 West Exhaust Main
11--7- 7-3 73 0.000-3 - 0.0003 00033 60 40149 72.3 70.4 231 25 West Exh aust Main
11--1--8 -30 72 001 0.0011 0.0107 6' 401.49-•-•- 72.36 230.8--- •75"--"7 . 833 We"-st Exhaust Main
-119__•_ -22 71 -0009.0009 0.0094 60 401.49 7,6 202.9. 666 72West Exhaust Main
120 15 71 " -. 00.00 000 0.00179 7_ _44.9 475 523 West Exhaust Main
Calculation of Airway Resistances During Caretaker Phase Prior to Postclosure (Going to postclosure natural vent at I mA3/s per drift split)
-4
-4 0
0 0= 0.
0=
"0
0 CA
z
(D 0-4 0-4
00 0

(
Calculation of Airway Resistances During Caretaker Phase Prior to Postclosure (Going to postclosure natural vent at I m^3/s per drift split) n
C o
FILE # R lad0105-10-va.xis; Folder- Relad01N: VNETPC INPUT, Design Feature Developmen cement . aa re ared b RSJurani & A Linden)
Line BRANCH RESISTANCE REGULATOR RESISTANCE AIRWAY FRICTION X-SECT PERIMETER ACTUAL ACTUAL EQUIV. NOTES FOR BRANCH DESCRIPTION
No n PU RESISTANCE in PU RESISTANCE FACTOR AREA P LENGTH LENGTH LENGTH
VNETPC Input in PU from R R= K (x10^-10) A (FI) meter L' L=L'+10%
RPUaRPUb Field Installed RPUa - R/10 KLP/(5.2A^3) Ib- (Ft^2) (3.3) (m) (Ft) (Ft)
RPUb ln.min^2/ft^6 min^2/ft^4 (3.23)
(3.5) (33
121 I " 0,0010 0.0010 0.0101 60 401.49 72.36 217.4 713 785 West Exhaust Main -1227----3- 70 0.0002 0.0002- 0.0020 6 0.9 7.6 4. 4 5 etEhutMi
12__.____ 0.0017 0.17 60 40.4 723 7. 11 14 West Exhaust Main
129 795 7010 0.0010 -
1 10 0 .0000 0.00 60 401.49 72.36 . 44 West Exhaust Main Reg North Ram Side) 138 22 4 0.000 0.0341 8u
192 30 4 0.2146 0.00016- 0.00145 60 401.30 52.35 33.3 176 194 West Exhaust Main
1240 233 43 0.0021 0 0.0011 0.010 401.30 52.357 76 4 0 1 280 West Exhaust Main
1296-- 67-" 7" 0.0011 0.01 6010 40.96 West Exhaust Main
127 77---5- 78 0!0008 0.0006 0.0060 - 72.36 12.6 42xhaust Main
112 38 4380 0037 0.0376 0. 376 O020 85 416.13 52.57 4576.3 18971 62085mlcmnrf West Sid
142 245 4453 010061 0 0 0.0018 0.0108 70 201.49 52.57 601 19 812 West Exhaust Main Wti E
14 2 0.162 0.0172 0.125 70 211.43 52.7 675.1 20 2 PC2 1 West Side
136 2 0.204 0 0.0740 0054003 4 a entift West Side
1 275 475 0 240.0016 0.0019 0.104 8 Emplacement Drift West Side t
310.235 0.0356 0.35 80 6 2.35 5.3 28 1 Em lacement Drift West Side
15 0 0 248 000 004 0.3480 85 181 2.7 533 17509 19250 Emlcement Drif k WEast Side
132. 7120I 22 0.0046 0 ,20 0,0140
1 1 02152 02000 040152 0.156 70 211.30 52.57 55.9 17 2 PC 1 east Side
133 8---2-00001076 00 0.0010 0.0100 60e• 5itWetSd
1 0. 0000 003 3480 85 168.13 52.57 5333 170 1925 Emplacement Drift West Side
0441"-- 70 211.30 0,1500 0.012 18372 202 PC I3West Side
-135 20 403 0.0152 0.0152 0.166
1 02 02000 0 0.85 8 1.3 52.57 533.3 1750 1925 Emplacement Drift West Side
10•'6 1 422 002348 0 2 0 0 85 168.13 52.57 533.3 1750 1925 Emplacement Drift West Side
137 21 41520 0.0348 0.348018 168.1 52. 7 6 1 3 1792 Em lc em ntDrf West Side
138'-- 22 42216 0.0348 0.69 Blc -C-- 3 0 West Side
5139- 23-- 430 0.214079 00 0.0146 0.1478 70 21.3 525 538.3 1766 1943 Ce
140233-T 43 0.24156 0.2000 - 0.0410 0.415604 25168.130 52.57 56.4191026 2080 PC 2tWest Side
15 •026 0.37 0.76 850 21681.3 52.57 7.3 19 208 Emlaeentrs Blc0Drift West Side
115 23 43 0.0376 0,.00 19755 217 E plce en Drift Weast Side (E py
245...,. !238 .20 0.03487 0.14867 70 201.93cement6
14 25 3 453 0.1152 0.20800 0.0397 -370.1 85 16.1 5.7 684 19 2 19 EmpaceetDitWst Side
15--- " " 024 0.15000 0.0172 0,1725 70 21.3 525Drif290 29 P e t SieatSd
1459 [ 0 6 0.0165 0.200 0.0166 0.65 -- •-3 Emplcement Drift Weast Side
14 •-7 4-7 0.49 020 ,00.r07 8 181 25 264 25 21Emplacement Drift Weast Side
-.- +148 280"- 281 0.2 4 0,200 0.0200 20.3401 48.4 47.168,1 1 E W s Sd
(
o -t 0
eb -4
- 0
o
t.-J -i
0
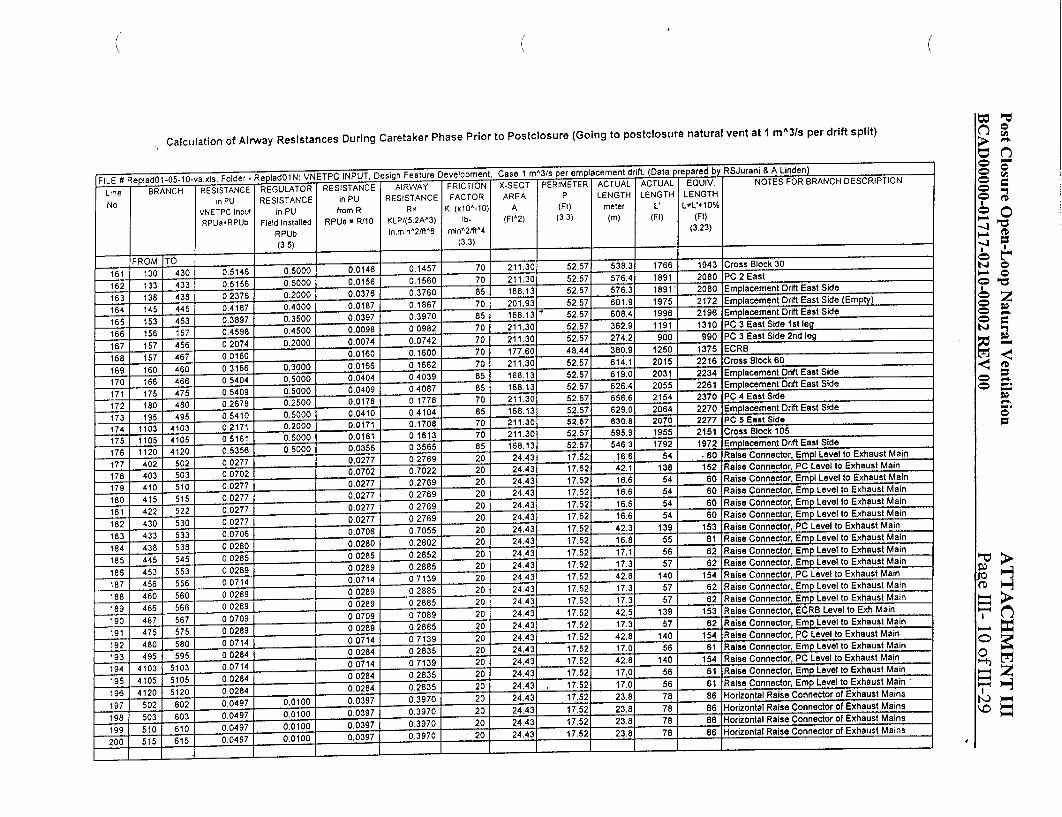
(
Calculation of Airway Resistances During Caretaker Phase Prior to Postclosure (Going to postclosure natural vent at I mA3/s per drift split)
FILE # Re lad01-05.10-va.xls; Folder - Re lad01N. VNETPC INPUT, Design Feature Develo ment, Case 1 m^3/s per emplacement drft. (Data prepared by RSJurani &A Linden) Lne-
BRANCH RESISTANCE REGULATOR RESISTANCE AIRWAY FRICTION X-SECT PERIMETER ACTUAL ACTUAL EQUIV. NOTES FOR BRANCH DESCRIPTION
No in PU RESISTANCE in PU RESISTANCE FACTOR AREA P LENGTH LENGT LEGT VNETPC Input in PU from R R= K (x10^-10) A (Ft) meter L L=L'+10%
RPUa+RPUb Field Installed RPUa x R/10 KLP/(5+2A^3) lb- (Ft^2) (33) (i) (FI) (F)
RPUb in.min^2/ft^6 mIn^2/ftl4 (3.23)
(3.5) (3.3)
16"1- 1-0- 0.5146 0.5000 0.0146 0.1457 70 211.30 52.57 538.3 1766 1943 Cross Block 30
162 133 433 0.5156 0.5000 0,0156 0.1560 70 21130 52.57 56.4 1891 2080 East
163 02376 02000 0.0376 0.3760 52.57 576.3 1891, 2080 Emplacement Drift East Side
164 0.4187 0.4000 0.0187 0 1867 70 201.93 52.57 601.9 1975 2172 Emplacement Drift East Side (Empty)
165 153 453 0.3897 0.3500 0.0397 0.3970 85 168.13 52.57 608.4 1996 2196 Emplacement Drift East Side
166 1-56 157 0.4598 0.4500 0.0098 0.0982 70 211.30 52.57 362.9 1191 1310 PC 3 East Side 1st leg
167- 157• 02074 0.2000 0.0074 0.0742 70 211.30 52.57 24.2 900 990 PC 3 East Side 2nd leg
168 157 467 0.0160 " 0.0160 0.1600 70 177.60 48.44 380.9 1250 1375 ECRB
169" 160" 40 0.3166 0.3000 0.0166 0.1662 70 211.30 52.57 614.1 2015 2216 Cross Block 60 170 166 466 0.540 03000 0044 0. 168.13 52.57 619.0 2031 2234 Emplacement Drift East Side
171 175 475 0.5409 0.5000 0.0409 0.4087 85 168.13 52.57 626.4 2055 2261 Emplacement Drift East Side
172 180 4-80 0.2678 0.2500 0.0178 0,1778 70 211.30 52.57 656.6 2154 2370 PC4 East Side a 0.25 0 0 0p410c e me n t D rift E a st S id e
173 19 9 5410 0.5000 0.0410 0.4104 85 168.13 52.57 629.0. 2064 2270 Emplcmn rf atSd 7174. 1103 1 0.502171 0.2000 0.0171 0.1708 70 211.30 52.67 630.8 2070 2277 PC 5 East Side
175 1105 4105 0.5161 0.5000 0.0161 0.1613 70'21595.9 1955 2151 Cross Block 105
1 76 1 45 168.13 52.57 546.3 1792 1972 Emplacement Drift East Side
177 402 502 0.0277 0.0277 0.2769 20 24.43 17.52 16.6 54 .60 Raise Connector, Empi Level to Exhaust Main
13.2 17,52 42.1 138 152 Raise Connector, PC Level to Exhaust Main
179 410 510 00277 0.0277 0.2769 20 24.43 17.52 16.6 54 60 Raise Connector, Empl Level to Exhaust Main 189 415 510 00277 0.0277 0.2769 20 24.43 17.52 16.6 54 60 Raise Connector, Emp Level to Exhaust Main 181 4 5 00277 0.0277 0.2769 20 24.43 17.52 16.6 54 60 Raise Connector, Emp Level to Exhaust Main
182 432 530 00277 0.0277 0.2769 20 24.43 17.52 16.6 54 60 Raise Connector, Emp Level to Exhaust Main
183 433 533 0.0706 0.0706 0.7055 20 24.43 17.52 42.3 139 153 Raise Connector, PC Level to Exhaust Main
0.0280 0.2802 20 24.43 17.52 16.8 55 61 Raise Connector, Emp Level to Exhaust Main 184 4 8 5 8 0.0280 " .2 0 0.8 22
- - 44 545 0 0285 0 0285 0.2852 20 24.43 17.52 17.1 56 62 Raise Connector, Emp Level to Exhaust Main 186 445 545 00289 0.0289 0.2885 20 24.43 17.52 17.3 57 62 Raise Connector, Emp Level to Exhaust Main
187 456 556 00714 0.0714 07139 20 2443 17,52 42.8 140 154 Raise Connector, PC Level to Exhaust Main 188 4- 6 556 00289 0.0289 02885 20 24.43 17.52 17.3 57 62 Raise Connector, Emp Level to Exhaust Main 189 4 5 00289 0.0289 0.2885 20 24.43 17.52 17.3 57 62 Rai 198 46 567 0,0709 0.0709 07089 20 24.43 17.52 42.5 139 153 Raise Connector, ECRB Level to Exh Main 191 475 57 0 0289 0.0289 0.2885 20 24.43 17.52 17.3 57 62 Raise Connector, Emp Level to Exhaust Main
192 480 580 00714 0.0714 0.7139 20 24.43 17.52 42.8 140 154 Raise Connector, PC Level to Exhaust Main
193 0.0284 0.0284 0.2835 20 24.43 17.52 17.0 56 62 iRaise Connector, Emp Level to Exhaust Main
19 4753 51 0.0714 0.0714 0.7139 20 24.43 17.52 42.8 140 154 Raise Connector, PC Level to Exhaust Main
195 40 61 Raise Connector, Emp.Level to Exhaust Main
196 412 515 00284 0.0284 0.2835 20 24.43 . 17.52 17.0 56 61 Raise Connector, Emp Level to Exhaust Main
197 5 610 0 0.04100 0.0397 0.3970 20 24.43 17.52 23.8 78 86 1Horzontal Raise Connector of Exhaust Mains
198 503 603 0.0497 0,0100 0.0397 0.3970 20 24.43 17.52 23.8 78 86 Horizontal Raise Connector of Exhaust Mains
199 0.0497 0.0100 0.0397 0.3970 20 24.43 17.52 23.8 78 86 1Horizontal Raise Connector of Exhaust Mains
20..150 515 0.0497 00100 0.0397 0.3970 20 24.43 17.52 23.8 78 86 Horizontal Raise Connector of Exhaust Mains
(
t'4
0
0
"'-

(
Calculation of Airway Resistances During Caretaker Phase Prior to Postclosure (Going to postclosure natural vent at I mA3/s per drift split)
F e_ Iad01-05-10-va xls; Folder - Replad01N: VNETPC INPUT, Design Feature DevelO ment, Case 1 m^3/ er e - lacement drif. pared by RSJurani & A Linden) LE B TANCE REGULATOR RESISTANCE AIRWAY FRICTION X-SECT PERIMETER ACTUAL ACTUAL EQUIV. NOTES FOR BRANCH DESCRIPTION
No VNEPCIn inPU frmin PU RESISTANCE in PU RESISTANCE FACTOR AREA P LENGTH LENGTH LENGTH VNETPC Input in Pu from R R= K (x10^O10) A (Fl) meter L L=L'+10%
RPUa*RPUb Field Installed RPUa = R/10 KLP/(52A^3) Ib- (Ft^2) (33) (m) (Ft) (Ft)
RPUb In.min^2IfV^6 mln^2/t^A4 (3.23)
(3.5) (3.3)
260 0 37 20 4. 1 23.8 78 8 Horizontal Raise Connector of Exhaust Mains
202 30 30 9000038 9900.000 .038 0.870 20 24.43 17.52 23.28 7 84 HorIzontalRieCnctroExasMis 2 0 , 5 2 2 6 2 0 .0 4 9 7 0 .0 1 0 0 0 .0 3 9 7 0 ,3 9 7 0
202 56 66 190.0394 9900.0000 0.0394 0.3938274.3 175 23.6 77 85 Horizontal Raise Connector of Exhaust Mains
20623.- 7- 85 Horizontal Raise Connector of Exhaust Mains
29 60 0 99000.0380 99000,0000 0.0380 0.3800 20 24.43 17.52 00 7 0t
202 5 6 0.00 0000 0.0385 20 24.43 17.52 .0 76 83 Horizontal Raise Connector of Exhaust Mains 0- -- 73- 90 0.9 0-3 0.80 0539 0.96 3•i -9'O-- oiona aieConcoro Ehut an
20 6 7 009 00 0..00 393 20 24.43 17.52 03.0 0 0 D Horizontal Raise Connector of Exhaust Mains
228 50 7608 0004 0 11000 020000"0.0000- 0 244 3 717.52 0 70 0 5 Horizontal Raise Connector of Exhaust Mains
205 545 64 0.1394 0.1000 0.0394 0,3936ExasMin 2365120 7 12099000 0000 ,0000 0.000 0.020 23 12 70 0 Horizontal Raise Connest Exhaust Main
--2 3 14 0780 0.175 7 21.30 23..7 765 7 281356 PHorizontal Raise Con st 206 55 65 0.0494 0 10 0.0394 0.03932 236rctro6Ehut
an
2-3 14 103 00007 0.0394 0.3936 7 2475 81 89 Porth Ram4Side 2ndneE
239 1 24 0.009400 0.0309 0 3970 20 24.43 0 3," -". 70.0 80 0 Srfac Raise Connector of Exhaust Mains
240 236
240 0000 000 0'- 80 0 a Horizontal Raise Connector of Exhaust Mains 1- 10 0 9 10 0 00 . 3 7 0.39 36 20 24.4317 5778
209 5 6 6 6 - -ý--0.051 0,0 00 0.0 342 0.3936 20 24.4 3 .5 2 3.6 7 78 8 5 Ho rizontal R aise C onnector of Exhaust M ains
-10 56 24------ 10034--000"- - -- 8"5--E Horizontal Raise Connector of Ehaust fMains
4 __ 6 10.03972 10.10000 0.0397 0.3970 20 2.3 1.2 2.
25 .42 .00 O012 05482 2"8-0 24.43 1.2 24.7 811 89 Horizontal Raise Connector of Exhaust Mains
16 59 0.61 0,10 0.0412 0.4120 • 4-'P-" • orizontal Raise Connector of Exhaust Mains
2`1 59 6 95 0005000 - -a00000 1.00 0000 175 24.7--- 81 89 s OW stE hutM i
21 1 03 F 90 00.000 1 90.00400010000200 041 0 Ho rionta Raise Cnetor ofstExhaust Mains
20 5I 990,00 9 0.10000 0.0412 0.4120 20 24.43 1752 2.7 81 089Rie W s xhutMi
215_510 7F 9005 0.1412 190.00 000 .000--• • • • o Raise Cnetor ofs Exhaust Mains
22 51 0 0- 10001 -0.1000 - 0.0412 0.41000 0 244 1752 2.7 81 89 H ri o Ra ietW stEhutM n
23 -F .00 0100 000 00 0,'"' 0 omRise to West Exhaust Main
2"-• - 0.000 05000 0.0000 0.0000 20 I 24.43 75 0.0---- as etEhutMi
2176 50 0 99000.0000 99000.0000 0.00 .00 -0-'-- omRietWstEhutMn
'2- -0. 000 .000.0000 0.0000 20I 24.43 75 0.0 ----- 0 DorRe rm Raise to West Exhaust Main
2- 503000 1000 000 000 0.0 0 o borRe rom Raise to West Exhaust Main
2_1_ 7___ 99000 0000 -990000 0.0000 000 •0• • •• Riet etEhutMi
510 0i 5 000 .05000 0.0000 0.0000 20 2.3 75 0.0 - 0-'- -0 Fo e from Raise to West EhutMi
219 - 710 9000.0000 9900 00 0.0000 0.0000 -2 0244 -17.o/R5frm2aset W s Exhaust Main
22 515 07000 99000 0.00000---0 2 4--72-'o o o 0 orRgfom Raise to West Exhaust Main
-32 -- 00- 000 0.0000 000 213. 22 722 99000.0000 99000-000000• •0 from Raise to West Exhaust Main
3.._ 733 0.100.n11100.000 0.00 20 244 175 0 0 0 Dor/e from Raise to West Exhaust Main
223 5 3 0,00 175 0. 0 0 Door/Regfrom Raise to West Exhaust Main
22 38__ -38 -i9O 0099000.0000 0.00 0.00 20 24.43 • Ra to West Exhaust Main
0.0000 20 24043 175 0. 0 o Dor/e fr P_.• o mt Raise
22 54 74 0.5000 0 .00.00 -
0 0
0 0 0
0 0 0 0 0 t�J
0 0
Cb
C
I'J
0
Cl
0
(mI
z" H

Calculation of Airway Resistances During Caretaker Phase Prior to Postclosure (Going to postclosure natural vent at I m^A3s per drift split)
Case 1m^• aceent drft. ( ata d b y RSJuran & A Linde..I.
FILE N RANCH RSTAe RU TOR INCE AiRA FrICTIoN X-SECT PERIMETER ACTUAL CTUAL EQUIV. NOTES FOR BRANCH DESCRIPTION Ln BRANCH R-RESISTANCE" REGULATOR REITAC IRW P ALA ENGTH LENGTH LENGTHI
in PU RESISTANCE in PU RESISTANCE FACTOR AREA No VNETPC Input in PU from R R= K (x10-O10) A (Ft) meter L' .=L'+10%
RPUa.RPUb Field Installed RPUa - R/10 KLP/(5.2A^3) Ib- (Ft32) (33) (m) (Ft) (Ft)
RPUb In.min^2tft^6 min^2/^4 (3.23
(3.5) (33
389.33
3 89 33 389.33 389.33 389.33 389.33
446.53 446.53 828 57
0
0 0 0 0 0-- -6
-- --0--6
100 2403---• 72.36 437.9
80.13 314.5 - 72.36 1864.8
72.36 26.1
72.36 66.6 72.36 66.6 72.36 26.1 80.13 305.6
80.13 506.7 10204 408.3
0 0.0 0 0.0 0 0.0 0 0.0 0 0.0 0 0.0 0 0ý0 0 0.0 0 0.0
788 1437 1032 6118
86 219 219
1003 1662 1340
0 0 0 0 0 0 0 0 o
240_
94 1103 1829 1474
0 0
0 0 0 0 0
0 0 ,'
Intake Shaft 9.9 mndia Shaf•-t Conecig'Drift 7.62 dia Connecting Drift
Shaft Connecting Drift 7,2 dia, total distance
W~est Exhaust Main to Connector Drift East Exhaust Main to Connector Drift
East Exhaust Main to Connector Drift
West Exhaust Main to Connector Drift
Connectin Access Drift, 1-4 dist + 5m alcove Connecting Access Drift, 1-4 diet + SM alcove Exhaust Shaft 9.9 m dia
Prima Fan Leakage Leakage Evase Surface Loop/Du mm
Surface Loop/Dummy Surface Loop/Dummy Surface Loop/Dummy Surface Loop/Dummy
o �, 0
�'J 0 - 0
o o � �,J �1
TO 25
1 33 145 245
26 26 27 27 281 28 29 30 31 29
33 20 34
241 242 243 244 245 246 247 248 249 250 251 252
253 254 255 256 257 258 259 260
(
TROM 24 25 25 25
760 660 680 780
28 27 28 29 30 31 30 32 33 32 34 35
2.0000 0 1000
0.5000
0.0010
100.0000
1000.0000 0.0015
00001 2.0009 0 1005 0 0040 0.5001 00001 0.00001 2 0001
10000050 -00----00 0.0008 0.0001
10 0000 1000,O0000
0 0015
0.0000 0 000000 0
0.0000 0.0000
"0.0001 0.0009 0.0005
0.0001 00001 0.0001 0.0001
0. 00001
00005 00008 0.0001 010000
"0.0000 0.0000 0.0000 0.0000 0.0000 0.0000 0.0000 0.0000
0.0007
0.0093 0,0049 0 0397
0.0048 0.0079 0+0013 0.0000 00000 0.0030 0.0000 00000 0.0000 0.0000 0.0000 0.0000
25 25 25 25 25 25 25 25 25 25
0 0 0 0 0 0 0 0
20_.•
CD
0
t'J z=,

Post Closure Open-Loop Natural Ventilation
BCADOOOOO-01717-0210-00002 REV 00ATTACHMENT III Page III- 13 of 111-29
VnetPC for Windows vl.0a C:\VNETWIN\REPLADO1.VNW
Model Information 06/02/99 10:59:20
REPOSITORY LA DESIGN FEATURE YUCCA MOUNTAIN PROJECT M&0/MK/RSJURANI DUAL EXHAUST @1.0 M3S/EMPL DRIFT
Avg. Fan Efficiency: 75.0 %k Number of Branches: 260 Cost of Power: 10.00 c/kWh Number of Junctions: 171 Reference Junction: 1 4S•w•A-I Number of Fans: 3 Units: British Q3.) Fixed Quantities: 1
Last Airflow Analysis Date: 05/08/99 Number of IteratI s: 3 Time: 12:52 AM Number of Errors: 0 Elapsed Time: 00:00:02 Modified Since: YES

Post Closure Open-Loop Natural Ventilation BCADOOOOO-01717-0210-00002 REV 00
ATTACHMENT III Page III- 14 of 111-29
VnetPC for Windows vl.Oa C:\VNETWIN\REPLADO1.VNW
'Branch. From To F Type No. Q Si i i 1
1 2 3 4 5 6 7 8 9
10 11 12 13 14 15 16 17 18 19 20 21 22 23 24 25 26 27 28 29 30 31 32 33 34 35 36 37 38 39 40 41 42 43 44 45 46 47 48 49 50 51 52 53 54
Branch inpu: 06/02/99 10:59:2%
Airflow Pressure Friction Resistance Drop Factor per Length
(kcfm) :(m.in.wgy(xlO^-10) (R/1000ft)1 2 3
1il 100 102 103 110 115 122 ill 601 701 605
17 18 19 18
4 5 6 7 8 9
10
23 22 21 16 14 13 15 13 12 11
4 20
100 600 700 200 201 202 203 210 215 222
230 233 238 24 , 253
256 260 1 0
2120[
2 3
1il
100 102 103
110 115 122 130
130 605 605
17 18 19 17 20
5 6 7 8 9
10 16 21 21 16 14 13 15 14 12 11
4 1 1
600 700
200 201 202 203 210 215 222 230 233 238 245 253 256 260 266
.120 2105
F
F
R R R R R R R R R R R R R R R R R R R R R R
SR R R R R R R R R R R R R R R R R R R R R R R R R R R R R R R R
R
Branch Resistance
(P.U.) i 0.00510 0.00010 0.00040 0.00390 0.00390 0.00030 0.00130 0.00090 0.00120 0.00140 0.00180 0.10010 0.00010 0.00080 0.00200
1000.00000 1000.00000
0.00300 0.00720 0.00030 0.00430 0.00010 0.00120 0.00100
15.00010 0.00010 0.00000 0.00040 0.00260 0.00200
1000.00000 1000.00000
0.00500 0.00000 0.00000 0.00000 0.00000 0.00200 0.00010 0.00140 0.00140 0.00150 0.00030 0.00130 0. 00090 0.00120 0.00140 0.00040 0.00090 0.00120 0.00140 0.00040 0.00080 0.00100 0.00600 0.00280 0.00050

Post Closure Open-Loop Natural VentilationBCADOOOOO-01717-0210-00002 REV 00
ATTACHMENT III Page III- 15 of 111-29
VnetPC for Windows vl.Oa C:.\VNETWIN\REPLADO1.VNW
Branch Innpu 06/02/99 10:59:22
Branch: From To F Type No. Q
S~i58 2103 59 295 60 292 61 280 62 275 63 130 64 133 65 138 66 145 67 153 68 156 69 160 70 6 71 1120 72 1105 73 1103 74 195 75 180 76 175 77 2 78 131 79 5 80 1102 81 179 82 131 83 132 84 131 85 155 86 179 87 1102 88 666 89 660 90 656 91 653 92 645 93 638 94 633 95 630 96 622 97 615 98 610 99 603
100 602 101 600 102 666 103 667 104 -675 105 680 106 695 107 6103 108 6105 109 6120 110 7 il1 766 112 760
1i 75
295 292 280 275 266 133 138 145 153 156 160 166
1120 1105 1103
195 180 175 166 131 155
1102 179 155 132 133 157 156 180
1103 660 656 653 645 638 633 630 622 615 610 603 602 601 601 667 675 680 695
6103 6105 6120
23 23
760 756 753 745
R R R R R R R R R R R R R R R R R R R R R R R R R R R R R R R R R R R R R R R R R R R R R R R R R R R R R R F R R
Branch Resistance
(P.U.) 0.00140 0.00050 0.00220 0.00080 0.00150 0.00040 0.00090 0.00120 0.00140 0.00040 0.00080 0.00100 0.00650 0.00260 0.00040 0.00130 0.00270 0.00080 0.00160 0. 03130 0.01190 0.03950 0.01800 0.01880 0.00610 0. 00090 0.52010 0.00090 0.00090 0. 00090 0.00080 0. 00060 0.00030 0.00110 0.00090 0.00070 0.00030 0.00110 0.00090 0.00070
0.00100 0.00020 0.00190
1000.00050 0.00020 0.00110 0.00060 0.00210 0.00100 0.00030 0.00210 0.00400
1000. 00100 0.00080 0.00060 0.00030 0.00i iO
Airflow Pressure Friction Resistance Drop Factor per Length
(kcfm) i(m.in.wg)':(xl0^-10): (R/1000ft)

Post Closure Open-Loop Natural Ventilation
BCADOOOOO-01717-0210-00002 REV 00
VnetPC for Windows vl.0a C:\VNETWIN\REPLAD01.VNW
Branch From To F Type No. Q
115 745 116 738 117 733 118 730 119 722 120 715 121 710 122 703 123 702 124 700 125 766 126 767 127 775 128 780 129 795 130 7103 131 7105 132 7120 133 8 134 202 135 203 136 210 137 215 138 222 139 230 140 233 141 238 142 245 143 253 144 256 145 260 146 266 147 275 148 280 149 292 150 281 151 281 152 295 153 2103 154 2105 155 2120 156 102 157 103 158 110 159 115 160 122 161 130 162 133 163 138 164 145 165 153 166 156 167 157 168 157 169 160 170 166 171 1 P
738 733 730 722 715 710 703 702 701 701 767 775 780 795
7103 7105 7120
22 22
402 403 410 415 422 430 433 438 445 453 456 460 466 475 281 281 467 480
495 4103 4105 4120
402 403 410 415 422 430 433 43S 445 4 53 157 456 467
4160
47
ATTACHMENT III Pap-e 1II- 16 of 111-29
Branch 06/02/99 10:59:27
R R R R R R R R R R R R R
R R R R R R R R R R R R R R R R R R R R R R R R R R R R R R R R R R R R R R
R R R
•irflow Pressure Friction Resistance Drop Factor per Length
(kcfm) (m.in.wg)i(xl0^-10) (R/1000ft)
Branch :1
Resistance (P.u.) 0.00090 0.00070 0.00030 0.00110 0.00090 0.00070 0.00100 0.00020 0.00170
1000.00060 0.00020 0.00110 0.00060 0.00210 0.00100 0.00030 0.00210 0.00400
1000.00100 0.03480 0.01520 0.03480 0.01650 0.03480 0.21460 0.21560 0.03760 0.16870 0.11970 0. 16720 0.01660 0.24040 0.24090 0.00990 0.02000 0.01690 0.00790 0.24100 0.01710 0.21610 0.23560 0.23480 0.21520 0.23480 0.21650 0.23480 0.51460 0.51560 0.23760 0.41870 0.38970 0.45980 0.20740 0.01600 0.31660 0. 54040 0.54090

Post Closure Open-Loop Natural Ventilation
BCADOOO0O-01717-0210-00002 REV 00
VnetPC for Windows vl.0a C: \VNETWIN\REPLADO1. VNW
Branch From To F Type No. Q Si
172 173 174 175 176 177 178 179 180 181 182 183 184 185 186 187 188 189 190 191 192 193 194 195 196 197 198 199 200 201 202 203 204 205 206 207 208 209 210 211 212 213 214 215 216 217 218 219 220 221 222
22' 22 22 22
2 2
180 195
1103 1105 1120
402 403 410 415 422 430 433 438 445 453 456 460 466 467 475 480 495
4103 4105 4120
502 503 510 515 522 530
533 538 545 553 556 560
566 567 575 580 595
5103 5105 5120
502 -503 510 515 522 530
3 53! 533
5 54' 6 55. 7 55
8 56()
480 495
4103 4105 4120
502 503 510 515 522 530 533 538 545 553 556 560 566 567 575 580 595
5103 5105 5120
602 603 610 615 622 630 633 638 645 653 656 660 666 667 675 680 695
6103 6105 6120
702 703 710 715 722
0 730 3 733 3 738 5 -745 3 753, 6 -756 0 60()
ATTACHMENT III Pane III- 17 of 111-29
Branch 06/02/99 i0:59:fl
R R R R R R R R R R R R R R R R R R R R R R R R R R R R R R R R R R R R R R R R R R R R R R F F
R
R R
R
•irflow Pressure Friction Resistance Drop Factor per Length
(kcfm) (m.in.wg) (xl0^-10) (R/100Oft)
0.50000 99000.00000
0.50000 1.00000
Branch .1 Resistance
(P.U.) 0.26780 0.54100 0.21710 0.51610 0.53560 0.02770 0.07020 0.02770 0.02770 0.02770 0.02770 0.07060 0.02800 0.02850 0.02890 0.07140 0.02890 0.02890 0.07090 0.02890 0.07140 0.02840 0.07140 0.02840 0.02840 0.04970 0.04970 0.04970 0.04970 0.04 970
99000.03870 99000.03850
0.04850 0.13940 0.04940 0.13940 1.03970 0.04940
10.03940 0.04940
10.03970 0.05120 0.14120 0.14120 0.05120
99000.00000 99000.00000 99000.00000 99000.00000
R 99000.00000 R 0.10000
R 0.10000 R 99000.00000

Post Closure Open-Loop Natural Ventilation ATTACHMENT III BCADOOOOO-01717-0210-00 00 2 REV 00 Page III- 18 of 111-29
VnetPC for Windows vl.Oa C:\VNETWIN\REPLADO1.VNW Branch Input
06/02/99 10:59:20
iBranch: From No. I
To F Q
•i229 230 231 232 233 234 235 236 237 238 239 240 241 242 243 244 245 246 247 248 249 250 251 252 253 254 255 256 257 258 259 260
Type Airflow Pressure Friction Resistance Drop Factor per Length
(kcfm) (m.in.wg) (xlo^-10)1 (R/1000ft)566 567 575 580 595
5103 5105 5120
3 104
1 4
24 25 25 25
760 660 680 780
26 27 28 29 30 31 30 32 33 32 34 35
766 767 775 780 795
7103 7105 7120
104 103
24 24 25
133 145 245
26 26 27 27 28 28 29 30 31 29 32 33 20 34 35 12
F
Q
R R R R R R R R R R R R R R R R R R R R R R R
SR R R
R R R R R R
Branch Resistance
(P.U.) 99000.00000
0.50000 99000.00000
10.00000 99000.00000
10.00000 0.10000
99000.00000 0.01780 0.00670 0.00000 0.00000 0.00010 2.00090 0.10050 0.00400 0.50010 0.00010 0.00010 2.00010 0.00050 0.00080 0.00010 0.00100
1000.00000 1000.00000
0.00150 0. 00000 0.00000 0.00000 0.00000 0. 00000

Post Closure Open-Loop Natural Ventilation BCADOOOOO-01717-0210-00002 REV 00
ATTACHMENT III Page III- 19 of 111-29
VnetPC for Windows vl.Oa C:\VNETWIN\REPLAD01.VNW
Branch Results 06/02/99 10:59:20
I Branch! No.
1 2 3 4 5 6 7 8 9
10 11 12 13 14 15 16 17 18 19 20 21 22 23 24 25 26 27 28 29 30 31 32 33 34 35 36 37 38 39 40 41 42 43 44 45 46 47 48 49 50
51 52 53 54 55 56
From
1 2 3
ill 100 102 103 110 115 122 i1 601 701 605
17 18 19 18
4 5 6 7 8 9
10 23 22 21 16 14 13 15 13 12 11
4 20
100 600 700
200 201 202 203 210 215 ý22 230 233 238 245 253 256 260
10 2120 2105
To
2 3
ill 100 102 103 110 115 122 130 130 605 605
17 18 19 17 20
5 6 7 8 9
10 16 21 21 16 14 13 15 14 12 11
4 1 1
600 700 200 201 202 203 210 215 222 230 233 238 245 253 256 260 266
2120 2105 2103
F Total I
R Resistance B (P.U.)
0.00510 0.00010 0.00040 0.00390 0.00390 0.00030 0.00130 0.00090 0.00120 0.00140 0.00180 0.10010 0.00010 0.00080
F 0.00200 1000.00000 1000.00000
0.00300 0.00720 0.00030 0.00430 0.00010 0.00120 0.00100
15.00010 0.00010 0.00000 0.00040 0.00260
F 0.00200 1000.00000 1000.00000
0.00500 0.00000 0.00000 0.00000 0.00000 0.00200 0.00010 0.00140 0.00140 0.00150 0.00030 0.00130 0.00090 0.00120 0.00140 0.00040 0.00090 0.00120 0.00140 0.00040 0.00080 0.00100 0.00600 0.00280 0.00050
Airflow
(kcfm) i 537.94 464.64 382.94 164.69 -8.79
-43.48 6.29
-28.91 -63.08 -98.92 218.24 161.18 420.21 581.39 583.18
1.80 1.80
581.39 444.01 365.93 205.60 204.00 202.39 202.39
13.19 393.95 165.99 559.94 573.12 574.97
1.85 1.85
573.12 534.82 534.82 534.82
1245.61 173.49 172.56 170.71 170.71 170.71 118.83 77.60 26.86
-28.20 -80.41
-143.01 -199.22 -261.83
324 .84 267.51 217.39 172.20 189.21 131.47
66. 07
Pressure Drop
(m.in.wg) ] 1475.8
21.6 58.7
105.8 -0.3 -0.6 0.1
-0.8 -4.8
"-13.7 85.7
2600.5 17.7
270.4 680.2
3230.0 3230.0 1014.0 1419.4
40.2 181.8
4.2 49.2 41.0
2608.1 15.5
0.0 125.4 854.0 661.2
3420.1 3420.1 1642.3
0.0 0.0 0.0 0.0
60.2 3.0
40.8 40.8 43.7
4.2 7.8 0.7
-1.0 -9.1 -8.2
-35.7 -82.3 147.7
28.6 37.8 29.7
214.8 48.4
2.2
Air Power Loss (hp) 125.10
1.58 3.54 2.75 0.00 0.00 0.00 0.00 0.05 0.21 2.95
66.05 1.17
24 .77 62. 51 0.92 0.92
92.90 99.31 2.32 5.89 0.14 1.57 1.31 5.42 0.96 0.00
11.06 77.12 59.91
1.00 1.00
148.32 0.00 0.00 0.00 0.00 1.65 0.08 1. 10 1.10 1.18 0.08 0.10 0.00 0.00 0.12 0.18 1.12 3.40 7.56 1.21 1.29 0.81 6.40 1.00 0. 02
Operating Cost ($/yr)
109000 1378 3086 2392
0 0 0 0
42 186
2568 57549
1021 21584 54464
798 798
80942 86529
2020 5132
118 1367 1139 4723
838 0
9641 67200 52197
869 869
129230 0 0 0 0
1434 71
956 956
1024 69 83
0 0
100 161 976
2959 6587 1050 1128
702 5580
874 20

Post Closure Open-Loop Natural Ventilation
BCADOOOOO-01717-0210-00002 REV 00
ATTACHMENT III Page III- 20 of 111-29
VnetPC for Windows vl.Oa C:\VNETWIN\REPLADO1.VNW
Branch Resu 06/02/99 10:59
Branch! From To F No. R
B58 59 60 61 62 63 64 65 66 67 68 69 70 71 72 73 74 75 76 77 78 79 80 81 82 83 84 85 86 8788 89 90 91 92 93 94 95 96 97 98 99
100 101 102 103 104 105 106 107 108 109 110
112
113 11 .1
2103 295 292 280 275 130 133 138 145 153 156 160
6 1120 1105 1103
195 180 175
2 131
5 1102
179 131 132 131 155 179
1102666 660 656 653 645 638 633 630 622 615 610 603 602 600 666 667 675 680
695 6103 6105 6120
7
766 760 756 75-
295 292 280 275 266 133 138 145 153 156 160 166
1120 1105 1103
195 180 175 166 131 155
1102 179 155 132 133 157 156 180
1103 660 656 653 645 638 633 630 622 615 610 603 602 601 601 667 675 680 695
6103 6105 6120
23 23
760 756 753 7'45
Total Resistance
(P.U.) i
0.00140 0.00050 0.00220 0.00080 0.00150 0.00040 0.00090 0.00120 0.00140 0.00040 0.00080 0.00100 0.00650 0.00260 0.00040 0.00130 0.00270 0.00080 0.00160 0.03130 0.01190 0.03950 0.01800 0.01880 0.00610 0.00090 0.52010 0.00090 0.00090 0.000900.00080 0.00060 0.00030 0.00110 0.00090 0.00070 0.00030 0.00110 0.00090 0.00070 0.00100 0.00020 0.00190
1000.00050 0.00020 0.00110 0.00060 0.00210 0.00100 0.00030 0.00210 0.00400
1000.00100 0.00080 0.00060 0.00030 0.00110
Airflow Operating Cost ($/vr)
Print ted: 0 /02/9,, ) 1 : 45:45
(kcfm) 19.91
-31.86 -43.79 -70.50
-121.48 74.11 62.27 26.20
112.54 73.38 74.25 43.35
160.33 114.82
65.34 76.38 33.90 39.47 -2.27 73.30 44.39 78.08 25.48
-15.18 1.41 1.41
27.51 29.21 40.66 52.59
-82.98 -537.54 -499.08 -402.71 -360.32 -261.77 -261.84 -261.91 -174.01
-84.93 0.85
73.85 160.26
0.92 174.68 184.10 276.70
91.38 185.53 261.06 289.20 392.35
1.60 25.53
108.27 156.82 156.94
Pressure Drop
(m.in.wg) 0.6
-0.5 -4.2 -4.0
-22.1 2.2 3.5 0.8
17.7 2.2 4.4 1.9
167.1 34.3
1.7 7.6 3.1 1.2 0.0
168.2 23.4
240.8 11.7 -4.3
0.0 0.0
393.5 0.8 1.5 2.5
-5.5 -173.4
-74.7 -178.4 -116.8
-48.0 -20.6 -75.5 -27.3
-5.1 0.0 1.1
48.8 852.9
6.1 37.3 45.9 17.5 34 .4 20.4
175. 6 615.7
2561.8 0.5 7.0 7.4
27. !
Air Power Loss (hp)
0.00 0.00 0.03 0.04 0.42 0,03 0.03 0.00 0.31 0.03 0.05 0.01 4.22 0.62 0.02 0.09 0.02 0.01 0.00 1.94 0.16 2.96 0.05 0.01 0.00 0.00 1.71 0.00 0.01 0.02 0.07
14.69 5.87
11.32 6.63 1.98 0.85 3.12 0.75 0.07 0.00 0.01 1.23 0.12 0. 17 1.08 2.00 0.25 1.01 0.84 8.00
3S .07 0. 65 0.00 0.12 0.18
0.67
0
0 25 39
369 22 30 0
273 22 45
0 3678
541 0
80 14 0 0
1693 143
2581 41
9 0 0
1486 0 0
18 63
12798 5119 9864 5778 1725
741 2715
652 59 0 0
1074 108 146 943
1744 220 876 731
6973 33167
563 0
104 159 584
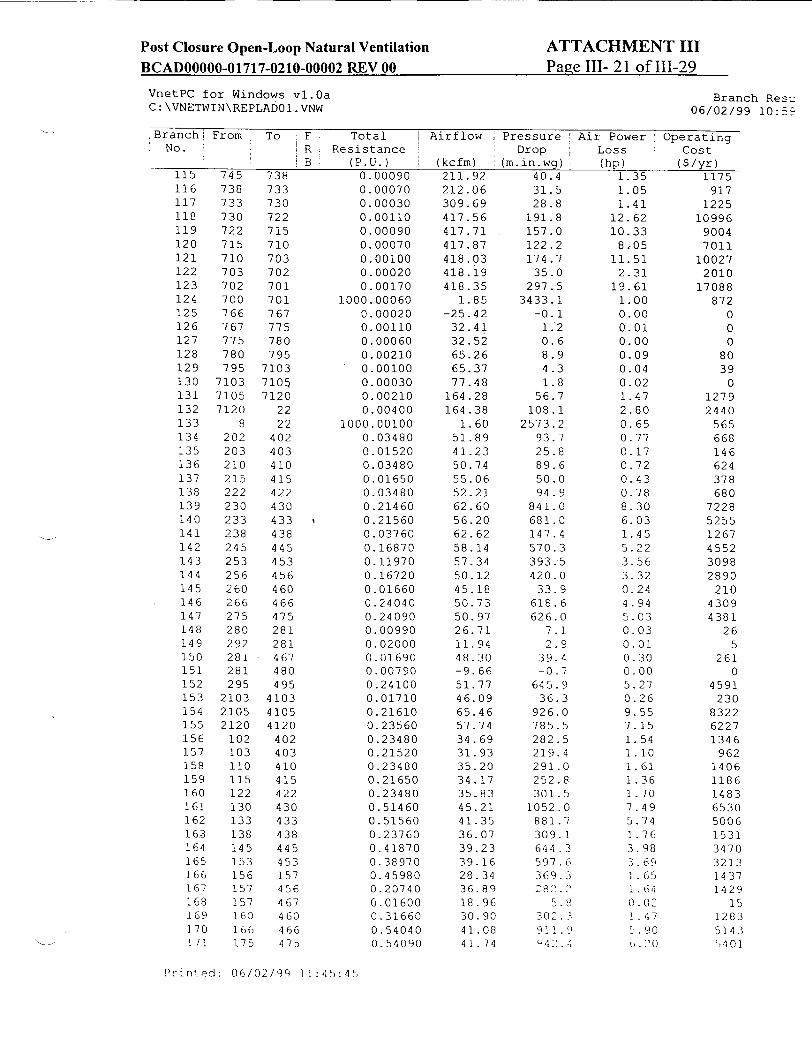
Post Closure Open-Loop Natural Ventilation BCADOOOOO-01717-0210-00002 REV 00
ATTACHMENT III Pane III- 21 of 111-29
VnetPC for Windows vl.Oa C:\VNETWIN\REPLADO1.VNW
Branch Res06/02/99 10:58
-Branch From No.
115 116 117 118 119 120 121 122 123 124 125 126 127 128 129 130 131 132133 134 135 136 137 138 139 140 141 142 143 144 145 146 147 148 149 150 151 152 153 154 155 156 157 158 159 160 161 162 163 164 165 166 167 168 16q I70 171
745 738 733 730 722 715 710 703 702 700 766 767 775 780 795
7103 7105 7120
8 202 203 210 215 222 230 233 238 245 253 256 260 266 275 280 292 281 281 295
2103 2105 2120
102 103 110 115 122 130 133 138 145 153 156 157 157 160 16 6 175
To F RB B
738 733 730 722 715 710 703 702 701 701 767 775 780
795 7103 7101 7120
2222
402 403 410 415 422 430 433 438 445 453 456 460 466 475 281 281 467 480 495
4103 4105 4120
402 403 410 415 422 430 433 438 445 453 157 456 467 460 466 475
rin: ed: 06/02/99 !1:45:, 1
Total I Resistance
(P.U.) 0.00090 0.00070 0.00030 0.00110 0.00090 0.00070 0.00100 0.00020 0.00170
1000.00060 0.00020 0.00110 0.00060 0.00210 0.00100 0.00030 0.00210 0.00400
1000.00100 0.03480 0.01520 0.03480 0.01650 0.03480 0.21460 0.21560 0.03760 0.16870 0.11970 0.16720 0.01660 0.24040 0.24090 0.00990 0.02000 0.01690 0.00790 0.24100 0.01710 0.21610 0.23560 0.23480 0.21520 0.23480 0.21650 0.23480 0.51460 0.51560 0.23760 0.41870 0.38970 0.45980 0.20740 0.01600 0.31660 0.54040 0.54090
Airflow
(kcfm) 211.92 212.06 309.69 417.56 417.71 417.87 418.03 418.19 418.35
1.85 -25.42
32.41 32.52 65.26 65.37 77.48
164.28 164.38
1.60 51.89 41.23 50.74 55.06 52.21 62.60 56.20 62.62 58.14 57.34 50.12 45.18 50.73 50.97 26.71 11.94 48.30 -9.66 51.77 46.09 65.46 57.74 34.69 31.93 35.20 34 .17 35.83 45.21 41.35 36.07 39.23 39.16 28.34 36.89 18.96 30.90 41.08 41.74
Pressure Drop
(m.in.wg) 40.4 31.5 28.8
191.8 157.0 122.2 174.7
35.0 297.5
3433.1 -0.1
1.2 0.6 8.9 4.3 1.8
56.7 108.1
2573.2 93.7 25.8 89.6 50.0 94. 9
841.0 681.0 147.4 570.3 393.5 420.0
33.9 618.6 626.0
7.1 2.9
39.4 -0.7
645.9 36.3
926.0 785.5 282.5 219.4 291.0 252.8 301.5
1052.0 881.7 309.1 644.3 597 . 6 369.3 282.'2
302.
"-42.4
Air Power Loss (hp)
1.35 1.05 1.41
12.62 10.33 8 w05
11.51 2.31
19.61 1.00 0.00
0.01 0.00 0.09 0.04
0.02 1 .47 2.80 0. 65 0.77 0. 17 0.-72 0.43 0.'78 8.30 6.03 1. 45 5.22 3.56 3. 32
0.24 4 . 94 5.03 0.03 0.01 0. 30 0.00 5.2-7 0.26
9.55 7.15 1. 54 1. 10 1 .61 1.36 1.70 -7.49 5.74 1.76 3.98
o Ol(1 060o
1.47
00
0.60 901
6.03
Operating Cost ($/yr)
1175 917
1225 10996 9004 7011
10027 2010
17088 872
0 0 0
80 39
0 1279 2440
565 668 146 624 378 680
7228 5255 1267 4552 3098 2890
210 4309 4381
26 5
261 0
4591 230
8322 6227 1346
962 1406 1186 1483 6530 5006 1531 3470 3213 1437 1429
15 1283 5143 5401

Post Closure Open-Loop Natural Ventilation BCADOOOOO-01717-0210-00002 REV 00
VnetPC for Windows vl.Oa C:\VNETWIN\REPLADO1.VNW
Branch! From To F No. j R
B172 173 174 175 176 177 178 179 180 181 182 183 184 185 186 187 188 189 190 191 192 193 194 195 196 197 198 199 200 201 202 203 204 205 206 207 208 209 210 211 212 213 214 215 216 217 218 219 22a 221 222 223 224 225 226 227 228
180 195
1103 1105 1120
402 403 410 415 422 430 433 438 445 453 456 460 466 467 475 480 495
4103 4105 4120
502 503 510 515 522 530 533 538 545 553 556 56O0 566 567 575 580 595
5103 5105 5120
502 503 510 515 522 530 533 538 545 553 556 560
480 495
4103 4105 4120
502 503 510 515 522 530 533 538 545 553 556. 560 566 567 575 580 595
5103 5105 5120
602 603 610 615 622 630 633 638 645 653 656 660 666 667 675 680 695
6103 6105 6120
702 703 710 715 722 730 733 738 745 753 756 760
Total Resistance
(P.U.) 0.26780 0.54100 0.21710 0.51610 0.53560 0.02770 0.07020 0.02770 0.02770 0.02770 0.02770 0.07060 0.02800 0.02850 0.02890 0.07140 0.02890 0.02890 0.07090 0.02890 0.07140 0.02840 0.07140 0.02840 0.02840 0.04970 0.04970 0.04970 0.04970 0.04970
99000.03870 99000.03850
0.04850 0.13940 0.04940 0.13940 1.03970 0.04940
10.03940 0.04940
10.03970 0.05120 0.14120 0.14120 0.05120
99000.00000 99000.00000 99000.00000 99000.00000 99000.00000
0.10000 0.10000
99000.00000 0.50000
99000.00000 0.50000 1.00000
Airflow Pressure Air Power
Printed: 06/021qq 11:4':45
ATTACHMENT III Page III- 22 of 111-29
(kcfm) 35.09 42.48 41.54 49.49 45.51 86.57 73.16 85.94 89.23 88.05
107.81 97.55 98.68 97.37 96.49 87.01 76.08 91.81 67.26 92.71 25.44 94.25 87 . 64
114.95 103.25
86.41 73.00 85.78 89.08 87.90 -0.06 -0.07 98.55 42.40 96. 37 38.45 32.55 91.70
9.42 92.61 11.33 94.15 75.53 28.14
103.15 0.17 0.16 0.16 0.16 0.15
107.88 97.63 0.14
54 .98
0.12 48.56 43.53
Drop (m. in.wg)
329.8 976.4 374.7
1263.9 1109.3
207.6 375.7 204.6 220.6 214.7 322.0 671.9 272.7 270.2 269.1 540.5 167.3 243.6 320.7 248.4
46.2 252.3 548.4 375.2 302.8 371.1 264.8 365.7 394 .4 384.0
-384.8 -546.0
471.0 250.6 458.8 206.1
1101.6 415.4 891.5 423.6
1289.5 453.8 805.5 111.8 544 .7
2708.7 2565.1 2494.0 2394.7 2199.6 1163.7
953.1 1890.0 1511.2 1513.9 1178.8 1895.0
Loss (hp)
1.82 6.54 2.45 9.86 7.96 2.83 4.33 2.77 3.10 2.98 5.47
10.33 4.24 4.15 4.09 7.41 2.01 3.52 3.40 3.63 0.19 3.75 7 . 57 6.80 4.93 5.05 3.05 4.94 5.54 5.32 0.00 0.01 7.31 1.67 6.97 1.25 5.65 6.00 1.32 6.18 2.30 6.73 9.59 0.50 8.85 0.07 0.06 0.06 0.06 0.05
19.78 14.66 0.04
13.09
0.03
13-.00
Branch Resu06/02/99 10:59:
Operating Cost ($/yr)
1589 5695 2137 8588 6931 2468 3774 2414 2703 2596 4766 8999 3695 3612 3565 6457 1748 3071 2962 3162
161 3265 6599 5922 4293 4403 2654 4307 4824 4634
3 5
6373 1459 6071 1088 4923 5230 1153 5386 2006 5866 8353
432 7714
63 56 55 53 45
17236 12776
36 11408
25 7859
11326
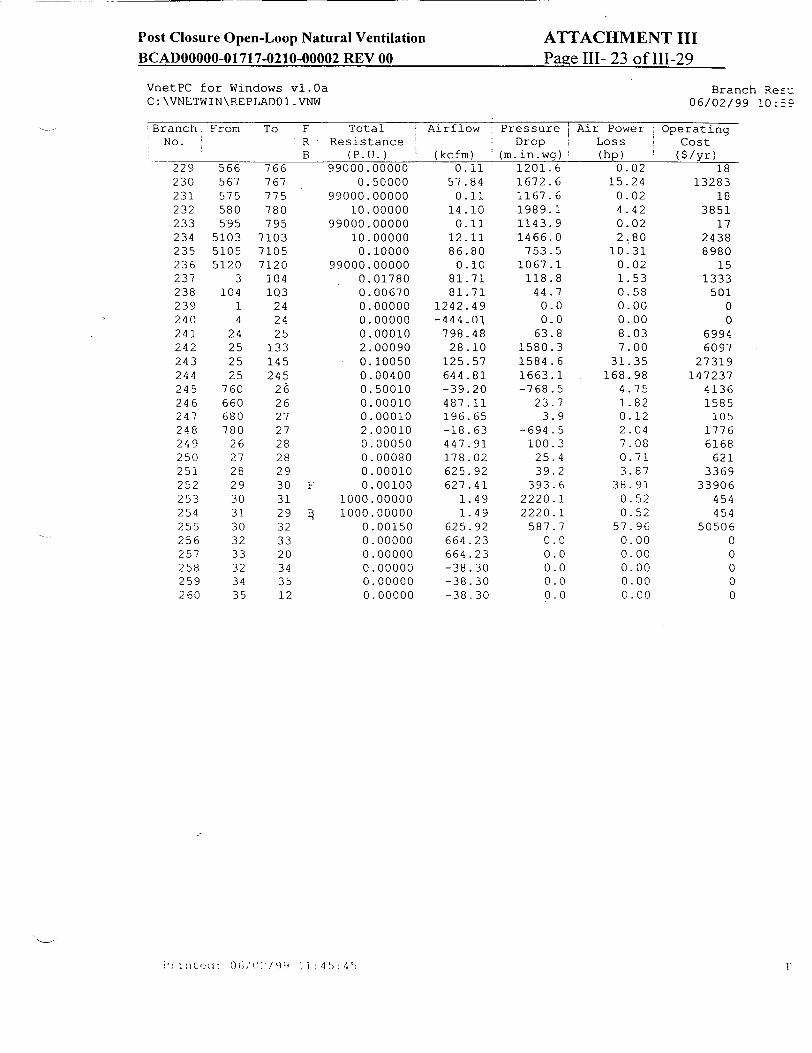
Post Closure Open-Loop Natural Ventilation BCADOOOOO-01717-0210-00002 REV 00
ATTACHMENT III Page III- 23 of 111-29
VnetPC for Windows vl.Oa C:\VNETWIN\REPLADO1.VNW
Branch Resu 06/02/99 10:59
Branch From No.
229 230 231 232 233 234 235 236 237 238 239 240 241 242 243 244 245 246 247 248 249 250 251 252 253 254 255 256 257 258 259 260
566 567 575 580 595
5103 5105 5120
3 104
1 4
24 25 25 25
760 660 680 780
26 27 28 29 30 31 30 32 33 32 34 35
To
766 767 775 780 795
7103 7105 7120
104 103
24 24 25
133 145 245 26 26 27 27 28 28 29 30 31 29 32 33 20 34 35 12
F Total R Resistance B (P.U.)
99000.00000 0.50000
99000.00000 10.00000
99000.00000 10.00000
0.10000 99000.00000
0.01780 0.00670 0.00000 0.00000 0.00010 2.00090 0.10050 0.00400 0.50010 0.00010 0.00010 2.00010 0.00050 0.00080 0.00010
F 0.00100 1000.00000 1000.00000
0.00150 0.00000 0.00000 0.00000 0.00000 0.00000
;1, :11 . (1: 0 .'/ " 1,/9C1 11i:45:4
Airflow
(kcfm) 0.11
57.84 0.11
14.10 0.11
12.11 86.80 0.10
81.71 81.71
1242.49 -444.01
798.48 28.10
125.57 644.81 -39.20 487.11 196.65 -18.63 447.91 178.02 625.92 627.41
1.49 1.49
625.92 664.23 664 .23 -38.30 -38.30 -38.30
Pressure Drop
(m.in.wg) 1201.6 1672.6 1167.6 1989.1 1143.9 1466.0 753.5
1067.1 118.8
44.7 0.0 0.0
63.8 1580.3 1584.6 1663.1 -768.5
23.7 3.9
-694.5 100.3
25.4 39.2
393.6 2220.1 2220.1
587.7 0.0 0.0 0.0 0.0 0.0
Air Power Loss (hp)
0.02 15.24 0.02 4.42 0.02 2.80
10.31 0.02 1.53 0.58 0.00 0.00 8.03 7.00
31.35 168.98
4.75 1.82 0.12 2.04 7 .08 0.71 3.87
38.91 0.52 0.52
57 . 96 0.00 0.00 0.00 0.00 0.00
Operating Cost ($/yr)
18 13283
18 3851
17 2438 8980
15 1333
501 0 0
6994 6097
27319 147237
4136 1585
105 1776 6168
621 3369
33906 454 454
50506 0 0 0 0 0
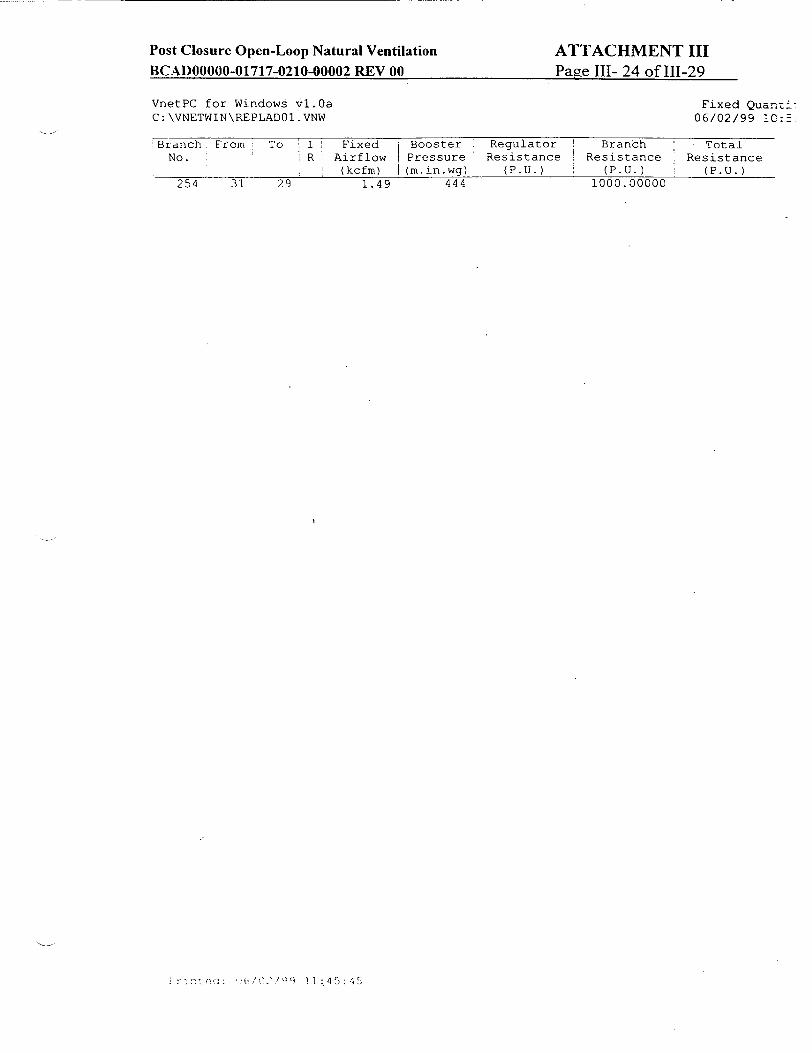
Post Closure Open-Loop Natural Ventilation BCADOOOOO-01717-0210-00002 REV 00
ATTACHMENT III Page III- 24 of 111-29
VnetPC for Windows vl.Oa C:\VNETWIN\REPLADO1.VNW
Fixed Quanzi. 06/02/99 !0:5:
;Branch. From To I Fixed Booster Regulator Branch Total No. I R Airflow Pressure Resistance Resistance Resistance
(kcfm) I (m.in.wg) (P.U.) (P.U.) (P.U.) 254 31 29 1.49 444 1000.00000
nr- ,elt ): t) /0,:'" ..Q ., 5:-

Post Closure Open-Loop Natural Ventilation BCADOOOOO-01717-0210-00002 REV 00
ATTACHMENT III Page III- 25 of 111-29
VnetPC for Windows vl.0a C:\VNETWIN\REPLAD01.VNW
Fan Iny 06/02/99 10:59:
Fan No.: 1 From: 17 To: 18 Pressure: 6.000 in.w.g. Description: First Empl Shaft Fan
Fan Name: VNETPC 3.1 #19 Fan Setting: Set 25 deg Comments: JOY-M132-79-710 BLADE SET 25 DEG Points: 10 Quantity Pressure Description
50.00 18.000 Stalling 130.00 15.000 Stalling 200.00 12.600 Stalling 270.00 11.400 Stalling 325.00 12.600 Stalling 380.00 13.400 Max normal operation 440.00 12.400 Normal operation 500.00 10.800 Normal operation 600.00 6.400 Normal operation 660.00 2.000 Normal operation
Fan No.: From: 14 To: 13
2
Pressure: 6.000 in.w.g. Description: Former Dev Shaft Fan
Fan Name: VNETPC 3.1 #19 Fan Setting: Set 25 deg Comments: JOY-M132-79-710 BLADE SET 25 DEG Points: 10 Quantity Pressure DesC
50.00 18.000 Stalling 130.00 15.000 Stalling 200.00 12.600 Stalling 270.00 11.400 Stalling 325.00 12.600 Stalling 380.00 13.400 Max normal operation 440.00 12.400 Normal operation 500.00 10.800 Normal operation 600.00 6.400 Normal operation 660.00 2.000 Normal operation
7ription
Printed: 06/02/99 11:45:45

Post Closure Open-Loop Natural Ventilation
BCADOOO0O-01717-0210-00002 REV 00ATTACHMENT III Page 1II- 26 of 111-29
VnetPC for Windows vl.0a C:\VNETWIN\REPLAD01.VNW
Fan In 06/02/99 10:59
Fan No. : 3 From: 29 To: 30 Pressure: 6.000 in.w.g.
-Description: Mid Empi Shaft Fan
Fan Name: VNETPC 3.1 #19 Fan Setting: Set 25 deg Comments: JOY-M132-79-710 BLADE SET 25 DEG Points: 10 Quantity Pressure D
50.00 18.000 Stalling 130.00 15.000 Stalling 200.00 12.600 Stalling 270.00 11.400 Stalling 325.00 12.600 Stalling 380.00 13.400 Max normal operation 440.00 12.400 Normal operation 500.00 10.800 Normal operation 600.00 6.400 Normal operation 660.00 2.000 Normal operation
escription
Printed: 06/02/99 11:45:45 P

Post Closure Open-Loop Natural Ventilation BCADOOOOO-01717-0210-00002 REV 00
ATTACHMENT III Page 1II- 27 of 111-29
VnetPC for Windows vl.Oa C:\VNETWIN\REPLADO1.VNW
Fan Res 06/02/99 10:c
To Fan Pressure (in.wg)
18 7.140 13 7.501 30 4.390
Fan Airflow
(kcfm) 583.18 574.97 627.41
Fan Air iCurve Power
(hp) On 656.13 On 679.60 On 434.02
Operating Cost ($/yr)
571699 592149 378166
Fan Descripftic:
First Empl Shaft Former Dev Shaft Mid Empl Shaft Far
Printed: (0/02/q. II :45:45
Fan From No.
1 2 3
17 14 29

oD
SoL
~ o -•
0
=1°
• m*
oto"£
c , go
E; 0
00
to-4
0.
-C
0 " L - - , - --. 6 2 7.5. 9 2- , 6 2 .
202.39 -189.2i- 1. 1b.4jU
6 5312 C
.7, 0.0 ~2j
1122 0 1"9 5/ 484 21 1 2 14 .180. t -28.21 6. i6 77.6cf 18.83 1i70.~
.,,, • "• i 573.12 " •
b 45.316 .28 77.4 6565.26 - -3-2.. . , . .. N/ �------3---- .j /. 0 .37
/ -f2 158,
>y-4''1 C '0 O v 471 4 _____X,_
C(
:" o1 .. .. •l ""Ps -61 ..
0.T , • ,,t,> 65.3' / v252/. !b2158 / _o6947 48 1 1 4835 18
0/ A•> 5-34 > - >03.0 , • 01 43 87 /.5 C-0<5
1.60 .8/ ..20 15694 9 3- -1,
06 Z9 7 0ýj ~ 7-z ;6 .1/
Q)/ :E/ci / o ".'4 7.8 • /548 -.
0•! 0 '8:-79
"",, <" f0.'~155< 9 38 1 67 184.10 17 68 g >•'• '0
392~~5< A, . .~ '49 , 0.o 7 '• o.•o738 6.2 09
C,>,
AjC, 0 IC
ý160.33 1 14.82 - 65.34 - 7.8 - 33.90 39. 2.27 C"35a / 338A4,262 4.1 9. 63.08 2891 6.29
78.08A 25.48 15.18 1.4 C
C? 3
.
t.~ 3r\ M CZ179
0 gK
CA CD
0~
C.
0
o1
C.)
e
0
0
0
0 0 0 0 kN�
00
00
0=H H
C.)
z H
I)

0,0
o o
la. 0 (' o 7- CD
0 co
0
-V Z M3C
to e
0
Z:,
39.2 \
"it I
17
4o
0
0 0 0 0 0
0 0
'N)
0
'N)
0
0 0
2
-I
0
H H
C.)
z H

Post Closure Open-Loop Natural Ventilation BCAD00000-0 1717-0210-00002 Rev 00
ATTACHMENT IV Page IV- I of IV-3
Attachment IV- Air and Rock Wall Temperatures Over 10,000 Years
Table IV-1. Tabulation of Estimated Air and Rock Wall Temperatures Over 10,000 Years Output from Figures IV-1 and IV-2 (With Ventilation)
Time after Air Wall Air @ Wall @ Air @ Wall @ Air @ Wall @ Emplm't @ 100 m @ 100 m 300 m 300 m 500 m 500 m 600 m 600 m (Years) (0C) (0C) (0C) (0C) (0C) (0C) (.C) (0C)
(1) 1 34.53 74.19 44.93 77.92 49.44 79.54 50.62 79.96 5 46.81 88.37 72.85 101.67 86.00 109.52 89.80 111.65 10 50.47 93.10 84.79 114.80 104.64 126.49 110.93 130.11
20 51.46 93.47 90.44 121.08 114.81 136.84 123.03 141.91 30 50.86 89.97 91.31 119.84 118.3 137.74 127.83 143.85 40 49.33 85.57 88.87 115.95 116.71 135.33 126.90 142.15 50 47.6 81.09 85.44 111.25 113.37 131.64 123.91 138.98 60 45.93 76.91 81.87 106.39 109.51 127.56 120.21 135.26 70 44.39 73.15 78.38 101.55 105.56 123.40 116.31 131.35 80 43.01 69.80 75.18 97.52 101.74 119.37 112.46 127.47 90 41.80 66.88 72.33 93.71 98.18 115.59 108.82 123.81 100 40.73 64.30 69.74 90.26 94.81 111.98 105.37 120.32 150 38.58 55.80 64.62 79.48 88.01 99.96 98.47 109.66
200 35.97 50.83 58.06 71.60 78.90 90.16 88.87 99.58 250 34.41 47.71 53.58 66.07 72.14 82.97 81.16 91.26
300 33.37 45.51 50.45 62.07 67.23 77.65 75.35 85.09
400 32 42 47 57 62 72 70 79 500 29 40 44 54 59 68 66 74 1000 28 ý5 38 47 51 59 57 65
1500 28 32 35 43 47 54 52 59
2000 27 30 33 40 44 51 49 55
3000 27 29 32 39 42 49 48 54 4000 27 28 31 38 42 48 47 53 5000 27 28 31 38 41 47 46 52
6000 26 28 30 37 40 46 45 51 7000 26 27 30 36 40 46 44 50
8000 26 27 30 36 39 46 44 50 10000 26 27 30 36 39 46 44 50
Note 1: Information for years I for years 400 through
through 300 is input from Assumption 3.20. Information 10,000 is the estimated output from Figures IV- 1 and IV-2.

(
Figure IV-1. Estimated Drift Wall Temp
250
200
150
E
E
100
50
01 10 100 1000
Years
*WaIl Temp @ 100m wWail Temp @300 mAWa!I Temp @500 m KWaIITemp @600 m x Drift Wall - No Vent OWP Skin - No Vent
cj°
-'0
oD 0 k)0
0
Z
,,om
I
>AJ10000

(
Figure IV-2. Estimated Air Temp
25 b, I~
X -.
A A A A x A K
A
M EI
�--- ,
I
__K-
A X
U
A K K A
AK A
Kt
M A1 -- m
I _____________ I +
10 100
t 0 t I t t
AA A A A AAX A
Ig
1000 10000
Years
Air Temp @ 100 m IAirTemp_@ 300 m AAir Temp_@ 500 ..m Air Temp @ 600 m X Drift Wall- No Vent *VPSkin-No Vent
200 1-
0
AI
0
---4
o o d 80
zI
o150
E
E I--
50
0 >
-C)
I
I
II
I II
I
1

Post Closure Open-Loop Natural Ventilation BCADOOOO0-01717-0210-00002 Rev 00
ATTACHMENT V Page V-I of V-1
Attachment V- Rock Wall and WP Side Temperatures Over 10,000 Years
Table V-1. Tabulation of Estimated Rock Wall and WP Side Temperatures Over 10,000 Years (With Ventilation)
Time after Ratio Wall @ Side @ Wall @ Side @ Wall@ Side @ Emplm't (3.15) 100 m 100 m 300 m 300 m 500 m 500 m (Years) (0C) (0C) (CC) (0C) (0C) (0C)
1 1.3918 74.19 103 77.92 108 79.54 111
5 1.1942 88.37 106 101.67 121 109.52 131
10 1.1288 93.10 105 114.80 130 126.49 143
20 1.0939 93.47 102 121.08 132 136.84 150
30 1.0761 89.97 97 119.84 129 137.74 148
40 1.0649 85.57 91 115.95 123 135.33 144
50 1.0656 81.09 86 111.25 119 131.64 140
60 1.0549 76.91 81 106.39 112 127.56 135
70 1.0500 73.15 77 101.55 107 123.40 130
80 1.0452 69.80 73 97.52 102 119.37 125
90 1.0457 66.88 70 93.71 98 115.59 121
100 1.0405 64.30 67 90.26 94 111.98 117
150 1.0357 55.80 58 79.48 82 99.96 104
200 1.0303 50.83 52 71.60 74 90.16 93
250 1.0245 47.71 49 66.07 68 82.97 85
300 1.0250 45.51 47 62.07 64 77.65 80
400 1.0256 42 43 57 58 72 74
500 1.0195 40 41 54 55 68 69
1000 1.0139 35 35 47 48 59 60
1500 1.0146 '32 32 43 44 54 55
2000 1.0076 30 30 40 40 51 51
3000 1.0079 29 29 39 39 49 49
4000 1.0078 28 28 38 38 48 48
5000 1.0078 28 28 38 38 47 47
6000 1.0078 28 28 37 37 46 46
7000 1.0078 27 27 36 36 46 46
8000 1 27 27 36 36 46 46
10000 1 27 27 36 36 46 46

rost •iosure upen-Loop iNatural ventilation
BCADOOOOO-01717-0210-00002 REV 00A I I AL-HIVILN I V I Page VI- 1 of VI- 1
Prediction of Moisture Content for Ventilation Air in Emplacement Drift @ Natural
Ventilation Airflow = 1.0 mA3/s. Open Loop Postclosure Ventilation at 60 mm/year
influx, assumed 100% being added to the airflow.Influx Rate of Water I Imrryear 601
kh'- ~ ~ 019262251 123 iftlyear= wi 00.19685! 0.196851 0.1968
i i after ! after 1 after
Len th of rift 600 m
). 6010i 601 2: 2.36221 I K
5i 0.196851
1 100m I 300m 500m I
j 60001 180001 300001
iof water influx through an i----- -- ',---
18'dia x 2000' drift (5.5M di x600mdrift)I I --- I---tMa =18 x 000 I ' I ! ; i
I ___________________________________ I I~a=1
Water Mass volume/year (ftW3 water/year).d 1 7086.614 i I 1181.11i 3543.31 1 5905.511
M throu hian 18 diax2000drift IM = Ma xlwi i . I I
Water Mass flowlyear (lb wateriyear) 442204.7"i 73700.81 221102! 3685041
through an 8 dia x 2000' drift I I I IMpy = Mvy x62.4 I
Water Mass flow in lb water/minute (Mpm) m 0.841333 I 0.140221 0.42067 0.701111
,throuhan 1dia x 2000' drift i I i
IMpm = ((Mpy/365)/24)160 '
Water Mass flow rains/minute I 1 5889.3321 981.555 2944.67 4907.781
throu h an 18' dia x 2000' drift
i jMm = MMpm x 7000
,Mass of Vent Air, Mva (lb/min). throuh 134m9682 134.968 i 134.968 134.968'
jEmplacement Drift at 1 0 cms (2119 cfm)
I density 1.5.7 ft^3/tb air, (2119/15.7) 1
iAdditional Water to Vent Air from Influx 1 43.63498 j 7.27251 21.8175 36.36251
Mwa = M9m/Mva. grains/lb air I iI i i.
POriinal Mass Water Content of "C" air i i I
I9rains/lb air,,@ 30% ave. relative humidity '1 52.263 1 52.263: 52.263 52.2631 .
Total Mass Water Content of "C" air I
1 grains/b ain= original +,influx water 95.89798 , 59.5355 i 74.0805 88.6255 _
water
60
I
! after i I

Post Closure Open Loop Natural Ventilation BCADOOOOO-01717-0210-00002 REV 00
ATTACHMENT VII Page VII- I of VII-5
Attachment VII
Predicted Psychrometric Properties of Ventilation Air in Repository Emplacement Side
Tabulated data for standard calculations of predicted psychrometric properties of ventilation air in emplacement drift. See Section 5.5.2 for additional explanation on development of psychrometric chart.
These are data estimated for locations 100, 300, 500 and 600 meters from the emplacement inlet air.
(
C Dry Bulb
Temp, Td
Lquhr. .
123 194 232 253 262 260 255 248 241 234 228
222 209 192 178 168 158
135 1726 120 118 117 115
113t
D E Dry Bulb Wet uibu
Te Temp
Td Tw Comvetd E1iomated firCol. C to 11t
, Coi.
508 78.430 898 91.730
1109 97410
1230 102
1278 101 420
126,9 101210 123,9 100,520
1202 99.640 S• 6730• 1163 80 1125: 97.790 1088 96.880
104 95,990 985 9160
889 91460
8 8F9 1-50
75 87.320
700 80 660 84180
570 808910 520 78980 490 77 780 480 77.370 47U 769760 460 7T6540 450 76 120 440 75.700
440 75700 440 0
Wet Bulb
25 8 33 2 36 3 38,0 38 6 38 5 38 1 37.6 37 1 36 6 36 0 356 34 5 33 0 31 8 30 7 29 8 29 0 27 2 26 1 25A4
25:2 25 0 24 7 24 5 24 3
24 3
24 3
G Bar.
pres. Ave. Pb
SAameptiet 3.4.
262
262 26.2
26 2
26,2
26.2 262 262
26,2
262 26.2
26 2
26.2 262
26 2 262
26 2 262 26-2 26 2 262 26 2 26 2 26 2 26 2 26 2 26 2 265,2
Sat APOr.
Pressr ±at Tud Ps
3 76545
2071337 44.30094
76 37940 74.22139
67.62021 6012865 52 ,98765
4664131 41.23399 3660023
2862524
1998649
1474444
11 60836 9 23982
7 74961
5 12655 4 02999
347407 3,30407 31J4127
2 98544
2 83631 2 69365 2 69365
2 69365
I Sat. Vapor
Pres at Tw P's
0.98292 1 50425 1 79143
1.95615 2.02174 2.00907
1,96793
1.91768
1 86459
1 81223
1.76276 - 1 71551
1.62180
1 49165 1 38760
1 30970 1 23800
1,18488
106601 1 00085 096210
094917 0 93639 0 92345
Formulas used to determine psychrometric properties of air (Hartman at al. 1997, page 15-16):
Sal Vapor Pressure (at Td). Ps = 0 18079' eA(((17
27'Td)-552 64)/(Td+395 14)). inches Hg
Sal Vapor Pressure (at Tw). p's = 0 18079" e^(((17
27Tw)"55 2
64)/(Tw+395 14)). inches Hg
Vapor Pressure Pv = P's-(Pb.P's)*(Td-Tw))/(2800-l 3-Tw). inches Hg
Relative Humidity R = (Pv/Ps)*100%
Vapor Pressure Pv
Calculated
Inch HsA
0.56527 0.56543 0.56556
0.56546 0,56575
0.56574 0.56522
056539
056543 0.56552
0.56564 0 56528 0 56540 0,56542
0.56544 0 56563 056540
056549
0,56526
0.56531
0 56542
0.56537 0.56547 0 56534 0 56537 0 56556
05655 0 .S5656-
K Relative Humdlty
R
C
15.01 2.73
1.28 0.86
0.74 0.76
0.84
0 94 1.07 1.21
1.37 1.54 1 98
2.83 3,83
4,87
6.12 7.30
11 03
14.03
16 28
" L M Specific Humidlty.
Moisture Moisture W (H20) , W*7000
Caldculated l CIltUlAted..
Ib dry •ir. Graelot/t lri
001372 96.009
0.01372 96.037
0.01372 96.061
001372 96.043
0.01373 96.092
0.01373 96.091
0.01371 96.002
001372 96.031
0.01372 96.038
0,01372 96.054
0.01372 96.073
0,01372 96.012
001372 96.033 001372 96.035
0.01372 96.039
001372 96.072
0.01372 96.032 001372 96.047
0.01372 96.007
001372 96.017
0.01372 96.036 001372 96.027
0.01372 96,045
0.01372 96.021
0.01372 96.027
001372 96.060. 0,01372 96.060
0.01372 96.060%
N .Specific, Volume
V
f~tý311b dry alr
17.164 19.240 20.360 21.001 21.265 21.208
21.047 20.851 20.644
20.441 20.248 20.066 19.699 19.191 18.782 19.474 18.191 17.979 17.502 17.237
1705
16,972 16.919 16.8666 16.813 16.813 16.813
0
'Calculated
0.05869 0.05196 0.04889 0.04728 0.04667 0.04679 0. 047 17 0.04765
004817 0.04868
0.04918 0.04967 0.05066
0,05210 0.05332 0,05427 005517 0.05586
005749 0.05843 0.05900 0.05920
0.05939
0.05979 005999 005999 005999
P
SHeat Cont h
Catlulated
Btuhlb air
44.846 62.212 71.579
76.937 79,073
78.660
77.320 75.686
73.959 72.256 70646 69.107 66.053
61.799 58.384 55.815
53.437 51.667
47,673
45.459 44.133
43.688 43.248 42,801 42.359
Specific Humidity, W = 0.622*(Pv/(Pb-Pv)), ib/lb dry air or Grains Specific Humidity, W*7000 = 0 622*(Pv/(Pb-Pv))*7000. grains water vapor/lb dry air
Specific Volume. v a 53.35*(460+Td)/l((Pb.Pv)*0.491*144), ft^3/lb
Specific Weight, w = (1,325/(460+Td))'(Pb-.378*Pv), lb/fta3 (not tabulated)
Enthalpy, h = 0.24rd+W"(1060+0 45*Td), Blu/lb dry air
(
Year Alter
Empl.
1
10 20 30 40
50 60 70 80 90
100 150 200 250
300 300 41000005Cg
M
2300 00
4000 .00
:000
,000 ,000
TO-0
800
B
Emplacement
Air Temp. from
Alachmfnt IV
(after 600r) "^.C
5062
8980 11093
12303 127 83
12690
123 91 120 21 11631 11246
10882 105 37
9847
8887 81 16
75 35 7000
6600 5700
5200 4900
4800
4700
46 00 4500
4400
44 00 4400
0 cI�
0 96
0
0 0
z
99
z

(
LM Specific Humidity
Moisture Moisture W (H20) W*7000 Calcutated; . Clculated
1Mnb dry aIr Grulrtb aire
0.00858 60.054 0.00858 60.44
0.00858 60.065
0.00859 60.097
0.00858 60,092
0.00858 60.055 0.00858 60.046
0.00858 60.077
0.00858 60.056
0.00858 60.060 000859 60.098
0.00857 60.007 0.00858 60.084
0.00858 60.051
0.00858 60.080
N SIpecific Volume,
.V,
Cain'tated
ftu3/tb dry air
16.180 16.825 17.017 17.070 17.038 16.957 16.866 16.779 16.698 16.625 16.562 16.505 116.393 16.25 5 16.173
Air DensityMoist Air
w Coteulated
0.06208 0.05957 0.05885 0.05866 0.05878 0.05907 0,05941 0.05974 0.06005 0.06032 0,06057 0.06079 0 *06123 0.06177 0.06210
P Enthalpy
Heat -Cont. h
Calcultaed
BtuA/b air
32.054
37.443 39053
39.228 38. 55 1 37. 790 37.,062 36.383 35,778 35,253 34.768 33,837 32.686 32.006
A
Yea
Empi.
20 30 40 50 60 70 80 90
¶ 00 150 200 250
30040
500
150000' 15000
3000 N4000
5000 6000 7D00 8000
l 0000
B
Emplacemeflt Air Temp. firm
Attachment IV
(after lO~m)
34 53 46 81 5047
51 46
5066 49 33 47 60 45 93 44 39 4301 41 80 40 73 30 58
34 41 33 37 3200 29 00 28 00_ 28 00 27 00 27 00 27 00
27 00
C Dry Bulb
Temp. Td
Eqely. af
Cot 8
*O F
94 2 1163 122.8 124.6 123.5 1208 117 7 114.7
1119 1094 107 2 1053
967 93 9 92 1 89 6 84 2 82 4 82 4
80 6 80 6 80 6 80 6
78 78 88 788
78 8
D Dry Bulb
Temp. Td
Cl-eevrti fir Col. C
^6C
34 5 46 8 50 5 51 5 50, 9 49 3 47 6 45 9 44 4 43 0 41.8 407 38 6 36 0 34 4 33 4 32 0 290 280 28 0 27 0 270 27 0 27 0
260 26 0 26 00
F Wget -Bu Ibt
Temp TW
Cenvirtled IreCof. E
AG C
185 21.9 22 8 23.1 22 9 22 5 22 1 21 7 21 3T 20.9 20,6 20 3 19 7 18 9 184 18.1 17 8 168 16 4
164 M16
161 16 1 15,8
~Tew
Col. M
6-5.23-0 71 410
-73.1-00 73.550 7-3.28-0 72.580 71. 7-80 71.000 70.260 679590 6900 6-8.4-50 67 370 66.000 65-17-0 ý6.4 00 6-3 9-50 62 15-0 61T 5-60 61. 560 60.980 60.980u
60 980 60,980 60,370
-- 603 70 60 370
6037
G Bar.
Pres, Ave.
Inch Mg
26 2 26 2 26 2 26 2 26.2 26 2 26 2 26 2 26 2 26 2 26 2 26 2 26 2 26 2 26 2 26 2 26 2 26 2 26 2
26 2
F7262 26 2 26 2
Formulas used to determine psychrrometric properties of air (Hartman at al. 1997, page 15.16):
Sal Vapor Pressure (at Td). Pa ' 0 18079- eu)))117
271Td)-552 64)/(Td.395.14)). inches Hg
Sal Vapor Pressure (at Tw). P's =0 18079' e^(((17 27-rw)-5
52
64)I(Tw-395 14)) rinches Hg
Vapor Pressure. Pc P's-(Pb-Ps)'(Td-Tw))/)2800
-1 3Tw). incher Hip
Relative Humidity. R=(Pv/Ps)*100%
Specific Humidity, W =0.622*(Pv/(Pb.Pv)), tb/tb dry air or Grains Specific Humidity, W'7000 =0 622*(Pv/(Pb.Pv))'7000, grains water vapor/tb dry air
Specific Volume. v 53.35'(460+Td)/((Pb-Pvi'0.491P144), ft'3/lb
Specific Weight. w (1.325/(460.Tdi))(Pb- 378'Pv). lb/ft^3 (not tabulated)
Enthalpy, h =0 24Td+W')1I060+0 451d), Btu/tb dry air
H
P3
Inch He
1,62150 3111114 3.73761 3 92463 381035 353180 323810 2 97478 2 74853 2 55855 240142 2.26948 2 02319 1.75558 1 61074 1 52005 1 40736 118564 1 11882 1 11882 1.05530 1,05530 1 05530
0 99495
'0 99495 09-9949'5
Pretat T". -Ps
0.62886 0.77755 082322 0.83576 0 82822 0 80892 0.787 36 0 76681 0 74776 0 73087 0.71627
0.70289 0 6772 0.64591 0.62754 0.615205 060138 0.56452 0.55288 0 55288 054164 0.54164
0 54164 0 54164 0 53004 0 53004 0 53004
0 53004
PV
0.3-5646 0.35640 0.35652 0.35671 0.35668 0.35646 0.35641 0.35659 0 35647 0 35649 0.35671 0. 35618 0.35663 0,35644 0.35661 035647 0,35970 0.35664 0,35638 0.35638 0 35661 0.35661 035661 0 35661 0 35620 0 35620 0 35620 035620
60.080
60.080 60.080 60.080
60.0 10 60.010 60.010
15.784 15.784 16.784 16.784 15.781 15.731 16.731 15. 731
K Relative Humidity
R Calculated
-A Ret, Hm..
21.98 11.46
9 54 9.09 9.36
10.09 11.01 11.99 12 97 1393 14.85 15.69 17.63 20.30 22.14
0,06371
0.06371 0+06371 0.06371
0.06394
0.69
-4
0-
29.153 28.753 287953 28.753 28.730 28 303 28,303 28,303
235.5 000866 60.060 16.049 0.06262 31.031 23.556 0.008566 60.056 18.119 0.06232 3`1.041 30.08 0.00858 1 60.0861 15.889 0.06327 ý29632
0I05
0.00858 0.00858 0.00858 0.00858
0 00857 000857 0.00857
0 00857
31.85 33.79 33.79 33.79
33 79 35 80 35 80 35 80 3580
(
-;3/! Airflow Postciosure Natural Ventilation System -upen pi
0
Predicted Psychrometric Properties of Ventilation Air in Repository Emplacement Side
Temperature d bulb and wet bulb at moisture of 74 grains per pound air from Attachment VI in emplacement outlet, after 300 m.
G Bar.
Pres. Ave. Pb
Aasamptotn 3.4
26i 2
262
262 26,2
26 2
262
2682 262 262 262
26 2 26 2
262 262
26 2 26 2
262
26.2 262
262
262 262 26 2 26 2 26 2 26 2 26 2 26 2 26 2
H Set. Vapor
Pressure at Td
Ps
Clculitted
mnch HR
282611
1044442
1704571
21.22639
21.94086
1998649
1748816 15 17262
13 16470 11 52588
1021520
913606
728548 5 38926
4 35232 3 73392
3,14127 2.69365 1 96085
166425 1 48887
1.40736
132976
1 32976
125590
1 25590 1 25590
1 25590
Sat. Vapor Pras at Tw
"P's
081439
1.17502 1.33355
1,40957
1942112
1.38847
1,34243 - 1.29483
1,24832
1 20546
1 16786 1.13374
1 06670 0.98131
0.92375 0.88380
0.84026 0 80267
0.72862
069211
A
Year Atri
Emp.
-1
5 10
20 30 40
-50
60
80
90 100
250 300
2500
3000 4000 5000
6000
50000
-J Partial
Vapor Pre s sur._. _..,ee Pv
Cotcutatcd
tech H1%
0.43818
0.43838
0.43794
0.43824
0.43806
0.43823
0.43816
0.43833 0 43832
K Relative Humidity
R
COdculiiw
% Ret. Hulm.
15.50
420 2.57
2.06 200
2,19
2.51 2.89 3.33
Moisture, Moisture
W (H0 W-7000•
C~dculoted Cailculated
N Specific Volume
v
'Calcutsted
0 Air Density M-oist Air
w. Caicutated
P Enthalpy
Heat Cont. h
CAtcultted,
Grains/b Iab T• . t^3ilb dry ar 1 trfu j Stuw'b ar0.010580.01058
0,01058 0.01057 0.01058
0.01058 0.01058 0.01058 001058 0.01058
74.05 ry77 r0.05989 i f-b ryar:
74.066 74.091 74.015
74.068
74.035
74.065
74.053 74.082 74.081 7d fliot
18.251 18.881 19.179 19.224 19.096 18.915 `18.727 18.543
0.05477 0.05282 0,05194 0.05181 005218 0,05271 0,05328
0 054385
38.841 51.148
56,396
58,894 59.272
58.201 56,688
55.120 53.582
52.160
0.43802 4.29 0.01058 74.029 18.2241 005485 50909 0.43807 4.79 0.01058 74.037 18.087 005530 49.769
0.438221 601 001058 74.064 17.8171 0.0619 47.517
0.30 813. ... 00105
B
Emplacemn -Tm ent Air Temp. from
AttachmentlV
(after 300m)
-44 93 72 85
84 79 90 44
91 31
88 87
85 44
8870 78 38 75 18
72 33
69 74 6462
5806 53 56 50 45
47 44
38
35 33
32
31
31
30
30 30 30
C
Dry Bulb Temp.
Td
Col a
^o F
1129
163 1 1846
1948 1964 1920 1858 179.4 1731 1673 1622 157 5 1483 136 1284 1228
1166 1112 104
950C
1
91 896
87.8 87 8 86 C
86 C
860 860C
0 Dry Bulb_
Temp. Td
Cwnnerted fr Col. C
-6C
44 9 72 9 84 8 904
91 3 88 9 85 4 81 9 78 4 75 2 72 3 69 7 64 6
58 1 53 6
50 5 47 0 44 0 38 0 35 0 33 0 32 0 31 0 31 0 300 30 0 30 0
E Wet Bulb
Tem Tw
to fit Col. M
ue F
72. 780 83,920 87P 890 8--9.650 89.9 10 89.170 88ji 100
85.8 10 874717 83.730 82.810 80 930 78.380 7 6 550 75 S220 7-3.71 0 72.350 69.600 68,000
-68970 66.450 165920
6.920 65.380 65380 8 57380 65 380
F -Wet Bulb
Temp
Tw, Canverted
firCOL E
"*C
22.7 28.8 31 1 32.0 32.2 31 8 31 2 30 5 29 9 29 3 28 7 28 2 27,2 25 8 24 8 24.0 23 2 22.4 20 8 20 0 19.4 19.1 18 8 188
18,5 185 18 5 18 5
17.070 16.888
0.05881 0.05948
42.648 41.267
39.750
16.26 001058 74.032 16.730 0.06007 38.428 22.35 0.01058 74.053 18.414 0.06130 35.788
2633 0.01058 74.04 16.256 0' 34.465
29.42 31.13
32.95
32.95
3487
3487
34.87 34.87
0. 01058U 0.01058 0.0158
0.0157
0,0057 00157
74.AAA 74.051
74.045
74.045
74.020
74.020 74.020
74.020
160918.10 16.098 16.045
16.045
15.992
15.992 15.992
15.992
0,062578 0.06278 0 063008 0.06300 0.06300 0106300
S 33.582
. 33.144 32. 702
32.702
32.258 32.258
32.258 32 258
(Z •,
.o 0 -=
l-
0 W
Formulas used to determine psychrometric properties of air (Hartman et al. 1997, page 15.16):
Sat Vapor Pressure (at Td), Ps = 0 18079" ev)((17 27Td)-552 64)/(Tdv395 14)), inches Hg
Sal Vapor Pressure (at Tw). P's = 0 18079 eA(((l17
271w)-552
64)/(Twv395 14)), inches Hg
Vapor Pressure Pv = P's.((Pb-P'S)*(Td-Tw))/(280 0
-1 37w), inches Hg
Relative Humidity. R =(Pv/Ps)*100%
Specific Humidity, W 0,622*(Pv/(Pb-Pv)), tb/Ib dry air or Grains Specific Humidity, W"7000 = 0.622'(Pv/(Pb-Pv))*7000, grains water vapor/lb dry air
Specific Volume, v = 5335"(460+Td)/((Pb-Pv)'0.491"144). ft^3,1b
Specific Weight, w = (1.3251(460+Td))'(Pb-378"Pv), IbIft^3 (not tabulated)
Enthalpy. h = 0241rd+W(1060+0 45Td), Btu/Ib dry air
0 66797 0,65606
0.64412
064412
063215 063215
063215
063215
0.43800 0.43803
0.43794
0.43804 0.43803
0,43816
0,43812
0.43805 0.43814
0.43811
0.43811
0,43796
043796
043796
0.43796
8.13
11.73
13.94
0.01058
0.01057
0.01058
74 095 74.031 74.016
74,033
inll• D• •r
•._._...._..._..-.--•
I
I

L - M Specific Humidlty
Moisture Moisture W H20) W17000 Calculated Calculated
Ih/lb dry air Grates/lb air
0.01272 89.063
0.01272 89.022
0,01272 89.046
0.01272 89.019
001273 89.089
0.01272 89.050
0.01272 89.053
0.01272 89.068
0.01272 89.016
001272 89.048
001272 .0 001272 89.070
001272 89.035
001272 89.051
0.01272 89.061
0.01273 89.084 0.01272 89.030
001272 89.033
0.01272 89.055
0.01272 89.012
0.01272 89.024
0.01272 89.046
001272 89.048
001272 89.036
001272 89.056 001272 89.0o5
001272 89.043
0.01272 89.043
Formulas used to determine psychrometrtc properties of air (Hartman at al. 1997, page 15.16):
Sat Vapor Pressure (at Td), Ps = 0 18079* e^(((17.27"Td)"552 64)/(Td+395 14)), inches Hg
Sat Vapor Pressute (at Tw). P's = 0 18079' e^(((17 27Tw)-552
64)/(Tw+395 14)). inches Hg
Vapor Pressure. Pv p's.((Pb-P's)'(Td-Tw))/(280o-I 3Tw), inches Hg
Relalive Humidity. R (Pv/PS)'100%
Specific Humidity, W = 0.622*(Pv/(Pb-Pv)), Ib/lb dry air or Grains Specific Humidity, W7000 = 0.622*(PvI(Pb-Pv))"7000, grains water vapor/tb dry air
Specific Volume. v = 53.35*(460+Td)/((Pb-Pv)'0491"144). fl^3fb
Specific Weight, w = (1,325/(460+Td))*(Pb'.378*Pv). lb/ft^3 (not tabulated)
Enthalpy, h =0 24Td+W*(1060+0A45Td), Btu/lb dry air
A
Year After
Empi
5
10 20
30 40
50 60 70 80 90
100 150 200
250 300 400
500
1500
2000
A000 7000 6000
80000
fit Vo
I =)
B
Emplacement
Air Temp. trom Attachment IV
(after 500m)
^u C
49 44
8600
104 C-4
11481 118 30
116 71
113 37
10951 105 56
101 74
98 18 94 81
88 01
78 90 72 14
67 23 62 00 5900
51G00 4700
4400
42 00
4200 4100
4000 4000
3900 3--- -9 00
0 Dty Bulb
Temp. Td
Cnnvrrted tr Col. 0
AtiC
49 4
860
E10.46 114 11 83 116 7
1134 1095 1056 101 7
98 2 94 8
88 0 78 9 72 1 67 2 62 0 59 0 51 0 470
44 0
42 0
420 471 0
Temp. Td
Equiv. of
Col B
1210 186.8 220 4
238 7 244 9
24_2 -1 236 I
229 1 222 0
215 1 208 7 202.7 190 4
17406 161 9 1530 143 6 1382
123 8 1166
11126
107 6
1058e
1040C
102 2
1022
E Wet Bulb
Tw Estimated
to ill Cal. M
76.980 8-9 88-5 95.160 97.760
998,620 998,2300 97.405
19%64300 95.400
941385 93.410
92.470 90.490
87.680 85 460 83,770 8 1.880
80760 -- 776-20
75 950 -74-660
73.780 -737 780
73.330
-72-8-80 72 880 72.420
72.420
F Wet Buib
TW Cons-roted
ft Col. E
25 0 32.2 35.1 36 5 370O 36.8 36.3 35,8 35 2 347
34 1 33.6
32.5 30 9 29.7 28.8 2717 27.1 25.3
24 4
23 7
23.2 23.2
230 22 7
22 7
22 5 22 5
G Bar.
Pree. Ave. Pb
Aaii rup fo 3..4
inch HK•
26.2
26.2 26,2
262 262
26 2 26 2
26 2
26 2
"26 2 26 2
"262 "26 2 26 2
26 2 26 2 282 26 2
26 2
26 2
26 2
-26- 2 262 26 2 262 262
S-§at. _Vapor Pressure at Td
Ps
Calculitd
inch Hg
355122
17.87707 3567758
5043509
5653818
53 68609
4808128 42 21687
3684360
3220132
28 32481
25.02264 19,33352
13.44878 10.13252
8.18430 8. 46926
563179 3 83676
314127 2.69365
242680 2.42680
230216
2 18310
2.18310 206940
206940
Sat. Vapor
Pros at Tw pot
Cal•rnlated
inch Hit
0.93701
1. 42000
1.67245
1.81058
1.85840
1.83658 1,79116
1.73873
1 68480 1 63308
1 58470
1 53924 1 44716
1.32472
1.23445 1 16937 1 10014 1.06082
0.95704
0.90554
086743
084224
0,84224
082961
081714
081714 0 80457
-al Partial
VapoPress•ure
Calculated
Inch 118
0.52519 0.52495
0.52509
0.52494
0.52534
052512 0.52513
0,52522 0,52492 0.52510
0.52499 0.52523
0.52503 052512
0.52518 0 52531
0.52500 0 52501 0.52514
0.52489
0.52497
0.52509
052509
0 52503
0.52515
052515
0 52507
0-52507
-K Relative
Humidity R
Cadculated
% Re. Hum.
14.79
2.94 1.47
1 04
0 93
.098 1 09 1.24
1.42
1.63 1 85
2.10 2.72
390 5.18 6.42 8 12
9 32
1369
16.71
19.49
21 64
21 64
22.81
240
24 06 2537
2537
N Speclficý
Volume * V
COlcudated.
r3/1h dry air
17.075
19.009 19.995 20.533
20.718
20.633 20.457 20.252
20.043
19.653
194.841
19. 11 18.633 18.276 18.016 17.739 17.580 17.157
16.945
16.787 16.681
16.68 1 18.628 16.57!_ 16.6756
16.522
16.522
0 Air Density
Moist Air
0 I
0.05894 0.05257 0.04979
0.04839
0.04792
04814 004858
004911 004966 0.05021 0.05073 0.05122 0.05226 0.05371
0.05483 0.05567 0.05880
005714 0.05864
005942
006001
0.06042 0.06042
0 606062
0 060533 0 6083
0.06103 006103
H isrt ep y g P
Btwb air
43.218 59,381
678630 72.124 73679
72,969 71.493 69,788
68 032 66348
64.770 63,286 60273
56.246
53.257 51.089 48.768
47 441
43906
42 130
I 0.805 ] 39.924
I 39.924 39 480
39.041 39.041
38.597
I 38.597
(
Air and Rock Wall Temperatures, Relative Humidity (RH), and WP Side Temp Output Calculation Is based on VA subsurface layout with the following averages: Airflow@ 1.0 m^31s (2119 cfm) per emplacement drift;
Water Influx @ 60 mm/year (Assumption 3.12); thermal loads @ 85 MTU/acre; and barometric pressure In
repository horizon @88.72 kPa (26.2 Inches Hg) (Assumption 3.4).
A aj C I - E F 10 I Jj -RIl M N I 0 I $ T- U jj W ,x..i. - ns 1 5~~.Fna~e¶A~ rf 1 se nsu .o.aum ll
100 m Inside Emplacement Drift
Air Tamp Reck Air WP
Wail Relative Sides Tamp
Temp Humidity
(RH)
trom
Aft. VtII, p.3
eot* I Not* 2 col. K Note
"-oC vAoC RH -%/ - A0
34.53 74.19 21.98 103
46.81 8837 4
50.47 310 954 105 51.46 9347 909 102
50.86 8997 936 97 49.33 8557 1 9
47.60 61.09 11.01 88
45.93 7891 1199 81 39 731 27 7
WalRelatveS
-Att VtI p.4
NotelI Noel 21 Col.K N
"loC
4-
"^oCRH -%
Ide Temp
-if--. 00n m Inside Empacement Drift 60 1n Inside Eplace•len. Dt A
EM Ar Temp.1 oc. .Deli Head ____Hn quw:[Hsd q
L~~~~~~~~~~~~~~ 3rdl Sol'j~~a.Pj . ~ H .tS~e eno IHmdt Wall Reatv 1S-d Tamp
S(RH) Exhaust H.0327dT H.0287I T H-.53
trom ____ from dT
ote a Ne I Net* 2 Coi. K NoteN Net* 1 Note 2 Col. K Note1 Note 3 Note 4 Noe
,oC oCC AOC AoC 0 nC ^oC RH -% IoC AoF Inch WG Inch WG Inch WG
__ _-__ __ _ _ _'__ _I _ _ _ _ __ _ _
72.85 101.87. , 13 1 0 _J _ 49.44 1 79.54 4.93 f L92J 1550 14.79 111 5. 3 1 1
.479 .1.0 25, 51J. 44~~ ~ Z f-~ ol H iR~ 8t 1 t 2. 84.79 114.80 1 2 57 130.j.~ 114.641 126.~
49 1.47 ~ *4 4f::: 0 , ;t ~ t 9
~~3 . .. . . .11 • 2 R
3.1 09 1231 198 .0 19M 1187130 1 6137.74 .9 .~ . ;,t
105.51
113.37 13.64...131.84 127.58 123.40
144 123.90
1 24 135 120.21_
i 1 /h11-
9-91.31 000
stie s .. ....
108.39 1 2.89 1 11281.87
x Y ZNat. Vent. Nat. Vent. Nat. Vent.
Pressure Pressure Pressure
Air Temp Reck Air VI _P bewHe at sotui H0 etd Eei ir Hear ql
151 18342, 0 53 1 2t•R 71 1R• • 1 059
13. ) .9 143 I 171.31 58t 49 . 1.07j 138 184.361 5.4 1 4.71 2.5135.25
105.56
Y-ear after
10, 20 30 40 50 80 70 80 90
100 150 200 250 300 400 500
1000 1500 2000 3000 4000 5000 6000 7000 8000
10000
30 30
AA 40 4612.0L 01 2100
3481_.6
Note 1 - Air temp data from Attachment IV.
Nole 3 - NVP equation derived from differential elevation 1089 feet. In equation H' (dT/l0)°0.03°(1089/100'), H '0.0327dT; (From North Ramp portal elev. 1123 m to Emplacement Shaft collar elev 1455 m) (3.8)
Note 4 - NVP equation derived from differential elevation of 958 feet, In equation H= (dT/I0)*0.03°(958'/100 , H 0.0287dT (From South Ramp portal elev 1160 m to Dev. Shaft collar elev 1452 m) (3.8)
Note 5 - NVP equation derived from shaft differential elevation 508.5 feet, In equation H= (dT/10)°0.03"(508.'/100) , H = 0.0153dT (From new intake shaft collar elev 1300 m to new exhaust shaft collar elev 1455 m) (3.8)
Note 6 - V,? Side temperature from Attachment V and Table 5.
(
-73 75.18 97.52 3.50 102 l01.7 119.37 1.63 . _ ._'
70 72.33 93.71 4.29 98 98.18 115.59 1.85 121 108.82 123.81 1.37 129 150.88 4.9 4.3 2.3
6 6 94 94.81 1 11.98 2105.37 120.32 1144.67 4.7 4.2 2.2
9 53.58 66.20 1.7 8. 5.18 8 6 91. .1 2.9
57 5.42 804-- -.. 75 096 .987 87 90. 3 3.0 2.6
43 T 7 579 13.4 582 82 2 8 71 2 8 .3 1
303-0-92 4 44 51 1949 5 4 52 1 8.8 5 32 . 1.2 0.
29 32 39 3.3 3 2 4 2.4 4 8 5 7.1 5 14 . 1.2 0.
28 3) 8 329 8 4 47 228 7t6 5 8.4 5_3.0 12 . .
_0.5
'23 038
53 54L
I~J0
- t
=
M
S.
4-3.01 41.80
40T.73 3.58
3-5.97
34.41
33.37 32 29 28 26 27 27 27 27 26 26 26 26
e. 6-9.80 68.88 64.30 5580 50.83 47.71 4551
42
40 35 32 30 29 28
-28
27 27 27
1-3.93 14.85 15.69 17.63 20.30 22.14 23.45
3008
31.85 33.79 33.79 33.79
33.7 799
35.80 35.80
-35 80
27 27 27
363
3 3
34.87 350 !42 I.1 I1fU 0.5AR 44 501 21.00
•IQ.LU I.I ., .5AA •nl •'I IN]34ý87
-v
),q (D laaý
>
0-4 10-4 1
c)
8 1 3 . . . .
86.00 1. 4.20 121 11 . 1
__J
i-f .... .
-;nl 3420 11 10 0
between I lit set 2nd set ] ;ira •et
Intake &Tl=m• Humidity
____----
J
. g,7111 4kl 1• I.•)•44 £•Z• 7•0• i •KCII
,.811664 3. .I";ti HNHII III 11.") I L.h.1
.a, / J . .4•4A• 4 4 R O•4 1"41111 I ly11 141
uu
15• . V. ..8ldJ.• ; 1")/ N:{ 14.% • i U.l•l1
I O,,.3. •.• 6.U . .8ld71•- 1232.7"A-98i n m•
I U e4Ri 17R •4 5.8 5.1113.37 140i 123.91S" 1 .25 1 2.51 119109.51
1.42 130i 1l1631J 1 31.357 --5 1 .33 lO.0__ 105.565.1 4.5 2.4449 •IR 971•.1
S•J t33 : 157.434 •

Post Closure Open-Loop Natural Ventilation ATTACHMENT IX BCADOOOOO-01717-0210-00002 Rev 00 Page IX- I of IX-3
Attachment IX- Permission Letter to use Curves
TRW Enwirottmental 1261 Town Center Drive Safety Systems Inc. Las Vegas. NV 89134
702.29S.5400
Ms. Karen Andrews TRW Environmental Safety Systems, Inc. Acting Supervisor, Cited Information Management MS 423/1127C 1261 Town Center Drive Las Vegas, NV 89134-6352 Phone number (702) 295-7126 Fax number (702) 295-6475
June 16. 1999
Mr. David Johnston Manager Intemational Sales Joy Technologics, Inc. JoylGrreen Fan Division 338 South Broadway P.O. Box 5000 New Philadelphia, OH 44663
Dear Mr. Johnston:
We are requesting copyright clearance for documents to be included in reports or analysesto the United Stares Department of Energy (DOE) discussing issues, technology, and concerns for the Yucca Mountain Project. In December 1995, Mr. Romeo Jurani of Morrison Knudsen received approximately sixty fan curves from you, along with a letter granting him permission to use them in his reports. Our engineers would like permission to place copies of some or all of those fan curves in the bodies of their reports. The reports will be used by project participants and could be part of DOE's basis for deciding what actions will be taken in the future regarding a potential underground nuclear waste repository at Yucca Mountain, Nevada- The reports would also be available to the United Stares Congress, the DOE, the United States Nuclear Regulatory Commission, and the general public
May we have permission to insert copies of the fan curves on the attached list into our reports and to distribute as many copies of those reports as needed for the Yucca Mountain M&O, and the entities mentioned earlier?
We would very much like to see your company's product information utilized by , ur scientists and engineers and represented in our project reports. Your response before June 18, 1999, would
TRW Inc.

Post Closure Open-Loop Natural Ventilation ATTACHMENT IX BCADOOOOO-01717-0210-00002 Rev 00 Page IX-2 of IX-3
be most appreciated. Please e-mail your responsc to [email protected], or fax it to "Attention: Karen Andrews" at (702) 295-6475. If you have any firther questions, plaCe feel free to contact Karen Andrews at (702) 295-7126.
Karen Andrews Acting Supervisor, Cited Information Management TRW Environmental Safety Systems
I (We) grant permission to project participants working for the Office of Civilian Radioactive Waste Management, Management and Operating Contractor to include the Joy Mlining Machinery documents from the attached list in their documents, and to maintain and distribute. hard coies of the documents as reviouslv descpibed.
Date

Post Closure Open-Loop Natural Ventilation BCAD00000-0 1717-0210-00002 Rev 00
ATTACHMENT IX Page IX-3 of IX-3
JOY TYPICAL MINE FAN CURVES
FAN MODEL NUMBER
M60-29-1180 M60-29-1780 M60-36-1 180 M60-36-1780 M60-43-1 180
M72-36-1180 M72-36-1780 M72-43-880 M172-43-1 180 M72-50-880 M72-50-1180
M84-36-880 M84-36-1180 M84-43-880 M84-43-1 180 M84-50-880 M84-50-1.180 M84-58-880 M84-58-1180
M96-43-880 M96-43-1180 M96-50-880 M96-50-1180 M96-58-880 M96-58-1180 M96-65-880
M108-60-710 M108-50-880 M108-58-710 M108-58-880 Ml08-65-710 M108-65-880 Ml08-72-710 M108-72-880
FAN CURVE NUMBER
C-8194 C-8195 C-8196 C-8197 C-8198
C-8199 C-8200 C-8201 C-8202 C-8203 C-8204
C-8205 C-8206 C-8207 C-8208 -C-8209 C-8210 C-8211 C-8212
C-8213 C -8214 C-8215 C-8216 C-8217 C-8218 C-8219
C-8220 C-8221 C-8222 C-8223 C-8224 C-8225 C-8226 C-8227
FAN MODEL NUMBER
M120-58- 7 10 M1 20-58-880 M120-65-590 M120-65-710 M1 20-65-880 M1 20-72-590 M120-72-710 M1 20-72-880 M 120-79-590 M120-79-710 M120-79-880
M1 32-65-590 M132-65-71 0
M1 32-72- 590 M132-72-710 M1 32-72-900 M132-79-590 M132-79-7 1 0
.M132-79-880
M144-65-590 M144-65-710 M144-72-59 0
M144--72-710 M144-79-590 M144-79-7 1 0 M144-79-880
FAN CURVE NUMBER
C-8228 C-8229 C-8251 C-8230 C-8231 C-8232 C-8233 C-8234 C-8235 C-8236 C-8250
C-8237 C-8238 C -8239 C-8240 C-9079 C-8241 C-8242 C-8249
C-8243 C-8244
>C-8245 C-8246 C-8247 C-8248 C-9804
While these are typical representations of Joy Mine Fan curves, they are by no means a complete compilation- Contact the Factory for additional, specific requirementsM
Joy Technologies. Inc. JoyiGrfen Fan DivisiOn
New Philadelphia. Ohio