BSC Design Calculation or Analysis Cover SheetENG.20071023.0003 BSC Design Calculation or Analysis...
43
ENG.20071023.0003 BSC Design Calculation or Analysis Cover Sheet 1. QA: QA 2. Page 1 Complete only applicable items. 3. System 14. Document Identifier Monitored Geologic Repository OOO-PSA-MGRO-O1 300-000-00A 5. Title GROA External Dose Rate Calculation 6. Group Preclosure Safety Analyses 7. Document Status Designation D Preliminary Committed D Confirmed D Cancelled/Superseded 8. Notes/Comments· The Preclosure Safety Analyses department should be consulted before any use of information herein for any purpose other than that stated herein or before being used by any individual other than authorized personnel in the department. John Wang performs: (1) regression analysis of SASI dose rate results with MathCAD in Attachment I; (2) development of Tables 5 and 6 for the aging pads, and (3) generation of the GROA dose rate contour map in Figure 5 using the Surfer 8.04 software. The final back check is performed by Kathryn Ashley. NOTICE OF OPEN CHANGE DOCUMENTS - THIS DOCUMENT IS IMPACTED BY THE LISTED CHANGE DOCUMENTS AND CANNOT BE USED WITHOUT THEM. ----------------------------------------- 1) CACN-001, DATED 01/30/2008 . D R ,,:live. .( 4tt.- tttachments Total Number of t L .. -r Ir>J."CJI n,(J7 Pages ATT ACHMENT I. DO:ole Rate Calcuhltiofl ef A' 'Brags Aging Cask 1 { 4 ATTACHMENT II. ELECTRONIC FILES ON ATTACHED CD 1 page and,! CD RECORD OF REVISIONS 9. 10. 11. 12. 13. 14. 15. 16. No. Reason For Revision Total # Last Originator Checker EGS Approved/Accepted of Pgs. Pg.# (Print/Sign/Date) (Print/Sign/Date) (Print/Sign/Date) (Print/Sign/Date) OOA Initial Issue 43 II-I JaboS. Tang WesleyWu S. Tsai J. Wang \1J : )f/u' , I ()/If/'lIJO? 10 l IIlk-o 01 1(.)/10/ 'Jon '),()o7 IDP",?, L /ojlo/.nr>j .
Transcript of BSC Design Calculation or Analysis Cover SheetENG.20071023.0003 BSC Design Calculation or Analysis...

ENG.20071023.0003
BSC Design Calculation or Analysis Cover Sheet 1. QA: QA
2. Page 1Complete only applicable items.
3. System 14. Document IdentifierMonitored Geologic Repository OOO-PSA-MGRO-O1 300-000-00A5. TitleGROA External Dose Rate Calculation6. GroupPreclosure Safety Analyses7. Document Status Designation
D Preliminary ~ Committed D Confirmed D Cancelled/Superseded
8. Notes/Comments·The Preclosure Safety Analyses department should be consulted before any use of information herein for any purpose other than thatstated herein or before being used by any individual other than authorized personnel in the department.
John Wang performs: (1) regression analysis of SASI dose rate results with MathCAD in Attachment I; (2) development of Tables 5and 6 for the aging pads, and (3) generation of the GROA dose rate contour map in Figure 5 using the Surfer 8.04 software.
The final back check is performed by Kathryn Ashley.
NOTICE OF OPEN CHANGE DOCUMENTS - THIS DOCUMENT IS IMPACTED BY THE LISTED CHANGE DOCUMENTS AND CANNOT BE USED WITHOUT THEM.
----------------------------------------- 1) CACN-001, DATED 01/30/2008
. D R,,:live. .( 4tt.-tttachments Total Number of~rV'c..se",
tL ..-r Ir>J."CJIn,(J7 Pages
ATTACHMENT I. DO:ole Rate Calcuhltiofl ef A' 'Brags Aging Cask ~- 1 { 4
ATTACHMENT II. ELECTRONIC FILES ON ATTACHED CD 1 page and,!CD
RECORD OF REVISIONS
9. 10. 11. 12. 13. 14. 15. 16.No. Reason For Revision Total # Last Originator Checker EGS Approved/Accepted
of Pgs. Pg.# (Print/Sign/Date) (Print/Sign/Date) (Print/Sign/Date) (Print/Sign/Date)OOA Initial Issue 43 II-I JaboS. Tang WesleyWu S. Tsai
J. Wang \1J:irbur~~Y(~r-/u~,~ ~~t1P~
-~ )f/u' ,~,b.l-Y I ()/If/'lIJO? 10 l IIlk-o01 ~1(.)/10/
'Jon'),()o7 IDP",?,
L~V7/ojlo/.nr>j .

GROA External Dose Rate Calculation 000-PSA-MGR0-01300-000-00A
DISCLAIMER
The calculations contained in this document were developed by Bechtel SAIC Company, LLC, and are intended solely for the use of Bechtel SAIC Company, LLC, in its work for the Yucca Mountain Project.
ii

GROA External Dose Rate Calculation 000-PSA-MGR0-01300-000-00A
CONTENTS
Page
1. PURPOSE..................................................................................................................................1
2. REFERENCES ..........................................................................................................................2 2.1 PROCEDURES/DIRECTIVES ........................................................................................2 2.2 DESIGN INPUTS.............................................................................................................2 2.3 DESIGN CONSTRAINTS ...............................................................................................3 2.4 DESIGN OUPUTS ...........................................................................................................3
3. ASSUMPTIONS........................................................................................................................4 3.1 ASSUMPTIONS REQUIRING VERIFICATION...........................................................4 3.2 ASSUMPTIONS NOT REQUIRING VERIFICATION..................................................4
3.2.1 Capacity of Aging Facility................................................................................... 4 3.2.2 Treatment of Aging Facility as Radiation Source ............................................... 4 3.2.3 Exclusion of Shielding Effect of Buildings ......................................................... 4 3.2.4 Dose Rates from Transportation Cask, TEV, and Casks in Transit .................... 5 3.2.5 Dose Rate Due to Casks in Buffer Areas............................................................. 6 3.2.6 Geometry and Dose Rate of Aging Pad 17P........................................................ 6 3.2.7 Geometry and Dose Rate of Aging Pad 17R ....................................................... 9 3.2.8 Geometry and Materials of Aging Overpack..................................................... 10 3.2.9 Dose Rate of TN-32 Cask beyond 1000 m........................................................ 10 3.2.10 Symmetry of Aging Pads ................................................................................... 12
4. METHODOLOGY ..................................................................................................................13 4.1 QUALITY ASSURANCE..............................................................................................13 4.2 USE OF COMPUTER SOFTWARE..............................................................................13
4.2.1 SAS1 Sequence of SCALE Version 4.4A Code................................................ 13 4.2.2 Exempt Software................................................................................................ 13
4.3 METHOD .......................................................................................................................14 4.3.1 Aging Pads 17P and 17R ................................................................................... 16 4.3.2 Transportation Cask Buffer Areas ..................................................................... 16 4.3.3 Transportation Cask and TEV ........................................................................... 17
4.4 REGULATION...............................................................................................................17 4.4.1 10 CFR Part 71 .................................................................................................. 17
5. LIST OF ATTACHMENTS ....................................................................................................18
6. BODY OF CALCULATIONS ................................................................................................19 6.1 INPUT PARAMETERS .................................................................................................19
6.1.1 Dose Rates from Aging Pads, 17P, 17Rr, and 17Rl ........................................... 19 6.1.2 Dose Rates from Buffer Areas 33A and 33B .................................................... 25 6.1.3 Dose Rates from Transportation Cask and TEV ............................................... 26 6.1.4 GROA Surface Facilities Layout....................................................................... 27
6.2 GENERATION OF DOSE RATE CONTOUR .............................................................27
iii

iv
GROA External Dose Rate Calculation 000-PSA-MGR0-01300-000-00A
7. RESULTS AND CONCLUSION............................................................................................29
ATTACHMENT I REPRESENTATIVE DOSE RATE OF AGING CASK..........................I-1
ATTACHMENT II ELECTRONIC FILES ON COMPACT DISC....................................... II-1

GROA External Dose Rate Calculation 000-PSA-MGR0-01300-000-00A
FIGURES
Page
Figure 1. Normalized Photon Flux Distribution on Radial Surfaces of Different Casks.......... 5 Figure 2. Dose Rate versus Distance for Single Cask and Aging Pads..................................... 9 Figure 3. Dose Rate versus Distance for a TN-32 Storage Cask ............................................ 11 Figure 4. Relative Coordinates of Receptor Locations for An Aging Pad.............................. 22 Figure 5. Dose Rate (mrem/hr) Contour Map for the Geologic Repository Operations
Area.......................................................................................................................... 30 Figure I-1. Dose Rate (mrem/hr) at 100 m from Aging Cask....................................................I-4 Figure I-2. Schedule of Casks Sent to Aging Pads ....................................................................I-4
v

GROA External Dose Rate Calculation 000-PSA-MGR0-01300-000-00A
TABLES
Page
Table 1. Normalized Photon Flux Distributions on Radial Surfaces of Various Casks .......... 6 Table 2. Dose Rates versus Distance for Aging Pads .............................................................. 8 Table 3. Dose Rates versus Distance for a TN-32 Cask ........................................................ 11 Table 4. Dose Rate (mrem/hr) versus Distance for Aging Pads, 17P, 17Rr, and 17Rl .......... 20 Table 5. Dose Rate DR�i�
k versus Distance for Aging Pads 17Rr and 17Rl .......................... 23 Table 6. Dose Rate DR�i�
k versus Distance for Aging Pad 17P ............................................ 24 Table 7. Dose Rate (mrem/hr) versus Distance for Buffer Areas 33A and 33B.................... 25 Table 8. Dose Rate (mrem/hr) versus Distance for Casks in Transit..................................... 26 Table 9. Normal Operation Direct Doses at Facility Locations in the GROA ...................... 29 Table I-1. Regression Results of Dose Rates from Aging Cask Surface..................................I-2 Table II-1. Listing of Electronic Files on Compact Disc......................................................... II-1 Table II-2. SAS1 Files Naming Convention............................................................................ II-1
vi

GROA External Dose Rate Calculation 000-PSA-MGR0-01300-000-00A
ACRONYMS AND ABBREVIATIONS
ACRONYMS
CD Compact disc
CFR Code of Federal Regulations
DB design basis
GROA Geologic Repository Operations Area
MTHM metric ton heavy metal
NSP Nevada State Plane
PCSA Preclosure Safety Analysis
PDF probability density function
PWR pressurized water reactor
RE relative error
RF Receipt Facility
SNF spent nuclear fuel
TEV transport and emplacement vehicle
WP waste package
ABBREVIATIONS
cm centimeter
eV electron volt
ft foot
GWd gigawatt-day
hr hour
in. inch
km kilometer
vii

GROA External Dose Rate Calculation 000-PSA-MGR0-01300-000-00A
m meter
mrem millirem
viii

GROA External Dose Rate Calculation 000-PSA-MGR0-01300-000-00A
1. PURPOSE
The purpose of this calculation is to estimate potential external radiation levels from staging and aging casks, and casks in transit in the Geologic Repository Operations Area (GROA). A dose rate contour map is generated for the GROA based on the radiation sources from the Aging Facility and from the rail and truck buffer areas. The results of this calculation will be used to support the design of the repository Aging Facility and to provide input to GROA radiation zoning classifications for the License Application.
The calculations contained in this document were developed by the Preclosure Safety Analyses (PCSA) organization and are intended for use in worker and public dose assessments to support the preclosure consequence analyses for the License Application. Yucca Mountain Project personnel from PCSA should be consulted before use of the calculations for purposes other than those stated herein or use by individuals other than authorized personnel in PCSA.
In this calculation, the terms aging cask and aging overpack are used interchangeably. The reader is advised to read Section 4.3 for the technical approach before any other sections.
1

GROA External Dose Rate Calculation 000-PSA-MGR0-01300-000-00A
2. REFERENCES
2.1 PROCEDURES/DIRECTIVES
2.1.1 BSC 2007. Calculations and Analyses. EG-PRO-3DP-G04B-00037, Rev. 9. Las Vegas, Nevada. Bechtel SAIC Company. ACC: ENG.20070717.0004.
2.1.2 BSC 2007. Software Management. IT-PRO-0011, Rev. 7. Las Vegas, Nevada. Bechtel SAIC Company. ACC: DOC.20070905.0007.
2.1.3 BSC 2007. Preclosure Safety Analyses Process. LS-PRO-0201, Rev. 5. Las Vegas, Nevada. Bechtel SAIC Company. ACC: ENG.20071010.0021.
2.1.4 ORD (Office of Repository Development) 2006. Repository Project Management Automation Plan. 000-PLN-MGR0-00200-000, Rev. 00D. Las Vegas, Nevada: U.S. Department of Energy, Office of Repository Development. ACC: ENG.20060703.0001. [DIRS 178400].
2.2 DESIGN INPUTS
2.2.1 10 CFR 63. 2007. Energy: Disposal of High-Level Radioactive Wastes in a Geologic Repository at Yucca Mountain, Nevada. Internet Accessible. [DIRS 180319].
2.2.2 Software Code: SCALE V4.4A. 2000. HP. 10129-4.4A-00. [DIRS 154394]
2.2.3 BSC 2007. Geologic Repository Operations Area Overall Site Plan. 000-C00-MGR000201-000-00B. Las Vegas, Nevada: Bechtel SAIC Company. ACC: ENG.20070725.0001. [DIRS 182265].
2.2.4 BSC 2007. Aging Facility General Arrangement Aging Pad Area Plan. 170-P10-AP0000101-000-00B. Las Vegas, Nevada: Bechtel SAIC Company. ACC: ENG.20070618.0016. [DIRS 181398].
2.2.5 BSC 2007. Aging Facility General Arrangement Aging Pad 17P Plan. 170-P10-AP0000102-000-00B. Las Vegas, Nevada: Bechtel SAIC Company. ACC: ENG.20070618.0017. [DIRS 181400].
2.2.6 BSC 2007. Aging Facility General Arrangement Aging Pad 17R Plan. 170-P10-AP0000103-000-00B. Las Vegas, Nevada: Bechtel SAIC Company. ACC: ENG.20070618.0018. [DIRS 181401].
2.2.7 BSC 2007. GROA Shielding Requirements Calculation. 000-00C-MGR0-03300-00000B. Las Vegas, Nevada: Bechtel SAIC Company. ACC: ENG.20070529.0037.
2.2.8 BSC 2007. Characteristics for the Representative Commercial Spent Fuel Assembly for Preclosure Normal Operations. 000-PSA-MGR0-00700-000-00A. Las Vegas, Nevada: Bechtel SAIC Company. ACC: ENG.20070521.0008. [DIRS 180185].
2
GROA External Dose Rate Calculation 000-PSA-MGR0-01300-000-00A
2.2.9 BSC (Bechtel SAIC Company) 2007. Basis of Design for the TAD Canister-Based Repository Design Concept. 000-3DR-MGR0-00300-000-001. Las Vegas, Nevada: Bechtel SAIC Company. ACC: ENG.20071002.0042.
2.2.10 BSC (Bechtel SAIC Company) 2006. Project Design Criteria Document. 000-3DRMGR0-00100-000-006. Las Vegas, Nevada: Bechtel SAIC Company. ACC: ENG.20061201.0005. [DIRS 178308].
2.2.11 BSC (Bechtel SAIC Company) 2006. Effect of Waste Receipt Scenarios on Repository Loading. 800-00C-WIS0-00300-000-00A. Las Vegas, Nevada: Bechtel SAIC Company. ACC: ENG.20061114.0009.
2.2.12 BSC 2004. Shielding Evaluation for Spent Nuclear Fuel Aging Areas. 170-00C-HAP000200-000-00A. Las Vegas, Nevada: Bechtel SAIC Company. ACC: ENG.20040512.0002. [DIRS 169308].
2.2.13 BSC 2004. Dose Rate Evaluations for Spent Nuclear Fuel Aging Areas.170-00C-HAP000400-000-00A. Las Vegas, Nevada: Bechtel SAIC Company. ACC: ENG.20041217.0001. [DIRS 172499].
2.2.14 BSC (Bechtel SAIC Company) 2004. Dry Transfer Facility Worker Dose Assessment. 110-00C-CD00-00100-000-00B. Las Vegas, Nevada: Bechtel SAIC Company. ACC: ENG.20040923.0001; ENG.20050815.0021. [DIRS 171772].
2.2.15 BSC (Bechtel SAIC Company) 2003. Shielding Design Calculations for Dry Facility #1. 110-00C-CS10-00200-000-00A. Las Vegas, Nevada: Bechtel SAIC Company. ACC: ENG.20030602.0003. [DIRS 163936].
2.2.16 CRWMS M&O 2000. Validation Test Report (VTR) for SCALE-4.4A. 10129-VTR-4.4A00. Las Vegas, Nevada: CRWMS M&O. ACC: MOL.20001130.0139. [DIRS 153871].
2.2.17 WPLOAD V. 1.1. 2006. WINDOWS 2000. STN: 11131-1.1-00. [DIRS 178198].
2.3 DESIGN CONSTRAINTS
None.
2.4 DESIGN OUPUTS
The results of this calculation will be used to support the repository Aging Facility design and to provide input to radiation zoning classifications for the License Application.
3

GROA External Dose Rate Calculation 000-PSA-MGR0-01300-000-00A
3. ASSUMPTIONS
3.1 ASSUMPTIONS REQUIRING VERIFICATION
None
3.2 ASSUMPTIONS NOT REQUIRING VERIFICATION
3.2.1 Capacity of Aging Facility
Assumption: It is assumed that the Aging Facility is loaded with commercial spent nuclear fuel (SNF) to full capacity.
Rationale: At full capacity of commercial SNF, the Aging Facility will render a maximum possible dose rate, which is conservative.
Usage: This assumption is used in Section 4.3.1.
3.2.2 Treatment of Aging Facility as Radiation Source
Assumption: The Aging Facility is composed of two pads, 17P and 17R (References 2.2.4 to 2.2.6). For GROA dose rate determination, the two pads are assumed to be two separate radiation sources. The shielding effect of one to the other is excluded and the total dose rate is the sum of the dose rate due to each pad.
Rationale: The exclusion of the shielding effect between the two aging pads will give a higher and more conservative radiation level in the GROA.
Aging pad 17P has an “L” shape layout consisting of 7 sub-pads, each of which consists of groups of 4x4 (or 16) cask spots (Reference 2.2.5). The capacity of aging pad 17P is 1248 aging casks. Aging pad 17R is rectangular consisting two identical halves, designated as 17Rl and 17Rr. For each half, the front row can store 50 horizontal aging modules. Behind the horizontal modules are 4 sub-pads, each consisting of 9 groups of 4x4 cask spots (Reference 2.2.6). The capacity of aging pad 17R is 1252 (100 + 2x9x4x16) aging casks.
Usage: This assumption is used in Section 4.3.1.
3.2.3 Exclusion of Shielding Effect of Buildings
Assumption: For GROA dose rate determination, the shielding effect of the facility buildings is excluded.
Rationale: The exclusion of the shielding effect of facility buildings will give a higher and thus more conservative radiation level in the GROA.
Usage: This assumption is used in Sections 4.3.
4

3.2.4 Dose Rates from Transportation Casks, TEV, and Casks in Transit
Assumption: It is assumed that dose rate as a function of distance from a transportation cask, a TEV (transport and emplacement vehicle), or any single cask has a similar trend as that from the TN-32 cask presented in Reference 2.2.12 ([DIRS 169308], Table 6).
Rationale: The rationale for this assumption is that primary gamma rays account for over 70% of the radial dose rate (Attachment II, file Summary.xls, worksheet TN-32, cell K37 to K59), and the gamma energy spectra exiting the different casks are expected to be similar since they all contain commercial SNF and are shielded to similar surface dose rates, ranging approximately from 2 to 120 mrem/hr. This assertion is supported by the graphical and numerical results presented in Figure 1 and Table 1, respectively. The sources of the information are identified in the footnote of Table 1.
Usage: This assumption is used in Sections 3.2.6, 4.3.3 and 6.1.3.
2.50E-01
2.00E-01
1.50E-01
1.00E-01
Shld WP, Ave SNF Shld WP, DB SNF TN-32, SAR Source Aging Cask, DB SNF Aging Cask, a25e25b50
5.00E-02
0.00E+00
Phot
on F
lux
)
0 2 4 6 8 10 12 14 16 18 20
Energy Group Number
GROA External Dose Rate Calculation 000-PSA-MGR0-01300-000-00A
Source: Worksheet Chart2 of GammaSpectra.xls in Attachment II.
Figure 1. Normalized Photon Flux Distribution on Radial Surfaces of Different Casks
5

GROA External Dose Rate Calculation 000-PSA-MGR0-01300-000-00A
Table 1. Normalized Photon Flux Distributions on Radial Surfaces of Various Casks
Energy Group
Number Upper
Energy (eV) Shielded WP,
Ave SNFa Shielded WP,
DB SNFb TN-32, SAR
Sourcec Aging Cask,
DB SNFd Aging Cask, a25e25b50e
1 1.00E+07 2.22E-08 1.85E-08 6.78E-09 1.43E-07 4.09E-07 2 8.00E+06 1.18E-07 9.80E-08 3.55E-08 6.27E-07 1.79E-06 3 6.50E+06 5.74E-07 4.78E-07 1.71E-07 2.53E-06 7.23E-06 4 5.00E+06 1.15E-06 9.58E-07 3.38E-07 4.20E-06 1.20E-05 5 4.00E+06 2.85E-06 9.99E-06 5.23E-05 3.27E-05 2.48E-05 6 3.00E+06 1.27E-05 3.42E-05 1.98E-04 8.50E-05 4.20E-05 7 2.50E+06 8.95E-05 2.57E-04 2.30E-03 5.16E-04 1.75E-04 8 2.00E+06 6.07E-04 4.30E-04 2.22E-03 7.57E-04 8.37E-04 9 1.66E+06 1.82E-02 3.10E-02 3.37E-02 3.86E-02 2.83E-02 10 1.33E+06 5.81E-02 8.58E-02 9.19E-02 1.01E-01 8.15E-02 11 1.00E+06 5.26E-02 7.82E-02 8.62E-02 9.17E-02 7.41E-02 12 8.00E+05 1.21E-01 1.27E-01 1.37E-01 1.40E-01 1.34E-01 13 6.00E+05 2.12E-01 1.97E-01 2.11E-01 2.12E-01 2.24E-01 14 4.00E+05 1.44E-01 1.29E-01 1.36E-01 1.35E-01 1.48E-01 15 3.00E+05 1.74E-01 1.54E-01 1.57E-01 1.55E-01 1.72E-01 16 2.00E+05 2.12E-01 1.91E-01 1.37E-01 1.20E-01 1.30E-01 17 1.00E+05 6.74E-03 6.07E-03 4.18E-03 6.15E-03 6.62E-03 18 5.00E+04 5.14E-06 4.64E-06 4.44E-06 3.89E-06 4.04E-06
Total N/A 1.00E+00 1.00E+00 1.00E+00 1.00E+00 1.00E+00 Dose Rate (mrem/hr) N/A 1.66E+01 9.21E+01 1.14E+02 1.10E+01 2.08E+00
The sources of the data are the references indicated below, but the data have been normalized to probability density functions (pdfs) in Attachment II, file: GammaSpectra.xls, worksheet Norm
aReference 2.2.14 [DIRS 171772], Attachment III, \Radial\R-AV-p.output. bReference 2.2.14 [DIRS 171772], Attachment III, \Radial\R-DB-p.output. cReference 2.2.14 [DIRS 171772], Attachment III, \TN32\TN32-SARsource-p.output. dAttachment II, SAS1.zip\a10e40b60.output. eAttachment II, SAS1.zip\a25e25b50.output.
3.2.5 Dose Rate Due to Casks in Buffer Areas
Assumption: It is assumed that for distances greater than 50 m the dose rate as a function of distance from the rail buffer area 33A or the truck buffer area 33B has a similar trend as that from the TN-32 cask (Reference 2.2.12 [DIRS 169308], Table 6).
Rationale: The rationale for this assumption is identical to that for Assumption 3.2.4. Although Assumption 3.2.4 is for single cask, the trend is applicable to the buffer areas because the gamma leakage spectrum from each cask in the buffer areas is similar to the other casks and overpacks.
Usage: This assumption is used in Sections 4.3.2 and 6.1.2.
3.2.6 Geometry and Dose Rate of Aging Pad 17P
Assumption: It is assumed that the aging pad 17P as shown in References 2.2.4 and 2.2.5 transforms to a rectangular geometry consisting of 6 sub pads, each has 13 groups of 4x4 (or 16) cask spots. The transformation is achieved by relocating sub pad A evenly to sub pad B and sub pad C. It is also assumed that the dose rate as a function of distance from this transformed pad
6

GROA External Dose Rate Calculation 000-PSA-MGR0-01300-000-00A
has the same trend as that of the combination of aging areas 17B, 17C, 17D, and 17E (herein designated as pad 17B-E) (Reference 2.2.13 [DIRS 172499], Figure 2). The configuration of pad 17B-E is described below. This trend is presented in column X of Table 2 and depicted in Figure 2.
Rationale: This transformation moves sub pad A closer to the GROA; therefore it will lead to a higher radiation level for the GROA. Furthermore, using the dose rate versus distance curve of pad 17B-E is also conservative because pad 17B-E has a higher total capacity and more casks on the front row (80) than pad 17P. The rationale in Assumption 3.2.4 provides additional support to the applicability of the dose rate trend of pad 17B-E for pad 17P.
Table 2 presents calculated dose rates of three aging pad configurations from a previous design (Reference 2.2.13 [DIRS 172499], Tables 4 and 6). The aging pads contain TN-32 storage casks loaded with commercial SNF with radiation source terms described in Reference 2.2.12 ([DIRS 169308], Table 3) or Reference 2.2.13 ([DIRS 172499], Table 1). All three aging pad configurations are modeled with ground and air to simulate ground reflection and sky shine. The air extends 2000 m above the casks. The first configuration, pad 17A, consists of two rows of TN-32 casks sitting vertically on an aging pad. Each row has 40 casks with a center-to-center pitch of 13 ft, which also is the distance between the centers of the rows (Reference 2.2.13 [DIRS 172499], Figure 5). The second configuration, which is also mentioned in Section 3.2.7 of this calculation, is pad 17B-E. This configuration is designated as “All” in Table 2. Each area (17B, 17C, 17D, or 17E) in pad 17B-E is composed of five aging pads each of which is identical to pad 17A. The width of each pad is 61 ft and the spacing between any two adjacent pads is 80 ft. This yields a center-to-center spacing of 141 ft between any two adjacent pads. The third configuration, designated as “Outer” in Table 2, consists of the front two pads of pad 17B-E. This configuration can also be constructed by placing two 17A pads side by side along their lengths.
In Table 2, the dose rates are presented for distance out to 2000 m. Due to statistical fluctuation of Monte Carlo results, the relative errors (columns III, V, and VII) become excessive (greater than 0.2) for distances greater than 600 m. Thus, the calculated dose rates (columns II, IV, and VI) at greater distances deviate from the general smooth trend and do not follow the usual attenuation behavior, as evident in Figure 2, for the dose rate points beyond 600 m. To alleviate the fluctuation in the dose rate trend, the dose rate results for the three configurations were fitted to functions that are weighted by the inverse square of the relative errors. The curve fitting operations were performed using MathCAD software and the resulting dose rates are presented in columns VIII, IX, and X.
Usage: This assumption is used in Sections 3.2.10 and 4.3.1.
7

GROA External Dose Rate Calculation 000-PSA-MGR0-01300-000-00A
Table 2. Dose Rates versus Distance for Aging Pads
Distance from
Surface 17Aa Pad #1 of 17C & E
(Outer)b 17B to E
(All)b 17A
(fitted)d
Pad#1 of 17C & E (fitted)d
17B to E (All
fitted)d
(m) mrem/hr RE mrem/hr REc mrem/hr RE mrem/hr A
mrem/hr mrem/hr I II III IV V VI VII VIII IX X
6.1 5.30E+01 0.017 5.47E+01 0.017 5.79E+01 0.016 4.52E+01 4.67E+01 4.97E+01 10 3.62E+01 0.020 3.77E+01 0.019 4.09E+01 0.018 3.68E+01 3.85E+01 4.18E+01 20 1.80E+01 0.027 1.96E+01 0.026 2.26E+01 0.023 2.18E+01 2.34E+01 2.69E+01 30 1.09E+01 0.032 1.21E+01 0.031 1.49E+01 0.025 1.34E+01 1.48E+01 1.79E+01 40 7.39E+00 0.036 8.43E+00 0.034 1.09E+01 0.027 8.62E+00 9.80E+00 1.24E+01 50 5.42E+00 0.040 6.37E+00 0.037 8.52E+00 0.028 5.91E+00 6.89E+00 9.14E+00 60 4.05E+00 0.045 4.82E+00 0.041 6.70E+00 0.030 4.23E+00 5.06E+00 7.00E+00 70 3.18E+00 0.051 3.82E+00 0.045 5.45E+00 0.032 3.17E+00 3.89E+00 5.58E+00 80 2.34E+00 0.052 2.96E+00 0.047 4.39E+00 0.033 2.42E+00 3.06E+00 4.54E+00 90 1.88E+00 0.055 2.47E+00 0.049 3.83E+00 0.033 1.97E+00 2.53E+00 3.85E+00
100 1.47E+00 0.059 2.01E+00 0.052 3.21E+00 0.034 1.59E+00 2.08E+00 3.25E+00 200 2.53E-01 0.070 3.60E-01 0.054 7.24E-01 0.032 3.64E-01 5.17E-01 9.33E-01 300 6.25E-02 0.094 1.04E-01 0.071 2.31E-01 0.033 9.20E-02 1.40E-01 2.85E-01 400 1.81E-02 0.091 3.30E-02 0.083 8.14E-02 0.037 2.50E-02 4.00E-02 9.10E-02 500 5.49E-03 0.089 1.13E-02 0.098 2.91E-02 0.042 7.34E-03 1.20E-02 3.10E-02 600 2.10E-03 0.105 4.64E-03 0.141 1.19E-02 0.071 2.31E-03 3.98E-03 1.10E-02 700 8.48E-04 0.132 1.99E-03 0.252 4.93E-03 0.110 7.80E-04 1.38E-03 3.89E-03 800 3.73E-04 0.182 1.13E-03 0.434 2.20E-03 0.224 2.83E-04 5.06E-04 1.48E-03 900 2.10E-04 0.230 8.41E-04 0.580 1.30E-03 0.375 1.21E-04 2.14E-04 6.16E-04
1000 8.66E-05 0.341 6.61E-04 0.736 8.41E-04 0.578 5.23E-05 9.14E-05 2.59E-04 1500 7.48E-07 0.131 1.35E-06 0.090 3.45E-06 0.054 1.61E-06 2.39E-06 5.09E-06 2000 3.77E-08 0.482 5.28E-08 0.366 8.57E-08 0.238 4.94E-08 6.23E-08 9.99E-08
aReference 2.2.13 [DIRS 172499], Table 4. bReference 2.2.13 [DIRS 172499], Table 6. cREs (relative errors) are from Spreadsheet results.xls/17BE_80ft (Attachment II, Reference 2.2.13 [DIRS 172499])
and are different from those in Table 6 of Reference 2.2.13 [DIRS 172499]. dObtained from curve fitting of columns II, IV, and VI, respectively. The curve fittings are carried out in Wt_Fit.xmcd in
Attachment II. The points less than 100 m and 100 to 2000 m are fitted separately.
8
Source: Worksheet Ch2-Aging of Summary.xls in Attachment II.
'"';5IX
'"'""Q
1.00E·08 h~~.,,~~iT~~,,~n~~.,,~~+..n."'••".""••.,.,•."'.h-~",,~~.,.,~~iT~~,,~n~~.,,~~;j,-~~",,~n~~"'~~iT~""~~.,.,~~+~,,~""~~.,.,~~iT~~"~""~~-n~iT~~,,~n~~.,,~~iT~""~~.,.j~f,,~~"~""~~.,.,~~iT~~"~""~~-h~iT~~,,~n~~.,,~~iT~~""~+,~"'~~,,~,.;~~TI~~"'~~;;tn~""UiT~~"~""~~.,,~~iT~~.-.I~:::::~:::::.:---------~--
1.00E·09 +----+----+----+----+----+----+----+----+----+-------'fo 200 400 600 800 1000 1200 1400 1600 1800 2000
• 17A • Outer
Distance from Radial Surface (m)
ALL __ Single TN·32 --17A (fitted) --Outer (fitted) --ALL (fitted) - 0-- . TN·32 (Extended)
GROA External Dose Rate Calculation 000-PSA-MGR0-01300-000-00A
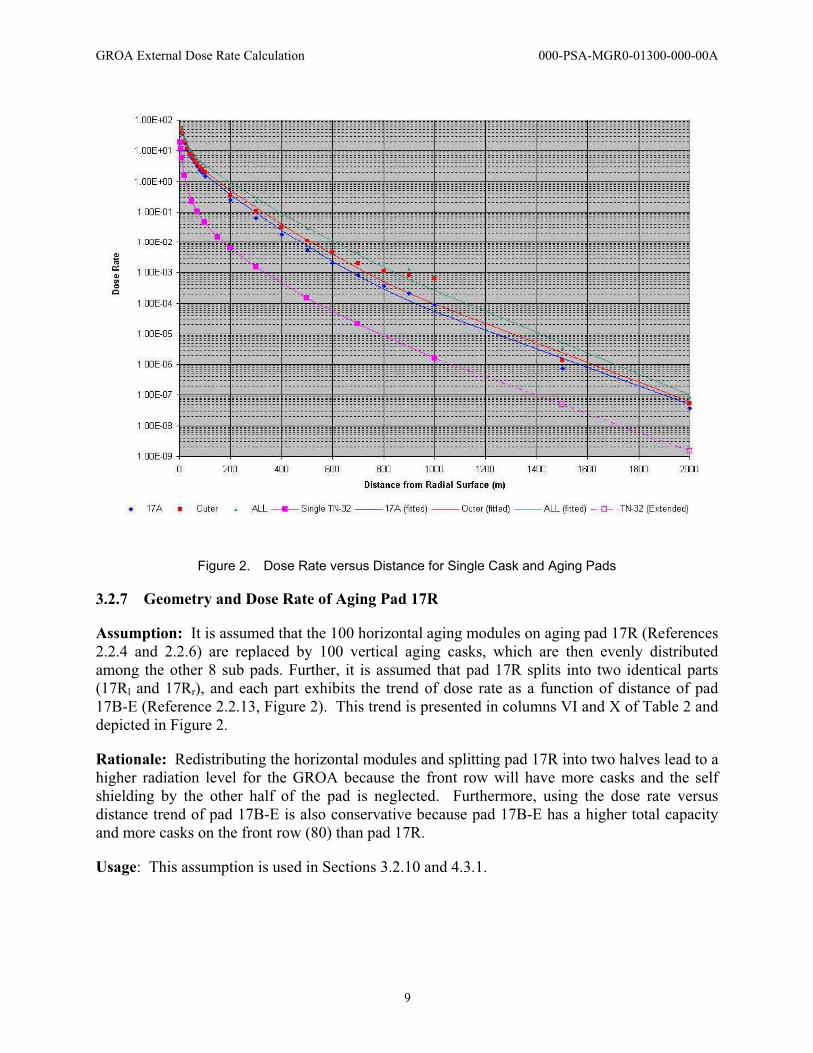
Figure 2. Dose Rate versus Distance for Single Cask and Aging Pads
3.2.7 Geometry and Dose Rate of Aging Pad 17R
Assumption: It is assumed that the 100 horizontal aging modules on aging pad 17R (References 2.2.4 and 2.2.6) are replaced by 100 vertical aging casks, which are then evenly distributed among the other 8 sub pads. Further, it is assumed that pad 17R splits into two identical parts (17Rl and 17Rr), and each part exhibits the trend of dose rate as a function of distance of pad 17B-E (Reference 2.2.13, Figure 2). This trend is presented in columns VI and X of Table 2 and depicted in Figure 2.
Rationale: Redistributing the horizontal modules and splitting pad 17R into two halves lead to a higher radiation level for the GROA because the front row will have more casks and the self shielding by the other half of the pad is neglected. Furthermore, using the dose rate versus distance trend of pad 17B-E is also conservative because pad 17B-E has a higher total capacity and more casks on the front row (80) than pad 17R.
Usage: This assumption is used in Sections 3.2.10 and 4.3.1.
9

10
GROA External Dose Rate Calculation 000-PSA-MGR0-01300-000-00A
3.2.8 Geometry and Materials of Aging Overpack
Assumption: It is assumed that the aging overpack has an inner diameter of 73 in. and its radial geometry consists of a layer of 2.5 in. stainless steel, followed by a layer of 26.5 in. concrete, and an outer layer of 1.0 in. stainless steel.
Rationale: Although an aging cask design is not available, aging overpacks (casks) are required to have a contact dose rate below 40 mrem/hr (Reference 2.2.9, Section 33.2.4.17). The configuration of the assumed aging cask, when loaded with the design basis (DB) PWR SNF (60 GWd/MTHM burnup, 4.0% intitial enrichment, and 10 years decay time), will render a total contact dose rate of 16.67 mrem/hr, of which 11.02 mrem/hr is primary gamma, 1.84 mrem/hr is neutron, and 3.80 mrem/hr is captured gamma (Attachment II, file: SAS1.zip/ a10e40b60.output or file: GammaSpectra.xls, worksheet Sources, cell H87). This total dose rate is below the 40 mrem/hr dose rate requirement.
Usage: This assumption is used in Section 4.3.1 and Attachment I.
3.2.9 Dose Rate of TN-32 Cask beyond 1000 m
Assumption: Dose rate from the TN-32 cask has been calculated out to 1000 m and results are presented in Table 3 (Reference 2.2.12 [DIRS 169308], Tables 6 and 7). For distances greater than 1000 m, it is assumed that the dose rate of the TN-32 cask follows the trend of pad 17A in Table 2, column VIII.
Rationale: Pad 17A consists of two rows of TN-32 casks, each row having 40 casks. The dose rate of pad 17A includes a contribution from casks on the second row by way of skyshine, which the single TN-32 cask does not have. Therefore, using the dose rate trend of pad 17A for the single TN-32 cask is conservative.
Table 3 presents dose rate versus distance for a single TN-32 storage cask loaded with the same commercial SNF with radiation source terms used in Table 2. Two configurations were modeled, one with ground and air and the other with void surrounding. The air in the model extends 2000 m above the cask. Since the relative errors are generally low (below 0.05), the dose rate trends generally follow smooth curves. The results in Table 3 are depicted in Figure 3, which also shows the effects of the air-ground versus void configurations for different distances. For close distances (approximately within 50 m) from a cask the effect of ground scattering is quite important. For the first 50 m from the cask, the air-over-ground geometry yields a higher dose rate than the void geometry. This can be attributed to the scattering effect of the ground, which increases the number of radiation particles reaching the points of interest. As the distance increases, the ground becomes less important, while the air attenuation effect gradually plays a more significant role.
Usage: This assumption is used in Sections 6.1.2 and 6.1.3.

Table 3. Dose Rates versus Distance for a TN-32 Cask
Distance from Cask Axis (m)
Distance from Cask
Surface (m)
Dose Rate, Air-Grounda
(mrem/hr) Relative Errora
Dose Rate, Voidb
(mrem/hr) Relative Errorb
Dose Rate Ratio
(Void/A-G)c [I] [II] [III] [IV] [V] [VI] [VII]5 3.76 1.88E+01 0.0069 1.66E+01 0.0051 8.83E-017 5.76 1.10E+01 0.0074 9.57E+00 0.0055 8.70E-0110 8.76 5.92E+00 0.0084 5.12E+00 0.0061 8.65E-0120 18.76 1.57E+00 0.0107 1.38E+00 0.0080 8.79E-0150 48.76 2.27E-01 0.0144 2.26E-01 0.0120 9.96E-0170 68.76 1.06E-01 0.0165 1.16E-01 0.0141 1.09E+00
100 98.76 4.55E-02 0.0184 5.74E-02 0.0169 1.26E+00150 148.76 1.50E-02 0.0202 2.52E-02 0.0205 1.68E+00200 198.76 6.32E-03 0.0216 1.43E-02 0.0235 2.26E+00300 298.76 1.51E-03 0.0245 6.22E-03 0.0295 4.12E+00500 498.76 1.45E-04 0.0274 2.40E-03 0.0368 1.66E+01700 698.76 2.10E-05 0.0322 1.18E-03 0.0431 5.62E+01
1000 998.76 1.60E-06 0.0306 5.41E-04 0.0520 3.38E+021500 1498.76 4.91E-08d N/A N/A N/A N/A2000 1998.76 1.51E-09d N/A N/A N/A N/A
aReference 2.2.12 [DIRS 169308], Table 6 bReference 2.2.12 [DIRS 169308], Table 7 cColumn [V] � Column [III]dCalculated using the same trend as pad 17A (Column VIII in Table 2), see worksheet TN-32 of Summary.xls in Attachment II
1.00E+03
1.00E+02
1.00E+01
1.00E+00
1.00E-01 Air-Ground Void Void/A-G 1.00E-02
1.00E-03
1.00E-04
1.00E-05
1.00E-06 0 100 200 300 400 500 600 700 800 900 1000
Distance from Cask Axis (m)
Dos
e R
ate
(mre
m/h
r)
GROA External Dose Rate Calculation 000-PSA-MGR0-01300-000-00A
Source: Worksheet Ch2-TN-32 of Summary.xls in Attachment II.
Figure 3. Dose Rate versus Distance for a TN-32 Storage Cask
11

12
GROA External Dose Rate Calculation 000-PSA-MGR0-01300-000-00A
3.2.10 Symmetry of Aging Pads
Assumption: Based on Assumptions 3.2.6 and 3.2.7, the Aging Facility is represented by three pads, namely 17P, 17Rl, and 17Rr with the casks arranged in rows in the east-west orientation. With this configuration, radiation levels due to the aging pads are higher on the north and south sides than on the east and west sides. It is assumed that (1) the radiation levels on the north and south sides of the aging pads are used for all four sides, (2) the receptor points on the east-west sides are exposed to the same number of casks as the receptor points on the north-south sides.
Rationale: The rationale is that the numbers of aging casks in the front row facing the north and south sides are more than double those facing the east and west sides. Therefore, using the radiation levels on the north and south sides to represent those on the east and west sides will result in higher and more conservative dose rate for the GROA.
Usage: This assumption is used in Section 6.1.1.

13
GROA External Dose Rate Calculation 000-PSA-MGR0-01300-000-00A
4. METHODOLOGY
4.1 QUALITY ASSURANCE
This calculation was prepared in accordance with EG-PRO-3DP-G04B-00037, Calculations and Analyses (Reference 2.1.1) and LS-PRO-0201, Preclosure Safety Analyses Process (Reference 2.1.3). The results of this calculation will be used in calculations and analyses to determine the radiological hazards for facilities important to safety and to demonstrate conformance of the repository design to the performance objectives of 10 CFR (Code of Federal Regulations) 63.111 (Reference 2.2.1 [180319]). Therefore, the approved version is designated as QA: QA.
4.2 USE OF COMPUTER SOFTWARE
4.2.1 SAS1 Sequence of SCALE Version 4.4A Code
The SAS1 sequence of the SCALE 4.4A code (Reference 2.2.2) is used to calculate dose rates at detector points beyond the radial surface of a transportation cask or an aging overpack.
The software specifications are as follows:
�� Program Name: SCALE
�� Version /Revision Number: Version 4.4A
�� Operating System: HP-UX B 10.20
�� Software Tracking Number: 10129-4.4A-00
�� Computer Type: HP 9000/700 Series workstation.
The SAS1 sequence of the SCALE 4.4A software (Reference 2.2.2) is: (a) appropriate for one-dimensional shielding calculations, (b) used within the range of validation as documented in Reference 2.2.16, Validation Test Report (VTR) for SCALE-4.4A, and (c) obtained from Software Configuration Management in accordance with the appropriate procedure (Reference 2.1.2). Therefore, the SCALE code Version 4.4A (Reference 2.2.2) is suitable for use in this calculation.
The SAS1 input and output file for this calculation is included in Attachment II, ZIP file SAS1.zip.
4.2.2 Exempt Software
Microsoft Excel 2000 SR-1, which is a component of Microsoft Office 2000, is used for performing simple calculations. It was executed on a personal computer running the Microsoft Windows 2000 operating system. The results were verified by hand calculations.
The software specifications are as follows:

GROA External Dose Rate Calculation 000-PSA-MGR0-01300-000-00A
14
�� Program Name: Excel �� Version/Revision Number: Microsoft® Excel 2000 SR-1 �� This software is installed on a personal computer running Microsoft Windows 2000
(central processing unit number YMP001874)
Usage of Microsoft Office 2000 in this calculation constitutes Level 2 software usage, as defined in IT-PRO-0011 (Reference 2.1.2, Attachment 12). Microsoft Office 2000 is listed in the Repository Project Management Automation Plan (Reference 2.1.4, Table 6-1).
MathCAD, version 13.0 is used to perform calculations as documented in Section 6 of this calculation. The user-defined formulas, input, and results are provided in sufficient detail in Section 6 to allow independent verification of the various computations without recourse to the originator. The validation of calculating dose rates with MathCAD is documented in Attachment II.
MathCAD is installed on a personal computer running Microsoft Windows 2000 (Central Processing Unit Number: 152303). Usage of MathCAD in this calculation constitutes Level 2 software usage, as defined in IT-PRO-0011 (Reference 2.1.2, Attachment 12) and is listed in the Repository Project Management Automation Plan (Reference 2.1.4, Table 6-1).
To obtain the inputs of coordinates, Bentley View 08.01.02.18, also a commercial off-the-shelf software, is used to read out coordinate data from the GROA CAD file (provided in the CD in Attachment II). Usage of Bentley View in this calculation constitutes Level 2 software usage, as defined in IT-PRO-0011 (Reference 2.1.2, Attachment 12) and is listed in the Repository Project Management Automation Plan (Reference 2.1.4, Table 6-1).
With the calculated results from MathCAD, Surfer 8.04, another commercial off-the-shelf software, is used in graphic presentations of the radiation dose rate isopleths at the GROA. Usage of Surfer 8.04 software in this calculation constitutes Level 2 software usage, as defined in IT-PRO-0011 (Reference 2.1.2, Attachment 12).
4.3 METHOD
The external radiation levels calculated in this document are due to radiation emitted from loaded casks stored at various areas within the GROA. These areas include the aging pads (17P and 17R), the rail buffer area (33A), the truck buffer area (33B), and TEV within the GROA.
Calculation of dose rates due to casks in the GROA involves deep-penetration shielding analyses with complicated geometry. Radiation dose rates at locations beyond 1000 m from the sources are needed in order to construct a dose-rate contour map of the GROA. For the radiation sources (neutrons and photons) emitted from a typical cask, 1000 m corresponds to more than 10 meanfree-paths. For this air-over-ground environment, three conditions influence the transport of radiation particles that determine the dose rate. The first condition is the attenuation effect of the air between the sources and the points of interest. The second condition is the scattering effect of the ground. The third condition is the scattering effect of air above the casks, which is also known as sky shine.

GROA External Dose Rate Calculation 000-PSA-MGR0-01300-000-00A
15
Generally, for close distances (approximately within 50 m) from a cask the effect of ground scattering is quite important, while the attenuation and sky shine effects of air are almost negligible compared to the uncollided and ground-scattered radiation. However, for distances greater than 70 m the attenuation effect of air becomes increasingly important and the sky shine contribution should be considered. This is demonstrated in Table 3 where the dose rates as a function of distance from a TN-32 cask in an air-over-ground environment and in a void are presented (Reference 2.2.12 [DIRS 169308], Tables 6 and 7). For the first 50 m from the cask, the air-over-ground geometry yields a higher dose rate than the void geometry. This can be attributed to the scattering effect of the ground, which increases the number of radiation particles reaching the points of interest. As distance increases, the ground becomes less important, while the air attenuation effect gradually plays a more significant role. The numerical results in Table 3 are graphically presented in Figure 3, which vividly shows that at distances greater than 100 m air attenuation reduces radiation dose rate logarithmically. At the distance of 1000 m, the calculation overestimates the dose rate by a factor of 338 when air is not modeled.
This calculation develops a dose rate versus distance curve for each of the sources in the GROA. The dose rate at any receptor point in the GROA due to radiation emitted from all sources onsite is calculated by summing dose rate components from the various sources as:
5
Dk � � DRk�i� (Equation 1)
i�1
where
Dk = Total dose rate (mrem/hr) at receptor k
i = i-th cask storage area (i = 1, 2, 3, 4, and 5 for 17Rr, 17Rl, 17P, 33A, and 33B.
DRk �i� = Dose rate (mrem/hr) at receptor k due to radiation emitted from cask storage
area i.
The approach of determining DRk�i� ignores any buildings between the receptor and the source
(Assumption 3.2.3). Since the dose rate versus distance curve is one dimensional, it is sufficient to determine the dose rate between any receptor and source points, as in the case for the buffer areas where the distance is measured from the axis of a transportation cask to the receptor point (Section 4.3.2). However, for the Aging Facility each pad is treated as an area source, and the calculation of DRk
�i� is described in Sections 4.3.1 and 6.1.1.
With Equation 1, selected receptor locations of interest are generated for the entire GROA. Then, the dose rate contour map is constructed using the software Surfer 8.04 to graphically present dose rate isopleths within the GROA. The dose rate contour map represents contributions from the fully loaded Aging Facility and the buffer areas. The contributions from any single cask or TEV are not incorporated in the contour since they are transient sources and they only affect their immediate vicinities. Hence, single cask and TEV impacts to the entire
16
GROA External Dose Rate Calculation 000-PSA-MGR0-01300-000-00A
GROA are small. Therefore, for the single-cask sources, only their dose-rate curves will be determined.
In the sections to follow, the determination of the dose-rate function for each source is described.
4.3.1 Aging Pads 17P and 17R
The current Aging Facility consists of aging pads 17P and 17R (Reference 2.2.4). The Aging Facility provides 2,500 aging spots that can accommodate 21,000 MTHM (metric tons heavy metal) of commercial SNF (Reference 2.2.9, Section 10.2.1.2). For radiation dose rate determination, the Aging Facility is assumed to be at full capacity (Assumption 3.2.1), and is treated as two separate radiation sources, pads 17P and 17R (Assumption 3.2.2). Further, aging pad 17P is transformed to a rectangular geometry consisting of 6 sub pads, each of which has 13 groups of 4x4 (or 16) cask spots (Assumption 3.2.6), while aging pad 17R is divided into two identical pads, 17Rr and 17Rl (Assumption 3.2.7). Therefore, the Aging Facility has been divided into three separate aging pads, each assumes the dose rate versus distance trend of pad 17B-E (Assumptions 3.2.6 and 3.2.7). This trend is depicted in Figure 2 and designated as “ALL (fitted)”.
The dose rate versus distance for each aging pad is determined by normalizing the dose rate in column X of Table 2 by the capacity (number of aging casks) of the pad and by the ratio of the representative dose rate of the aging cask to dose rate of the TN-32 cask at 100 m. The reason for selecting this distance is that the dose rate ratio between the aging cask and TN-32 cask reaches an asymptotic value at 100 m and beyond. More discussion on the dose rate normalization is presented in Section 6.1.1. The representative dose rate of the aging cask is determined using the aging cask configuration from Assumption 3.2.8 and a TAD-based waste stream arrival scenario from Reference 2.2.8 ([DIRS 180185], Section 4.3). The development of the aging cask representative dose rate is presented in Attachment I.
4.3.2 Transportation Cask Buffer Areas
The external radiation dose rate to a receptor from transportation casks stored at buffer areas 33A and 33B has the same trend as that from the TN-32 cask (Assumption 3.2.5). The radiation levels external to buffer area 33A were calculated out to 150 m (Reference 2.2.7 [DIRS 180131], Figure 7). These dose rates are not used directly in this calculation since the calculation model does not include air and ground, and the dose rates only extend out to 150 m. Rather, these results are used to determine the scaling factor, which is applied to the dose rate trend of the TN32 cask to estimate the dose rate versus distance from buffer area 33A. The scaling factor is determined by comparing the dose rates at various distances from the TN-32 cask and from the buffer area from Reference 2.2.7, ([DIRS 180131], Figure 7). The scaling factor is estimated to be 1.31 in Attachment II, file Summary.xls, worksheet staging. The value 1.31 is selected because it gives the highest (conservative) dose rates due to buffer area 33A (Attachment II, file Summary.xls, worksheet staging, cells I4 to I8).
The total dose rate versus distance from buffer area 33A is divided by its capacity of 25 casks (Reference 2.2.9, Section 9.9.2.2.1) to obtain the dose rate curve per cask in buffer area 33A. This single cask dose rate curve is used to develop the dose rate to a receptor in the GROA due

17
GROA External Dose Rate Calculation 000-PSA-MGR0-01300-000-00A
to buffer area 33A in the following manner. Each transportation cask is treated as a source, and the casks are arranged in a 5-by-5 matrix of individual sources with separation distances of 10 m between columns of casks and 30 m between casks in a column, respectively. The total dose rate from buffer 33A to a receptor, DR�4�
k , is the sum of dose rates from the individual sources to the receptor. The distance is measured from the axis of a transportation cask to the receptor. There is no self-shielding among the casks since the dose rate is due to the entire buffer area as an entity. The treatment of each cask as a point source is merely for the convenience of dose rate contour generation.
Similarly, buffer area 33B, which has a capacity of 5 truck casks (Reference 2.2.9, Section 9.8.2.1.3), is arranged as 5 source points 15 m apart in a linear pattern. The dose rate for a single truck cask in buffer area 33B is calculated by multiplying the dose rate of the TN-32 cask by a scaling factor. This scaling factor is determined by comparing the ratios of dose rates at various distances between TS125 and TN-32 casks. The dose rate versus distance for a TS125 cask is taken from Reference 2.2.7 ([DIRS 180131], Figure 8, file TR-final.xls). The scaling factor is estimated to be 0.272 in Attachment II, file Summary.xls, worksheet TN-32, cell H32. The factor 0.272 is selected because it results in the highest (conservative) dose rates due to a single transportation cask. The total dose rate to a receptor due to buffer area 33B, DR�5�
k , is the sum of dose rates from the 5 individual source points to the receptor.
4.3.3 Transportation Cask and TEV
For distances greater than 50 m, the dose rate as a function of distance from a transportation cask, a TEV, or any single cask has the same trend as that from the TN-32 cask (Assumption 3.2.4). The absolute dose rates versus distances for a transportation cask, a TEV, or any single cask are determined using a multiplying factor that is the ratio of surface dose rate of the cask in question to that of the TN-32 cask. However, the contributions from any single cask or TEV are not incorporated in the contour since they only affect their immediate vicinities and their impacts to the entire GROA are small. Therefore, for the single-cask sources, only their dose-rate curves are determined.
4.4 REGULATION
4.4.1 10 CFR Part 71
The 10 CFR 71.47 external radiation standards for all packages state that for the transport of SNF under normal conditions, the dose rates must not exceed 200 mrem/hr at any point on the external surface of the package and 10 mrem/hr at any point 2 m from the outer lateral surfaces of the vehicle.
In accordance with this regulation, all rail and truck transportation casks are expected to meet the dose rate limits of 200 mrem/hr on the external surface of the cask and 10 mrem/hr at 2 m from the surface of the cask.

18
GROA External Dose Rate Calculation 000-PSA-MGR0-01300-000-00A
5. LIST OF ATTACHMENTS
Number of Pages Attachment I. Representative Dose Rate of Aging Cask 4 Attachment II. Electronic Files on Attached CD 1 and CD 1 of 1

19
GROA External Dose Rate Calculation 000-PSA-MGR0-01300-000-00A
6. BODY OF CALCULATIONS
6.1 INPUT PARAMETERS
6.1.1 Dose Rates from Aging Pads, 17P, 17Rr, and 17Rl
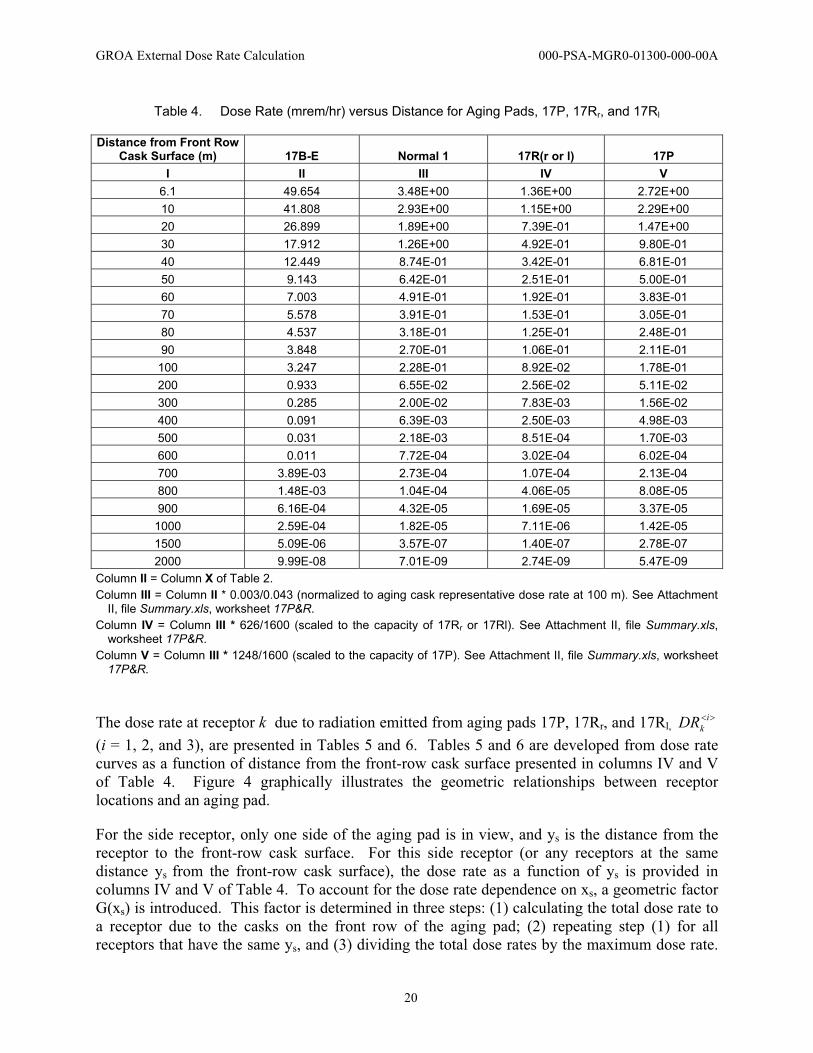
As described in Section 4.3.1, the Aging Facility has been divided into three separate pads 17P, 17Rr, and 17Rl. The dose rates as a function of distance for the aging pads are presented in Table 4.
In Table 4, dose rates for pad 17B-E in column II are the starting trend for aging pad dose rate generation. Since pad 17B-E is filled with TN-32 casks but pads 17P, 17Rr, and 17Rl are occupied by aging casks with the representative dose rate, the dose rates in column II must be normalized to the representative dose rate of the aging casks. Based on the comparision of dose rates versus distance between the TN-32 cask and the aging cask loaded with the design basis SNF, the dose rate ratio between the aging cask and a TN-32 cask reaches an asymptotic value of 0.157 at a distance of 100 m and beyond (Attachment II, file Summary.xls, worksheet TN-32, cell I53). Therefore, 100 m is the distance at which normalization is performed to obtain a representative dose rate curve for the aging cask. The dose rate from the TN-32 cask is 0.043 mrem/hr at 100 m (Attachment II, file Summary.xls, worksheet TN-32, cell H53). The development of the aging cask representative dose rate is provided in Attachment I. The results are captured in an EXCEL worksheet in Attachment II (PWR_Source.xls/C1aDR@100m, cell U9). The aging cask representative dose rate at 100 m is 0.00316 mrem/hr, which occurs in year 2036, and is rounded to 0.003 mrem/hr. The representative dose rate is the maximum of the assembly-weighted annual average dose rate for the aging cask.
In Table 4, the dose rates in column II are multiplied by the factor (0.003/0.043), where 0.003 and 0.043 are the dose rates in mrem/hr at 100 m from the aging cask and from the TN-32 cask, respectively. These normalized dose rates are then scaled to the capacities of pads 17P, 17Rr, and 17Rl, relative to the capacity of pad 17B-E. The justification of this scaling process is that pads 17P, 17Rr, 17Rl, and 17B-E all share the following common features: (1) they all have a similar rectangular shape, (2) they have multiple rows of casks in an orderly pattern, (3) the radiation fields from these pads are composed of both direct and sky shine components. The capacities are 1600 casks for pad 17B-E (Reference 2.2.13 [DIRS 172499] Figure 2), 1248 for pad 17P (Reference 2.2.4), and 626 ([1152+100]/2) for pad 17Rr, or 17Rl (Reference 2.2.6). The resulting dose rate curves as a function of distance from the front-row cask surface are presented in column IV for pads 17Rr or 17Rl, and in column V for pad 17P.
20
GROA External Dose Rate Calculation 000-PSA-MGR0-01300-000-00A
Table 4. Dose Rate (mrem/hr) versus Distance for Aging Pads, 17P, 17Rr, and 17Rl
Distance from Front Row Cask Surface (m) 17B-E Normal 1 17R(r or l) 17P
I II III IV V 6.1 49.654 3.48E+00 1.36E+00 2.72E+00 10 41.808 2.93E+00 1.15E+00 2.29E+00 20 26.899 1.89E+00 7.39E-01 1.47E+00 30 17.912 1.26E+00 4.92E-01 9.80E-01 40 12.449 8.74E-01 3.42E-01 6.81E-01 50 9.143 6.42E-01 2.51E-01 5.00E-01 60 7.003 4.91E-01 1.92E-01 3.83E-01 70 5.578 3.91E-01 1.53E-01 3.05E-01 80 4.537 3.18E-01 1.25E-01 2.48E-01 90 3.848 2.70E-01 1.06E-01 2.11E-01 100 3.247 2.28E-01 8.92E-02 1.78E-01 200 0.933 6.55E-02 2.56E-02 5.11E-02 300 0.285 2.00E-02 7.83E-03 1.56E-02 400 0.091 6.39E-03 2.50E-03 4.98E-03 500 0.031 2.18E-03 8.51E-04 1.70E-03 600 0.011 7.72E-04 3.02E-04 6.02E-04 700 3.89E-03 2.73E-04 1.07E-04 2.13E-04 800 1.48E-03 1.04E-04 4.06E-05 8.08E-05 900 6.16E-04 4.32E-05 1.69E-05 3.37E-05
1000 2.59E-04 1.82E-05 7.11E-06 1.42E-05 1500 5.09E-06 3.57E-07 1.40E-07 2.78E-07 2000 9.99E-08 7.01E-09 2.74E-09 5.47E-09
Column II = Column X of Table 2. Column III = Column II * 0.003/0.043 (normalized to aging cask representative dose rate at 100 m). See Attachment
II, file Summary.xls, worksheet 17P&R. Column IV = Column III * 626/1600 (scaled to the capacity of 17Rr or 17Rl). See Attachment II, file Summary.xls,
worksheet 17P&R. Column V = Column III * 1248/1600 (scaled to the capacity of 17P). See Attachment II, file Summary.xls, worksheet
17P&R.
The dose rate at receptor k due to radiation emitted from aging pads 17P, 17R , and 17R DR�i� r l, k
(i = 1, 2, and 3), are presented in Tables 5 and 6. Tables 5 and 6 are developed from dose rate curves as a function of distance from the front-row cask surface presented in columns IV and V of Table 4. Figure 4 graphically illustrates the geometric relationships between receptor locations and an aging pad.
For the side receptor, only one side of the aging pad is in view, and ys is the distance from the receptor to the front-row cask surface. For this side receptor (or any receptors at the same distance ys from the front-row cask surface), the dose rate as a function of ys is provided in columns IV and V of Table 4. To account for the dose rate dependence on xs, a geometric factor G(xs) is introduced. This factor is determined in three steps: (1) calculating the total dose rate to a receptor due to the casks on the front row of the aging pad; (2) repeating step (1) for all receptors that have the same ys, and (3) dividing the total dose rates by the maximum dose rate.
21
GROA External Dose Rate Calculation 000-PSA-MGR0-01300-000-00A
The last step normalizes the geometric factor to the values, 1.0 � G(xs) � 0. The dose rates are multiplied by the geometric factor in columns IV and V of Table 4 to obtain the dose rate DRk
�i�
for the side receptor in Tables 5 and 6. The development of Tables 5 and 6 is performed in the MathCAD file Edge_Effect.xmcd, which is included in Attachment II.
For a corner receptor, the same three steps for the side receptor are repeated since the corner receptor is exposed to two sides of the aging pads. In accordance with Assumption 3.2.10, a corner receptor is exposed to the same number of casks on the aging pads.
Tables 5 and 6 form lookup tables for the dose rate from aging pads at the relative coordinates of the receptor locations (illustrated as in Figure 4). With the lookup tables and the MathCAD interpolation function, interp, the dose rate at any receptor location can be calculated. The calculation is performed in the MathCAD file Edge_Effect.xmcd, which is included in Attachment II.

GROA External Dose Rate Calculation 000-PSA-MGR0-01300-000-00A
Yc= 1~2000m
Comer ReceptorLocation
Side ReceptorLocation xa=(}-.1OS mto, 17R/tmd 17R~ (}-'1~ mto, 17P
1- '~r
1--- F ~ ..
i¢ Ya= 15-0-2000 mii
~ .. ~Ii --- x = r: ..i ci 15-0-2000 mi ." ,,IIIII
Aginq Pad
Figure 4. Relative Coordinates of Receptor Locations for An Aging Pad
22

Tabl
e 5.
D
ose
Rat
e D
R�i�
ver
sus
Dis
tanc
e fo
r Agi
ng P
ads
17R
r and
17R
l
* Dis
tanc
e to
Fro
nt
R
ow, Y
s/Xs (
m)
Side
Dos
e R
ates
(mre
m/h
r)
0.00
E+0
8.09
E+0
1.62
E+1
2.43
E+1
3.24
E+1
4.04
E+1
4.85
E+1
5.66
E+1
6.47
E+1
7.28
E+1
8.09
E+1
8.90
E+1
9.71
E+1
1.05
E+2
1.50
E+01
9.
19E
-01
9.19
E-0
1 9.
17E
-01
9.15
E-0
1 9.
11E
-01
9.06
E-0
1 8.
99E
-01
8.89
E-0
1 8.
75E
-01
8.55
E-0
1 8.
24E
-01
7.73
E-0
1 6.
84E
-01
5.38
E-0
1
2.00
E+01
7.
39E
-01
7.38
E-0
1 7.
37E
-01
7.34
E-0
1 7.
30E
-01
7.25
E-0
1 7.
17E
-01
7.07
E-0
1 6.
92E
-01
6.71
E-0
1 6.
41E
-01
5.96
E-0
1 5.
25E
-01
4.25
E-0
1
3.00
E+01
4.
92E
-01
4.91
E-0
1 4.
90E
-01
4.87
E-0
1 4.
83E
-01
4.78
E-0
1 4.
70E
-01
4.60
E-0
1 4.
47E
-01
4.29
E-0
1 4.
05E
-01
3.73
E-0
1 3.
31E
-01
2.81
E-0
1
5.00
E+01
2.
51E
-01
2.51
E-0
1 2.
49E
-01
2.47
E-0
1 2.
44E
-01
2.40
E-0
1 2.
35E
-01
2.28
E-0
1 2.
20E
-01
2.09
E-0
1 1.
97E
-01
1.82
E-0
1 1.
65E
-01
1.46
E-0
1
7.50
E+01
1.
38E
-01
1.37
E-0
1 1.
36E
-01
1.35
E-0
1 1.
33E
-01
1.30
E-0
1 1.
27E
-01
1.23
E-0
1 1.
18E
-01
1.12
E-0
1 1.
06E
-01
9.93
E-0
2 9.
19E
-02
8.41
E-0
2
1.00
E+02
8.
92E
-02
8.90
E-0
2 8.
84E
-02
8.74
E-0
2 8.
61E
-02
8.43
E-0
2 8.
21E
-02
7.96
E-0
2 7.
67E
-02
7.33
E-0
2 6.
97E
-02
6.58
E-0
2 6.
17E
-02
5.74
E-0
2
1.50
E+02
4.
44E
-02
4.43
E-0
2 4.
40E
-02
4.36
E-0
2 4.
30E
-02
4.23
E-0
2 4.
14E
-02
4.03
E-0
2 3.
91E
-02
3.78
E-0
2 3.
64E
-02
3.48
E-0
2 3.
32E
-02
3.16
E-0
2
2.00
E+02
2.
56E
-02
2.56
E-0
2 2.
55E
-02
2.53
E-0
2 2.
50E
-02
2.46
E-0
2 2.
42E
-02
2.37
E-0
2 2.
31E
-02
2.25
E-0
2 2.
18E
-02
2.11
E-0
2 2.
03E
-02
1.95
E-0
2
3.00
E+02
7.
83E
-03
7.82
E-0
3 7.
79E
-03
7.75
E-0
3 7.
69E
-03
7.61
E-0
3 7.
52E
-03
7.41
E-0
3 7.
29E
-03
7.15
E-0
3 7.
00E
-03
6.84
E-0
3 6.
68E
-03
6.50
E-0
3
5.00
E+02
8.
51E
-04
8.51
E-0
4 8.
49E
-04
8.47
E-0
4 8.
43E
-04
8.38
E-0
4 8.
33E
-04
8.26
E-0
4 8.
19E
-04
8.10
E-0
4 8.
01E
-04
7.91
E-0
4 7.
80E
-04
7.69
E-0
4
7.50
E+02
6.
50E
-05
6.50
E-0
5 6.
49E
-05
6.48
E-0
5 6.
46E
-05
6.44
E-0
5 6.
41E
-05
6.38
E-0
5 6.
35E
-05
6.31
E-0
5 6.
26E
-05
6.22
E-0
5 6.
16E
-05
6.11
E-0
5
1.00
E+03
7.
11E
-06
7.11
E-0
6 7.
10E
-06
7.09
E-0
6 7.
08E
-06
7.07
E-0
6 7.
05E
-06
7.02
E-0
6 7.
00E
-06
6.97
E-0
6 6.
94E
-06
6.90
E-0
6 6.
86E
-06
6.82
E-0
6
1.50
E+03
1.
40E
-07
1.40
E-0
7 1.
40E
-07
1.40
E-0
7 1.
39E
-07
1.39
E-0
7 1.
39E
-07
1.39
E-0
7 1.
38E
-07
1.38
E-0
7 1.
38E
-07
1.37
E-0
7 1.
37E
-07
1.36
E-0
7
2.00
E+03
2.
74E
-09
2.74
E-0
9 2.
74E
-09
2.74
E-0
9 2.
74E
-09
2.74
E-0
9 2.
73E
-09
2.73
E-0
9 2.
72E
-09
2.72
E-0
9 2.
71E
-09
2.71
E-0
9 2.
70E
-09
2.69
E-0
9
* Dis
tanc
e to
Fro
nt
R
ow, Y
c/Xc (
m)
Cor
ner D
ose
Rat
es (m
rem
/hr)
1.
50E+
1 2.
00E+
1 3.
00E+
1 5.
00E+
1 7.
50E+
1 1.
00E+
2 1.
50E+
2 2.
00E+
2 3.
00E+
2 5.
00E+
2 7.
50E+
2 1.
00E+
3 1.
50E+
3 2.
00E+
3 1.
50E+
1 0.
428
0.36
9 0.
275
0.16
0.
095
0.06
4 0.
034
0.02
1 6.
85E
-03
8.26
E-0
4 6.
86E
-05
7.92
E-0
6 1.
77E
-07
3.96
E-0
9 2.
00E+
1 0.
375
0.33
3 0.
258
0.15
5 0.
094
0.06
4 0.
034
0.02
1 6.
84E
-03
8.31
E-0
4 6.
95E
-05
8.06
E-0
6 1.
82E
-07
4.12
E-0
9 3.
00E+
1 0.
281
0.26
1 0.
215
0.13
9 0.
087
0.06
0.
033
0.02
6.
70E
-03
8.27
E-0
4 7.
00E
-05
8.18
E-0
6 1.
87E
-07
4.28
E-0
9 5.
00E+
1 0.
163
0.15
7 0.
139
0.10
1 0.
069
0.05
0.
029
0.01
8 6.
21E
-03
7.95
E-0
4 6.
86E
-05
8.10
E-0
6 1.
87E
-07
4.32
E-0
9 7.
50E+
1 0.
097
0.09
5 0.
088
0.07
0.
051
0.03
9 0.
024
0.01
5 5.
61E
-03
7.54
E-0
4 6.
70E
-05
8.04
E-0
6 1.
90E
-07
4.42
E-0
9 1.
00E+
2 0.
065
0.06
5 0.
061
0.05
0.
039
0.03
1 0.
02
0.01
3 5.
07E
-03
7.18
E-0
4 6.
58E
-05
8.05
E-0
6 1.
95E
-07
4.62
E-0
9 1.
50E+
2 0.
035
0.03
5 0.
033
0.02
9 0.
024
0.02
0.
014
9.89
E-0
3 4.
09E
-03
6.46
E-0
4 6.
37E
-05
8.13
E-0
6 2.
08E
-07
5.14
E-0
9 2.
00E+
2 0.
021
0.02
1 0.
02
0.01
8 0.
016
0.01
4 9.
97E
-03
7.22
E-0
3 3.
24E
-03
5.72
E-0
4 6.
09E
-05
8.17
E-0
6 2.
22E
-07
5.69
E-0
9 3.
00E+
2 7.
01E
-03
6.99
E-0
3 6.
85E
-03
6.35
E-0
3 5.
73E
-03
5.17
E-0
3 4.
15E
-03
3.26
E-0
3 1.
73E
-03
3.85
E-0
4 4.
82E
-05
7.18
E-0
6 2.
16E
-07
5.81
E-0
9 5.
00E+
2 8.
44E
-04
8.48
E-0
4 8.
43E
-04
8.10
E-0
4 7.
68E
-04
7.30
E-0
4 6.
54E
-04
5.76
E-0
4 3.
86E
-04
1.26
E-0
4 2.
22E
-05
4.25
E-0
6 1.
56E
-07
4.59
E-0
9 7.
50E+
2 6.
98E
-05
7.06
E-0
5 7.
11E
-05
6.96
E-0
5 6.
79E
-05
6.66
E-0
5 6.
41E
-05
6.10
E-0
5 4.
80E
-05
2.21
E-0
5 5.
88E
-06
1.52
E-0
6 6.
98E
-08
2.34
E-0
9 1.
00E+
3 8.
05E
-06
8.18
E-0
6 8.
28E
-06
8.20
E-0
6 8.
13E
-06
8.12
E-0
6 8.
16E
-06
8.16
E-0
6 7.
15E
-06
4.22
E-0
6 1.
52E
-06
4.82
E-0
7 2.
70E
-08
1.08
E-0
9 1.
50E+
3 1.
78E
-07
1.83
E-0
7 1.
88E
-07
1.88
E-0
7 1.
90E
-07
1.95
E-0
7 2.
07E
-07
2.20
E-0
7 2.
13E
-07
1.53
E-0
7 6.
89E
-08
2.67
E-0
8 2.
21E
-09
1.35
E-1
0 2.
00E+
3 3.
96E
-09
4.11
E-0
9 4.
27E
-09
4.31
E-0
9 4.
40E
-09
4.58
E-0
9 5.
06E
-09
5.58
E-0
9 5.
67E
-09
4.47
E-0
9 2.
29E
-09
1.06
E-0
9 1.
33E
-10
1.34
E-1
1
GR
OA
Ext
erna
l Dos
e R
ate
Cal
cula
tion
000-
PSA
-MG
R0-
0130
0-00
0-00
A
k
ine
dist
ance
to A
ging
Pad
s.)
rm (
*See
Fig
ure
4 to
det
ey.
xls
arS
umm
of
Agi
ngS
ourc
e: W
orks
heet

GR
OA
Ext
erna
l Dos
e R
ate
Cal
cula
tion
000-
PSA
-MG
R0-
0130
0-00
0-00
A
Tabl
e 6.
D
ose
Rat
e D
R�i�
ver
sus
Dis
tanc
e fo
r Agi
ng P
ad 1
7P
k
* Dis
tanc
e to
Fro
nt
Row
, Ys/X
s (m
) Si
de D
ose
Rat
es (m
rem
/hr)
0.
00E+
0 1.
18E+
1 2.
35E+
1 3.
52E+
1 4.
70E+
1 5.
87E+
1 7.
05E+
1 8.
22E+
1 9.
40E+
1 1.
06E+
2 1.
18E+
2 1.
29E+
2 1.
41E+
2 1.
53E+
2 1.
50E+
01
1.83
E+0
0 1.
83E
+00
1.83
E+0
0 1.
83E
+00
1.82
E+0
0 1.
82E
+00
1.81
E+0
0 1.
79E
+00
1.77
E+0
0 1.
74E
+00
1.70
E+0
0 1.
61E
+00
1.43
E+0
0 1.
06E
+00
2.00
E+01
1.
47E
+00
1.47
E+0
0 1.
47E
+00
1.47
E+0
0 1.
46E
+00
1.46
E+0
0 1.
44E
+00
1.43
E+0
0 1.
41E
+00
1.38
E+0
0 1.
33E
+00
1.25
E+0
0 1.
10E
+00
8.31
E-0
1
3.00
E+01
9.
80E
-01
9.80
E-0
1 9.
78E
-01
9.75
E-0
1 9.
69E
-01
9.62
E-0
1 9.
52E
-01
9.37
E-0
1 9.
17E
-01
8.87
E-0
1 8.
43E
-01
7.77
E-0
1 6.
78E
-01
5.42
E-0
1
5.00
E+01
5.
01E
-01
5.00
E-0
1 4.
98E
-01
4.95
E-0
1 4.
91E
-01
4.85
E-0
1 4.
76E
-01
4.65
E-0
1 4.
50E
-01
4.30
E-0
1 4.
04E
-01
3.69
E-0
1 3.
26E
-01
2.77
E-0
1
7.50
E+01
2.
74E
-01
2.74
E-0
1 2.
72E
-01
2.70
E-0
1 2.
67E
-01
2.62
E-0
1 2.
56E
-01
2.48
E-0
1 2.
38E
-01
2.26
E-0
1 2.
12E
-01
1.95
E-0
1 1.
75E
-01
1.55
E-0
1
1.00
E+02
1.
78E
-01
1.77
E-0
1 1.
76E
-01
1.75
E-0
1 1.
72E
-01
1.69
E-0
1 1.
64E
-01
1.59
E-0
1 1.
52E
-01
1.45
E-0
1 1.
36E
-01
1.26
E-0
1 1.
15E
-01
1.03
E-0
1
1.50
E+02
8.
85E
-02
8.83
E-0
2 8.
76E
-02
8.66
E-0
2 8.
52E
-02
8.34
E-0
2 8.
11E
-02
7.84
E-0
2 7.
54E
-02
7.19
E-0
2 6.
81E
-02
6.40
E-0
2 5.
97E
-02
5.52
E-0
2
2.00
E+02
5.
11E
-02
5.10
E-0
2 5.
06E
-02
5.00
E-0
2 4.
93E
-02
4.82
E-0
2 4.
70E
-02
4.56
E-0
2 4.
40E
-02
4.22
E-0
2 4.
03E
-02
3.83
E-0
2 3.
61E
-02
3.39
E-0
2
3.00
E+02
1.
56E
-02
1.56
E-0
2 1.
55E
-02
1.53
E-0
2 1.
52E
-02
1.49
E-0
2 1.
46E
-02
1.43
E-0
2 1.
39E
-02
1.34
E-0
2 1.
30E
-02
1.25
E-0
2 1.
20E
-02
1.14
E-0
2
5.00
E+02
1.
70E
-03
1.70
E-0
3 1.
69E
-03
1.68
E-0
3 1.
67E
-03
1.65
E-0
3 1.
63E
-03
1.61
E-0
3 1.
58E
-03
1.55
E-0
3 1.
52E
-03
1.48
E-0
3 1.
44E
-03
1.40
E-0
3
7.50
E+02
1.
30E
-04
1.29
E-0
4 1.
29E
-04
1.29
E-0
4 1.
28E
-04
1.27
E-0
4 1.
26E
-04
1.25
E-0
4 1.
24E
-04
1.22
E-0
4 1.
20E
-04
1.19
E-0
4 1.
17E
-04
1.15
E-0
4
1.00
E+03
1.
42E
-05
1.42
E-0
5 1.
41E
-05
1.41
E-0
5 1.
41E
-05
1.40
E-0
5 1.
39E
-05
1.38
E-0
5 1.
37E
-05
1.36
E-0
5 1.
35E
-05
1.34
E-0
5 1.
32E
-05
1.30
E-0
5
1.50
E+03
2.
78E
-07
2.78
E-0
7 2.
78E
-07
2.78
E-0
7 2.
77E
-07
2.76
E-0
7 2.
75E
-07
2.74
E-0
7 2.
73E
-07
2.72
E-0
7 2.
70E
-07
2.69
E-0
7 2.
67E
-07
2.65
E-0
7
2.00
E+03
5.
47E
-09
5.47
E-0
9 5.
46E
-09
5.46
E-0
9 5.
45E
-09
5.44
E-0
9 5.
42E
-09
5.41
E-0
9 5.
39E
-09
5.37
E-0
9 5.
34E
-09
5.32
E-0
9 5.
29E
-09
5.26
E-0
9
* Dis
tanc
e to
Fro
nt
Row
Yc/X
c, (m
) C
orne
r Dos
e R
ates
(mre
m/h
r)
1.50
E+1
2.00
E+1
3.00
E+1
5.00
E+1
7.50
E+1
1.00
E+2
1.50
E+2
2.00
E+2
3.00
E+2
5.00
E+2
7.50
E+2
1.00
E+3
1.50
E+3
2.00
E+3
1.50
E+1
0.84
5 0.
727
0.53
9 0.
309
0.18
0.
12
0.06
2 0.
037
0.01
2 1.
54E
-03
1.32
E-0
4 1.
56E
-05
3.57
E-0
7 8.
12E
-09
2.00
E+1
0.73
7 0.
654
0.50
4 0.
3 0.
178
0.11
9 0.
062
0.03
7 0.
012
1.55
E-0
3 1.
34E
-04
1.59
E-0
5 3.
68E
-07
8.46
E-0
9 3.
00E+
1 0.
55
0.50
9 0.
419
0.26
7 0.
166
0.11
2 0.
059
0.03
6 0.
012
1.53
E-0
3 1.
34E
-04
1.61
E-0
5 3.
77E
-07
8.76
E-0
9 5.
00E+
1 0.
314
0.30
2 0.
267
0.19
2 0.
13
0.09
2 0.
051
0.03
2 0.
011
1.46
E-0
3 1.
30E
-04
1.58
E-0
5 3.
74E
-07
8.72
E-0
9 7.
50E+
1 0.
183
0.17
9 0.
166
0.13
0.
095
0.07
1 0.
043
0.02
7 9.
83E
-03
1.36
E-0
3 1.
25E
-04
1.54
E-0
5 3.
73E
-07
8.77
E-0
9 1.
00E+
2 0.
121
0.12
0.
113
0.09
3 0.
072
0.05
6 0.
035
0.02
3 8.
80E
-03
1.28
E-0
3 1.
21E
-04
1.53
E-0
5 3.
77E
-07
9.00
E-0
9 1.
50E+
2 0.
063
0.06
3 0.
06
0.05
2 0.
043
0.03
6 0.
025
0.01
7 6.
97E
-03
1.13
E-0
3 1.
14E
-04
1.50
E-0
5 3.
92E
-07
9.66
E-0
9 2.
00E+
2 0.
038
0.03
7 0.
036
0.03
2 0.
027
0.02
3 0.
017
0.01
2 5.
45E
-03
9.79
E-0
4 1.
07E
-04
1.48
E-0
5 4.
08E
-07
1.04
E-0
8 3.
00E+
2 0.
013
0.01
2 0.
012
0.01
1 9.
98E
-03
8.92
E-0
3 7.
04E
-03
5.47
E-0
3 2.
87E
-03
6.44
E-0
4 8.
23E
-05
1.26
E-0
5 3.
83E
-07
1.03
E-0
8 5.
00E+
2 1.
56E
-03
1.57
E-0
3 1.
55E
-03
1.48
E-0
3 1.
38E
-03
1.30
E-0
3 1.
14E
-03
9.84
E-0
4 6.
45E
-04
2.08
E-0
4 3.
71E
-05
7.26
E-0
6 2.
67E
-07
7.82
E-0
9 7.
50E+
2 1.
33E
-04
1.35
E-0
4 1.
35E
-04
1.31
E-0
4 1.
26E
-04
1.22
E-0
4 1.
15E
-04
1.07
E-0
4 8.
20E
-05
3.69
E-0
5 9.
90E
-06
2.58
E-0
6 1.
17E
-07
3.93
E-0
9 1.
00E+
3 1.
58E
-05
1.60
E-0
5 1.
62E
-05
1.59
E-0
5 1.
55E
-05
1.53
E-0
5 1.
51E
-05
1.48
E-0
5 1.
26E
-05
7.21
E-0
6 2.
57E
-06
8.10
E-0
7 4.
50E
-08
1.81
E-0
9 1.
50E+
3 3.
58E
-07
3.68
E-0
7 3.
77E
-07
3.74
E-0
7 3.
72E
-07
3.76
E-0
7 3.
89E
-07
4.04
E-0
7 3.
78E
-07
2.63
E-0
7 1.
16E
-07
4.46
E-0
8 3.
68E
-09
2.26
E-1
0 2.
00E+
3 8.
09E
-09
8.41
E-0
9 8.
70E
-09
8.65
E-0
9 8.
69E
-09
8.91
E-0
9 9.
52E
-09
1.02
E-0
8 1.
00E
-08
7.65
E-0
9 3.
86E
-09
1.78
E-0
9 2.
24E
-10
2.29
E-1
1
Sou
rce:
Wor
kshe
et A
ging
of S
umm
ary.
xls
(*S
ee F
igur
e 4
for d
ista
nce
to A
ging
Pad
s.)

GROA External Dose Rate Calculation 000-PSA-MGR0-01300-000-00A
6.1.2 Dose Rates from Buffer Areas 33A and 33B
As described in Section 4.3.2, buffer areas 33A and 33B have the same dose rate trend as the TN-32 cask (Assumption 3.2.5). A scaling factor of 1.31 is applied to the trend to determine the dose rate curve for buffer area 33A. The dose rate contribution from buffer area 33A to any receptor location in the GROA is determined from the dose rate of a single transportation cask in buffer area 33A as shown in Table 7. With direct superimposition of all buffer casks (25 rail casks when 33A is fully loaded), the dose rates to any receptor location from 33A are calculated.
Similarly, a scaling factor of 0.272 (see Section 4.3.2) is applied to the trend to determine the dose rate curve for buffer area 33B. Table 7 presents the dose rate versus distance for the TN-32 cask, buffer area 33A, and single transportation casks in buffer areas 33A and 33B. The dose rates from 33B are calculated in the same manner as 33A.
Table 7. Dose Rate (mrem/hr) versus Distance for Buffer Areas 33A and 33B
Distance from Cask Axis (m)
TN-32 with Air/Ground
Buffer Area 33A
Single Cask in Buffer Area 33A
Single Cask in Buffer Area 33B
I II III IV V 5 1.88E+01 2.47E+01 9.88E-01 5.11E+00 7 1.10E+01 1.45E+01 5.78E-01 2.99E+00 10 5.92E+00 7.78E+00 3.11E-01 1.61E+00 20 1.57E+00 2.06E+00 8.25E-02 4.27E-01 50 2.27E-01 2.98E-01 1.19E-02 6.17E-02 70 1.06E-01 1.39E-01 5.57E-03 2.88E-02
100 4.55E-02 5.98E-02 2.39E-03 1.24E-02 150 1.50E-02 1.97E-02 7.89E-04 4.08E-03 200 6.32E-03 8.31E-03 3.32E-04 1.72E-03 300 1.51E-03 1.98E-03 7.94E-05 4.11E-04 500 1.45E-04 1.91E-04 7.62E-06 3.94E-05 700 2.10E-05 2.76E-05 1.10E-06 5.71E-06
1000 1.60E-06 2.10E-06 8.41E-08 4.35E-07 1500* 4.91E-08 6.46E-08 2.58E-09 1.34E-08 2000* 1.51E-09 1.98E-09 7.93E-11 4.11E-10
Column II = Column III of Table 3. Column III = Column II x 1.31 (normalized t o the dose rate of the buffer area 33A). See Attachment II, file
Summary.xls, worksheet Staging. Column IV = Column III � 25 (scaled dose rate for 1 cask). See Attachment II, file Summary.xls, worksheet
Staging. This column is used to generate the dose rate contour due to buffer area 33A. Column V = Column II x 0.272 (normalized to dose rate of buffer area 33B). See Attachment II, file
Summary.xls, worksheet Staging. This column is used to generate the dose rate contour due to buffer area 33B.
*Dose rates for TN-32 at these distances are fitted (Assumption 3.2.9).
25

GROA External Dose Rate Calculation 000-PSA-MGR0-01300-000-00A
6.1.3 Dose Rates from Transportation Cask and TEV
The dose rate as a function of distance from a transportation cask, TEV, or any single cask has the same trend as that from the TN-32 cask (Assumption 3.2.4). The dose rate versus distance for a transportation cask, TEV, and any single cask are determined using a multiplication factor that is the ratio of the surface dose rate of the cask in question to that of the TN-32 cask. The dose rate versus distance for the TN-32 cask is provided in column II of Table 7, which covers the distances between 5 to 2000 m from the cask axis. However, the data do not have contact dose rates or dose rates closer than 5 m from the axis, which are needed to estimate dose rates from other casks in transit. The TN-32 cask dose rates at 0.005 (contact), 0.5, 1.0, and 2.0 m from the radial surface obtained from Reference 2.2.14 ([DIRS 171772], Table I-5, Column 4) are used to supplement the TN-32 dose rate data at close distances. It should be noted that the dose rate at 0.005 m from the cask surface is essentially equal to the contact dose rate.
Table 7 presents in column II the dose rates from the surface out to 2000 m from the TN-32 cask. The dose rate curves for an aging cask and a TEV are derived from that of the TN-32 cask using the multiplication factors described in the previous paragraph and explained in more detail in the footnote of Table 8.
Table 8. Dose Rate (mrem/hr) versus Distance for Casks in Transitb
Distance from Cask Axis (m)
Distance from Cask Surface (m)
TN-32 with Air/Ground
Aging Cask in Transit TEV in Transit
I II III IV V 1.245 0.005 1.35E+02 4.00E+01 1.35E+02 1.74 0.5 8.50E+01 2.52E+01 8.50E+01 2.24 1 6.23E+01 1.84E+01 6.23E+01 3.24 2 3.76E+01 1.11E+01 3.76E+01
5 3.76 1.88E+01 5.57E+00 1.88E+01 7 5.76 1.10E+01 3.26E+00 1.10E+01
10 8.76 5.92E+00 1.75E+00 5.92E+00 20 18.76 1.57E+00 4.65E-01 1.57E+00 50 48.76 2.27E-01 6.72E-02 2.27E-01 70 68.76 1.06E-01 3.14E-02 1.06E-01 100 98.76 4.55E-02 1.35E-02 4.55E-02 150 148.76 1.50E-02 4.44E-03 1.50E-02 200 198.76 6.32E-03 1.87E-03 6.32E-03 300 298.76 1.51E-03 4.47E-04 1.51E-03 500 498.76 1.45E-04 4.29E-05 1.45E-04 700 698.76 2.10E-05 6.22E-06 2.10E-05
1000 998.76 1.60E-06 4.74E-07 1.60E-06 1500a 1498.76 4.91E-08 1.45E-08 4.91E-08 2000a 1998.76 1.51E-09 4.47E-10 1.51E-09
Column III = Column III of Table 3 and Reference 2.2.14 ([DIRS 171772], Table I-5, Column 4. Column IV = Column III x (40/135), normalized to the 40 mrem/hr contact dose rate (Reference 2.2.9,
Section 33.2.4.17). 135 mrem/hr is the contact dose rate of the TN-32 cask in column III.
26

GROA External Dose Rate Calculation 000-PSA-MGR0-01300-000-00A
Column V = Column III x (100/100), normalized to 100 mrem/hr at 30 cm (Reference 2.2.10 [DIRS 178308], Section 4.10.1.3). The TN-32 cask gives 135 mrem/hr at contact, which also results in 100 mrem/hr at 30 cm. Therefore, column V is identical to column III.
aDose rates for the TN-32 at these distances are curve fitted (Assumption 3.2.9). bCalculations in this table are performed in worksheet TN-32 of file Summary.xls.
6.1.4 GROA Surface Facilities Layout
The GROA facilities layout is based on the configuration given in Reference 2.2.3 ([DIRS 182265]). The dose rate contour for the GROA is generated over the configuration from this reference.
6.2 GENERATION OF DOSE RATE CONTOUR
The GROA external radiation levels calculated in this document are due to radiation sources emitted from loaded casks stored at various areas within the GROA. These areas include the aging pads (17P, 17Rr, and 17Rl), the rail buffer area (33A) and the truck buffer area (33B). The generation of the GROA dose rate contour begins with a series of receptor locations, which are selected from the neighborhood of radiation sources, locations of interest (e.g., surface facilities such as the IHF, CRCF, WHF, etc.), and some overall locations in GROA to improve the gridding process of the contour map (see Attachment I). The total dose rate at each receptor k is Dk, and according to Equation 1 is the sum of contributions DR�i�
k from the aging pads (17P, 17Rr, and 17Rl) and buffer areas (33A and 33B). Calculations of DR�i�
k are described in Sections 6.1.1 and 6.1.2.
Receptor dose rates are calculated using the MathCAD worksheet Contour.xmcd provided in Attachment II. Within this worksheet, Section A defines routines and parameters used in the dose rate calculation. Subsection A.1 defines constants and generic utilities; subsection A.2 imports data for dose rate curves and control points; and subsection A.3 defines dose rate functions. In order to facilitate the calculations, one-dimensional dose rate functions are used for rail and truck buffer areas, i.e., each cask in a buffer area is treated as a point source and the dose rate is a function of distance only. For aging pads 17P, 17Rr, and 17Rl, two-dimensional dose rate functions are applied to receptor locations outside the aging pads. Using MathCAD two-dimensional interpolation functions, interp and lspline, the dose rates from the aging pads are calculated (Edge_Effect.xmcd in Attachment II). The interpolation is used with two-dimensional splines, where a surface that corresponds to a cubic polynomial in x and y is passed through a grid of data points in such a way that the first and second derivatives of the surface are continuous across each point in each direction. The resultant spline curve is linear (lspline) at the endpoints. The dose rate functions defined in subsection A.3 are the DR�i�
k in (Equation 1). To ensure proper interpolation within the valid range of dose rate curves, subsection A.4 defines a checking routine for receptor locations.
Section B is the actual calculation. Subsection B.1 calculates coordinates of receptor locations; subsection B.2 calculates dose rates at the receptor locations according to Equation 1. The results from Contour.xmcd (Surfer.xls in Attachment II) are used in computer software Surfer 8.04 to generate the contour plot (isopleths of dose rate map for the GROA) in Figure 5
27

GROA External Dose Rate Calculation 000-PSA-MGR0-01300-000-00A
(Surfer_a.xls and Surfer_a.grd in Attachment II are intermediate results in Surfer 8.04). The data generated from MathCAD are processed with the Kriging block gridding method to generate an array of smooth grid points for the contour plot (Contour.srf in Attachment II). Because the contour involves dose rates extending over several orders of magnitude, the logarithm of dose rate is used instead of the linear dose rate. The details of the gridding process are described in file Grid_Report.rtf that is provided in Attachment II. The background GROA map is obtained from Geologic Repository Operations Area Overall Site Plan (Reference 2.2.3 [DIRS182265]) and is overlapped with the Surfer 8.04 generated contour plot.
28

GROA External Dose Rate Calculation 000-PSA-MGR0-01300-000-00A
7. RESULTS AND CONCLUSION
The GROA dose rate contour map has been developed in this calculation. The graphic presentation of the area dose rate contour map for the GROA is shown in Figure 5. The calculated dose rates at several locations of interest are presented in Table 9. The dose rate contour map represents contributions from the Aging Facility and buffer areas 33A and 33B. The contributions from any single cask or TEV are not incorporated in the contour map since they are transient sources and they only affect their immediate vicinities. For the single-cask sources, only dose-rate curves are determined.
From the dose rate contour map in Figure 5, it can be concluded that dose rate falls off at least one order of magnitude for every 500 m away from the GROA. For the minimum distance of 6700 m to the site boundary from any point within the GROA, radiation dose rate will fall off more than 13 orders of magnitude to insignificant levels.
Table 9. Normal Operation Direct Doses at Facility Locations in the GROA
Area No. GROA Location TEDEa
(mrem/hr) TEDEb
(mrem/yr)
51A Initial Handling Facility 1.8E-03 3.7E+00 160 Low-Level Waste facility 2.1E-04 4.2E-01 050 Wet Handling Facility 2.0E-04 4.0E-01 200 Receipt Facility 2.3E-04 4.7E-01 060 Canister Receipt and Closure Facility 1 6.2E-05 1.2E-01 070 Canister Receipt and Closure Facility 2 7.3E-04 1.5E+00 080 Canister Receipt and Closure Facility 3 9.0E-04 1.8E+00 220 Heavy Equipment Maintenance Facility 7.7E-04 1.5E+00 240 Central Communication Control Facility 3.5E-03 7.0E+00 230 Warehouse and Non-Nuclear Receipt Facility 8.6E-03 1.7E+01 25A Utility Facility 2.7E-04 5.3E-01 620 Administration Facility 3.5E-05 6.9E-02 71A Craft Shop 5.7E-05 1.1E-01 30A Central Security Station 4.1E-05 8.2E-02 30B Cask Receipt Security Station 1.1E-03 2.2E+00 30C North Perimeter Security Station 4.8E-03 9.7E+00 27A Switchyard 1.8E-02 3.6E+01 780 Lower Muck Yard 3.9E-02 7.8E+01
NOTE: aDirect radiation doses are the total external doses from aging overpacks on the aging pads (17P and 17R), and transportation casks in 33A (rail buffer area) and 33B (truck buffer area) (Source: file Surfer.xls, Attachment II).
bDoses are based on 2,000 hr/yr worker occupancy and the dose rates in the third column.
29

GROA External Dose Rate Calculation 000-PSA-MGR0-01300-000-00A
Notes (09/27/2007): 1. The contour lines are in log(mrem/hr) and incremented by 0.5 (solid lines are full integers, e.g., -1, -2, -3, ..., etc. and dashed are -1.5, -2.5, etc.) 2. Thick red line is 0.05 mrem/hr = 100 mrem/yr at 2000 hr/yr 3. Background maps are based on 100-C00-MGR0-00501-000-00D and 170-P10-AP00-00101-000-00B
Figure 5. Dose Rate (mrem/hr) Contour Map for the Geologic Repository Operations Area
30

GROA External Dose Rate Calculation 000-PSA-MGR0-01300-000-00A
ATTACHMENT I REPRESENTATIVE DOSE RATE OF AGING CASK
The representative dose rate of an aging cask is determined using the TAD aging cask configuration from Assumption 3.2.8 and a TAD-based waste stream arrival scenario from Reference 2.2.8 ([DIRS 180185], Section 3.2.1). This attachment presents representative dose-rate calculations of an aging cask for a TAD canister containing 21 PWR SNF assemblies.
In accordance with Assumption 3.2.8, the TAD aging cask has an inner diameter of 73 in. and its radial geometry consists of a layer of 2.5 in. stainless steel, followed by a layer of 26.5 in. concrete, and an outer layer of 1.0 in. stainless steel. The SAS1 control module of the SCALE computer code system (Reference 2.2.2) is used to calculate the radial dose rates. SAS1 employs the one-dimensional discrete ordinates transport method to perform shielding calculations. For the radial dose rate calculation with SAS1, an infinite cylindrical model is used to approximate the aging cask. Then, dose rates at detector points beyond the radial surface are determined by integrating the angular flux, which is calculated by the XSDRNPM functional module, from the radial surface that reaches the detector points. This last integration step to obtain dose rates at detector points beyond a surface is performed by the XSDOSE function module in SAS1.
The SAS1 radial geometry of the aging cask consists of concentric infinite cylinders. The model begins with a homogenized fuel region of 81.915-cm radius, a stainless steel region of 84.455cm radius, a void region of 92.71-cm radius, a stainless steel region of 99.06-cm radius, a concrete region of 166.37-cm radius, and a stainless steel region of 168.91-cm radius. The materials are derived from Reference 2.2.15 ([DIRS 163936], Attachment III, file: mcnp_rad_inputs.xls, worksheet: atom_den). The worksheet is included in Attachment II of this calculation under the file name TADOvpk.xls. In the file TADOvpk.xls, a new worksheet new_atom_den was derived from the worksheet atom_den. The new_atom_den worksheet is based on a TAD canister inner radius of 81.915 cm while the atom_den worksheet is based on an inner radius of 67.2 cm. The resulting cavity volumes are indicated in cell F22 of both worksheets. The source terms for the PWR assemblies are obtained from Reference 2.2.11 (Attachment I, files: PWR.gamma.source and PWR.neutron.source).
The TAD-based waste stream was developed with a 25-kW thermal limit on TAD canisters and a maximum annual receipt of 3600 MTHM (Reference 2.2.8 [DIRS 180185], Section 3.2.1). Based on the TAD-based waste stream, a qualified software, WPLOAD v.1.1 (Reference 2.2.17), was used to develop repository annual loading scenarios that also identifies any SNF assemblies destined for the Aging Facility based on a TAD canister thermal limit of 18 kW. The SNF assemblies requiring aging are used to estimate the annual representative dose rate of an aging cask during surface operations within the GROA. The annual representative dose rate of the aging cask is determined in the following manner.
1. Generate a database of radial dose rates outside the TAD aging cask loaded with PWR SNF assemblies with the same characteristics. The ranges of SNF characteristics cover decay times from 5 to 25 years, enrichments from 2.5 to 5.0%, and burnups from 30 to 80 GWd/MTHM. The SAS1 control module in the SCALE code system is used to calculate the aging casks radial dose rates from a distance of 0.5 cm to 1 km. The dose rates consist of primary gamma, neutron and captured gamma. The total dose rate is the sum of all three components.
I-1

2. Create a formula for dose rate from a single aging cask in MS Excel (PWR_Source.xls)
a. Extract dose rate results from SAS1 outputs and import into Excel (Parsed into worksheets DoseRate05, DoseRate10, DoseRate15, DoseRate20, andDoseRate25, and rearranged in worksheet DoseRate. Worksheets Gamma0_35, Gamma35_6, Neutron3.5_6, and Neutron are intermediate process results.)
b. Create a dose rate formula using multiple linear regression analysis in MS Excel (from Regression of Data Analysis under pull-down menu Tools). Perform various trials of regression analysis to determine the final optimal regression formula by examining R2 , F statistics and t-statistics. (Data to be analyzed are in worksheet Regression and the results are in worksheet Regression_Results)
The calculated dose rates from all aging casks are expected to provide a bounding range, both low and high, to the actual situation for all potential aging casks on the aging pads. Without explicate knowledge of the spent fuel characteristics, the representative average dose rates from aging casks can be obtained from such an approach. The Excel regression results from step 2 are:
Table I-1. Regression Results of Dose Rates from Aging Cask Surface
SUMMARY OUTPUT 50 m ~ 1km
Regression Statistics Multiple R 0.998498963 R Square 0.997000179 Adjusted R Square 0.996992749 Standard Error 0.051752577 Observations 1620
ANOVA df SS MS F Significance F
Regression 4 1437.594 359.398609 134187.6 0 Residual 1615 4.325502 0.00267833 Total 1619 1441.92
Coefficients Standard Error t Stat P-value Lower 95% Upper 95% Intercept 1.461539647 0.022101 66.1304168 0 1.41819 1.504889Log(Age) -1.293149489 0.005209 -248.27076 0 -1.30337 -1.28293 Log(Enrich) -0.669939683 0.012536 -53.443133 0 -0.69453 -0.64535Log(Burnup) 1.699102041 0.008878 191.383648 0 1.681688 1.716516Log(Distance) -1.989172622 0.003014 -660.02138 0 -1.99508 -1.98326DR (rem/hr) = 28.94*Age(yr)-1.293*Enrich(%)-0.670*Burnup(GWd/MTHM)1.699*Distance(cm)-1.989
DR (mrem/hr) @ 100 m =3.198E-4*Age(yr)-1.293*Enrich(%)-0.670*Burnup(GWd/MTHM)1.699
Source: Worksheet Regression_Results of PWR_Source.xls
GROA External Dose Rate Calculation 000-PSA-MGR0-01300-000-00A
I-2
GROA External Dose Rate Calculation 000-PSA-MGR0-01300-000-00A
3. Use MS ACCESS database (TAD_Case1a.mdb) to process WPLOAD results (The attached file WPLOAD_OUTPUT_case1a.txt of Reference 2.2.8, Attachment I).
a. Parse the information in Sections 9, 10, and 11 of WPLOAD output into Tables C1S9, C1S10, and C1S11. Table C1S9 is renormalized to C1S9x for better query and Bin_ID is added to C1S10 to become C1S10x.
b. Parse the SNF characteristics in WASTESTREAM_TAD_YFF525kW3600.TXT (Reference 2.2.8, Attachment I) into Table WSTREAM.
c. Use query qSFA_Char on Tables C1S9x, C1S10x, and WSTREAM to create Table C1SFA_Char for the characteristics (MTHM, burnup, enrichment, year of discharge, and year of arrival) of spent fuel assemblies.
d. Use query qAge_SFA_Char on Tables C1S11 and C1SFA_Char to obtain Table C1Aging with the characteristics for the SFAs stored on the aging pads.
e. Use query qAgeDR with the regression dose rate formula from Step 2 on Table C1Aging to obtain dose rates at 100 m for all aging casks in any year.
f. Use query qAgingYr to prepare an intermediate Table AcaskYr and then use query qCasks2Aging to obtain the number of casks sent to the aging pads each year.
4. Import results from step 3 into worksheet C1aDR@100m of Excel workbook PWR_Source.xls to plot the statistical average (mean), mode, median, and standard deviation of the annual dose rates throughout the entire operation period as shown in Figure I-1. The number of casks sent to the Aging Facility are also plotted in worksheet C1aDR@100m and presented in Figure I-2.
I-3

0.00E+00
2.00E-03
4.00E-03
6.00E-03
8.00E-03
1.00E-02
1.20E-02
Dos
e Ra
te (
mode
median
Average
2015 2020 2025 2030 2035 2040 2045
Year Source: worksheet C1aDR@100m of PWR_Source.xls in Attachment II.
Note: The error bars are one standard deviation above and below the average line.
Figure I-1. Dose Rate (mrem/hr) at 100 m from Aging Cask
2015 2020 2025 2030 2035 2040
Year
0
50
100
150
200
250
300
350
'Casks Sent to Aging'
GROA External Dose Rate Calculation 000-PSA-MGR0-01300-000-00A
yr 2017 2018 2019 2020 2021 2022 2023 2024 2025 2026 2027 2028 2029 2030 2031 2032 2033 2034 2035 2036 2037 # of Casks 3 25 79 145 207 268 252 298 331 322 328 295 281 301 290 279 270 250 243 233 207
Source: worksheet C1aDR@100m of PWR_Source.xls in Attachment II.
Figure I-2. Schedule of Casks Sent to Aging Pads
I-4

GROA External Dose Rate Calculation 000-PSA-MGR0-01300-000-00A
ATTACHMENT II ELECTRONIC FILES ON COMPACT DISC
Electronic MS Access, MS Excel, MathCAD 13 and Surfer 8.04 files are provided on a compact disc. The attributes of the files are listed in Table II-1. Each file is identified by its name, description, size in bytes, date and time.
The file SAS1.zip contains 540 text files, which are composed of 3 types of data indicated by the subfield of the file names. Files without a subfield are SAS1 input files, and files with a subfield “output” are SAS1 output files. Files with a subfield “grep” contain dose rate results for primary gamma rays, neutrons, and captured gamma rays at 23 detector points. The “grep” files were generated in a UNIX workstation using the “grep” command. The file names have the form aXXeYYbZZ, where “a” indicates the age of the SNF in the aging cask, “e” indicates the enrichment, and “b” indicates the burnup. Table II-2 provides values and meanings of the parameters in the file names.
Table II-1. Listing of Electronic Files on Compact Disc
File Name Description Size (Bytes) Date Time
Wt_Fit.xmcd MathCAD 13 worksheet for curve-fitting on SAS1
outputs on generic fuel assembly cask 158,364 9/17/2007 02:37p
Contour.xmcd MathCAD 13 worksheet for GROA worker doses and
contour 6,428,034 9/26/2007 05:55p
Edge_Effect.xmcd MathCAD 13 worksheet to generate 2-D dose rate
functions of aging pad 830,595 9/17/2007 02:43p
GammaSpectra.xls Excel file to generate normalized gamma leakage
spectra from various casks 45,056 9/5/2007 04:15p PWR_Source.xls Excel workbook for PWR source terms 40,755,200 10/02/2007 02:54p
SAS1.zip ZIP file contains SAS1 input/output and grep files for
aging cask representative dose rate evaluation 20,249,271 8/22/2007 03:54p
Summary.xls Excel workbook to summarize dose rate curve
calculation 129,536 10/02/2007 11:27a Surfer.xls Output of MathCAD 1,137,509 09/26/2007 03:51p Surfer_a.grd Intermediate grid table of SURFER 161,972 9/17/2007 01:58p Surfer_a.xls Table of receptor dose rates for SURFER plotting 1,385,625 9/26/2007 11:36a Grid_Report.rtf Gridding report of SURFER 28,044 9/17/2007 03:02p
TAD_Case1a.mdb MS ACCESS database for process outputs of WPLOAD
and waste stream 79,167,488 10/09/2007 10:54a TADOvpk.xls Excel file with TAD overpack material information 136,192 9/13/2007 02:13p Contour.srf Contour Map of SURFER 2,478,388 9/27/2007 03:58p
Table II-2. SAS1 Files Naming Convention
XX Age (years) YY Enrichment (%) ZZ Burnup (GWd/MTHM)
05 5 25 2.5 30 30 10 10 30 3.0 40 40 15 15 35 3.5 50 50 20 20 40 4.0 60 60 25 25 45 4.5 70 70
N/A N/A 50 5.0 80 80
II-1


![Calculation, 'Post LOCA Suppression Pool pH For Vermont ...calculation is being performed using Polestar QA software STARpH 1.04 code [1] in accordance with references [2] and [3]](https://static.fdocuments.net/doc/165x107/5ffcd88ae734a772883d3fa7/calculation-post-loca-suppression-pool-ph-for-vermont-calculation-is-being.jpg)