Cadastral Resurvey using RS, GIS, DGPS & ETS in K parida.pdf · Cadastral Resurvey using RS, GIS,...
11
Cadastral Resurvey using RS, GIS, DGPS & ETS in Bijepadmanabhapursasana of Digapahandi Tahasil, Ganjam District, Odisha, India. P.K.Parida 1 , M.K.Sanabada 2 , Dr.N.D.Mohanty 3 and A.K.Mohapatra 4 Orissa Space Applications Centre, Bhubaneswar (ORSAC), Odisha. 1-[email protected] , 2-[email protected] , 3- [email protected] 4 - amiya55@sify.com Abstract Sophistication in satellite sensor technology in capturing geometrically accurate images of earth’s surface coupled with GIS technology holds the capability of large scale mapping of land resources at cadastral level. High Resolution Satellite Images depict field bunds quite distinctly. Cadastral boundary vectors obtained from ortho-images are used as base maps and obscured/difficult areas (not delineated/mapped from ortho-images) are surveyed using DGPS and ETS. The vector datasets thus derived through RS/DGPS/TS survey are integrated in GIS environment to generate the base cadastral vector datasets for further settlement/title confirmation activities. The objective of this paper is to undertake a pilot project using the hybrid technology in Bije-Padmanavpur village under Digapahandi Tahasil of Ganjam district. Ortho image was created from World View –II digital stereo data using Leica Photogrammetry Suite and plot boundaries are extracted after fixing village boundary from old georeferenced cadastral vector using ARC/INFO Workstation / ARC GIS software. During preparation of ortho-image, Universal Transverse Mercator coordinate system was used with Spheroid and WGS 84. The plot vector data extracted from ortho image inherited the same projection system that of image. The area of each plot was compared with Record of Right (ROR) data and within an accuracy of (±) 2% from ROR area were accepted. One of the significant observations of the study is matching of Cadastral map area (after digitization-317.40 Acres), the image map (317.49 Acres) of 2009 and RoR area (316.73 Acres). 79% of plots derived by high-tech survey method shows acceptable level of accuracy considering the fact that the mode of area measurement by ground and automated method has significant variability. The variations are more in case of Government lands, Temple/Trust lands, Common Property Resources and plots near to river/nalas etc. The study indicates that the adopted technology can be extended to other districts and cadastral resurvey and updation work can be done for larger areas.
Transcript of Cadastral Resurvey using RS, GIS, DGPS & ETS in K parida.pdf · Cadastral Resurvey using RS, GIS,...

Cadastral Resurvey using RS, GIS, DGPS & ETS in
Bijepadmanabhapursasana of Digapahandi Tahasil, Ganjam District, Odisha, India.
P.K.Parida1, M.K.Sanabada2, Dr.N.D.Mohanty3and A.K.Mohapatra4
Orissa Space Applications Centre, Bhubaneswar (ORSAC), Odisha.
[email protected], [email protected], 3- [email protected]
Abstract
Sophistication in satellite sensor technology in capturing geometrically accurate images of earth’s surface coupled with GIS technology holds the capability of large scale mapping of land resources at cadastral level. High Resolution Satellite Images depict field bunds quite distinctly. Cadastral boundary vectors obtained from ortho-images are used as base maps and obscured/difficult areas (not delineated/mapped from ortho-images) are surveyed using DGPS and ETS. The vector datasets thus derived through RS/DGPS/TS survey are integrated in GIS environment to generate the base cadastral vector datasets for further settlement/title confirmation activities. The objective of this paper is to undertake a pilot project using the hybrid technology in Bije-Padmanavpur village under Digapahandi Tahasil of Ganjam district.
Ortho image was created from World View –II digital stereo data using Leica Photogrammetry Suite and plot boundaries are extracted after fixing village boundary from old georeferenced cadastral vector using ARC/INFO Workstation / ARC GIS software. During preparation of ortho-image, Universal Transverse Mercator coordinate system was used with Spheroid and WGS 84. The plot vector data extracted from ortho image inherited the same projection system that of image. The area of each plot was compared with Record of Right (ROR) data and within an accuracy of (±) 2% from ROR area were accepted.
One of the significant observations of the study is matching of Cadastral map area (after digitization-317.40 Acres), the image map (317.49 Acres) of 2009 and RoR area (316.73 Acres). 79% of plots derived by high-tech survey method shows acceptable level of accuracy considering the fact that the mode of area measurement by ground and automated method has significant variability. The variations are more in case of Government lands, Temple/Trust lands, Common Property Resources and plots near to river/nalas etc. The study indicates that the adopted technology can be extended to other districts and cadastral resurvey and updation work can be done for larger areas.

1.0 Introduction
Generation of Cadastral maps is possible through High-tech survey methods using Ortho-images, DGPS and ETS. Cadastral boundary vectors obtained from ortho-images are used as base maps and obscured/difficult areas (not delineated/mapped from ortho-images) are surveyed using DGPS and ETS. The vector datasets thus derived through RS/DGPS/TS survey are integrated in GIS environment to generate the base cadastral vector datasets for further settlement/title confirmation activities. This exercise is undertaken to demonstrate the efficacy of the hybrid technology for cadastral map preparation. The project was conducted in Bije-Padmanavpur village under Digapahandi Tahasil of Ganjam district, Odisha.
2.0 The objective of the project
To generate cadastral maps by using high-tech survey methods using ortho-images, DGPS and ETS.
To store the cadastral maps in digital format (storing & updating cadastral maps using state-of-art technology) and to use this as base for all type of revenue administration and development planning.
Deriving lat-longs of cadastral maps, its mosaiking and Geo-referencing to generate Land Information System (LIS) for Tahasils.
To use GIS applications for plot level RoR, landuse and infrastructure information generation using digital cadastral database.
3.0 Study Area
The Pilot Study was under taken in Bijaya Padmanavpur village of Digapahandi Tehasil in Ganjam District. The total area of Bijaypadmanavpur is 317 acres. The area is falling within the Survey of India Toposheet No. 74 A/11. Approximate coordinates of polygon bounding of the village are:-
Lower left corner- 190 20’ 30” N, 840 35’ 00” E Upper right corner- 190 23’ 00” N, 840 39’ 00” E
4.0 Methodology
The broad methodology adopted under this Pilot project is as fallows: -
Acquisition of digital stereo satellite data of World View-II
Establishment of GCP control network by DGPS
Orthoimage generation
Collection of existing cadastral maps & Coding/Scanning/Digitization of maps
Delineation & confirmation of village boundary
Plot level vectorisation & map generation from orthoimage
Integration of image derived vectors and cadastral vectors (DoLR map) / ROR linking

Survey and mapping of difficult areas/ ground truth collection
Integration of vectors and preparation of base maps
Map/RoR printing (output generation)
GIS Database Creation
4.1 Acquisition of Digital Stereo Data
Digital Stereo Data of World View-II, PAN was acquired through National Remote Sensing Centre, Hyderabad, Department of Space, and Govt. of India having spatial resolution of .5 m for this study.
4.2 Establishment of GCP control network by DGPS
ORSAC has established a Ground Control Network named Primary and secondary at a spatial grid of 16km x 16 km and 4km x 4 km respectively with the placement of cemented pillars having its pillar numbers. Tertiary control points were also created within a visible distance from both types of control points to facilitate ETS survey in the study area. DGPS observation of 4 hours at the primary control point and 1 hour at the secondary point were recorded. The recorded DGPS observations were post processed and network adjustment was performed using fixed solution with triangulation closing limit of 5cm in case of primary control network and 10 cm for the secondary network. The network adjusted values were provided in both geographic co-ordinate system as well as real world co-ordinate system i.e. Universal Trans Mercator (UTM) projection with WGS 84 Spheroid and WGS 84 datum.
4.3 Orthoimage generation
Leica Photogrammetry suite was used for generation of DEM as well as ortho-image for this study. This software uses block triangulation procedure taking the internal and external orientation using both sensor recorded DGPS observations from the header files of digital stereo pairs as well as GCPs taken from the study area. The RMS for the triangulation was .3 pixels. DEM of spatial resolution of 2 m. was created which was then edited properly to create a good surface image. The orthoimage was created using the raster DEM as well as digital stereo pair images of spatial resolution of .5 meter. The process flow diagram is given below in fig-1.

Fig 1
4.4 Collection of cadastral maps & Coding/Scanning/Digitization of maps
Cadastral maps of the study area (Bijayapadmanavpur mouza) (maps in 1:2000 scale) were collected from the Directorate of Land Records and Survey, Cuttack. Maps collected in sheets were scanned after quality checking of each sheet with regard to its physical condition, readability, content and clarity. Maps were tiled on 100mx100m dimension of grid cells. All the four cadastral map sheets were digitized as per the guidelines of Department of Space. Hardcopy printouts are taken for 1 to 1 matching and quality assurance. After necessary quality check the existing cadastral maps are converted to GIS format for further geo-rectification with orthoimages. The detail methodology is described in Fig.2.
Database Gen. in GIS Env.
Soft copy validation
Final Hard copy generation & validation
QC11-
11
QC2 222
Fig 2 METHODOLOGY FLOW CHART FOR DIGITIZATION , QUALITY CHECKING & GEOREFERENCING
Indexing, coding & scanning
Digitization
Attribute attachment
Hard copy out put generation
Hard copy evaluation .
Tiling map with GRID
Village Maps Collection
Geo-referencing
Edge matching of neighboring sheets
Village level Mosaics
Validation
Acquisition of GCP
QC3 222
QC4 222
QC5 222
QC6 222
Geo-referencing of mosaic village map with orthoimage
QC67222
4.5 Plot level vectorisation, map generation from orthoimage & ROR
linking
The outer village boundary along with the location of bijunction and triunction points are extracted from digital cadastral map and transferred to the orthoimage by georeferncing the cadastral map with orthoimage. The field observations were taken using DGPS to confirm the outer boundary of the village and its co-existence with the neighboring mouza. The plot boundaries / vectors are interpreted by onscreen digitization method from enhanced Worldview orthoimage with precision following segmented approach i.e. the mouza divided into zones taking natural boundary into consideration and the sum of the area of the zones matching with ROR area. The vectors are drawn for the plots, which are clearly visible on the image in the first instance. The plots whose boundaries are obscured because of tree canopy and other reasons are not closed and left as it is. These difficult area polygons are finalized by field survey technique using DGPS and ETS. The habitation polygons, which are very small, are incorporated to the map from the existing cadastral map. A pre-field map was generated in 1:2000 scales for ground validation and DGPS based data collection. The pre-field map was used for ETS survey for the obscure areas where existing ground control co-ordinates were used for the measurement of co-ordinates in the obscure areas. The co-ordinates then transferred to the plot vector geo-database for the finalization of complete plot vector extraction of the mouza. The plot numbers were transferred from the geo-referenced cadastral map as well as from data collected from the tehesils for the mutated plots. ROR data for the mouza then linked with plot vector for finalization of the geodatabase. 5.0 Accuracy Checking
Accuracy of data sets was checked in 3 steps. First step involves comparison of geo-coordinates (of randomly selected points) generated by computer with that of actually observed through DGPS. Second step involves comparison of length measurement (of tie lines) generated by computer with that of actual field measurement. Third step involves comparison of boundary measurements (of randomly selected parcels) generated from image data set with that of actual field measurements. The results of these three steps of accuracy checking are discussed below.
5.1 Comparison of Geo-coordinates
The table no 1 below depicts geo-coordinate comparison.
Table -1: A comparative study (Post-field Interpretation) of Geocordinates of observed ( DGPS ) and Satellite Image Point
Longitude Latitude
Image Dgps Image Dgps
Sl. No.
Image Pt. Id. No. Degree
Minute Second Degree
Minute Second Degree
Minute Second Degree
Minute Second
1 1 84 35 56.724 84 35 56.73 19 21 49.608 19 21 49.617

2 2 84 35 56.364 84 35 56.36 19 21 49.716 19 21 49.713
3 3 84 35 55.932 84 35 55.94 19 21 49.752 19 21 49.736
4 4 84 35 55.5 84 35 55.52 19 21 49.86 19 21 49.845
5 5 84 35 54.924 84 35 54.90 19 21 50.04 19 21 50.046
6 6 84 35 56.544 84 35 56.55 19 21 50.652 19 21 50.638
7 7 84 38 11.436 84 38 11.42 19 22 34.824 19 22 34.844
8 8 84 38 7.404 84 38 7.40 19 22 32.484 19 22 32.476
9 9 84 38 19.644 84 38 19.65 19 22 24.888 19 22 24.889
10 10 84 38 21.768 84 38 21.78 19 22 24.204 19 22 24.194
11 11 84 37 55.236 84 37 55.24 19 22 11.028 19 22 11.032
12 12 84 37 51.636 84 37 51.66 19 22 28.092 19 22 28.102
13 13 84 37 46.596 84 37 46.60 19 22 32.7 19 22 32.693
15 15 84 35 37.644 84 35 37.65 19 21 46.044 19 21 46.030
16 16 84 35 37.932 84 35 37.93 19 21 46.8 19 21 46.780
17 17 84 35 16.008 84 35 15.99 19 21 36.756 19 21 36.770
18 18 84 35 11.904 84 35 11.90 19 21 38.052 19 21 38.061
20 20 84 35 38.616 84 35 38.61 19 21 45.612 19 21 45.600
21 21 84 35 38.832 84 35 38.80 19 21 45.504 19 21 45.493
22 22 84 35 39.192 84 35 39.17 19 21 45.36 19 21 45.345
23 23 84 35 39.552 84 35 39.56 19 21 45.216 19 21 45.232
24 24 84 35 40.416 84 35 40.41 19 21 44.856 19 21 44.838
25 25 84 35 40.848 84 35 40.84 19 21 44.676 19 21 44.676
26 26 84 35 41.352 84 35 41.34 19 21 44.46 19 21 44.465
27 27 84 35 42.576 84 35 42.57 19 21 50.472 19 21 50.463
28 28 84 35 44.916 84 35 44.91 19 21 46.944 19 21 46.963
29 29 84 35 44.196 84 35 44.20 19 21 47.124 19 21 47.132
As may be observed, the measurements match up to second places after second decimal point.
5.2 Tie line measurement
For tie line measurement five tie lines were selected. The length of the tie line was measured from the image in GIS environment and its corresponding field measurement was done through DGPS. The results are tabulated in table-2 & Fig-3 for comparison. The measurements were found to be matching upto third places after decimal point.
Table-2 Tie-line Measurements
Sl No
Line No
Length measured from Image
(meter)
Length measured from
Field using DGPS (meter)
1 1 226.52274 226.52280
2 2 1470.9126 1470.9130
3 3 248.44296 248.44299 4 4 725.50104 725.50110
5 5 658.35443 658.35450

Fig-3
5.3 Parcel Boundary Measurement
Five plots in study area were randomly selected. Four sides of each of these plots were measured on the ground using meter-tape. The corresponding measurements were extracted from the image. The measurements were tabulated in the table.3 for comparison. The difference in measurements in each case is below 1%.
Table-3
6.0 RESULTS & DISCUSSION
Total Area of Village- (Bijepadmanavpur)
RoR area : - 316.739 Acre Cadastral map area : - 317.40 Acre Image vector map : - 317.49 Acre
No. Of Plots (Bijepadmanavpur): -
RoR : - 1795 Cadastral map : - 1784 Image vector map : - 1795
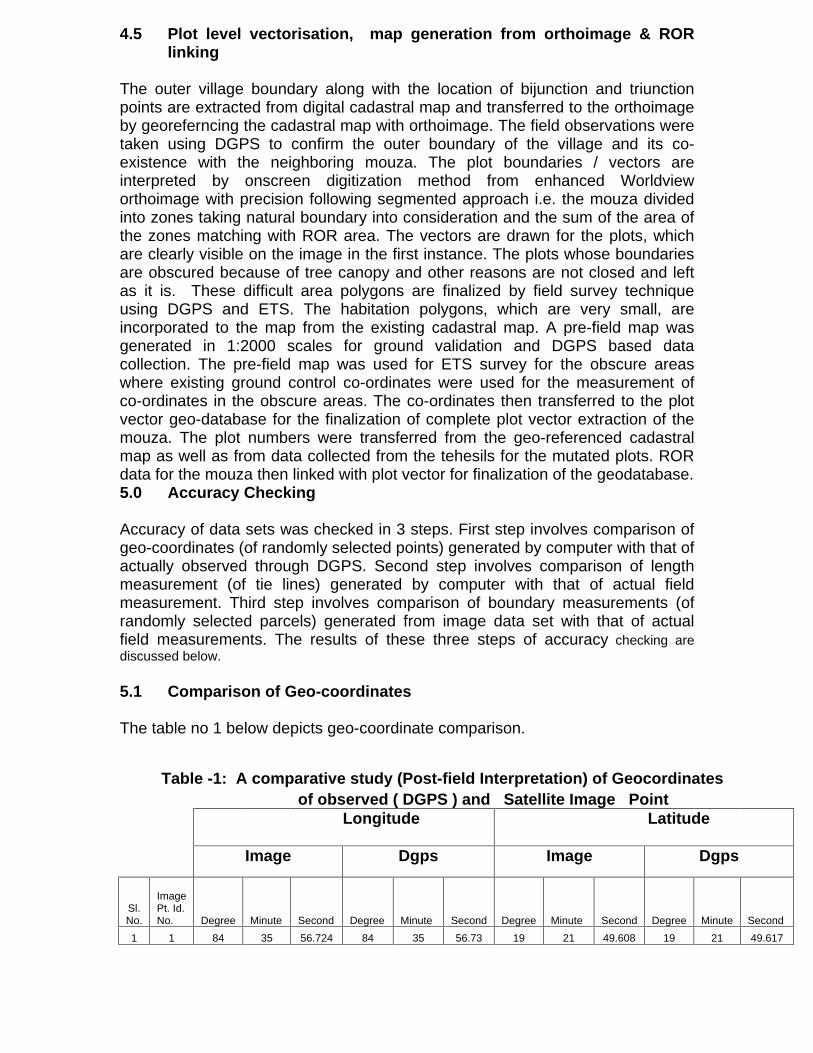
The difference in RoR and Map (11 plots) is due to subdivision of original plots 1238, 1473, 895, 1440, 781, 1605, 631, 895, 410 and 1037 etc. in RoR.
No. of Plots under different Kisam: - Dharmapitha- 03 Ekafasali- 1445 Gharabari- 274 Gochara- 01 Jalasaya- 12 Nala- 01 Padara- 29 Patharabani- 05 Patita- 07 Rasta- 14 Samsana- 02
Total: - 1795
Matched plots (0-2%) 1455 81.1% Gharabari 273 15.2% Mismatch 067 03.7%
Total No. of Plots 1795 100%
STANDARD/FORMAT FOR MAP & GIS DATABASE GENERATION
Mapping Standards 1:2,000
Spatial Framework NSF Ortho rectification Accuracy (RMS) 0.1 m Projection UTM Datum WGS 84 Map Frame size One sheet Map (Planimetric) Accuracy 0.1 m Minimum Mappable Unit (MMU) 10x10 cm Accuracy of Mapping 100/99 Map Format Digital GIS Compliance GIS Database Standards
1:2,000
Spatial framework
Mouza
Tie Point Intervals for Spatial Framework Meter grid Projection UTM Datum WGS 84 Minimum Frame size One sheets Tic Registration Accuracy in meters 0.001 Planimetric Accuracy (1mm of scale) in m 0.02 Coordinate Movement Tolerance (CMT) 0.00001 Weed Tolerance (WT) 0.001 Sliver Polygon Tolerance (SPT) < 0.001sqm Grid size (for Image/Raster layers) 100x100 m

Output Standards 1:2,000
Output Formats
Digital GIS Compliance
Output Framework
Admin Unit -
Village
User defined region AOI ·
Spatial Framework grids
Output Media
CD-ROM/DVD
Output Projection
UTM / User defined
Output Datum
WGS 84
Output Format
GoeTiff, Shape file
Output Symbology
As per Layer Legend/DoLR standards
7.0 CONCLUSION
High-resolution space-borne remote sensing image data show a high level of detail and provide many opportunities to be used as base for cadastral map generation. Orthoimages generated by using satellite data having 0.5 m spatial resolution are ideally suited for deriving cadastral plot vectors for plain areas. The obscured areas need ground survey intervention by DGPS & ETS. The habitation area vectors (very small polygons which can not be resolved through 0.5 m data) of existing cadastral maps can be integrated to image vector maps to finalise the new cadastral maps of the villages. The image derived cadastral maps can be directly used by revenue official for tenant interaction, settlement activities and revenue administration.
One of the significant observations of the study is matching of Total village area in Cadastral map area (after digitization), the image map of 2009 and RoR area.
The final cadastral map generated (fig. 4) by High-tech survey provides accurate matching of plot areas in 81% of plots. In total 80% of plots in both the villages derived by high-tech survey method shows acceptable level of accuracy considering the fact that the mode of area measurement by ground and automated method has significant variability. Including the Gharabari plots the total plot area in 95% (within 0-2% variations) of plots are matching with existing RoR.
It is also observed that the plot area of digitized cadastral map and the image map are matching but in case of certain plots the RoR area shows wide variation. The variation is more in case of Government lands, Temple/Trust lands, Common Property Resources and plots near to Village boundary etc.

The adopted technology can be successfully used for Cadastral Resurvey and Cadastral GIS generation for plain areas of the state.
Fig 4
ACKKNOWLEDGEMENTS
The authors would like to express their gratitude to Principal Secretary to Govt. of Odisha, Revenue & Disaster Management and Director Land Records. Odisha for their support and encouragement during the project execution. Authors are also thankful to the engineering and technical personnel, ORSAC used for field survey as well as laboratory processing work during carrying out this study.
REFERENCES
Siva Subramanian KS, Amitabh S and Manda S (2003) Evaluation of Digital elevation models created from different satellite images. Proceedings of Map India Conference 2003, New Delhi, India, Jan 2003
Jacobsen K (2003) Orthoimages and DEMs by QuickBird and Ikonos. Proceedings of EARSeL “Remote Sensing in Transition”, Ghent: 513 – 525
Jayaprasad P, Narender B, Pathan SK and Ajai Generation and validation of DEM using SAR interferometry and differential GPS supported by multispectral optical data, Journal of the Indian Society of Remote Sensing 36 (4): 313-322
Satirapod C, Rizos C and Wang J (2001), GPS Single Point Positioning with SA off: How accurate can we get? Survey Review, 36(282): 380-386.
Clavet D, Lasserre M, and Pouliot J (1993), GPS Control for 1:50,000-Scale Topographic Mapping from Satellite Images. Photogrammetric Engineering & Remote Sensing, 59(1): 107-111
Wilkie DS (1990) GPS Location Data: An Aid to Satellite Image Analyses of Poorly Mapped Regions. International Journal of Remote Sensing, 11(4): 653-658.
Barbarella M, Mancini F and Zanni M (2003) Rectification of high resolution satellite data: evaluating accuracy for map updating. Proceedings of the ASPRS/MAPPS conference
Barbarella M, Mancini F. and Zanni M (2003) Processing of high resolution satellite data for map updating. Proceedings of 30th International Symposium on Remote Sensing of Environment, Honolulu, Hawaii, USA, Nov. 2003.
NLRMP guidelines by LRD, Dept. of Land Resources, Govt. of India