
C1OlapQuickStart
80
ComponentOne Olap for WinForms
-
Upload
hiepltsdsgthh -
Category
Documents
-
view
49 -
download
5
Transcript of C1OlapQuickStart

ComponentOne
Olap for WinForms
Copyright 1987-2009 ComponentOne LLC. All rights reserved.
Corporate HeadquartersComponentOne LLC201 South Highland Avenue3rd FloorPittsburgh, PA 15206 · USA
Internet: [email protected] site: http://www.componentone.com
SalesE-mail: [email protected]: 1.800.858.2739 or 1.412.681.4343 (Pittsburgh, PA USA Office)
TrademarksComponentOne OLAP for WinForms and the ComponentOne OLAP for WinForms logo are trademarks of ComponentOne LLC. ComponentOne is a registered trademark of ComponentOne LLC. All other trademarks used herein are the properties of their respective owners.
WarrantyComponentOne warrants that the original media is free from defects in material and workmanship, assuming normal use, for a period of 90 days from the date of purchase. If a defect occurs during this time, you may return the defective media to ComponentOne, along with a dated proof of purchase, and ComponentOne will replace it at no cost to you. After 90 days, you may obtain a replacement for a defective media by sending your request and a check for $25 (to cover postage and handling) to ComponentOne at the above address.
Except for the express warranty of the original media set forth herein, ComponentOne makes no other warranties, express or implied. Every attempt has been made to ensure that the information contained in this manual is correct as of the time it was made public. ComponentOne does not warrant and therefore shall not be liable for any errors or omissions that the software documentation may contain. ComponentOne’s liability is limited to the amount you paid for the product. ComponentOne is not and shall not be held liable for any special, punitive, incidental, consequential, or any other damages that may result from your use of the software.
Copying and DistributionWhile you are welcome to make backup copies of the software for your own use and protection, you are not permitted to make copies for the use of the software by anyone else. We put a lot of time and effort into creating this product, and we appreciate your support in seeing that it is used by licensed users only.
This manual was produced using ComponentOne Doc-To-Help.™

· iii
Table of ContentsComponentOne OLAP for WinForms Overview ......................................................................... 1
Installing OLAP for WinForms ...........................................................................................................1OLAP for WinForms Setup Files.........................................................................................................1System Requirements..........................................................................................................................2Installing Demonstration Versions .......................................................................................................2Uninstalling OLAP for WinForms.......................................................................................................2End-User License Agreement...............................................................................................................2Licensing FAQs..................................................................................................................................2What is Licensing?..............................................................................................................................2How does Licensing Work? .................................................................................................................3Common Scenarios.............................................................................................................................3Troubleshooting..................................................................................................................................5Technical Support...............................................................................................................................7Redistributable Files............................................................................................................................8About this Documentation ..................................................................................................................8Namespaces .......................................................................................................................................8Creating a .NET Project ......................................................................................................................9Adding the OLAP for WinForms Components to a Project ................................................................. 10
What is C1Olap...................................................................................................................13
Introduction to OLAP ..........................................................................................................13
Key Features.......................................................................................................................15
C1Olap Architecture ............................................................................................................17C1OlapPage ..................................................................................................................................... 17C1OlapPanel .................................................................................................................................... 18C1OlapGrid ..................................................................................................................................... 20C1OlapChart .................................................................................................................................... 20C1OlapPrintDocument ..................................................................................................................... 20
OLAP for WinForms Quick Start ............................................................................................21An OLAP Application with No Code................................................................................................. 21Creating OLAP Views....................................................................................................................... 22Creating OLAP Reports .................................................................................................................... 24Copying Data to Excel ...................................................................................................................... 25Summarizing Data............................................................................................................................ 25Drilling Down on the Data................................................................................................................ 26Customizing the C1OlapPage ............................................................................................................ 27Persisting OLAP Views..................................................................................................................... 27Creating Predefined Views................................................................................................................. 29Using LINQ as an OLAP Data Source............................................................................................... 31Large Data Sources........................................................................................................................... 33Building a Custom User Interface....................................................................................................... 40Configuring Fields in Code................................................................................................................ 46
OLAP for WinForms Design-Time Support...............................................................................51OLAP for WinForms Smart Tags ...................................................................................................... 51C1OlapPanel Smart Tag.................................................................................................................... 51C1OlapPage Smart Tag..................................................................................................................... 52C1OlapChart Smart Tag.................................................................................................................... 54C1OlapGrid Smart Tag ..................................................................................................................... 55

iv · ComponentOne OLAP for WinForms Overview
Using the C1OlapPage ToolStrip ....................................................................................................... 58
OLAP for WinForms Samples ................................................................................................69
OLAP for WinForms Task-Based Help .....................................................................................71Binding C1OlapPage or C1OlapPanel to a Data Source....................................................................... 71Binding C1OlapChart to a C1OlapPanel ............................................................................................ 71Binding C1OlapGrid to a C1OlapPanel.............................................................................................. 72Run-Time Tasks ............................................................................................................................... 72Removing a Field from a Data View .................................................................................................. 72Filtering Data in a Field .................................................................................................................... 72Specifying a Subtotal Function........................................................................................................... 74Formatting Numeric Data ................................................................................................................. 75Creating a Report.............................................................................................................................. 75Printing a Report .............................................................................................................................. 76

Installing OLAP for WinForms · 1
ComponentOne OLAP for WinForms Overview
Getting StartedCreate grids, charts, and ad-hoc reports that can be saved, exported, or printed in no time with ComponentOne OLAP for WinForms. Use a single control, C1OlapPage, which provides a complete OLAP user interface, or customize your application with the C1OlapPanel, C1OlapGrid, C1OlapChart, and C1OlapPrintDocument controls.
To get started, review the following topics:
- Key Features (page 15)
- OLAP for WinForms Quick Start (page 21)
- OLAP for WinForms Samples (page 69)
Installing OLAP for WinFormsThe following sections provide helpful information on installing ComponentOne OLAP for WinForms.
OLAP for WinForms Setup FilesThe ComponentOne OLAP for WinForms installation program will create the following directory: C:\Program Files\ComponentOne\OLAP for WinForms. This directory contains the following subdirectories:
bin Contains copies of all ComponentOne binaries (DLLs, EXEs).
H2Help Contains online documentation for all Studio components.
Samples
Samples for the product are installed in the ComponentOne Samples folder by default. The path of the ComponentOne Samples directory is slightly different on Windows XP and Windows Vista machines:
Windows XP path: C:\Documents and Settings\<username>\My Documents\ComponentOne Samples
Windows Vista path: C:\Users\<username>\Documents\ComponentOne Samples
The ComponentOne Samples folder contains the following subdirectories:
Common Contains support and data files, including C1NWind.mdb, that are used by many of the demo programs.
C1Olap Contains samples and tutorials for ComponentOne OLAP for WinForms.

2 · ComponentOne OLAP for WinForms Overview
System RequirementsSystem requirements include the following:
Operating Systems: Windows® 2000
Windows Server® 2003
Windows Server 2008
Windows XP SP2
Windows Vista™
Windows 7
Environments: .NET Framework 2.0 or later
C# .NET
Visual Basic .NET
Disc Drive: CD or DVD-ROM drive if installing from CD
Installing Demonstration VersionsIf you wish to try ComponentOne OLAP for WinForms and do not have a serial number, follow the steps through the installation wizard and use the default serial number.
The only difference between unregistered (demonstration) and registered (purchased) versions of our products is that registered versions will stamp every application you compile so a ComponentOne banner will not appear when your users run the applications.
Uninstalling OLAP for WinFormsTo uninstall ComponentOne OLAP for WinForms:
1. Open the Control Panel and select Add or Remove Programs (Programs and Features in Vista).
2. Select ComponentOne OLAP for WinForms and click the Remove button.
3. Click Yes to remove the program.
End-User License AgreementAll of the ComponentOne licensing information, including the ComponentOne end-user license agreements, frequently asked licensing questions, and the ComponentOne licensing model, is available online at http://www.componentone.com/SuperPages/Licensing/.
Licensing FAQsThis section describes the main technical aspects of licensing. It may help the user to understand and resolve licensing problems he may experience when using ComponentOne .NET and ASP.NET products.
What is Licensing?Licensing is a mechanism used to protect intellectual property by ensuring that users are authorized to use software products.

Licensing FAQs · 3
Licensing is not only used to prevent illegal distribution of software products. Many software vendors, including ComponentOne, use licensing to allow potential users to test products before they decide to purchase them.
Without licensing, this type of distribution would not be practical for the vendor or convenient for the user. Vendors would either have to distribute evaluation software with limited functionality, or shift the burden of managing software licenses to customers, who could easily forget that the software being used is an evaluation version and has not been purchased.
How does Licensing Work?ComponentOne uses a licensing model based on the standard set by Microsoft, which works with all types of components.
Note: The Compact Framework components use a slightly different mechanism for run time licensing than the other ComponentOne components due to platform differences.
When a user decides to purchase a product, he receives an installation program and a Serial Number. During the installation process, the user is prompted for the serial number that is saved on the system. (Users can also enter the serial number by clicking the License button on the About Box of any ComponentOne product, ifavailable, or by rerunning the installation and entering the serial number in the licensing dialog.)
When a licensed component is added to a form or Web page, Visual Studio obtains version and licensing information from the newly created component. When queried by Visual Studio, the component looks for licensing information stored in the system and generates a run-time license and version information, which Visual Studio saves in the following two files:
• An assembly resource file which contains the actual run-time license
• A "licenses.licx" file that contains the licensed component strong name and version information
These files are automatically added to the project.
In WinForms and ASP.NET 1.x applications, the run-time license is stored as an embedded resource in the assembly hosting the component or control by Visual Studio. In ASP.NET 2.x applications, the run-time license may also be stored as an embedded resource in the App_Licenses.dll assembly, which is used to store all run-time licenses for all components directly hosted by WebForms in the application. Thus, the App_licenses.dll must always be deployed with the application.
The licenses.licx file is a simple text file that contains strong names and version information for each of the licensed components used in the application. Whenever Visual Studio is called upon to rebuild the application resources, this file is read and used as a list of components to query for run-time licenses to be embedded in the appropriate assembly resource. Note that editing or adding an appropriate line to this file can force Visual Studio to add run-time licenses of other controls as well.
Note that the licenses.licx file is usually not shown in the Solution Explorer; it appears if you press the Show All Files button in the Solution Explorer's Toolbox, or from Visual Studio's main menu, select Show All Fileson the Project menu.
Later, when the component is created at run time, it obtains the run-time license from the appropriate assembly resource that was created at design time and can decide whether to simply accept the run-time license, to throw an exception and fail altogether, or to display some information reminding the user that the software has not been licensed.
All ComponentOne products are designed to display licensing information if the product is not licensed. None will throw licensing exceptions and prevent applications from running.
Common ScenariosThe following topics describe some of the licensing scenarios you may encounter.

4 · ComponentOne OLAP for WinForms Overview
Creating components at design timeThis is the most common scenario and also the simplest: the user adds one or more controls to the form, the licensing information is stored in the licenses.licx file, and the component works.
Note that the mechanism is exactly the same for Windows Forms and Web Forms (ASP.NET) projects.
Creating components at run time This is also a fairly common scenario. You do not need an instance of the component on the form, but would like to create one or more instances at run time.
In this case, the project will not contain a licenses.licx file (or the file will not contain an appropriate run-time license for the component) and therefore licensing will fail.
To fix this problem, add an instance of the component to a form in the project. This will create the licenses.licx file and things will then work as expected. (The component can be removed from the form after the licenses.licx file has been created).
Adding an instance of the component to a form, then removing that component, is just a simple way of adding a line with the component strong name to the licenses.licx file. If desired, you can do this manually using notepad or Visual Studio itself by opening the file and adding the text. When Visual Studio recreates the application resources, the component will be queried and its run-time license added to the appropriate assembly resource.
Inheriting from licensed componentsIf a component that inherits from a licensed component is created, the licensing information to be stored in the form is still needed. This can be done in two ways:
• Add a LicenseProvider attribute to the component.
This will mark the derived component class as licensed. When the component is added to a form, Visual Studio will create and manage the licenses.licx file, and the base class will handle the licensing process as usual. No additional work is needed. For example:
[LicenseProvider(typeof(LicenseProvider))]class MyGrid: C1.Win.C1FlexGrid.C1FlexGrid{
// ...}
• Add an instance of the base component to the form.
This will embed the licensing information into the licenses.licx file as in the previous scenario, and the base component will find it and use it. As before, the extra instance can be deleted after the licenses.licx file has been created.
Please note, that C1 licensing will not accept a run time license for a derived control if the run time license is embedded in the same assembly as the derived class definition, and the assembly is a DLL. This restriction is necessary to prevent a derived control class assembly from being used in other applications without a design time license. If you create such an assembly, you will need to take one of the actions previously described create a component at run time.
Using licensed components in console applicationsWhen building console applications, there are no forms to add components to, and therefore Visual Studio won't create a licenses.licx file.
In these cases, create a temporary Windows Forms application and add all the desired licensed components to a form. Then close the Windows Forms application and copy the licenses.licx file into the console application project.

Licensing FAQs · 5
Make sure the licenses.licx file is configured as an embedded resource. To do this, right-click the licenses.licx file in the Solution Explorer window and select Properties. In the property window, set the Build Actionproperty to Embedded Resource.
Using licensed components in Visual C++ applicationsThere is an issue in VC++ 2003 where the licenses.licx is ignored during the build process; therefore, the licensing information is not included in VC++ applications.
To fix this problem, extra steps must be taken to compile the licensing resources and link them to the project. Note the following:
1. Build the C++ project as usual. This should create an .exe file and also a licenses.licx file with licensing information in it.
2. Copy the licenses.licx file from the app directory to the target folder (Debug or Release).
3. Copy the C1Lc.exe utility and the licensed .dlls to the target folder. (Don't use the standard lc.exe, it has bugs.)
4. Use C1Lc.exe to compile the licenses.licx file. The command line should look like this:c1lc /target:MyApp.exe /complist:licenses.licx /i:C1.Win.C1FlexGrid.dll
5. Link the licenses into the project. To do this, go back to Visual Studio, right-click the project, select properties, and go to the Linker/Command Line option. Enter the following:/ASSEMBLYRESOURCE:Debug\MyApp.exe.licenses
6. Rebuild the executable to include the licensing information in the application.
Using licensed components with automated testing productsAutomated testing products that load assemblies dynamically may cause them to display license dialogs. This is the expected behavior since the test application typically does not contain the necessary licensing information, and there is no easy way to add it.
This can be avoided by adding the string "C1CheckForDesignLicenseAtRuntime" to the AssemblyConfiguration attribute of the assembly that contains or derives from ComponentOne controls. This attribute value directs the ComponentOne controls to use design time licenses at run time.
For example:#if AUTOMATED_TESTING
[AssemblyConfiguration("C1CheckForDesignLicenseAtRuntime")]#endif
public class MyDerivedControl : C1LicensedControl{
// ...}
Note that the AssemblyConfiguration string may contain additional text before or after the given string, so the AssemblyConfiguration attribute can be used for other purposes as well. For example:
[AssemblyConfiguration("C1CheckForDesignLicenseAtRuntime,BetaVersion")]THIS METHOD SHOULD ONLY BE USED UNDER THE SCENARIO DESCRIBED. It requires a design time license to be installed on the testing machine. Distributing or installing the license on other computers is a violation of the EULA.
TroubleshootingWe try very hard to make the licensing mechanism as unobtrusive as possible, but problems may occur for a number of reasons.
Below is a description of the most common problems and their solutions.

6 · ComponentOne OLAP for WinForms Overview
I have a licensed version of a ComponentOne product but I still get the splash screen when I run my project.
If this happens, there may be a problem with the licenses.licx file in the project. It either doesn't exist, contains wrong information, or is not configured correctly.
First, try a full rebuild (Rebuild All from the Visual Studio Build menu). This will usually rebuild the correct licensing resources.
If that fails follow these steps:
1. Open the project and go to the Solution Explorer window.
2. Click the Show All Files button on the top of the window.
3. Find the licenses.licx file and open it. If prompted, continue to open the file.
4. Change the version number of each component to the appropriate value. If the component does not appear in the file, obtain the appropriate data from another licenses.licx file or follow the alternate procedure following.
5. Save the file, then close the licenses.licx tab.
6. Rebuild the project using the Rebuild All option (not just Rebuild).
Alternatively, follow these steps:
1. Open the project and go to the Solution Explorer window.
2. Click the Show All Files button on the top of the window.
3. Find the licenses.licx file and delete it.
4. Close the project and reopen it.
5. Open the main form and add an instance of each licensed control.
6. Check the Solution Explorer window, there should be a licenses.licx file there.
7. Rebuild the project using the Rebuild All option (not just Rebuild).
For ASP.NET 2.x applications, follow these steps:
1. Open the project and go to the Solution Explorer window.
2. Find the licenses.licx file and right-click it.
3. Select the Rebuild Licenses option (this will rebuild the App_Licenses.licx file).
4. Rebuild the project using the Rebuild All option (not just Rebuild).
I have a licensed version of a ComponentOne product on my Web server but the components still behave as unlicensed.
There is no need to install any licenses on machines used as servers and not used for development.
The components must be licensed on the development machine, therefore the licensing information will be saved into the executable (.exe or .dll) when the project is built. After that, the application can be deployed on any machine, including Web servers.
For ASP.NET 2.x applications, be sure that the App_Licenses.dll assembly created during development of the application is deployed to the bin application bin directory on the Web server.
If your ASP.NET application uses WinForms user controls with constituent licensed controls, the runtime license is embedded in the WinForms user control assembly. In this case, you must be sure to rebuild and update the user control whenever the licensed embedded controls are updated.

Technical Support · 7
I downloaded a new build of a component that I have purchased, and now I'm getting the splash screen when I build my projects.
Make sure that the serial number is still valid. If you licensed the component over a year ago, your subscription may have expired. In this case, you have two options:
Option 1 – Renew your subscription to get a new serial number.
If you choose this option, you will receive a new serial number that you can use to license the new components (from the installation utility or directly from the About Box).
The new subscription will entitle you to a full year of upgrades and to download the latest maintenance builds directly from http://prerelease.componentone.com/.
Option 2 – Continue to use the components you have.
Subscriptions expire, products do not. You can continue to use the components you received or downloaded while your subscription was valid.
Technical SupportComponentOne offers various support options. For a complete list and a description of each, visit the ComponentOne Web site at http://www.componentone.com/Support.
Some methods for obtaining technical support include:
• Online Support via HelpCentralComponentOne HelpCentral provides customers with a comprehensive set of technical resources in the form of FAQs, samples, Version Release History, Articles, searchable Knowledge Base, searchable Online Help and more. We recommend this as the first place to look for answers to your technical questions.
• Online Support via our Incident Submission FormThis online support service provides you with direct access to our Technical Support staff via an online incident submission form. When you submit an incident, you'll immediately receive a response via e-mail confirming that you've successfully created an incident. This email will provide you with an Issue Reference ID and will provide you with a set of possible answers to your question from our Knowledgebase. You will receive a response from one of the ComponentOne staff members via e-mail in 2 business days or less.
• Peer-to-Peer Product Forums and NewsgroupsComponentOne peer-to-peer product forums and newsgroups are available to exchange information, tips, and techniques regarding ComponentOne products. ComponentOne sponsors these areas as a forum for users to share information. While ComponentOne does not provide direct support in the forums and newsgroups, we periodically monitor them to ensure accuracy of information and provide comments when appropriate. Please note that a ComponentOne User Account is required to participate in the ComponentOne Product Forums.
• Installation IssuesRegistered users can obtain help with problems installing ComponentOne products. Contact technical support by using the online incident submission form or by phone (412.681.4738). Please note that this does not include issues related to distributing a product to end-users in an application.
• DocumentationComponentOne documentation is installed with each of our products and is also available online at HelpCentral. If you have suggestions on how we can improve our documentation, please email the Documentation team. Please note that e-mail sent to the Documentation team is for documentation feedback only. Technical Support and Sales issues should be sent directly to their respective departments.
Note: You must create a ComponentOne Account and register your product with a valid serial number to obtain support using some of the above methods.

8 · ComponentOne OLAP for WinForms Overview
Redistributable FilesComponentOne OLAP for WinForms is developed and published by ComponentOne LLC. You may use it to develop applications in conjunction with Microsoft Visual Studio or any other programming environment that enables the user to use and integrate the control(s). You may also distribute, free of royalties, the following Redistributable Files with any such application you develop to the extent that they are used separately on a single CPU on the client/workstation side of the network:
• C1.Win.Olap.dll
• C1.C1Pdf.2.dll
• C1.Win.C1Chart.2.dll
• C1.Win.C1FlexGrid.2.dll
Site licenses are available for groups of multiple developers. Please contact [email protected] for details.
About this DocumentationAcknowledgements
Microsoft, Windows, Windows Vista, Windows Server, and Visual Studio are either registered trademarks or trademarks of Microsoft Corporation in the United States and/or other countries.
ComponentOne
If you have any suggestions or ideas for new features or controls, please call us or write:
Corporate Headquarters
ComponentOne LLC201 South Highland Avenue3rd FloorPittsburgh, PA 15206 • USA412.681.4343412.681.4384 (Fax)
http://www.componentone.com/
ComponentOne Doc-To-Help
This documentation was produced using ComponentOne Doc-To-Help® Enterprise.
NamespacesNamespaces organize the objects defined in an assembly. Assemblies can contain multiple namespaces, which can in turn contain other namespaces. Namespaces prevent ambiguity and simplify references when using large groups of objects such as class libraries.
The namespace for the OLAP for WinForms components is C1.Win.Olap. The following code fragment shows how to declare a C1OlapPage component using the fully qualified name for this class:
• Visual BasicDim OlapPage1 As C1.Win.Olap.C1OlapPage
• C#C1.Win.Olap.C1OlapPage OlapPage1;
Namespaces address a problem sometimes known as namespace pollution, in which the developer of a class library is hampered by the use of similar names in another library. These conflicts with existing components are sometimes called name collisions.

Creating a .NET Project · 9
For example, if you create a new class named C1OlapPage, you can use it inside your project without qualification. However, the C1.Win.Olap assembly also implements a class called C1OlapPage. So, if you want to use the C1OlapPage class in the same project, you must use a fully qualified reference to make the reference unique. If the reference is not unique, Visual Studio .NET produces an error stating that the name is ambiguous. The following code snippet demonstrates how to declare these objects:
• Visual Basic' Define a new C1OlapPage objectDim MyOlapPage as C1OlapPage' Define a new C1Olap.C1OlapPage object.Dim C1OlapPage as C1.Win.Olap.C1OlapPage
• C#// Define a new C1OlapPage objectC1OlapPage MyOlap;// Define a new C1Olap.C1OlapPage object.C1.Win.Olap.C1Olap C1OlapPage;
Fully qualified names are object references that are prefixed with the name of the namespace where the object is defined. You can use objects defined in other projects if you create a reference to the class (by choosing Add Reference from the Project menu) and then use the fully qualified name for the object in your code.
Fully qualified names prevent naming conflicts because the compiler can always determine which object is being used. However, the names themselves can get long and cumbersome. To get around this, you can use the Imports statement (using in C#) to define an alias — an abbreviated name you can use in place of a fully qualified name. For example, the following code snippet creates aliases for two fully qualified names, and uses these aliases to define two objects:
• Visual BasicImports C1OlapPage = C1.Win.Olap.C1OlapPageImports MyOlapPage = MyProject.C1OlapPage
Dim s1 As C1OlapPageDim s2 As MyOlapPage
• C#using C1OlapPage = C1.Win.Olap.C1OlapPage;using MyOlapPage = MyProject.C1OlapPage;
C1OlapPage s1;MyOlapPage s2;
If you use the Imports statement without an alias, you can use all the names in that namespace without qualification, provided they are unique to the project.
Creating a .NET ProjectTo create a new .NET project, complete the following steps:
1. From the File menu in Microsoft Visual Studio .NET, select New Project. The New Project dialog box opens.
2. Under Project Types, choose either Visual Basic or Visual C#. Note that one of these options may be located under Other Languages.
3. Select Windows Application from the list of Templates in the right pane.
4. Enter or browse for a location for your application in the Location field and click OK. A new Microsoft Visual Studio .NET project is created in the specified location. In addition, a new Form1 is displayed in the Designer view.

10 · ComponentOne OLAP for WinForms Overview
5. Double-click one of the OLAP for WinForms components in the Toolbox to add it to Form1. For information on adding a component to the Toolbox, see Adding the OLAP for WinForms Components to a Project (page 10).
Adding the OLAP for WinForms Components to a ProjectWhen you install ComponentOne OLAP for WinForms, the Create a ComponentOne Visual Studio Toolbox Tab checkbox is checked, by default, in the installation wizard. When you open Visual Studio, you will notice a ComponentOne OLAP for WinForms tab containing the ComponentOne controls has automatically been added to the Toolbox.
If you decide to uncheck the Create a ComponentOne Visual Studio Toolbox Tab checkbox during installation, you can manually add ComponentOne controls to the Toolbox at a later time.
ComponentOne OLAP for WinForms provides the following controls:
• C1OlapPanel
• C1OlapPage
• C1OlapPrintDocument
• C1OlapChart
• C1OlapGrid
• C1PdfDocument
• C1FlexGrid
• C1Chart
To use these controls, add them to the form or add a reference to the C1.Win.Olap assembly to your project.
Adding OLAP for WinForms Controls to the Toolbox
To add ComponentOne OLAP for WinForms controls to the Visual Studio Toolbox:
1. Open the Visual Studio IDE (Microsoft Development Environment). Make sure the Toolbox is visible (select Toolbox in the View menu if necessary) and right-click it to open the context menu.
2. To make the OLAP for WinForms components appear on their own tab in the Toolbox, select Add Tabfrom the context menu and type in the tab name, C1Olap, for example.
3. Right-click the tab where the components are to appear and select Choose Items from the context menu. The Choose Toolbox Items dialog box opens.
4. In the dialog box, select the .NET Framework Components tab. Sort the list by Namespace (click the Namespace column header) and check the check boxes for the components belonging to namespace C1.Win.Olap. Note that there may be more than one component for each namespace.
Adding OLAP for WinForms Controls to the Form
To add OLAP for WinForms to a form:
1. Add the OLAP for WinForms controls to the Visual Studio Toolbox.
2. Double-click a control or drag it onto your form.
Note that when you add a C1OlapPanel, C1OlapPage, C1OlapPrintDocument, C1OlapChart, or C1OlapGridcontrol to your form, references to all four assemblies (C1.C1Pdf.2.dll, C1.Win.C1Chart.2.dll, C1.Win.C1FlexGrid.2.dll, and C1.Win.Olap) are added to your project.

Adding the OLAP for WinForms Components to a Project · 11
Adding a Reference to the C1.Win.Olap Assembly
To add a reference to the assembly:
1. Select the Add Reference option from the Project menu of your project.
2. Select the ComponentOne C1Olap assembly from the list on the .NET tab or browse to find the C1.Win.Olap.dll file and click OK.
3. Double-click the form caption area to open the code window. At the top of the file, add the following Imports statements (using in C#):Imports C1.Win.Olap
Note: This makes the objects defined in the C1.Win.Olap assembly visible to the project. See Namespaces(page 8) for more information.


What is C1Olap · 13
What is C1OlapComponentOne OLAP for WinForms (C1Olap) is a suite of .NET controls that provide analytical processing features similar to those found in Microsoft Excel’s Pivot Tables and Pivot Charts.
C1Olap takes raw data in any format and provides an easy-to-use interface so users can quickly and intuitively create summaries that display the data in different ways, uncovering trends and providing valuable insights interactively. As the user modifies the way in which he wants to see the data, C1Olap instantly provides grids, charts, and reports that can be saved, exported, or printed.
Introduction to OLAPOLAP means "online analytical processing". It refers to technologies that enable the dynamic visualization and analysis of data.
Typical OLAP tools include "OLAP cubes" and pivot tables such as the ones provided by Microsoft Excel. These tools take large sets of data and summarize it by grouping records based on a set of criteria. For example, an OLAP cube might summarize sales data grouping it by product, region, and period. In this case, each grid cell would display the total sales for a particular product, in a particular region, and for a specific period. This cell would normally represent data from several records in the original data source.
OLAP tools allow users to redefine these grouping criteria dynamically (on-line), making it easy to perform ad-hoc analysis on the data and discover hidden patterns.
For example, consider the following table:
Date Product Region SalesOct 2007 Product A North 12Oct 2007 Product B North 15Oct 2007 Product C South 4Oct 2007 Product A South 3Nov 2007 Product A South 6Nov 2007 Product C North 8Nov 2007 Product A North 10Nov 2007 Product B North 3
Now suppose you were asked to analyze this data and answer questions such as:
• Are sales going up or down?
• Which products are most important to the company?
• Which products are most popular in each region?
In order to answer these simple questions, you would have to summarize the data to obtain tables such as these:
Sales by Date and by ProductDate Product A Product B Product C TotalOct 2007 15 15 4 34Nov 2007 16 3 8 27Total 31 18 12 61

14 · Introduction to OLAP
Sales by Product and by RegionProduct North South TotalProduct A 22 9 31Product B 18 18Product C 8 4 12Total 48 13 61
Each cell in the summary tables represents several records in the original data source, where one or more values fields are summarized (sum of sales in this case) and categorized based on the values of other fields (date, product, or region in this case).
This can be done easily in a spreadsheet, but the work is tedious, repetitive, and error-prone. Even if you wrote a custom application to summarize the data, you would probably have to spend a lot of time maintaining it to add new views, and users would be constrained in their analyses to the views that you implemented.
OLAP tools allow users to define the views they want interactively, in ad-hoc fashion. They can use pre-defined views or create and save new ones. Any changes to the underlying data are reflected automatically in the views, and users can create and share reports showing these views. In short, OLAP is a tool that provides flexible and efficient data analysis.

Key Features · 15
Key FeaturesThe following are some of the main features of ComponentOne OLAP for WinForms that you may find useful:
• OLAP for WinForms provides ultimate flexibility for building OLAP applicationsDrop one control, C1OlapPage, on your form and set the data source to start displaying your data in a grid or chart–it's that easy! But suppose you need to show multiple charts or grids. No problem. OLAP for WinForms also provides the C1OlapPanel, C1OlapChart, and C1OlapGrid controls to give you the flexibility you need. See the C1Olap Architecture (page 17) for an overview of each of the controls.
• Choose from five chart types and twenty-two palette options to enhance your chartsC1OlapChart provides the most common chart types to display your information, including: Bar, Column, Area, Line, and Scatter. You can select from twenty-two palette options that define the colors of the chart and legend items. See Using the Chart Menu (page 59) to view all of the chart types and palettes.
• Print, preview, or export data to PDFYou can create and preview reports containing data, grids, or charts and then print or export them to PDF. See Creating OLAP Reports (page 24) and the OLAP for WinForms Task-Based Help (page 71) for more information.
• Remove a field or data in a field from the grid or chart viewYou can easily filter a field so it doesn't appear in your grid or chart view. Simply drag the field to the Filter area of a C1OlapPanel; see Removing a Field from a Data View (page 72) for more information. If you want to filter on data in a field, for example, if you want to find all employees whose last names start with "Sim", you can use the Field Settings dialog box. See Filtering Data in a Field for detailed steps.
• Display information in a grid or chart viewOLAP for WinForms provides a C1OlapGrid and C1OlapChart control to display data. These controls are built into the C1OlapPage control, but they are also available as separate controls so you can customize your OLAP application. See the C1Olap Architecture (page 17) for an overview of each of the controls.
• Decide how information is displayed at run timeUse the C1OlapPanel to determine which fields of your data source should be used to display your data and how. Drag fields between the lower areas of the C1OlapPanel to create a filter, column headers, row headers, or get the sum of values from a column or row. For more information, see C1OlapPanel (page 18).


C1OlapPage · 17
C1Olap ArchitectureC1Olap includes the following controls:
C1OlapPageThe C1OlapPage control is the easiest way to develop OLAP applications quickly and easily. It provides a complete OLAP user interface built using the other controls in C1Olap. The C1OlapPage object model exposes the inner controls, so you can easily customize it by adding or remove interface elements. If you want more extensive customization, the source code is included and you can use it as a basis for your own implementation.
The diagram below shows how the C1OlapPage is organized:
18 · C1Olap Architecture
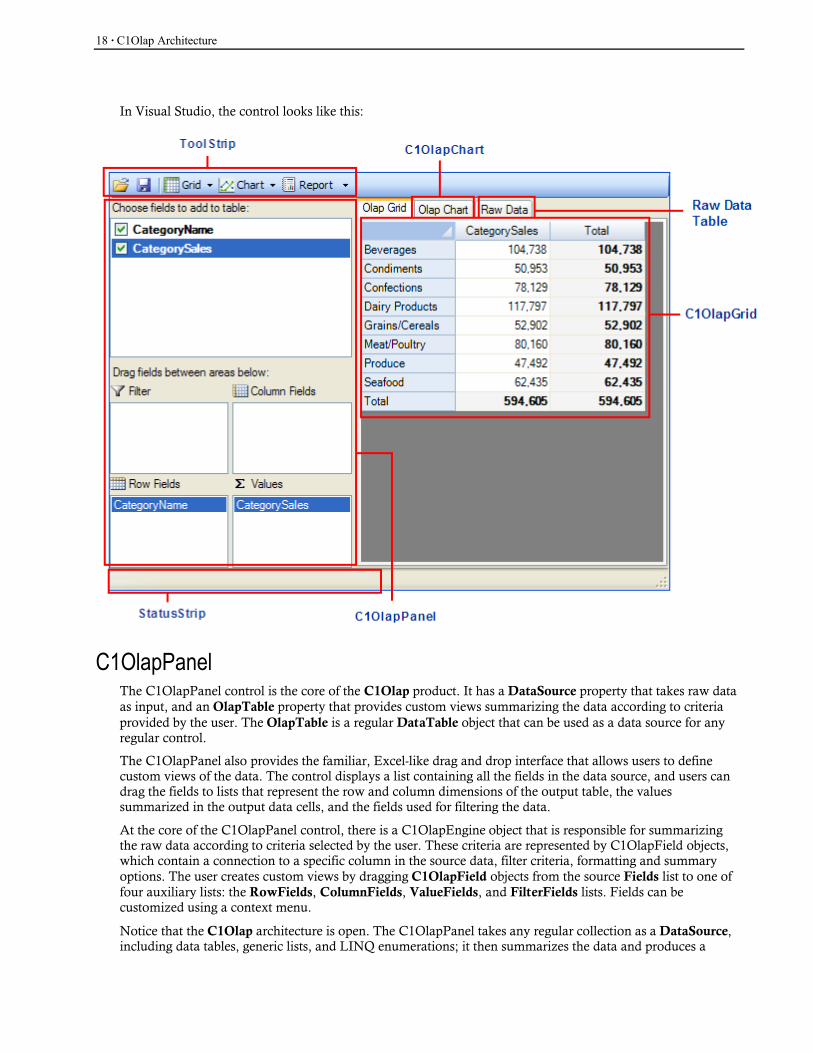
In Visual Studio, the control looks like this:
C1OlapPanelThe C1OlapPanel control is the core of the C1Olap product. It has a DataSource property that takes raw data as input, and an OlapTable property that provides custom views summarizing the data according to criteria provided by the user. The OlapTable is a regular DataTable object that can be used as a data source for any regular control.
The C1OlapPanel also provides the familiar, Excel-like drag and drop interface that allows users to define custom views of the data. The control displays a list containing all the fields in the data source, and users can drag the fields to lists that represent the row and column dimensions of the output table, the values summarized in the output data cells, and the fields used for filtering the data.
At the core of the C1OlapPanel control, there is a C1OlapEngine object that is responsible for summarizing the raw data according to criteria selected by the user. These criteria are represented by C1OlapField objects, which contain a connection to a specific column in the source data, filter criteria, formatting and summary options. The user creates custom views by dragging C1OlapField objects from the source Fields list to one of four auxiliary lists: the RowFields, ColumnFields, ValueFields, and FilterFields lists. Fields can be customized using a context menu.
Notice that the C1Olap architecture is open. The C1OlapPanel takes any regular collection as a DataSource, including data tables, generic lists, and LINQ enumerations; it then summarizes the data and produces a

C1OlapPanel · 19
regular DataTable as output. C1Olap includes two custom controls that are optimized for displaying the OLAP data, the C1OlapGrid and C1OlapChart, but you could use any other control as well.
The C1OlapPanel looks like this:
C1OlapPanel Area Description
Filter Specifies the field to filter.
Row Field The items in the field specified become the row headers of a grid. These items populate the Y-axis in a chart.
Column Fields The items in the field specified become the column headers of a grid. These items are used to populate the legend in a chart.
Values Shows the sum of the field specified.
If you right-click fields in the Filter, Column Fields, Row Fields, or Values area at run time, a context menu appears, allowing you to move the field to a different area. You can also remove the field or click Field Settings to format and apply a filter to the field. See Filtering Data in a Field (page 72) for more information.

20 · C1Olap Architecture
C1OlapGridThe C1OlapGrid control is used to display OLAP tables. It extends the C1FlexGrid control and provides automatic data binding to C1OlapPanel objects, grouped row and column headers, as well as custom behaviors for resizing columns, copying data to the clipboard, and showing details for any given cell.
The C1OlapGrid control extends the C1FlexGrid control, our general-purpose grid control. This means the whole C1FlexGrid object model is also available to C1Olap users. For example, you can export the grid contents to Excel or use styles and owner-draw cells to customize the grid’s appearance.
To populate C1OlapGrid, bind it to a C1OlapPanel that is bound to a data source. See Binding C1OlapGrid to a C1OlapPanel (page 72) for steps on how to do this.
For more information on the C1FlexGrid control, see the ComponentOne FlexGrid for WinFormsdocumentation.
C1OlapChartThe C1OlapChart control is used to display OLAP charts. It extends the C1Chart control and provides automatic data binding to C1OlapPanel objects, automatic tooltips, chart type and palette selection.
The C1OlapChart control extends the C1Chart control, our general-purpose charting control. This means the whole C1Chart object model is also available to C1Olap users. For example, you can export the chart to different file formats including PNG and JPG or customize the chart styles and interactivity.
To populate C1OlapChart, bind it to a C1OlapPanel that is bound to a data source. See Binding C1OlapChart to a C1OlapPanel (page 71) for steps on how to do this.
For more information on the C1Chart control, see the ComponentOne 2D Chart for WinFormsdocumentation.
C1OlapPrintDocumentThe C1OlapPrintDocument component is used to create reports based on OLAP views. It extends the PrintDocument class and provides properties that allow you to specify content and formatting for showing OLAP grids, charts, and the raw data used to create the report.
For more information, see the ComponentOne Reports for WinForms documentation.

An OLAP Application with No Code · 21
OLAP for WinForms Quick StartThis section presents code walkthroughs that start with the simplest C1Olap application and progress to introduce commonly used features.
An OLAP Application with No CodeTo create the simplest C1Olap application, start by creating a new Windows Forms application and dragging a C1OlapPage control onto the form. Notice that the C1OlapPage control automatically docks to fill the form, which should look like this:
Now, let us select a data source for the application. Select the C1OlapPage control and activate the smart designer by clicking the smart tag ( ) that appears in the upper-right corner of the control. Use the combo box next to "Choose Data Source" to create a project data source and assign it to the control.

22 · OLAP for WinForms Quick Start
For this sample, find the Northwind database and select the "Invoices" view as shown below:
Note that as soon as you select the data source, the fields available appear in the C1OlapPanel on the left of the form.
The application is now ready. The following sections describe the functionality provided by default, without writing a single line of code.
Creating OLAP ViewsRun the application and you will see an interface similar to the one in Microsoft Excel. Drag the "Country" field to the "Row Fields" list and "ExtendedPrice" to the "Value Fields" list, and you will see a summary of prices charged by country as shown in the following image:

An OLAP Application with No Code · 23
Click the "Olap Chart" tab and you will see the same data in chart format, showing that the main customers are the US, Germany, and Austria.
Now drag the "Salesperson" field into the "Column Fields" list to see a new summary, this time of sales per country and per sales person. If you still have the chart tab selected, you should be looking at a chart similar to the previous one, except this time the bars are split to show how much was sold by each salesperson:
24 · OLAP for WinForms Quick Start
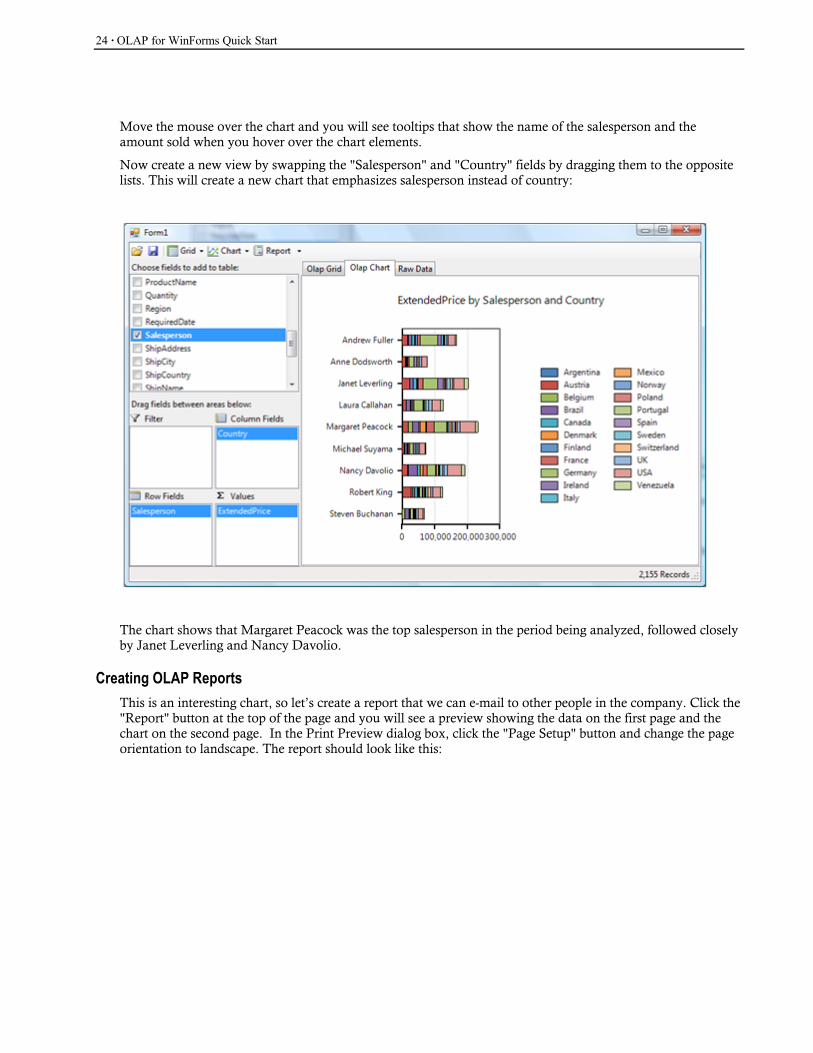
Move the mouse over the chart and you will see tooltips that show the name of the salesperson and the amount sold when you hover over the chart elements.
Now create a new view by swapping the "Salesperson" and "Country" fields by dragging them to the opposite lists. This will create a new chart that emphasizes salesperson instead of country:
The chart shows that Margaret Peacock was the top salesperson in the period being analyzed, followed closely by Janet Leverling and Nancy Davolio.
Creating OLAP ReportsThis is an interesting chart, so let’s create a report that we can e-mail to other people in the company. Click the "Report" button at the top of the page and you will see a preview showing the data on the first page and the chart on the second page. In the Print Preview dialog box, click the "Page Setup" button and change the page orientation to landscape. The report should look like this:

An OLAP Application with No Code · 25
Now you can print the report or click the "Export to PDF" button to generate a PDF file that you can send to others or post on the web.
Close the preview window and save this view by clicking the "Save" button. You can create and save as many views as you like.
Copying Data to ExcelThe built-in reports are convenient, but in some cases you may want to copy some or all the data to Excel so you can perform additional analyses including regressions, create customized reports by annotating the data or adding custom charts.
The C1OlapGrid supports the clipboard by default, so you can simply select the data you are interested in, press Control + C, then paste it directly into an Excel sheet. The row and column headers are included with the data.
Summarizing DataBefore we move on to the next example, let’s create a new view to illustrate how you can easily summarize data in different ways.
First, uncheck the check box next to the County field to remove countries from the view.
This time, drag the "Salesperson" field to the "Row Fields" list and the "OrderDate" field to the "Column Fields" list. The resulting view contains one column for each day when an order was placed. This is not very useful information, because there are too many columns to show any trends clearly. We would like to summarize the data by month or year instead.
One way to do this would be to modify the source data, either by creating a new query in SQL or by using LINQ. Both of these techniques will be described in later sections. Another way is simply to modify the parameters of the "OrderDate" field. To do this, right-click the "OrderDate" field and click Field Settings. Then select the "Format" tab in the dialog box, choose the "Custom" format, enter "yyyy", and click OK.
26 · OLAP for WinForms Quick Start
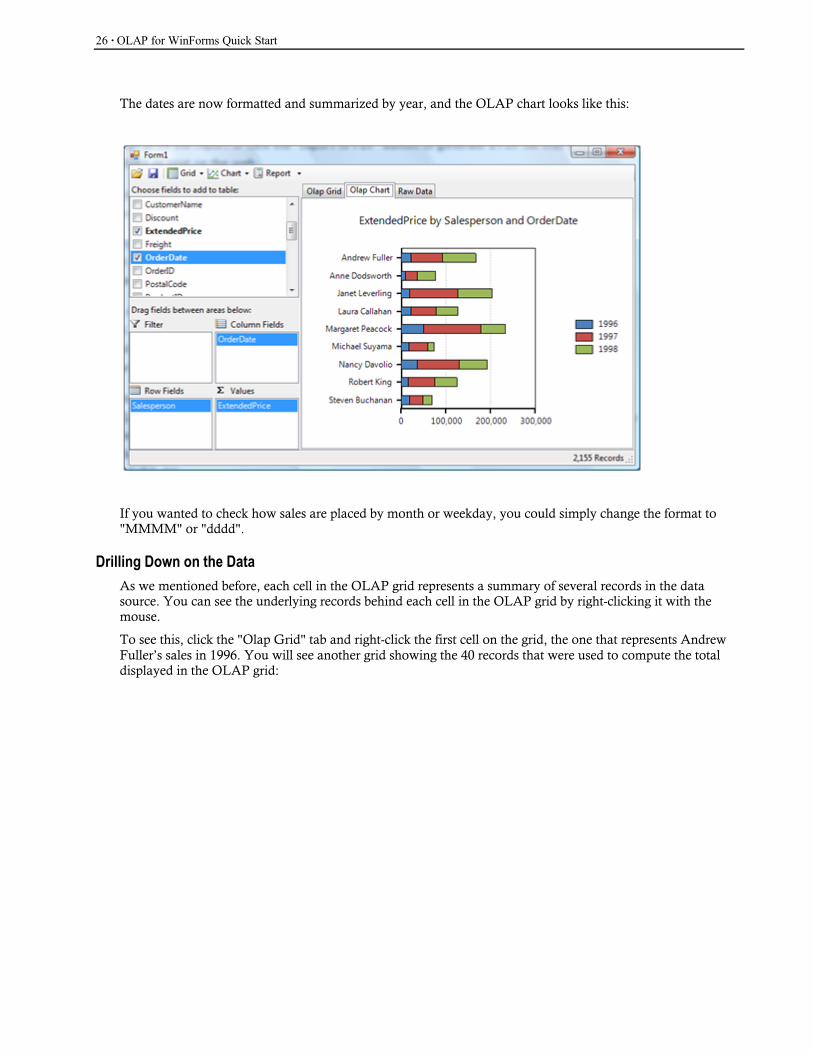
The dates are now formatted and summarized by year, and the OLAP chart looks like this:
If you wanted to check how sales are placed by month or weekday, you could simply change the format to "MMMM" or "dddd".
Drilling Down on the DataAs we mentioned before, each cell in the OLAP grid represents a summary of several records in the data source. You can see the underlying records behind each cell in the OLAP grid by right-clicking it with the mouse.
To see this, click the "Olap Grid" tab and right-click the first cell on the grid, the one that represents Andrew Fuller’s sales in 1996. You will see another grid showing the 40 records that were used to compute the total displayed in the OLAP grid:

Customizing the C1OlapPage · 27
Customizing the C1OlapPageThe previous example showed how you can create a complete OLAP application using only a C1OlapPagecontrol and no code at all. This is convenient, but in most cases you will want to customize the application and the user interface to some degree.
Persisting OLAP ViewsWe will start by adding a default view to the previous application. To do this, in your Visual Studio project, right-click the project node in the solution explorer, click the "Properties" item, then select the "Settings" tab and create a new setting of type string called "DefaultView":
This setting will be used to persist the view across sessions, so any customizations made by the user are automatically saved when he closes the application and restored next time he runs it.
28 · OLAP for WinForms Quick Start
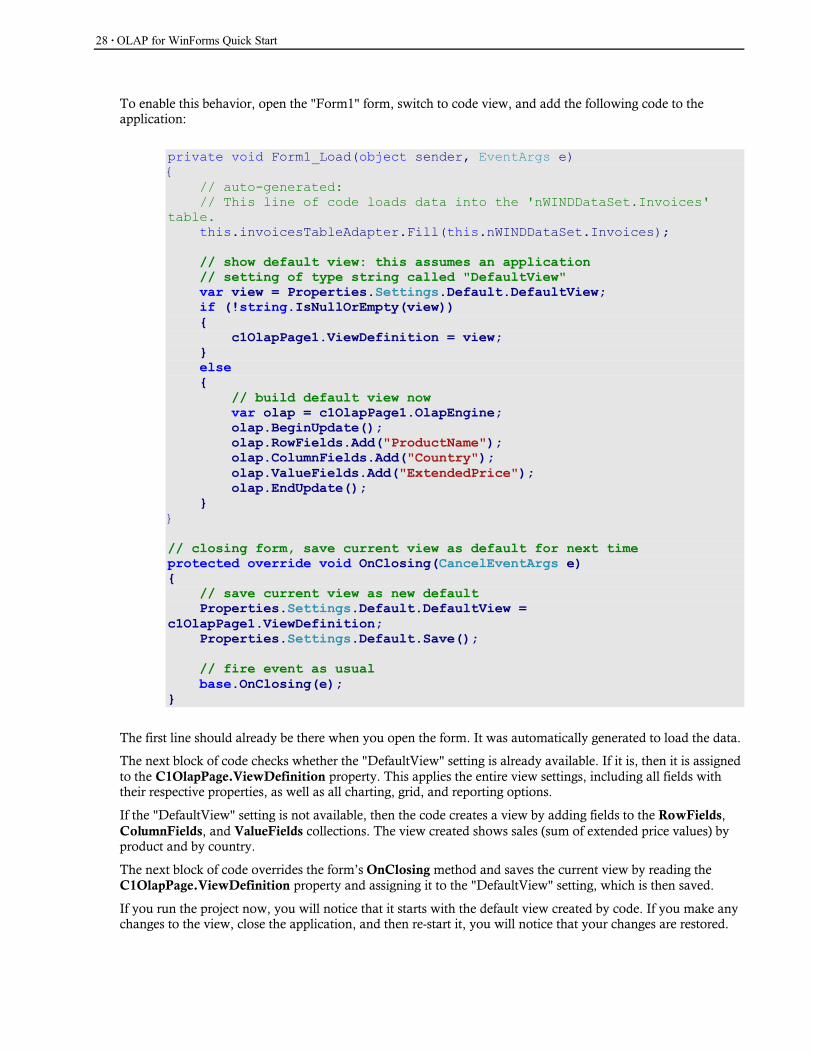
To enable this behavior, open the "Form1" form, switch to code view, and add the following code to the application:
private void Form1_Load(object sender, EventArgs e){
// auto-generated: // This line of code loads data into the 'nWINDDataSet.Invoices'
table. this.invoicesTableAdapter.Fill(this.nWINDDataSet.Invoices);
// show default view: this assumes an application// setting of type string called "DefaultView" var view = Properties.Settings.Default.DefaultView; if (!string.IsNullOrEmpty(view)){
c1OlapPage1.ViewDefinition = view;} else{
// build default view now var olap = c1OlapPage1.OlapEngine;olap.BeginUpdate();olap.RowFields.Add("ProductName");olap.ColumnFields.Add("Country");olap.ValueFields.Add("ExtendedPrice");olap.EndUpdate();
}}
// closing form, save current view as default for next timeprotected override void OnClosing(CancelEventArgs e){
// save current view as new defaultProperties.Settings.Default.DefaultView =
c1OlapPage1.ViewDefinition;Properties.Settings.Default.Save();
// fire event as usual base.OnClosing(e);
}
The first line should already be there when you open the form. It was automatically generated to load the data.
The next block of code checks whether the "DefaultView" setting is already available. If it is, then it is assigned to the C1OlapPage.ViewDefinition property. This applies the entire view settings, including all fields with their respective properties, as well as all charting, grid, and reporting options.
If the "DefaultView" setting is not available, then the code creates a view by adding fields to the RowFields, ColumnFields, and ValueFields collections. The view created shows sales (sum of extended price values) by product and by country.
The next block of code overrides the form’s OnClosing method and saves the current view by reading theC1OlapPage.ViewDefinition property and assigning it to the "DefaultView" setting, which is then saved.
If you run the project now, you will notice that it starts with the default view created by code. If you make any changes to the view, close the application, and then re-start it, you will notice that your changes are restored.

Customizing the C1OlapPage · 29
Creating Predefined ViewsIn addition to the ViewDefinition property, which gets or sets the current view as an XML string, the C1OlapPage control also exposes ReadXml and WriteXml methods that allow you to persist views to files and streams. These methods are automatically invoked by the C1OlapPage when you click the "Load" and "Save" buttons in the built-in toolstrip.
These methods allow you to implement predefined views very easily. To do this, start by creating some views and saving each one by pressing the "Save" button. For this sample, we will create five views showing sales by:
1. Product and Country
2. Salesperson and Country
3. Salesperson and Year
4. Salesperson and Month
5. Salesperson and Weekday
Once you have created and saved all the views, create a new XML file called "OlapViews.xml" with a single "OlapViews" node, and then copy and paste all your default views into this document. Next, add an "id" tag to each view and assign each one a unique name. This name will be shown in the user interface (it is not required by C1Olap). Your XML file should look like this:
<OlapViews> <C1OlapPage id="Product vs Country"><!-- view definition omitted... -->
<C1OlapPage id="SalesPerson vs Country"><!-- view definition omitted... -->
<C1OlapPage id="SalesPerson vs Year"><!-- view definition omitted... -->
<C1OlapPage id="SalesPerson vs Month">><!-- view definition omitted... -->
<C1OlapPage id="SalesPerson vs Weekday"><!-- view definition omitted... -->
</OlapViews>
Now add this file to the project as a resource. To do this, follow these steps:
1. Right-click the project node in the solution explorer, and click "Properties".
2. Select the "Resources" tab and click the drop-down arrow next to "Add Resource".
3. Select the "Add Existing File…" option, choose the XML file and click Open.
Now that the view definitions are ready, we need to expose them in a menu so the user can select them. To do this, copy the following code into the project:
private void Form1_Load(object sender, EventArgs e){
// auto-generated:// This line of code loads data into the 'nWINDDataSet.Invoices'
table. this.invoicesTableAdapter.Fill(this.nwindDataSet.Invoices);
// build menu with predefined views: var doc = new System.Xml.XmlDocument();

30 · OLAP for WinForms Quick Start
doc.LoadXml(Properties.Resources.OlapViews); var menuView = new ToolStripDropDownButton("&View"); foreach (System.Xml.XmlNode nd in
doc.SelectNodes("OlapViews/C1OlapPage")) {
var tsi = menuView.DropDownItems.Add(nd.Attributes["id"].Value);
tsi.Tag = nd;}menuView.DropDownItemClicked += menuView_DropDownItemClicked;c1OlapPage1.Updated += c1OlapPage1_Updated;
// add new view menu to C1OlapPage toolstripc1OlapPage1.ToolStrip.Items.Insert(3, menuView);
}
The code creates a new toolstrip drop-down button, then loads the XML document with the report definitions and populates the drop-down button with the reports found. Each item contains the view name in its Textproperty, and the actual XML node in its Tag property. The node will be used later to apply the view when the user selects it.
Once the drop-down is ready, the code adds it to the C1OlapPage using the ToolStrip property. The new button is added at position 3, after the first two buttons and the first separator.
The only part still missing is the code that will apply the views to the C1OlapPage when the user selects them by clicking the button. This is accomplished with the following code:
// select a predefined viewvoid menuView_DropDownItemClicked(object sender, ToolStripItemClickedEventArgs e){
var nd = e.ClickedItem.Tag as System.Xml.XmlNode; if (nd != null){
// load view definition from XML c1OlapPage1.ViewDefinition = nd.OuterXml;
// show current view name in status bar c1OlapPage1.LabelStatus.Text = nd.Attributes["id"].Value;}
}void c1OlapPage1_Updated(object sender, EventArgs e){
// clear report name after user made any changesc1OlapPage1.LabelStatus.Text = string.Empty;
}
The code retrieves the report definition as an XML string by reading the node’s OuterXml property, then assigns it to the C1OlapPage.ViewDefinition property. It also shows the name of the view in the C1OlapPagestatus bar using the LabelStatus property.
Finally, the code handles the Updated event to clear the status bar whenever the user makes any changes to the view. This indicates that the view no longer matches the predefined view that was loaded from the application resources.

Using LINQ as an OLAP Data Source · 31
The C1OlapPage exposes most of the components it contains, which makes customization easy. You can add, remove or change the elements from the ToolStrip, from the TabControl, and show status messages using the LabelStatus property. You can also add other elements to the page in addition to the C1OlapPage.
If you need further customization, you can also choose not to use the C1OlapPage at all, and build your interface using the lower-level C1OlapPanel, C1OlapGrid, and C1OlapChart controls. The source code for the C1OlapPage control is included with the package and can be used as a starting point. The example in the "Building a custom User Interface" section shows how this is done.
Using LINQ as an OLAP Data SourceC1Olap can consume any collection as a data source. It is not restricted to DataTable objects. In particular, it can be used with LINQ.
LINQ provides an easy-to-use, efficient, flexible model for querying data. It makes it easy for developers to create sophisticated queries on client applications without requiring modifications to the databases such as the creation of new stored procedures. These queries can in turn be used as data sources for C1Olap so end users also have the ability to create their own views of the data.
To illustrate this, create a new project and add a C1OlapPage control to the form. Instead of setting the DataSource property in the designer and using a stored procedure like we did before, this time we will load the data using a LINQ query. To do this, add the following code to the form constructor:
public Form1(){ // designerInitializeComponent();
// load all interesting tables into a DataSet var ds = new DataSet(); foreach (string table in "Products,Categories,Employees," + "Customers,Orders,Order Details".Split(',')){ string sql = string.Format("select * from [{0}]", table); var da = new OleDbDataAdapter(sql, GetConnectionString());da.Fill(ds, table);
}
// build LINQ query and use it as a data source// for the C1OlapPage control // …}// get standard nwind mdb connection stringstatic string GetConnectionString(){string path = Environment.GetFolderPath(Environment.SpecialFolder.Personal) + @"\ComponentOne Samples\Common";string conn = @"provider=microsoft.jet.oledb.4.0;" +@"data source={0}\c1nwind.mdb;";
return string.Format(conn, path);}

32 · OLAP for WinForms Quick Start
The code loads several tables from the NorthWind database. It assumes the NorthWind database is available in the "ComponentOne Samples" folder, which is where the C1Olap setup places it. If you have the database in a different location, you will have to adjust the GetConnectionString method as appropriate.
Next, let’s add the actual LINQ query. This is a long but simple statement:
// build LINQ queryvar q =from detail in ds.Tables["Order Details"].AsEnumerable() join product in ds.Tables["Products"].AsEnumerable() on detail.Field<int>("ProductID") equals product.Field<int>("ProductID")
join category in ds.Tables["Categories"].AsEnumerable() on product.Field<int>("CategoryID")
equals category.Field<int>("CategoryID")join order in ds.Tables["Orders"].AsEnumerable() on detail.Field<int>("OrderID") equals order.Field<int>("OrderID")
join customer in ds.Tables["Customers"].AsEnumerable() on order.Field<string>("CustomerID") equals customer.Field<string>("CustomerID")
join employee in ds.Tables["Employees"].AsEnumerable()on order.Field<int>("EmployeeID") equals employee.Field<int>("EmployeeID")
select new{Sales = (detail.Field<short>("Quantity") *(double)detail.Field<decimal>("UnitPrice")) * (1 - (double)detail.Field<float>("Discount")),
OrderDate = order.Field<DateTime>("OrderDate"), Product = product.Field<string>("ProductName"),Customer = customer.Field<string>("CompanyName"),Country = customer.Field<string>("Country"),Employee = employee.Field<string>("FirstName") + " " +employee.Field<string>("LastName"),
Category = category.Field<string>("CategoryName")};
// use LINQ query as DataSource for the C1OlapPage controlc1OlapPage1.DataSource = q.ToList();
The LINQ query is divided into two parts. The first part uses several join statements to connect the tables we loaded from the database. Each table is connected to the query by joining its primary key to a field that is already available on the query. We start with the "Order Details" table, and then join "Products" using the "ProductID" field, and then "Categories" using the "CategoryID" field, and so on.
Once all the tables are joined, a select new statement is used to build a new anonymous class containing the fields we are interested in. Notice that the fields may map directly to fields in the tables, or they may be calculated. The "Sales" field for example is calculated based on quantity, unit price, and discount.
Once the LINQ query is ready, it is converted to a list using LINQ’s ToList method, and the result is assigned to the DataSource property. The ToList method is required because it causes the query to be executed. If you simply assign the query to any control’s DataSource property, you will get a syntax error.
If you run the project now, you will see that it looks and behaves just like before, when we used a stored procedure as a data source. The advantage of using LINQ is that the query is built into the application. You can change it easily without having to ask the database administrator for help.

Large Data Sources · 33
Large Data SourcesAll the examples discussed so far loaded all the data into memory. This is a simple and convenient way to do things, and it works in many cases.
In some cases, however, there may be too much data to load into memory at once. Consider for example a table with a million rows or more. Even if you could load all this data into memory, the process would take a long time.
There are many ways to deal with these scenarios. You could create queries that summarize and cache the data on the server, or use specialized OLAP data providers. In either case, you would end up with tables that can be used with C1Olap.
But there are also simpler options. Suppose the database contains information about thousands of companies, and users only want to see a few at a time. Instead of relying only on the filtering capabilities of C1Olap, which happen on the client, you could delegate some of the work to the server, and load only the companies the user wants to see. This is easy to accomplish and does not require any special software or configurations on the server.
For example, consider the following CachedDataTable class (this class is used in the "SqlFilter" sample installed with C1Olap):
/// <summary>/// Extends the <see cref="DataTable"/> class to load and cache/// data on demand using a <see cref="Fill"/> method that takes /// a set of keys as a parameter./// </summary>class CachedDataTable : DataTable{ public string ConnectionString { get; set; } public string SqlTemplate { get; set; } public string WhereClauseTemplate { get; set; } Dictionary<object, bool> _values =
new Dictionary<object, bool>();
// constructor public CachedDataTable(string sqlTemplate, string whereClauseTemplate, string connString){ConnectionString = connString;SqlTemplate = sqlTemplate;WhereClauseTemplate = whereClauseTemplate;
}
// populate the table by adding any missing values public void Fill(IEnumerable filterValues, bool reset){ // reset table if requested if (reset){_values.Clear();Rows.Clear();
}
// get a list with the new values List<object> newValues = GetNewValues(filterValues); if (newValues.Count > 0)

34 · OLAP for WinForms Quick Start
{ // get sql statement and data adapter var sql = GetSqlStatement(newValues); using (var da = new OleDbDataAdapter(sql, ConnectionString))
{ // add new values to the table int rows = da.Fill(this);}
}}public void Fill(IEnumerable filterValues){Fill(filterValues, false);
}
This class extends the regular DataTable class and provides a Fill method that can either repopulate the table completely or add additional records based on a list of values provided. For example, you could start by filling the table with two customers (out of several thousand) and then add more only when the user requested them.
Note that the code uses an OleDbDataAdapter. This is because the sample uses an MDB file as a data source and an OleDb-style connection string. To use this class with Sql Server data sources, you would replace the OleDbDataAdapter with a SqlDataAdapter.
The code above is missing the implementation of two simple methods given below:
// gets a list with the filter values that are not already in the// current values collection; // and add them all to the current values collection. List<object> GetNewValues(IEnumerable filterValues){ var list = new List<object>(); foreach (object value in filterValues){ if (!_values.ContainsKey(value)){list.Add(value);_values[value] = true;
}} return list;}
// gets a sql statement to add new values to the table string GetSqlStatement(List<object> newValues){ return string.Format(SqlTemplate, GetWhereClause(newValues));} string GetWhereClause(List<object> newValues){ if (newValues.Count == 0 ||
string.IsNullOrEmpty(WhereClauseTemplate)){ return string.Empty;}
// build list of values
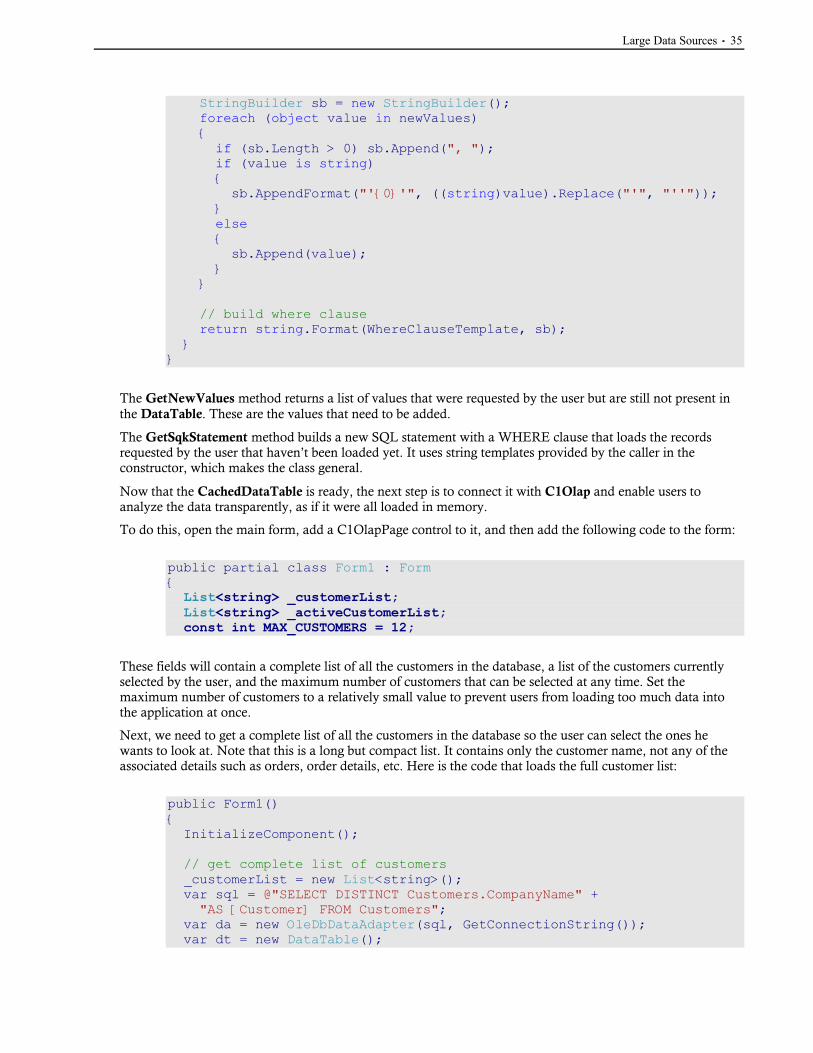
Large Data Sources · 35
StringBuilder sb = new StringBuilder(); foreach (object value in newValues){ if (sb.Length > 0) sb.Append(", "); if (value is string){sb.AppendFormat("'{0}'", ((string)value).Replace("'", "''"));
} else{sb.Append(value);
}}
// build where clause return string.Format(WhereClauseTemplate, sb);}
}
The GetNewValues method returns a list of values that were requested by the user but are still not present in the DataTable. These are the values that need to be added.
The GetSqkStatement method builds a new SQL statement with a WHERE clause that loads the records requested by the user that haven’t been loaded yet. It uses string templates provided by the caller in the constructor, which makes the class general.
Now that the CachedDataTable is ready, the next step is to connect it with C1Olap and enable users to analyze the data transparently, as if it were all loaded in memory.
To do this, open the main form, add a C1OlapPage control to it, and then add the following code to the form:
public partial class Form1 : Form{ List<string> _customerList; List<string> _activeCustomerList;const int MAX_CUSTOMERS = 12;
These fields will contain a complete list of all the customers in the database, a list of the customers currently selected by the user, and the maximum number of customers that can be selected at any time. Set themaximum number of customers to a relatively small value to prevent users from loading too much data into the application at once.
Next, we need to get a complete list of all the customers in the database so the user can select the ones he wants to look at. Note that this is a long but compact list. It contains only the customer name, not any of the associated details such as orders, order details, etc. Here is the code that loads the full customer list:
public Form1(){InitializeComponent();
// get complete list of customers_customerList = new List<string>();var sql = @"SELECT DISTINCT Customers.CompanyName" +"AS [Customer] FROM Customers";
var da = new OleDbDataAdapter(sql, GetConnectionString());var dt = new DataTable();
36 · OLAP for WinForms Quick Start
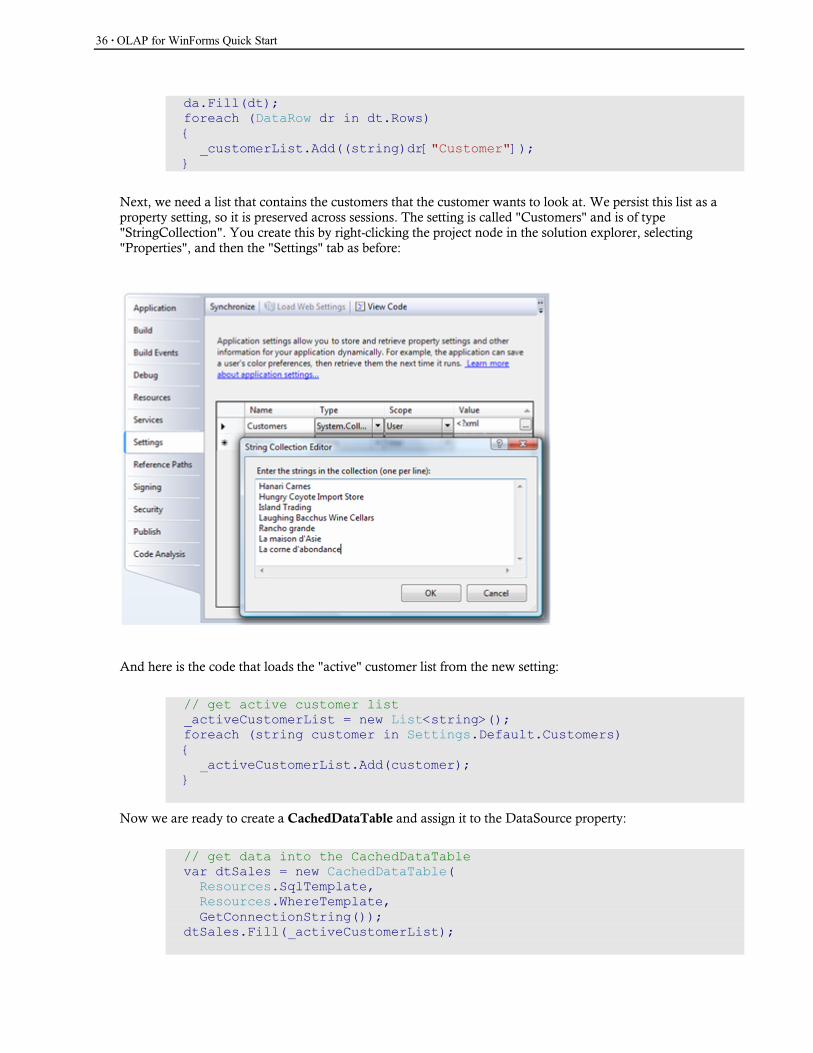
da.Fill(dt);foreach (DataRow dr in dt.Rows){_customerList.Add((string)dr["Customer"]);
}
Next, we need a list that contains the customers that the customer wants to look at. We persist this list as a property setting, so it is preserved across sessions. The setting is called "Customers" and is of type "StringCollection". You create this by right-clicking the project node in the solution explorer, selecting "Properties", and then the "Settings" tab as before:
And here is the code that loads the "active" customer list from the new setting:
// get active customer list_activeCustomerList = new List<string>();foreach (string customer in Settings.Default.Customers){_activeCustomerList.Add(customer);
}
Now we are ready to create a CachedDataTable and assign it to the DataSource property:
// get data into the CachedDataTablevar dtSales = new CachedDataTable( Resources.SqlTemplate, Resources.WhereTemplate, GetConnectionString());
dtSales.Fill(_activeCustomerList);

Large Data Sources · 37
// assign data to C1OlapPage control_c1OlapPage.DataSource = dtSales;
// show default viewvar olap = _c1OlapPage.OlapEngine;olap.BeginUpdate();olap.RowFields.Add("Customer");olap.ColumnFields.Add("Category");olap.ValueFields.Add("Sales");olap.EndUpdate();
The CachedDataTable constructor uses three parameters:
• SqlTemplateThis is a standard SQL SELECT statement where the "WHERE" clause is replaced by a placeholder. The statement is fairly long, and is defined as an application resource. To see the actual content please refer to the "SqlFilter" sample.
• WhereTemplateThis is a standard SQL WHERE statement that contains a template that will be replaced with the list of values to include in the query. It is also defined as an application resource which contains this string: "WHERE Customers.CompanyName in ({0})".
• ConnectionStringThis parameter contains the connection string that is used to connect to the database. Our sample uses the same GetConnectionString method introduced earlier, that returns a reference to the NorthWind database installed with C1Olap.
Now that the data source is ready, we need to connect it to C1Olap to ensure that:
1. The user can see all the customers in the C1Olap filter (not just the ones that are currently loaded) and
2. When the user modifies the filter, new data is loaded to show any new customers requested.
To accomplish item 1, we need to assign the complete list of customers to the C1OlapField.Values property. This property contains a list of the values that are displayed in the filter. By default, C1Olap populates this list with values found in the raw data. In this case, the raw data contains only a partial list, so we need to provide the complete version instead.
To accomplish item 2, we need to listen to the C1OlapField.PropertyChanged event, which fires when the user modifies any field properties including the filter. When this happens, we retrieve the list of customers selected by the user and pass that list to the data source.
This is the code that accomplishes this:
// custom filter: customers in the list, customers currently activevar field = olap.Fields["Customer"];var filter = field.Filter;filter.Values = _customerList;filter.ShowValues = _activeCustomerList.ToArray();filter.PropertyChanged += filter_PropertyChanged;
And here is the event handler that updates the data source when the filter changes:// re-query database when list of selected customers changesvoid filter_PropertyChanged(object sender, PropertyChangedEventArgs e){// get reference to parent filter var filter = sender as C1.Olap.C1OlapFilter;

38 · OLAP for WinForms Quick Start
// get list of values accepted by the filter_activeCustomerList.Clear(); foreach (string customer in _customerList){ if (filter.Apply(customer)){_activeCustomerList.Add(customer);
}}
// skip if no values were selected if (_activeCustomerList.Count == 0){ MessageBox.Show( "No customers selected, change will not be applied.", "No Customers");
return;}
// trim list if necessary if (_activeCustomerList.Count > MAX_CUSTOMERS){ MessageBox.Show( "Too many customers selected, list will be trimmed.", "Too Many Customers");_activeCustomerList.RemoveRange(MAX_CUSTOMERS,_activeCustomerList.Count - MAX_CUSTOMERS);
}
// get new data var dt = _c1OlapPage.DataSource as CachedDataTable;dt.Fill(_activeCustomerList);
}
The code starts by retrieving the field’s Filter and then calling the filter’s Apply method to build a list of customers selected by the user. After some bounds-checking, the list is passed to the CachedDataTable which will retrieve any missing data. After the new data is loaded, the C1OlapPage is notified and automatically refreshes the view.
Before running the application, there is one last item to consider. The field’s Filter property is only taken into account by the C1OlapEngine if the field in “active” in the view. “Active” means the field is a member of the RowFields, ColumnFields, ValueFields, or FilterFields collections. In this case, the “Customers” field has a special filter and should always be active. To ensure this, we must handle the engine’s Updating event and make sure the “Customers” field is always active.
Here is the code that ensures the “Customers” field is always active:
public Form1(){
InitializeComponent();
// ** no changes here **
// make sure Customer field is always in the view // (since it is always used at least as a filter)_c1OlapPage.Updating += _c1OlapPage_Updating;
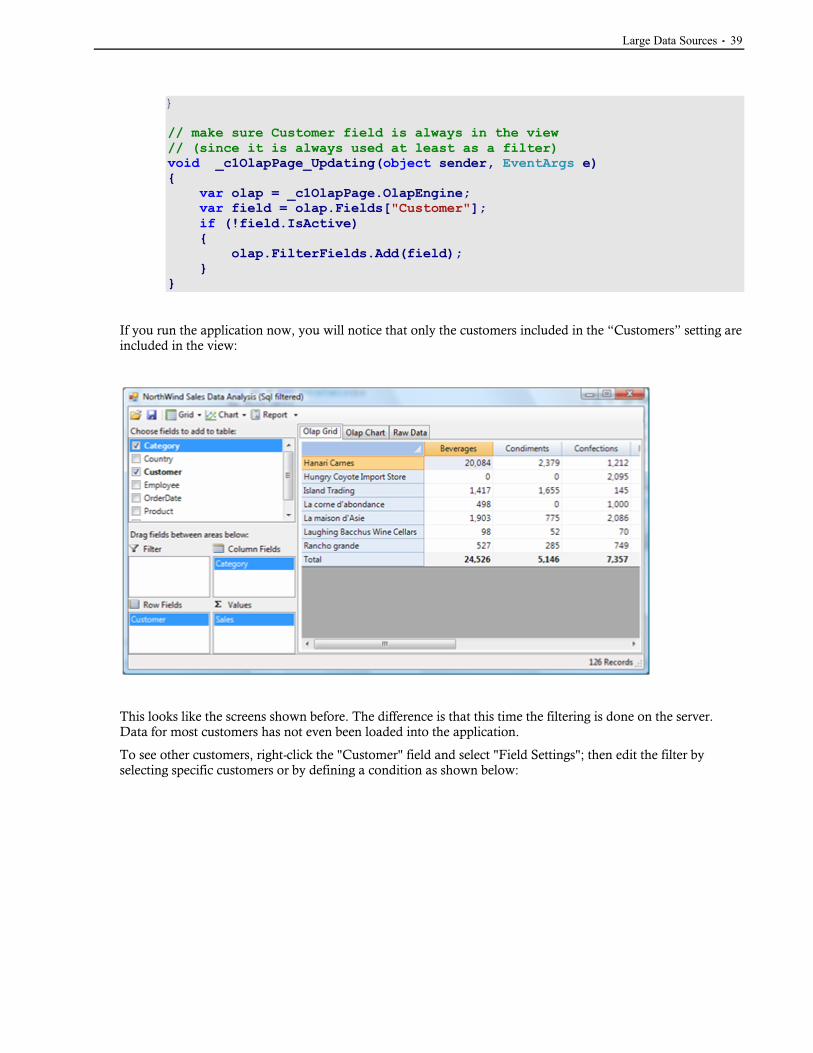
Large Data Sources · 39
}
// make sure Customer field is always in the view// (since it is always used at least as a filter)void _c1OlapPage_Updating(object sender, EventArgs e){
var olap = _c1OlapPage.OlapEngine; var field = olap.Fields["Customer"]; if (!field.IsActive){
olap.FilterFields.Add(field);}
}
If you run the application now, you will notice that only the customers included in the “Customers” setting are included in the view:
This looks like the screens shown before. The difference is that this time the filtering is done on the server. Data for most customers has not even been loaded into the application.
To see other customers, right-click the "Customer" field and select "Field Settings"; then edit the filter by selecting specific customers or by defining a condition as shown below:

40 · OLAP for WinForms Quick Start
When you click OK, the application will detect the change and will request the additional data from the CachingDataTable object. Once the new data has been loaded, C1Olap will detect the change and update the OLAP table automatically:
Building a Custom User InterfaceThe examples in previous sections all used the C1OlapPage control, which contains a complete UI and requires little or no code. In this section, we will walk through the creation of an OLAP application that does not use the C1OlapPage. Instead, it creates a complete custom UI using the C1OlapGrid, C1OlapChart, and some standard .NET controls.
The complete source code for this application is included in the "CustomUI" sample installed with C1Olap.
The image below shows the application in design view:

Building a Custom User Interface · 41
There is a panel docked to the top of the form showing the application title. There is a vertical toolstrip control docked to the right of the form with three groups of buttons. The top group allows users to pick one of three pre-defined views: sales by salesperson, by product, or by country. The next group allows users to apply a filter to the data based on product price (expensive, moderate, or inexpensive). The last button provides reporting.
The remaining area of the form is filled with a split container showing a C1OlapGrid on the left and a C1OlapChart on the right. These are the controls that will display the view currently selected.
The form also contains a C1OlapPrintDocument component that will be used to generate the reports. This component is not visible in the image above because it only appears in the tray area below the form. The C1OlapPrintDocument is connected to the OLAP controls on the page by its OlapGrid and OlapChartproperties, which were set at design time.
Finally, there is a C1OlapPanel control on the form. Its Visible property is set to false, so users won’t ever see it. This invisible control is used as a data source for the grid and the chart, and is responsible for filtering and summarizing the data. Both the grid and the chart have their DataSource property set to the C1OlapPanel.
Once all the controls are in place, let’s add the code that connects them all and makes the application work.
First, let’s get the data and assign it to the C1OlapPanel:
private void Form1_Load(object sender, EventArgs e){
// load data var da = new OleDbDataAdapter("select * from Invoices",
GetConnectionString()); var dt = new DataTable();da.Fill(dt);
// assign it to C1OlapPanel that is driving the app this.c1OlapPanel1.DataSource = dt;
// start with the SalesPerson view, all products

42 · OLAP for WinForms Quick Start
_btnSalesperson.PerformClick();_btnAllPrices.PerformClick();
}
The code gets the data from the NorthWind database using a DataAdapter and assigns the resulting DataTable to the C1OlapPanel.DataSource property. It then uses the PerformClick method to simulate clicks on two buttons to initialize the current view and filter.
The event handlers for the buttons that select the current view look like this:
void _btnSalesperson_Click(object sender, EventArgs e){
CheckButton(sender);BuildView("Salesperson");
}void _btnProduct_Click(object sender, EventArgs e){
CheckButton(sender);BuildView("ProductName");
}void _btnCountry_Click(object sender, EventArgs e){
CheckButton(sender);BuildView("Country");
}
All handlers use a BuildView helper method given below:
// rebuild the view after a button was clickedvoid BuildView(string fieldName){
// get olap engine var olap = c1OlapPanel1.OlapEngine;
// stop updating until doneolap.BeginUpdate();
// format order dates to group by year var f = olap.Fields["OrderDate"];f.Format = "yyyy";
// clear all fieldsolap.RowFields.Clear();olap.ColumnFields.Clear();olap.ValueFields.Clear();
// build up viewolap.ColumnFields.Add("OrderDate");olap.RowFields.Add(fieldName);olap.ValueFields.Add("ExtendedPrice");
// restore updatesolap.EndUpdate();
}

Building a Custom User Interface · 43
The BuildView method gets a reference to the C1OlapEngine object provided by the C1OlapPanel and immediately calls the BeginUpdate method to stop updates until the new view has been completely defined. This is done to improve performance.
The code then sets the format of the "OrderDate" field to "yyyy" so sales are grouped by year and rebuilds view by clearing the engine’s RowFields, ColumnFields, and ValueFields collections, and then adding the fields that should be displayed. The "fieldName" parameter passed by the caller contains the name of the only field that changes between views in this example.
When all this is done, the code calls EndUpdate so the C1OlapPanel will update the output table.
Before running the application, let’s look at the code that implements filtering. The event handlers look like this:
void _btnExpensive_Click(object sender, EventArgs e){
CheckButton(sender);SetPriceFilter("Expensive Products (price > $50)", 50,
double.MaxValue);}void _btnModerate_Click(object sender, EventArgs e){
CheckButton(sender);SetPriceFilter("Moderately Priced Products ($20 < price < $50)",
20, 50);}void _btnInexpensive_Click(object sender, EventArgs e){
CheckButton(sender);SetPriceFilter("Inexpensive Products (price < $20)", 0, 20);
}void _btnAllProducts_Click(object sender, EventArgs e){
CheckButton(sender);SetPriceFilter("All Products", 0, double.MaxValue);
}
All handlers use a SetPriceFilter helper method given below:
// apply a filter to the product pricevoid SetPriceFilter(string footerText, double min, double max){
// get olap engine var olap = c1OlapPanel1.OlapEngine;
// stop updating until doneolap.BeginUpdate();
// make sure unit price field is active in the view var field = olap.Fields["UnitPrice"];
olap.FilterFields.Add(field);
// customize the filter to apply the condition var filter = field.Filter;filter.Clear();filter.Condition1.Operator =

44 · OLAP for WinForms Quick Start
C1.Olap.ConditionOperator.GreaterThanOrEqualTo;filter.Condition1.Parameter = min;filter.Condition2.Operator = C1.Olap.ConditionOperator.LessThanOrEqualTo;
filter.Condition2.Parameter = max;
// restore updatesolap.EndUpdate();
// set report footerc1OlapPrintDocument1.FooterText = footerText;
}
As before, the code gets a reference to the C1OlapEngine and immediately calls BeginUpdate.
It then gets a reference to the "UnitPrice" field that will be used for filtering the data. The "UnitPrice" field is added to the engine’s FilterFields collection so the filter will be applied to the current view.
This is an important detail. If a field is not included in any of the view collections (RowFields, ColumnFields, ValueFields, FilterFields), then it is not included in the view at all, and its Filter property does not affect the view in any way.
The code proceeds to configure the Filter property of the "UnitPrice" field by setting two conditions that specify the range of values that should be included in the view. The range is defined by the "min" and "max" parameters. Instead of using conditions, you could provide a list of values that should be included. Conditions are usually more convenient when dealing with numeric values, and lists are better for string values and enumerations.
Finally, the code calls EndUpdate and sets the FooterText property of the C1OlapPrintDocument so it will be automatically displayed in any reports.
The methods above use another helper called CheckButton that is listed below:
// show which button was pressedvoid CheckButton(object pressedButton){
var btn = pressedButton as ToolStripButton;btn.Checked = true;
var items = btn.Owner.Items; var index = items.IndexOf(btn); for (int i = index + 1; i < items.Count; i++){
if (!(items[i] is ToolStripButton)) break;((ToolStripButton)items[i]).Checked = false;
} for (int i = index - 1; i > 0 && !(items[i] is ToolStripSeparator);
i--){
if (!(items[i] is ToolStripButton)) break;((ToolStripButton)items[i]).Checked = false;
}}
This method makes the buttons in the toolstrip behave like radio buttons. When one of them is pushed, all others in the same group are released.

Building a Custom User Interface · 45
The application is almost ready. You can run it now and test the different views and filtering capabilities of the application, as illustrated below:
This view is showing sales for all products, grouped by year and country. Notice how the chart shows values approaching $300,000.
If you click the "$$$ Expensive" button, the filter is applied and the view changes immediately. Notice how now the chart shows values approaching $80,000 instead. Expensive values are responsible for about one third of the sales:

46 · OLAP for WinForms Quick Start
The last piece missing from the application is reporting. Users can already copy data from the OlapGrid, paste it into Excel, and print or save the results. But we can make it even easier, by allowing them to print or create PDF files directly from within the application.
To do this, let us add some code to handle clicks in the "Report…" button. The code is very simple:
void _btnReport_Click(object sender, EventArgs e){
using (var dlg = new C1.Win.Olap.C1OlapPrintPreviewDialog()){
dlg.Document = c1OlapPrintDocument1;dlg.StartPosition = FormStartPosition.Manual;dlg.Bounds = this.Bounds;dlg.ShowDialog(this);
}}
If you have done any printing in .NET, the code should look familiar. It starts by instantiating a C1OlapPrintPreviewDialog. This is a class similar to the standard PrintPreviewDialog, but with a few enhancements that include export to PDF capability.
The code then sets the dialog box’s Document property, initializes its position, and shows the dialog box. If you run the application now and click the "Report…" button, you should see a dialog box like the one below:
From this dialog box, users can modify the page layout, print or export the document to PDF.
Configuring Fields in CodeOne of the main strengths in Olap applications is interactivity. Users must be able to create and modify views easily and quickly see the results. C1Olap enables this with its Excel-like user interface and user friendly, simple dialogs.
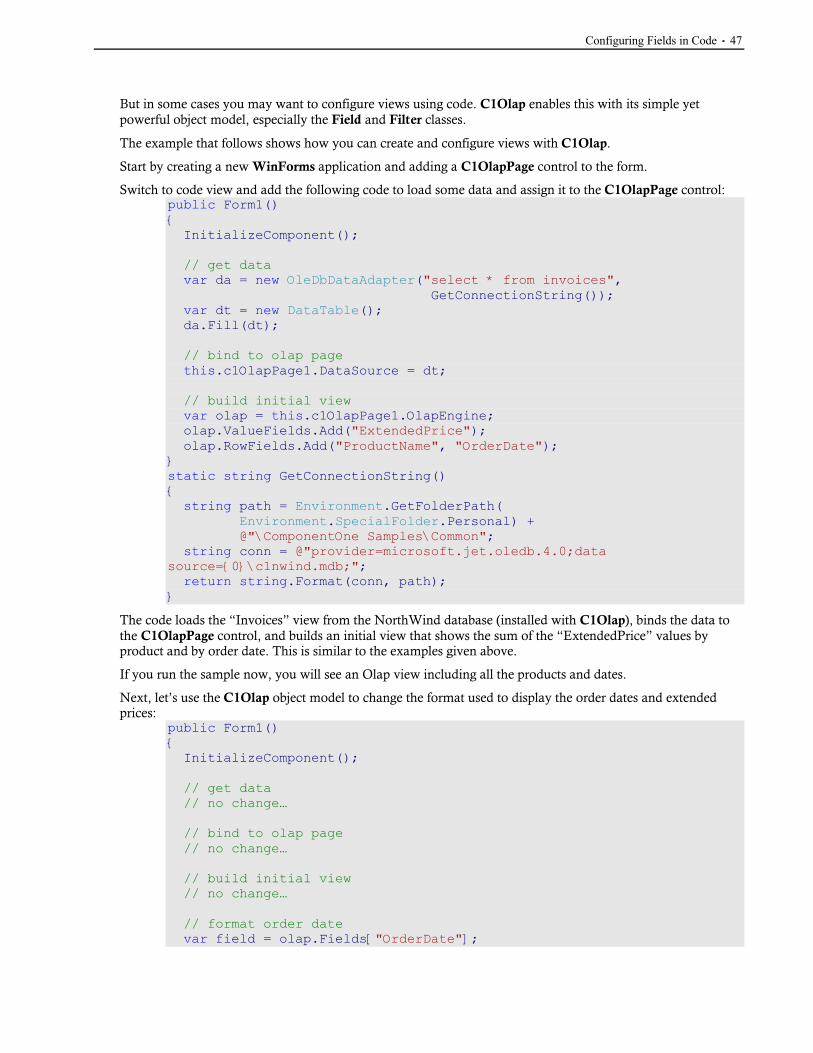
Configuring Fields in Code · 47
But in some cases you may want to configure views using code. C1Olap enables this with its simple yet powerful object model, especially the Field and Filter classes.
The example that follows shows how you can create and configure views with C1Olap.
Start by creating a new WinForms application and adding a C1OlapPage control to the form.
Switch to code view and add the following code to load some data and assign it to the C1OlapPage control:public Form1(){InitializeComponent();
// get data var da = new OleDbDataAdapter("select * from invoices",
GetConnectionString()); var dt = new DataTable();da.Fill(dt);
// bind to olap page this.c1OlapPage1.DataSource = dt;
// build initial view var olap = this.c1OlapPage1.OlapEngine;olap.ValueFields.Add("ExtendedPrice");olap.RowFields.Add("ProductName", "OrderDate");
}static string GetConnectionString(){string path = Environment.GetFolderPath(
Environment.SpecialFolder.Personal) + @"\ComponentOne Samples\Common";
string conn = @"provider=microsoft.jet.oledb.4.0;data source={0}\c1nwind.mdb;"; return string.Format(conn, path);}
The code loads the “Invoices” view from the NorthWind database (installed with C1Olap), binds the data to the C1OlapPage control, and builds an initial view that shows the sum of the “ExtendedPrice” values by product and by order date. This is similar to the examples given above.
If you run the sample now, you will see an Olap view including all the products and dates.
Next, let’s use the C1Olap object model to change the format used to display the order dates and extended prices:
public Form1(){InitializeComponent();
// get data // no change…
// bind to olap page // no change…
// build initial view // no change…
// format order date var field = olap.Fields["OrderDate"];

48 · OLAP for WinForms Quick Start
field.Format = "yyyy";
// format extended price and change the Subtotal type// to show the average extended price (instead of sum)field = olap.Fields["ExtendedPrice"];field.Format = "c";field.Subtotal = C1.Olap.Subtotal.Average;
}The code retrieves the individual fields from the Fields collection which contains all the fields specified in the data source. Then it assigns the desired values to the Format and Subtotal properties. Format takes a regular .NET format string, and Subtotal determines how values are aggregated for display in the Olap view. By default, values are added, but many other aggregate statistics are available including average, maximum, minimum, standard deviation, and variance.
Now suppose you are interested only in a subset of the data, say a few products and one year. A user would right-click the fields and apply filters to them. You can do the exact same thing in code as shown below:
public Form1(){InitializeComponent();
// get data // no changes…
// bind to olap page // no changes…
// build view // no changes…
// format order date and extended price // no changes…
// apply value filter to show only a few productsC1.Olap.C1OlapFilter filter = olap.Fields["ProductName"].Filter;filter.Clear();filter.ShowValues = "Chai,Chang,Geitost,Ikura".Split(',');
// apply condition filter to show only some dates filter = olap.Fields["OrderDate"].Filter;filter.Clear();filter.Condition1.Operator =
C1.Olap.ConditionOperator.GreaterThanOrEqualTo;filter.Condition1.Parameter = new DateTime(1996, 1, 1);filter.Condition2.Operator =
C1.Olap.ConditionOperator.LessThanOrEqualTo;filter.Condition2.Parameter = new DateTime(1996, 12, 31);filter.AndConditions = true;
}The code starts by retrieving the C1OlapFilter object that is associated with the “ProductName” field. Then it clears the filter and sets its ShowValues property. This property takes an array of values that should be shown by the filter. In C1Olap we call this a “value filter”.
Next, the code retrieves the filter associated with the “OrderDate” field. This time, we want to show values for a specific year. But we don’t want to enumerate all days in the target year. Instead, we use a “condition filter” which is defined by two conditions.

Configuring Fields in Code · 49
The first condition specifies that the “OrderDate” should be greater than or equal to January 1st, 1996. The second condition specifies that the “OrderDate” should be less than or equal to December 31st, 1996. The AndConditions property specifies how the first and second conditions should be applied (AND or OR operators). In this case, we want dates where both conditions are true, so AndConditions is set to True.
If you run the project again, you should see the following:


OLAP for WinForms Smart Tags · 51
OLAP for WinForms Design-Time Support
The following sections describe how to use the OLAP for WinForms design-time environment to configure the controls.
OLAP for WinForms Smart TagsA smart tag represents ( ) a short-cut Tasks menu that provides the most commonly used properties in each control. The C1OlapPage, C1OlapChart, and C1OlapGrid controls offer smart tags and Tasks menus at design time so you can quickly access their properties.
C1OlapPanel Smart TagThe C1OlapPanel control includes a smart tag ( ) in Visual Studio. A smart tag represents a short-cut tasks menu that provides the most commonly used properties in C1OlapPanel. The C1OlapPanel smart tag and Tasks menu are only present if the control is bound to a data source.
To access the C1OlapPanel Tasks menu, click the smart tag in the upper-right corner of the C1OlapPanelcontrol.
The C1OlapPanel Tasks menu operates as follows:
• Show Totals Row
Clicking the Show Totals Row check box adds a row at the bottom of your grid which totals all the data in the column.
• Show Totals Column
Clicking the Show Totals Column check box adds a column to the right of the last column in your grid which totals all the data in the row.
• Show Zeros
Clicking the Show Zeros check box shows any cells containing zero in the grid.

52 · OLAP for WinForms Design-Time Support
• Choose Data Source
Clicking the drop-down arrow in the Choose Data Source box opens a list of available data sources and allows you to add a new data source. To add a new data source to the project, click Add Project Data Source to open the Data Source Configuration Wizard.
• About C1OlapPanel
Clicking About C1OlapPanel displays the About ComponentOne OLAP for WinForms dialog box, which is helpful in finding the version number of the product and other resources.
C1OlapPage Smart TagThe C1OlapPage control includes a smart tag ( ) in Visual Studio. A smart tag represents a short-cut tasks menu that provides the most commonly used properties in C1OlapPage.
To access the C1OlapPage Tasks menu, click the smart tag in the upper-right corner of the C1OlapPagecontrol.
The C1OlapPage Tasks menu operates as follows:
• Show Totals Row
Clicking the Show Totals Row check box adds a row at the bottom of your grid which totals all the data in the column.

OLAP for WinForms Smart Tags · 53
• Show Totals Column
Clicking the Show Totals Column check box adds a column to the right of the last column in your grid which totals all the data in the row.
• Show Zeros
Clicking the Show Zeros check box shows any cells containing zero in the grid.
• Show Detail on Right Click
Clicking the Show Detail on Right Click check box allows a detail view to be shown when the user right-clicks a cell in the grid.
• Show Selection Status
Clicking the Show Selection Status checkbox causes the control to display the sum of the values selected on the grid in the status bar along the bottom of the control. This corresponds to setting the ShowSelectionStatus property to True.
• Chart Type
Clicking the drop-down arrow next to ChartType allows you to select from thirteen popular chart types, including: Bar, Column, Area, Line, and Scatter.
• Palette
Clicking the drop-down arrow next to Palette allows you to select from twenty-two palette options that define the colors of the chart and legend items, as well as create a custom palette or copy the current palette to a custom palette.
• Show Legend
Clicking the drop-down arrow next to Show Legend allows you to choose whether to always, never, or automatically show the legend.
• Show Title
Clicking the Show Title check box places a title above the chart.
• Show Gridlines
Clicking the Show Gridlines check box places gridlines in the chart.
• Stacked
Clicking the Stacked check box creates a chart view where the data is stacked.
• Show Raw Data
Clicking the Show Raw Data check box adds a raw data table, which contains the raw data from your data source, to the views.
• Choose Data Source
Clicking the drop-down arrow in the Choose Data Source box opens a list of available data sources and allows you to add a new data source. To add a new data source to the project, click Add Project Data Source to open the Data Source Configuration Wizard.
• About C1OlapPage
Clicking About C1OlapPage displays the About ComponentOne OLAP for WinForms dialog box, which is helpful in finding the version number of the product and other resources.

54 · OLAP for WinForms Design-Time Support
• Undock in parent container
Clicking Undock in parent container sets the Dock property to None so that none of the borders of the control are bound to the container. The menu option then changes to Dock in parent container; if you click this, it will set the Dock property to Fill so the control becomes bound to the container.
C1OlapChart Smart TagThe C1OlapChart control includes a smart tag ( ) in Visual Studio. A smart tag represents a short-cut tasks menu that provides the most commonly used properties in C1OlapChart.
To access the C1OlapChart Tasks menu, click the smart tag in the upper-right corner of the C1OlapChartcontrol.
The C1OlapChart Tasks menu operates as follows:
• ChartType
Clicking the drop-down arrow next to ChartType allows you to select from thirteen popular chart types, including: XYPlot, Pie, Bar, Area, Polar, Radar, Bubble, HiLo, HiLoOpenClose, Candle, Gantt, Step, and Histogram.
• Wizard
Clicking the Wizard item opens the Chart Wizard editor where you can specify chart elements, such as header and footer text or a C1OlapPanel data source to bind to.
• Properties
Clicking Properties opens the Chart Properties dialog box where you can choose the type of chart to show or preview the chart.
• Enable Smart Designer
Selecting the Enable Smart Designer check box enables the Smart Designer of the C1OlapChart control. The default value is True (checked).
• Visual Effects
Clicking Visual Effects opens the Visual Effects designer where you can choose from preset visual effects, adjust coloring, or change effect angles, shadows, and more.
• About ComponentOne C1Chart
Clicking About ComponentOne C1Chart displays the About ComponentOne C1Chart dialog box, which is helpful in finding the version of C1Chart and online resources.

OLAP for WinForms Smart Tags · 55
• Dock in parent container
Clicking Dock in parent container sets the Dock property to Fill so the control becomes bound to the container . The menu option then changes to Undock in parent container; if you click this, it will set the Dock property to None so none of the borders of the control are bound to the container.
For more information on any of the C1OlapChart Tasks menu items, see the ComponentOne 2D Chart for WinForms documentation.
C1OlapGrid Smart TagThere are two Tasks menus available through the smart tag in C1OlapGrid: C1OlapGrid Tasks Menu and Column Tasks Menu.
C1OlapGrid Tasks MenuThe C1OlapGrid control includes a smart tag ( ) in Visual Studio. A smart tag represents a short-cut tasks menu that provides the most commonly used properties in C1OlapGrid.
To access the C1OlapGrid Tasks menu, click the smart tag in the upper-right corner of the C1OlapGridcontrol.
The C1OlapGrid Tasks menu operates as follows:
• Choose Data Source
Please select a C1OlapPanel in the Visual Studio Properties window next to the DataSource property.
• Enable Adding Rows
Selecting the Enable Adding Rows check box sets the AllowAddNew property to True, and allows adding new rows to the grid. The default is unchecked.
• Enable Deleting Rows
Selecting the Enable Deleting Rows check box sets the AllowDelete property to True, and allows deleting rows in the grid. The default is unchecked.

56 · OLAP for WinForms Design-Time Support
• Enable Editing
Selecting the Enable Editing check box sets the AllowEditing property to True, and allows editing in the grid. The default is checked.
• Enable Column Reordering
Selecting the Enable Column Reordering check box sets the AllowDragging property to Columns, and allows dragging of columns in the grid. The default is checked.
• Visual Style
Clicking the drop-down arrow next to Visual Style allows you to select from five predefined visual styles for C1OlapGrid, including: Custom, System, Office2007Blue, Office2007Silver, and Office2007Black.
• Designer
Clicking Designer opens the C1FlexGrid Column Editor where you can reorder columns, adjust column widths, set column properties, and more.
• Styles
Clicking Styles opens the C1FlexGrid Style Editor where you can modify existing styles and add new custom ones.
• Display Hidden Columns
Selecting the Display Hidden Columns check box sets the Visible property to True for hidden columns and displays them. The default is unchecked.
• Column Tasks
Clicking Column Tasks opens the Column Tasks menu. For details on the Column Tasks menu, see Column Tasks Menu (page 56).
• About C1FlexGrid
Clicking About C1FlexGrid displays the About ComponentOne Olap for WinForms dialog box, which is helpful in finding the version number of the product.
• Dock in parent container
Clicking Dock in parent container sets the Dock property for C1OlapGrid to Fill.
If C1OlapGrid is docked in the parent container, the option to undock C1OlapGrid from the parent container will be available. Clicking Undock in parent container sets the Dock property for C1OlapGridto None.
For more information on any of the C1OlapGrid Tasks menu items, see the ComponentOne FlexGrid forWinForms documentation.
Column Tasks MenuThe C1OlapGrid control includes a smart tag ( ) in Visual Studio. A smart tag represents a short-cut tasks menu that provides the most commonly used properties in C1OlapGrid.
To access the C1OlapGrid Column Tasks menu, click the smart tag in the upper-right corner of the C1OlapGrid control and select Column Tasks, or you can click a column in the C1OlapGrid.

OLAP for WinForms Smart Tags · 57
The C1OlapGrid Column Tasks menu allows you to set the column caption, data field, data type, edit mask, format string, and combo list for a column, as well as set the following properties: AllowSorting, AllowEditing, AllowResizing, AllowDragging, AllowMerging, and Visible.
The C1OlapGrid Column Tasks menu operates as follows:
• Column Caption
Entering a caption into the Column Caption box set the Caption property for the column.
• Data Field
Clicking the drop-down arrow in the Data Field box opens a list of available fields in the data source.
• Data Type
Clicking the drop-down arrow in the Data Type box opens a list of available data types.
• Edit Mask
Clicking the ellipsis button in the Edit Mask box opens the Input Mask dialog box.
• Format String
Clicking the ellipsis button in the Format String box opens the Format String dialog box.
• Combo List
Clicking the ellipsis button in the Combo List box opens the Combo List dialog box.

58 · OLAP for WinForms Design-Time Support
• Allow Sorting
Selecting the Allow Sorting check box sets the AllowSorting property to True, and allows sorting in the column. The default is checked.
• Allow Editing
Selecting the Allow Editing check box sets the AllowEditing property to True, and allows editing in the column. The default is checked.
• Allow Resizing
Selecting the Allow Resizing check box sets the AllowResizing property to True, and allows resizing the column. The default is checked.
• Allow Dragging
Selecting the Allow Dragging check box sets the AllowDragging property to True, and allows dragging columns in the grid. The default is checked.
• Allow Merging
Selecting the Allow Merging check box sets the AllowMerging property to True, and allows merging in the column. The default is unchecked.
• Visible
Selecting the Visible check box sets the Visible property to True, and allows the column to be visible in the grid. The default is checked.
• Caption Style
Clicking Caption Style opens the Caption Style editor for the selected column, which allows you to specify the properties for the caption text, including alignment, background, and borders.
• Column Style
Clicking Column Style opens the Column Style editor for the selected column, which allows you to specify properties for the column, including text, alignment, background, and borders.
• C1FlexGrid Tasks
Clicking C1FlexGrid Tasks returns you to the C1OlapGrid Tasks menu. For details on the C1OlapGrid Tasks menu, see C1OlapGrid Tasks Menu (page 55).
• Dock in parent container/Undock in parent container
Clicking Dock in parent container sets the Dock property for C1FlexGrid to Fill.
If C1OlapGrid is docked in the parent container, the option to undock C1OlapGrid from the parent container will be available. Clicking Undock in parent container sets the Dock property for C1OlapGridto None.
For more information on any of the C1OlapGrid Column Tasks menu items, see the ComponentOne FlexGrid for WinForms documentation.
Using the C1OlapPage ToolStripThe C1OlapPage control provides a ToolStrip you can use to: load or save a C1OlapPage as an .xml file, display your data in a grid or chart, or setup and print a report. The following table describes the buttons in the ToolStrip.

Using the C1OlapPage ToolStrip · 59
Button Description
Load Allows you to load a previously saved C1Olap view definition file (*.olapx) into the C1OlapPage.
Save Allows you to save a C1Olap view definition file (*.olapx).
Grid Allows you to choose the columns and rows to display in the C1OlapGrid.
Chart Allows you customize the chart used to display your data. You can determine: the chart type, the palette or theme, whether the title will appear, whether the chart is stacked, and whether gridlines appear.
Report Allows you to: specify a header or footer for each page of the report; determine what to include in the report, the Olap grid, chart, or raw data grid; specify the page layout, including orientation, paper size, and margins; preview the report before printing; and print the report.
Using the Grid MenuThe Grid menu provides three options:
Show Totals Column
Shows a column to the right of the last column in your grid which totals all the data in the row.
Show Totals Row Shows a row at the bottom of your grid which totals all the data in the column.
Show Zeros If checked, shows any cells containing zero in the grid.
Simply uncheck any of these items to hide the totals column, totals row, or any zeros in the grid.
Using the Chart MenuFrom the Chart menu, you can determine: the chart type, the palette, whether to show the chart title above the chart, whether to show a stacked chart, and whether to show chart gridlines.

60 · OLAP for WinForms Design-Time Support
Chart Type Click Chart Type to select from five common chart types shown below.
Palette Click Palette to select from twenty-two palette options that define the colors of the chart and legend items. See the options in the Palette topic below.
Show Title When selected, shows a title above the chart.
Stacked When selected, creates a chart view where the data is stacked.
Show Gridlines When selected, shows gridlines in the chart.
Chart Types
ComponentOne OLAP for WinForms offers five of the most common chart types. The following table shows an example of each type.
Bar
Column

Using the C1OlapPage ToolStrip · 61
Area
Line
Scatter

62 · OLAP for WinForms Design-Time Support
Palette
The C1OlapChart palette is made up of twenty-two options that define the colors of the chart and legend items. The following table shows the colors for each palette option.
Standard Office GrayScale
Apex Aspect Civic

Using the C1OlapPage ToolStrip · 63
Concourse Equity Flow
Foundry Median Metro

64 · OLAP for WinForms Design-Time Support
Module Opulent Oriel
Origin Paper Solstice

Using the C1OlapPage ToolStrip · 65
Technic Trek Urban
Verve
Using the Report MenuFrom the Report menu, you can preview or print the report, set up the pages of the report, add header and/or footers, and specify which items to show in the report.

66 · OLAP for WinForms Design-Time Support
Print Preview Select Print Preview to preview your report before printing or to export to a PDF file.
Print Click Print to print the C1OlapGrid, C1OlapChart, or both.
Options Click Options to open the Document Options dialog box for
Document Options
The Page Tab
On the Page tab you can specify the Orientation, Paper Size, and Margins.
The Header/Footer Tab
On the Header/Footer tab, you can add a header and/or footer to each page of the report.

Using the C1OlapPage ToolStrip · 67
Click one of the buttons on the toolbar to insert fields into the header or footer.
Button Field
Presets Choose from three predefined options containing groups of fields to be inserted in the header or footer.
Page Number &[Page]
Current Date &[Date]
Current Time &[Time]
Document Name $[DocName]
View Description &[ViewTitle]
Author Name &[UserName]
Check the Separator box to show a separator line below the header or above the footer. Click the Font button to change the font, style, size, or effects.

68 · OLAP for WinForms Design-Time Support
The Report Content Tab
On the Report Content tab, you can determine whether to include the OLAP Grid, Olap Chart, and/or the Raw Data Grid in your report. You can also scale the items as desired and extend the last column of the grids.

OLAP for WinForms Samples · 69
OLAP for WinForms SamplesPlease be advised that this ComponentOne software tool is accompanied by various sample projects and/or demos which may make use of other development tools included with the ComponentOne Studios.
Note: The ComponentOne Samples are also available at http://helpcentral.componentone.com/Samples.aspx.
C# Samples
Sample Description
CustomizePage Shows how you can customize the C1OlapPage control. The sample creates a default view that is persisted across sections, and it also adds a new menu to the C1OlapPage that contains a list of predefined views.
CustomUI This sample shows how you can build an OLAP application with a custom UI. It builds a custom OLAP application with a toolstrip containing predefined views and filters. The OLAP functionality is provided by a C1OlapPanel control that is invisible. This shows how you can build OLAP applications that do not rely on the traditional Excel-like drag and drop pivot table paradigm.
LinqOlap This project uses a LINQ query to build a DataTable containing the NorthWind sales data, and then uses this table as a data source for a C1OlapPage control.
NoCode This is the simplest possible C1Olap application. This application provides an OLAP solution using a single C1OlapPage control with a data source set at design time.
The application has no code.
QuickStart This project uses a SQL query to build a DataTable containing the NorthWind sales data, and then uses this table as a data source for a C1OlapPage control.
SqlFilter This project uses a SQL query to build a DataTable containing the NorthWind sales data, and then uses this table as a data source for a C1OlapPage control. The interesting part of this project is that not all data is loaded into memory at a time. The program updates the SQL query with a WHERE clause to include only the customers selected by the user in the value filter of the Customer field.


OLAP for WinForms Task-Based Help · 71
OLAP for WinForms Task-Based HelpThe task-based help assumes that you are familiar with programming in Visual Studio .NET and know how to use bound and unbound controls in general. Each topic provides a solution for specific tasks using the ComponentOne OLAP for WinForms product. By following the steps outlined in the help, you will be able to create projects demonstrating a variety of OLAP for WinForms features.
Each task-based help topic also assumes that you have created a new .NET project. For additional information on this topic, see Creating a .NET Project (page 9).
Binding C1OlapPage or C1OlapPanel to a Data SourceYou can easily bind C1OlapPage or C1OlapPanel to a data source using the C1OlapPage or C1OlapPanel Tasks menu, or you can use the C1OlapPage.DataSource or C1OlapPanel.DataSource property in the Visual Studio Properties window.
Using the Tasks Menu
To bind the controls using the Tasks menu, follow these steps:
1. Select the C1OlapPage or C1OlapPanel control on the form.
2. Click the C1OlapPage or C1OlapPanel smart tag to open the C1OlapPage Tasks or C1OlapPanel Tasksmenu.
3. Click the drop-down arrow next to Choose Data Source and click Add Project Data Source. The DataSource Configuration Wizard dialog box opens.
4. Select Database and click Next.
5. Click New Connection, browse to find your database, and click OK.
6. In the Choose Your Data Connection window, click Next.
7. Leave the Yes, save the connection as check box checked and click Next.
8. Select the tables and views to include in your dataset and click Finish.
Using the Properties Window
To bind the controls through the Visual Studio Properties window, follow these steps:
1. In the Visual Studio View menu, select Properties Window.
2. In the Properties window, click the drop-down arrow next to the DataSource property and click Add Project Data Source. The Data Source Configuration Wizard dialog box opens.
3. Select Database and click Next.
4. Click New Connection, browse to find your database, and click OK.
5. In the Choose Your Data Connection window, click Next.
6. Leave the Yes, save the connection as check box checked and click Next.
7. Select the tables and views to include in your dataset and click Finish.
8. In the DataSource property drop-down list in the Properties window, select the table to bind to.
Binding C1OlapChart to a C1OlapPanelYou can populate a C1OlapChart control by binding it to a C1OlapPanel that is bound to a data source. Note that this topic assumes you have a bound C1OlapPanel control on your form.

72 · OLAP for WinForms Task-Based Help
Set the DataSource property on the C1OlapChart to the C1OlapPanel that provides the Olap data.
Binding C1OlapGrid to a C1OlapPanelYou can populate a C1OlapGrid control by binding it to a C1OlapPanel that is bound to a data source. Note that this topic assumes you have a bound C1OlapPanel control on your form.
Set the DataSource property on the C1OlapGrid to the C1OlapPanel that provides the OLAP data.
Run-Time TasksThe following topics describe how end users of your applications can interact with ComponentOne OLAP for WinForms at run time.
Removing a Field from a Data ViewIn the C1OlapPanel control or the C1OlapPanel area of the C1OlapPage control, you can filter out an entire field so that it doesn't appear in your C1OlapGrid or C1OlapChart data view.
1. In the Drag fields between areas below section of the panel, select the field to filter out of the view.
2. Drag it to the Filter area of the panel. The data in this field will be removed from the C1OlapGrid or C1OlapChart data view.
Filtering Data in a FieldIn the C1OlapPanel control or the C1OlapPanel area of the C1OlapPage control, you can filter the data in a field from the Drag fields between areas below section of the panel. Each field has two filters: the value filter, which allows you to check specific values in a list, and the range filter, which allows you to specify one or two criteria. The two filters are independent, and values must pass both filters in order to be included in the OLAPtable.
Using the Value Filter
1. Right-click a field in the Filter, Column Fields, Row Fields, or Values area.
2. Click Field Settings in the context menu. The Field Settings dialog box opens.
3. Click the Filter tab. This is the value filter. You can clear the selection for any of the fields that you do not want to appear in the OLAP table.

OLAP for WinForms Task-Based Help · 73
Once you have selected the fields to appear in the table, you can specify a range filter by clicking the Text Filter or Numeric Filter button at the bottom of the window.
Note: If the field you are filtering contains numeric data, Numeric Filter appears instead of Text Filter.
Using the Range Filter
1. Right-click a field in the Filter, Column Fields, Row Fields, or Values area.
2. Click Field Settings in the context menu. The Field Settings dialog box opens.
3. Click the Filter tab and specify the value filter, if desired. You can clear the selection for any of the fields that you do not want to appear in the OLAP table.
4. Click the Text Filter or Numeric Filter button to set the range filter.
5. Select one of the following items.
Clear Filter Clears all filter settings.
Equals Opens the Custom Filter dialog box so you can create a filter where items equal to the specified value are shown.
Does Not Equal Opens the Custom Filter dialog box so you can create a filter where items that are not the same as the specified value are shown.
Begins With Opens the Custom Filter dialog box so you can create a filter where items that begin with the specified value are shown.
Ends With Opens the Custom Filter dialog box so you can create a filter where items that end with the specified value are shown.
Contains Opens the Custom Filter dialog box so you can create a filter where items that contain the specified value are shown.

74 · OLAP for WinForms Task-Based Help
Does Not Contain
Opens the Custom Filter dialog box so you can create a filter where items that do not contain the specified value are shown.
Custom Filter Opens the Custom Filter dialog box so you can create a filter with your own conditions.
6. Add an item to filter on in the first blank text box.
7. Select And or Or.
8. Add a second filter condition, if necessary. If you select an option other than None, the second text box becomes active and you can enter an item.
9. Click OK to close the Custom Filter dialog box and click OK again to close the Field Settings dialog box.
Specifying a Subtotal FunctionWhen creating custom views of data, you may want to perform a different aggregate function other than "Sum" on your column or row. For example, you may want to find the average or maximum values in your data. This can easily be done through the Field Settings dialog box.
To specify the function performed on data, follow these steps:
1. Right-click a field in the Values area of the C1OlapPanel.
2. Click Field Settings in the context menu. The Field Settings dialog box opens.
3. Click the Subtotals tab.
4. Select one of the following options:
Sum Gets the sum of a group.
Count Gets the number of values in a group.
Average Gets the average of a group.
Maximum Gets the maximum value in a group.
Minimum Gets the minimum value in a group.
First Gets the first value in a group.
Last Gets the last value in a group.

OLAP for WinForms Task-Based Help · 75
Variance Gets the sample variance of a group.
Standard Deviation Gets the sample standard deviation of a group.
Variance Population Gets the population variance of a group.
Standard Deviation Population
Gets the population standard deviation of a group.
5. Click OK to close the Field Settings dialog box. Notice how the values in the summary table change.
Formatting Numeric DataYou can format numeric data as currency, as a percentage, and so on or create your own custom format.
To format numeric data, follow these steps:
1. Right-click a field in the Values area of the C1OlapPanel.
2. Click Field Settings in the context menu. The Field Settings dialog box opens.
3. Click the Format tab.
4. Select one of the following options:
Numeric Formats the data as a number like this: 1,235. You can specify the number of decimal places and whether to use a 1000 separator (,).
Currency Formats the data as currency. You can specify the number of decimal places.
Percentage Formats the data as a percentage. You can specify the number of decimal places.
Scientific Formats the data in scientific notation. You can specify the number of decimal places.
Custom Enter your own custom format for the data.
5. Click OK to close the Field Settings dialog box. Notice how the values in the summary table change.
Creating a ReportIn the C1OlapPage control, you can set up and print a report using the Report menu.
To create the report, follow these steps:
1. Click the drop-down arrow next to Report on the C1OlapPage ToolStrip.
2. Select Options. The Document Options dialog box appears.
3. On the Page tab, select a page Orientation, Paper size, and set the Margins as desired.
4. Click the Header/Footer tab.
5. Place the cursor in the header or footer text box where you want to add text or a predefined header/footer item.
6. Click one of the buttons on the toolbar to insert the desired field.
7. Click the Report Content tab.
8. Check the check box next to the items you want included in the report. You can also select a radio button to change the scaling of the grid or chart.
9. Click OK to close the Document Options dialog box.

76 · OLAP for WinForms Task-Based Help
Printing a ReportTo print the report using the C1OlapPage control, follow these steps:
1. Click the drop-down arrow next to Report on the C1OlapPage ToolStrip.
2. Select Print. The Print dialog box appears.
3. Choose a printer from the Name drop-down list and click OK.


