
C12H
129
Natural Sciences Tripos Part II MATERIALS SCIENCE II MATERIALS SCIENCE C12: Plasticity and Deformation Processing Dr K. M. Knowles Michaelmas Term 2014 15 Name............................. College.......................... Michaelmas Term 2014-15
-
Upload
khudhayer1970 -
Category
Documents
-
view
18 -
download
2
description
plasticity
Transcript of C12H
Natural Sciences Tripos Part II
MATERIALS SCIENCE
II
MATERIALS SCIENCE
C12: Plasticity and Deformation Processing
Dr K. M. Knowles
Michaelmas Term 2014 15
Name............................. College..........................
Michaelmas Term 2014-15

C12 PART II MATERIALS SCIENCE C12
Course C12: Plasticity and Deformation Processing
KMK/MT14
9 Lectures + 1 Examples Class KMK
Plasticity and plastic flow in crystals (2 lectures)
Plastic flow and its microscopic and macroscopic descriptions. Yield in crystals: derivation of the
stress tensor for glide on a general plane in a general direction. Definition of an independent slip
system. Need for five independent slip systems to accommodate general strain. Examples in metals
and ceramics.
Continuum plasticity (2 lectures)
Stress-strain curves of real materials. Definition of yield criterion. Concept of a yield surface in
principal stress space. Yield criteria: Tresca, von Mises, Coulomb, pressure-modified von Mises.
Physical interpretation of Tresca (maximum shear stress) and von Mises (strain energy density,
octahedral shear stress) yield criteria. Experimental test of yield criteria (Taylor and Quinney).
Yield criteria applicable to metals, polymers and geological materials.
Plastic strain analyses (2 lectures)
Lévy-Mises equations. Example: pressurised thin-walled cylinder. Deformation in plane stress:
yielding of thin sheet in biaxial and uniaxial tension. Plane stress deformation: Lüders bands.
Plane strain deformation: derivation of stress tensor and separation into hydrostatic and deviatoric
components. Equivalence of Tresca and von Mises yield criteria in plane strain.
Slip line field theory (1 lecture)
Physical interpretation of slip lines. Slip line fields for compression of slab, comparison with shear
pattern in transparent polymers. Hencky relations. Examples: indentation by flat punch, yield in
deeply notched bar.
Estimation of forces for plastic deformation (2 lectures)
Stress evaluation and work formulae. Application to rolling and wire-drawing. Upper and lower-
bound theorems. Limit analyses for indentation, extrusion, machining and forging. Velocity-vector
diagrams: hodographs. Classical theory of the strength of soldered and glued joints. Analysis of
forging with friction. Rolling loads and torques: analogy with forging. Use of finite-element
methods in analyses of metalforming operations.
C12 – 2 – C12
Book List
P.P. Benham, R.J. Crawford and C.G. Armstrong, Mechanics of Engineering Materials,
2nd edn, Prentice-Hall, 1996 AB181
C.R. Calladine, Plasticity for Engineers, Ellis Horwood, 1985 Kc38
G.E. Dieter, Mechanical Metallurgy, McGraw-Hill, 1988 Ka62
W.F. Hosford and R.M. Caddell, Metal Forming, 4th. edn., Cambridge Univ. Press, 2011* Ga180
W. Johnson and P.B. Mellor, Engineering Plasticity, Van Nostrand Reinhold, 1983 Kc29
A. Kelly and K.M. Knowles, Crystallography and Crystal Defects, Wiley, 2012 NbA99
Other books in the Departmental library that you might find useful are:
W.A. Backofen, Deformation Processing, Addison-Wesley, 1972 Ga96
R. Hill, The Mathematical Theory of Plasticity, Clarendon Press, 1950 Kc3
G.W. Rowe, Principles of Industrial Metalworking Processes, Edward Arnold, 1977 Ga106
G.W. Rowe, Elements of Metalworking Theory, Edward Arnold, 1979 Ga124
G.W. Rowe, C.E.N. Sturgess, P. Hartley and I. Pillinger, Finite-element Plasticity and
Metalforming Analysis, CUP, 1991 Kc42
In addition there are three teaching and learning packages relevant to this course in the Plasticity
and Deformation Processing part of the Teaching and Learning Packages Library at
http://www.doitpoms.ac.uk:
http://www.msm.cam.ac.uk/doitpoms/tlplib/metal-forming-1/index.php
http://www.msm.cam.ac.uk/doitpoms/tlplib/metal-forming-2/index.php
http://www.msm.cam.ac.uk/doitpoms/tlplib/metal-forming-3/index.php
covering the topics of
Stress Analysis and Mohr’s Circle
Introduction to Deformation Processes
Analysis of Deformation Processes
respectively. These are based on the C12 lecture course and should help to reinforce ideas that you
will meet in this course about stress, strain, yield, yield criteria, metal forming processes and energy
estimates for deformation processes.
* Some of you might find that the second edition (Ga171) is actually better!

C12 – 3 – C12
C12: Plasticity and Deformation Processing
This is a nine lecture course with one Examples Class.
The course follows on very closely from C4 (Tensor Properties), in which stress and strain tensors
were considered in some depth and applied to elastic deformation. For example, we will be using
the Mohr’s circle construction in this course. We shall also use some concepts first introduced in
Part IB in the mechanical properties course.
The content of the course can be described as a description and analysis of the plastic flow of
materials, together with an analysis of plastic deformation in the context of materials deformation.
The subject content of the course is not specific to particular materials – it is generic.
Of the various books recommended in the reading list, the book by Dieter is a useful general book
and the book by Kelly and Knowles is very useful for the material in the first two lectures. The
books by Calladine, Hosford and Caddell, and Johnson and Mellor are source texts for the
deformation processing part of the course.
Plasticity and Plastic Flow
In C4 elastic stresses and elastic strains, i.e., recoverable and , were considered. Viscoelastic
materials such as polymers can have time-dependent and , while still remaining in the elastic
region of deformation.
Thus, for a Hookean solid, we have
klijklij C in general
E for an isotropic solid in uniaxial tension
If we increase the strain , beyond the elastic limit, we find that it is not wholly recoverable. For
metals we get a stress-strain curve like:
The shaded area is the work done per unit volume, i.e, the energy dissipated per unit volume.
We can have large strains involved, e.g., tens of % in a metal and we have irrecoverable
deformation. Hence the process is irreversible. This defines plastic flow.

C12 – 4 – C12
Most of the work (> 95%) is dissipated as heat – your everyday experience will remind you that
metals heat up if they are plastically deformed.
There are two main approaches to analyse plastic deformation in materials – the microscopic
approach and the macroscopic approach, both of which you have already met before at Part IA and
Part IB.
Microscopic approach
You first met this in Part IA in connection with dislocation glide in metal single crystals and
polycrystals.
Initially, this approach considers the mechanism of plastic flow in an individual crystal, e.g., in a
metal, this relates to the slipping of the material on glide planes by the passage of dislocations. We
can learn a lot about the behaviour of a material from this approach, but we cannot use it to design a
pressure vessel or a forging press! It is also very difficult to extend an understanding of single
crystal plastic deformation to that of a polycrystalline metal.
Hence, in parallel with the microscopic approach, we have the
Macroscopic approach
Here the material is treated, in the first approximation, as an isotropic continuum and its
constitutive equations are defined as for the case of elasticity.
With this approach, we do not have to worry about slip directions and slip planes. We treat metals
as perfect materials characterised by only a few parameters which will behave in a mathematically
simple way.
This approach is valid for polycrystalline materials, but the assumption of isotropy is not valid for
single crystals or textured materials, e.g., as occurs when drawing a cylindrical cup from a flat
circular block (c.f., C6 (Crystallography)).
The microscopic approach and the macroscopic approach are used in parallel. They are equally
valid in their own spheres of application. In this course, we will look mainly at the macroscopic
continuum mechanics approach.

C12 – 5 – C12
Pictorial summary:
Microscopic approach Macroscopic approach
Elasticity
Plasticity
barrier
To set the scene for this course on plasticity, we first look at the microscopic picture of plastic flow
in more detail.
Microscopically, plastic flow is due to slip on a plane, or a set of planes, within a crystal. In order to
understand why some crystals will flow plastically more readily than others, we need to know how
many slip systems in different structures cause shape changes in a crystal, e.g., following Kelly and
Knowles, we need to answer the question
How does slip on a particular crystal system relate to the strain tensor produced?

C12 – 6 – C12
Suppose we first consider simple shear of a crystal through a small angle on a slip plane defined
by a unit vector n normal to it in a slip direction lying in the slip plane defined by the unit vector .
In the diagram below, the vector OQ initially parallel to n is sheared to become a vector OQ' after
the simple shear has taken place, and likewise the vector OR lying in the plane containing n and
is sheared to a vector OR':
O
R
n
O
Q' R'
n
Q R
Q
(a) before shear (b) after shear
From this diagram it is apparent that the displacement QQ' is the same magnitude as the
displacement RR'.
Clearly, all vectors r in the plane containing n and whose projected length along n is OQ suffer
the same displacement. Such vectors will have a component along the unit vector n of magnitude
r.n.
Also, from the diagram,
tanOQ
'QQ if is small (with measured in radians).
Hence, if is small, QQ' = (r.n).
In general, we need to consider the situation in 3D where r can also have a component along a
vector normal to both n and . Components along the vector normal to both n and are unaffected
by the shear process.
Thus, consideration of the general case on page 7 shows that the important features when
considering the effect of a shear process are and the component of r parallel to n, which is still
r.n.
Hence, as quoted on page 7, the result for glide on a general plane in a general direction is that the
amount of shear is
PP' = (r.n)

C12 – 7 – C12
Strain tensor for glide on a general plane in a general direction
Define unit vectors w.r.t. an orthonormal axis system:
n normal to slip plane
in slip direction
Slip moves point P to P'
where PP' = r' r = (r.n)
and is the angle of shear due to glide
n has components n1 n2 n3
has components 1 2 3
r has components x1 x2 x3
For small the relative displacement tensor eij is obtained by differentiating the displacements, e.g.,
11332211
1
11
11
11
111 )( '
nnxnxnx
xxxx
ue nrrr
Similarly for all eij:
iji
ji
jj
iij nnxnxnx
xxx
ue
)( 332211rr'
333231
232221
131211
nnn
nnn
nnn
eij
This relative displacement tensor can be separated into a symmetrical strain tensor ij and an
antisymmetric rotation tensor ij, where
33233221
133121
322321
22122121
311321
211221
11
)()(
)()(
)()(
nnnnn
nnnnn
nnnnn
ij
and
0)()(
)(0)(
)()(0
233221
133121
322321
122121
311321
211221
nnnn
nnnn
nnnn
ij
O
r.n
r r'
P
P'
n

C12 – 8 – C12
The strain and rotation tensors derived on page 7 are actually less fearsome than they look,
particularly when we apply these tensors to ‘sensible’ axes.
For example, a measure of the volume change is
332211iiV
V
[Remember that from C3, the trace of a strain matrix is an invariant, i.e., it does not depend on the
orthonormal axis system used.]
Hence,
βn. 332211 nnnii
Since lies in n, it follows that n. = 0 and so = 0.
Therefore, slip is a macroscopic shape change with no change in volume. This fits in well with
our ideas of dislocation motion – we should not expect a volume change during glide.
Independent slip systems
Formal definition:
A slip system is independent of others if the pure strain ij produced by it cannot be produced
by a suitable combination of slip on other systems.
Different crystal structures have different slip systems, as shown on page 9. The number of
independent slip systems shown can be seen to range from two to five. This number has
implications for plastic flow.
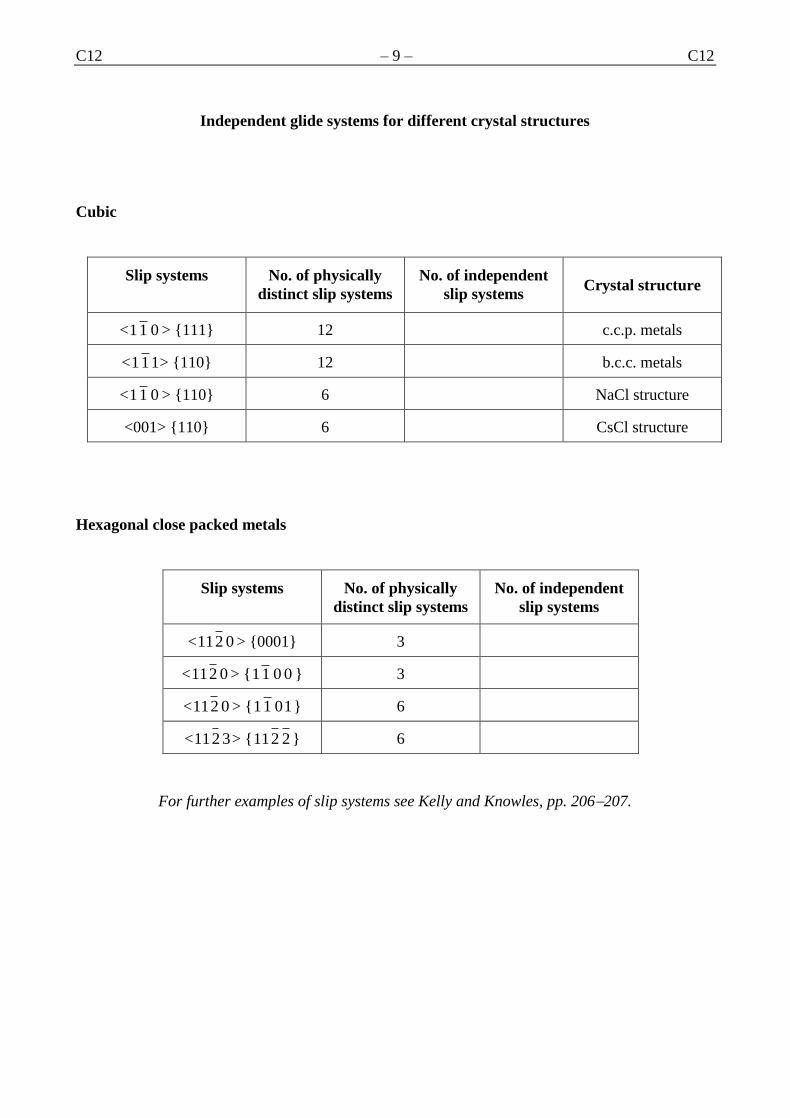
C12 – 9 – C12
Independent glide systems for different crystal structures
Cubic
Slip systems No. of physically
distinct slip systems
No. of independent
slip systems
Crystal structure
< 0 1 1 > {111} 12 c.c.p. metals
< 1 1 1 > {110} 12 b.c.c. metals
< 0 1 1 > {110} 6 NaCl structure
<001> {110} 6 CsCl structure
Hexagonal close packed metals
Slip systems No. of physically
distinct slip systems
No. of independent
slip systems
< 0 2 1 1 > {0001} 3
< 0 2 1 1 > { 0 0 1 1 } 3
< 0 2 1 1 > { 1 0 1 1 } 6
< 3 2 1 1 > { 2 2 1 1 } 6
For further examples of slip systems see Kelly and Knowles, pp. 206207.

C12 – 10 – C12
Independent glide systems in crystals with the NaCl structure: proof of two independent slip
systems
At room temperature the slip systems are {110}< 0 1 1 > in crystals with the NaCl structure.
There are six distinct planes of the type {110}. Within each plane there is only one distinct < 0 1 1 >
direction. Hence, there are six physically distinct slip systems.
It is convenient to label the six slip systems A – F for simplicity:
Label Slip system Label Slip system
A (110)[ 0 1 1 ] D ( 1 1 0 )[011]
B ( 0 1 1 )[110] E (101)[ 1 0 1 ]
C (011)[ 1 1 0 ] F ( 1 0 1 )[101]
Looking at slip system A, the strain tensor produced by shearing an angle is
000
010
001
2
Aε
since
0,
2
1,
2
1n and
0,
2
1,
2
1β (choosing our orthonormal set of axes to be parallel
to the crystal axes).

C12 – 11 – C12

C12 – 12 – C12
Independent glide systems in c.c.p. metals: proof of five independent slip systems
There are 12 slip systems of the form < 0 1 1 > {111}. Considering each of these in turn, we can
choose to look at slip directions within a given slip plane, and the strain tensors they produce.
Example: slip along [ 0 1 1 ] on the (111) slip plane:
If the amount of slip is of magnitude where is the angle of shear due to glide,
011
120
102
62
ε
since
3
1,
3
1,
3
1n and
0,
2
1,
2
1β .
We can therefore determine the 12 strain tensors produced by the 12 slip systems for slip of
magnitude , designating the slip systems A – L.
Label Slip system Label Slip system
A [ 0 1 1 ](111) G [ 1 1 0 ]( 1 1 1 )
B [ 1 1 0 ](111) H [110]( 1 1 1 )
C [ 1 0 1 ](111) I [ 1 0 1 ]( 1 1 1 )
D [ 0 1 1 ]( 1 1 1 ) J [110]( 1 1 1 )
E [011]( 1 1 1 ) K [ 1 0 1 ]( 1 1 1 )
F [101]( 1 1 1 ) L [ 1 1 0 ]( 1 1 1 )

C12 – 13 – C12
The strain tensors are therefore the following matrices:
011
120
102
62
Aε ;
201
021
110
62
Bε ;
210
101
012
62
Cε
011
120
102
62
Dε ;
201
021
110
62
Eε ;
210
101
012
62
Fε
201
021
110
62
Gε ;
011
120
102
62
Hε ;
210
101
012
62
Iε
011
120
102
62
Jε ;
210
101
012
62
Kε ;
201
021
110
62
Lε
It is readily apparent that there can only be two independent slip systems on each {111} slip plane,
so that, for example, in this table
BAC εεε
EDF εεε
HGI εεε
KJL εεε
and so we are not totally unrestricted in the choice of the slip systems that we identify as candidate
independent slip systems for c.c.p. crystals. Therefore, we need only look at slip systems A, B, D, E,
G, H, J and K.
If out of these we choose our independent slip systems to be A, B, D, E, and G, the strain tensors of
the other seven slip systems can all be written in terms of GEDBA and , , , εεεεε , demonstrating
that there are five independent slip systems for c.c.p. crystals.
[An examination of the forms of the strain tensor for A, B, D, E and G shows that they are all
independent of one another. Thus, for example, the strain tensor for G cannot be constructed from a
suitable combination of the strain tensors of A, B, D and E to reduce the number of independent slip
systems still further.]

C12 – 14 – C12
Thus,
BAC εεε
EDF εεε
BEDH εεεε
BGEDI εεεεε
BAEJ εεεε
GAK εεε
BGEL εεεε
It is also immediately apparent from this analysis that there have to be five independent slip systems
in b.c.c. crystals.

C12 – 15 – C12
Plastic flow in crystals
We know that in general there are 6 independent components of a strain tensor because strain
tensors have to be symmetric.
However,
It therefore follows that to achieve a general plastic shape change by slip, we need 5 independent
slip systems. This was first recognised in 1928 by Richard Edler von Mises (see
http://en.wikipedia.org/wiki/Richard_von_Mises) in a paper ‘Mechanik der plastischen
Formänderung von Kristallen’ published in Zeitschrift für Angewandte Mathematik und Mechanik,
8, 161185.
Another general result which follows from the need for 5 independent slip systems is that 5 are all
we need, and in fact there cannot be more than 5.
Crystals with the NaCl crystal structure have only two independent slip systems. Hence we can infer
that such crystals not be ductile in a general loading situation – some strains will not be able to be
accommodated by dislocation flow. Hence, we infer that fracture will occur to relieve the strains
generated. This ties in with our everyday experience – salt crystals fail by fracture and can easily be
crushed into many small pieces.
However, instead of a general loading, a specific loading situation is considered, then ductility can
occur in crystals with the NaCl structure.
If a single crystal of LiF is compressed along a <100> direction, it will flow. Dropping SiC grit
particles onto a (100) surface of a LiF single crystal and examining the surface afterwards by optical
microscopy shows evidence for dislocation mobility.
Compressing a single crystal of LiF along <111> will cause it to shatter without any dislocation
flow because the Schmid factors of each of the six possible slip systems which operate in LiF will
all be zero.

C12 – 16 – C12
Although the number of independent slip systems can tell us a lot about the plastic behaviour of a
material, materials with five independent slip systems can only accommodate a general strain if
these slip systems can operate simultaneously in a small volume of the material – there must be slip
flexibility.
For slip flexibility dislocations must be able to cross-slip easily and slip bands must interpenetrate,
so that dislocations on one system are not blocked by dislocations on another system.
Hence the von Mises condition tells us if a material can be ductile, but not if it is.
Examples of limited ductility

C12 – 17 – C12

C12 – 18 – C12
Continuum plasticity
We now turn to the macroscopic view of plasticity where we consider materials as homogeneous
isotropic media in the first instance with relatively simple constitutive equations.
This theory is vital in engineering design, forming and fabrication operations in metals, e.g.,
machining, forging and extrusion.
We begin by considering the curve of a real polycrystalline material:
This type of stressstrain curve can be approximated in various ways:
(1) Rigid – perfect plastic
In this approximation, the material is regarded as perfectly rigid prior to the onset of plastic
behaviour and perfectly plastic after the onset, i.e., a plastic material with no work hardening.
Hence the stress–strain curve looks like:

C12 – 19 – C12
(2) Linear elastic – perfect plastic
Here, the material is regarded linear elastic prior to the onset of plastic behaviour and perfectly
plastic after the onset, i.e., a plastic material with no work hardening. Hence the stress–strain curve
looks like:
(3) Linear elastic – linear work hardening
As the name suggests, the stress–strain curve looks like:

C12 – 20 – C12
There are of course other possibilities. One in particular is to approximate the relationship between
true stress and true strain to be of the form
nK
for a suitable work hardening exponent n:

C12 – 21 – C12
The most simple of these approximations is that of rigid – perfect plastic.
Here, elastic strains are completely ignored. This is justifiable since elastic strains are typically
< 1%, whereas plastic strains can be up to 50% or more. This is a very good model to use for metals
with very low work-hardening rates, or when either hot working or using low strains.
To construct a theory of plasticity, we need to define some criterion which will tell us when yielding
will occur for any stress state, not just uniaxial tension.
We begin with metals.

C12 – 22 – C12
The hydrostatic stress tensor remains the same irrespective of how the axis system is defined. This
can easily be appreciated mathematically, From C3 (Mathematical Methods), the effect of a
similarity transformation on the unit 3 3 stress tensor, I, is:
ICCCIC 11
where C is a rotation matrix. The hydrostatic stress tensor is just H I.
It follows from this elementary consideration that to define when yielding is about to occur, we
need to specify some function of the deviatoric stress tensor as being satisfied, e.g., when this
function (whatever it is) reaches a critical value.

C12 – 23 – C12
Yield criteria
A yield criterion is ‘An hypothesis defining the limit of elasticity under any possible combination of
stresses’.
There are several possible yield criteria. We shall examine two of these in some detail.
First, it is expedient to introduce the concept of principal stress space to help our understanding.
We define a right-handed orthogonal 3D space with axes 1, 2 and 3:
3
2
1
This is not of course real space. The orthogonal axes 1, 2 and 3 axes are not (necessarily)
related to orthogonal crystal axes.
Using this construction, any stress state can be plotted on this diagram as a point in 3D stress space
(although the stress state will have to be referred to the principal stresses, and this could well
involve determining these for a general stress matrix with six independent components).
The most simple stress state of uniaxial tension with 1 = , 2 = 0 and 3 = 0 has a stress tensor of
the form
000
000
00
and so this plots as a point on the 1 axis at .
If reaches the value at which yielding occurs in uniaxial tension, the yield stress, Y, we have
reached a critical value of the function of the deviatoric stress tensor at this point in principal stress
space.

C12 – 24 – C12
A purely hydrostatic stress 1 = 2 = 3 = will lie on the line 1 = 2 = 3, i.e., the ‘vector’ [111]
referred to the ‘vectors’ 1, 2 and 3 defining principal stress space.
3
2
1
1 = 2 = 3
‘hydrostatic line’
From the recognition that hydrostatic pressure has no effect on the yield behaviour of metals it
follows that, for any point on this hydrostatic line, there can be no yielding.
Now, we have already deduced that if 1 = Y, 2 = 0 and 3 = 0, yielding occurs.
Therefore, there must be a surface which surrounds the hydrostatic line and passes through (Y, 0, 0)
which is the boundary between elastic and plastic behaviour.
By symmetry, this boundary must also pass through (0, Y, 0) and (0, 0, Y).
If we can find some suitable surface, then that surface defines a yield criterion.
Yield criteria for metals
von Mises yield criterion
The most simple shape we could consider is a cylinder of appropriate radius whose axis is along the
hydrostatic line, i.e.,
This is the von Mises yield criterion formulated by Richard von Mises in 1913 in ‘Mechanik der
festen Körper im plastisch-deformablen Zustand’, Nachrichten von der Gesellschaft der
Wissenschaften zu Göttingen, Mathematisch-Physikalische Klasse, 1913, 582592.
As we shall see later, it is also known as the MaxwellHuberHenckyvon Mises criterion (or
variants thereof); Johnson and Mellor (p. 64) write that James Clerk Maxwell first proposed this
criterion in a letter to Kelvin in 1856. For brevity, we shall follow the terminology used in Hill, The
Mathematical Theory of Plasticity, and call it the von Mises criterion.

C12 – 25 – C12

C12 – 26 – C12
Physical interpretation of the von Mises yield criterion
There are a number of ways in which the von Mises yield criterion can be interpreted physically.
If we neglect dilatational changes, the von Mises criterion is very similar to the elastic strain energy
density arising from distortion alone (i.e. ignoring the contribution to elastic strain energy arising
from the change in volume arising through the imposition of a hydrostatic stress state):
where G is the shear modulus (see, for example, Johnson and Mellor, p. 71).
Therefore, we can regard the von Mises criterion as one where yield occurs when the strain energy
density reaches a critical value. For this reason, the von Mises criterion is sometimes called the
distortional energy criterion.
This criterion was first interpreted in this way after the 1913 paper of von Mises by Heinrich
Hencky in 1924. However, it was also anticipated in this form in 1904 by Maksymilian Tytus Huber
in his paper ‘Właściwa praca odkształcenia jako miara wytężenia materyału’, Czasopismo
Techniczne, 22, 3840, 4950, 6162 and 8081, hence the association of the von Mises criterion
with both Hencky and Huber.
Alternatively, if we look at normal and shear stresses on {111} octahedral ‘planes’ with respect to
the orthogonal and orthonormal principal stress axes, then we find that the shear stresses on these
‘planes’ (remember they are unlikely to be crystallographic {111} planes) have a magnitude
(see Question Sheet 1). Therefore, we can also interpret the von Mises yield criterion as a critical
octahedral shear stress criterion.
The von Mises criterion was first interpreted in this way by A. Eichinger in his paper ‘Versuche zu
Klarüng der Frage der Bruchgefahr’, 2. Teil, in 1926 at the Second International Congress on
Applied Mechanics held in Zürich, the proceedings of which were published in 1927.
Arpad Nadai in 1937 in his paper ‘Plastic behaviour of metals in the strain-hardening range. Part I’,
J. Appl. Phys., 8, 205213 also interprets the von Mises yield criterion in this way.

C12 – 27 – C12
Invariants of stress tensors and the von Mises yield criterion
In its most general form a stress tensor can be written in the form
zzyzzx
yzyyxy
zxxyxx
ij
Principal stresses 1, 2 and 3 are roots of the determinant equation
0 ijij
where ij is the Kronecker delta (ij =1 if i = j and 0 otherwise).
Writing this equation out in full we have the cubic equation
0322
13 III
(Backofen, p. 7), where
zzyyxxI 1
2222 zxyzxyxxzzzzyyyyxxI
2223 2 xyzzzxyyyzxxzxyzxyzzyyxxI
The coefficients I1, I2 and I3 are invariant, i.e., their values do not change with orientation because
the three roots of this cubic equation (the principal stresses) do not.
If the coordinates in which the stress tensor is described is one in which the x-, y- and z-directions
are the directions of the principal stresses, it follows that
3211 I
1332212 I
3213 I
demonstrating from I3 that the determinant of a stress tensor is an invariant and from I1 that the
trace of a stress tensor is also an invariant.

C12 – 28 – C12
The deviatoric stress tensor 'ij is related to ij through the equation
ijijij
I
3' 1
i.e., it is the original stress tensor with the hydrostatic stress subtracted. Invariants of this deviatoric
stress tensor can also be defined from the determinant equation
0' ijij
Writing out in full this becomes
0323 JJ
The coefficient of 2 is zero here because if follows from the definition of the deviatoric stress
tensor that its trace is zero.
If the coordinates in which the deviatoric stress tensor is described is one in which the x-, y- and z-
directions are the directions of the principal stresses, the quadratic invariant, J2, becomes
213
232
2212
6
1J
If, as is the case for metals, yielding is not affected by the magnitude of the mean normal stress (i.e.,
the value of hydrostatic stress), then any yield criterion has only to involve the components of
the deviatoric stress tensor. A simple yield criterion under these circumstances is that one of the
invariants of the deviatoric stress tensor should be a constant at yielding. Consideration of the form
of J2 shows that the von Mises yield condition is equivalent to the statement that, at yielding,
J2 = constant
The value of this constant can be established from the condition that at yield in uniaxial tension, the
principal stresses 1 = Y, 2 = 0 and 3 = 0, whence
3
2
2
YJ
and so this yield condition is simply rewritten in the more familiar form
2213
232
221 2Y

C12 – 29 – C12
A mathematically simpler criterion is the Tresca criterion, advocated in the nineteenth century as a
result of experiments carried out in the period 1864 – 1872 by Henri Édouard Tresca, a French
mechanical engineer (see http://en.wikipedia.org/wiki/Henri_Tresca). Tresca concluded from his
experiments that:
Historical note: Although we shall follow the terminology used in Hill, The Mathematical Theory of
Plasticity, and call this the Tresca criterion, others refer to this criterion as the MohrGuest criterion
(Roš and Eichinger, 1926) or the Mohr criterion (Taylor and Quinney, 1931).
Mohr is Otto Mohr of Mohr’s circle fame; Guest is James J. Guest who published a paper in
Philosophical Magazine, 50 (1900) 69132, ‘On the strength of ductile materials under combined
stress’, concluding on p. 132 with the following statement:

C12 – 30 – C12
Viewed down the hydrostatic line, the von Mises yield criterion and the Tresca yield criterion plot
as:

C12 – 31 – C12
Experimental test of the von Mises and Tresca yield criteria
To determine which of these two yield criteria is most appropriate to describe the yield behaviour of
metallic materials, we need to be able to subject an object to combined stress states. The classic
experiment was first performed by Taylor and Quinney in 1931 and has been repeated many times
since.
In such an experiment, use is made of a thin-walled tube subjected to a combined torque, T, and
axial load, P:
P P T T
2
1
Then, with respect to the axis system ‘1’ along the axis and ‘2’ around the cylinder, the stress tensor
takes the form
000
00
0
where
rt
P
2 and
tr
T22
for a thin-walled tube of radius r and wall thickness t.

C12 – 32 – C12

C12 – 33 – C12

C12 – 34 – C12
Experimentally, we can vary the load P and the torque T for a thin-walled tube. Hence we can
determine the yield stress for different values of P and T (and therefore different values of and )
and compare with the predictions of von Mises and Tresca.
The experimental data collected by Taylor and Quinney below suggested that the von Mises yield
criterion fitted the data better than the more conservative Tresca yield criterion.
○ copper, aluminium and steel.
Test of yield criteria for metals using thin-walled tubes subjected to combined tensile and
shear stresses (after G.I. Taylor and H. Quinney, Phil. Trans. Roy. Soc. Lond. A230, 323362
(1931)).
Note that the experiments have to be done with care. Precautions have to be taken against
anisotropy. If we make a tube by drawing, it will have considerable texture in the drawing direction
and will need careful annealing before use.
A test for anisotropy is to measure the internal volume change during deformation by filling the
cylinder with a liquid. If the tube is isotropic, there should be no internal volume change during
plastic deformation.
/Y
/Y

C12 – 35 – C12
Yield criteria for non-metals
Ceramics, when they deform plastically, usually obey the von Mises or the Tresca criterion.
However, other materials such as polymers, concrete, soils and granular materials display yield
criteria which are not independent of hydrostatic pressure. [Metallic glasses also show a weak
hydrostatic dependence on their yield criteria – see, for example, J.J. Lewandowski and P.
Lowhaphandu, Phil. Mag. A, 82, 3427 (2002).]
Empirically, it is seen in such materials that, as hydrostatic pressure is increased, the yield stress
increases, so clearly we do not expect a yield criterion based solely on the deviatoric component of
stress to be valid.
The first attempt to produce a yield criterion incorporating the effect of pressure was by Charles-
Augustin de Coulomb (1773). This was applied to the shear strength of a soil and also the fracture
of building stone in compression.
The Coulomb criterion states that:
Failure occurs when the shear strength on any plane reaches a critical value,c, which varies
linearly with the stress normal to that plane
Mathematically the equation describing this is
tan * nc
where n is a positive normal stress on the plane of failure (so that a compressive stress would be
negative), * is a material parameter and is an angle of shearing resistance.
Note that tan is not a ‘coefficient of friction’, although it is often referred to as such.
An example of the failure locus is shown below in – space.
Typically for soils tan 0.5 – 0.6. For metallic glasses, tan 0.025.

C12 – 36 – C12
From this failure locus it is apparent that, as a soil is compressed, the shear stress required to cause
failure increases.
A simple test which demonstrates this is the direct shear test, in which a sample of soil is placed in
a stout cylindrical or square-based vessel which can be split in half horizontally. A compressive
weight is applied to the top of the sample and a shear stress is applied to the vessel until failure
occurs in the soil on the horizontal plane between the two halves of the vessel. Different magnitudes
of compressive weights give rise to different values of shear stress required to cause failure.
An example of a large scale direct shear test taken from a 2004 U.S. Department of Transportation
report is shown below, in which the two halves of the split cylinder are readily apparent.
z
x
y
The test has a number of limitations, not the least of which is the assumption that the intermediate
principal stress component lies between the maximum and minimum principal stresses generated by
the test, i.e., the test supposes that the stress tensor is of the form
0
00
0
x
x
where in the above picture axis ‘x’ is out of the plane of the paper, axis ‘y’ is horizontal to the right
and axis ‘z’ is vertical. The tensile stresses x and are both compressive to hold the soil in
place, and it is presumed that the compressive stress in the x-y plane is isotropic before the
imposition of a shear stress in the x-z plane.

C12 – 37 – C12
With respect to principal stresses where 1 > 3 > 2, we then have
2/1
22
142
xx ,
2/1
22
242
xx and x3
and we require 1 < 3 < 2, i.e. 1 is the compressive stress of greatest magnitude and 2 is the
compressive stress of least magnitude.
Hence, in terms of a Mohr’s circle analysis, we have a state of stress that can be represented in the
form
and failure here is determined by 21 , and is independent of 3.
Therefore, this failure criterion is a variant or modification of the Tresca failure criterion.
To see this, consider what happens when = 0°: the two lines meeting at a positive value of will
instead be parallel lines. Yield is determined by the circle whose radius is 0.5 21 and will be
independent of the intermediate stress 3 and precisely where the centre of this circle is located on
the axis. Hence, in terms of a Mohr’s circle analysis, we have a state of stress that can be
represented in the form
Coulomb’s failure model is widely used for soils and has also been used to analyse the yield
behaviour of metallic glasses in bulk and strip form.

C12 – 38 – C12
A better model for polymers is to assume that the shear stress required to cause failure is a function
of the hydrostatic pressure, P, i.e.,
Pfk

C12 – 39 – C12

C12 – 40 – C12
Predictions of plastic strains
Once the yield criterion is satisfied, we can no longer expect to use the equations of elasticity – we
must develop a theory to predict plastic strains from the imposed stresses.
In general there will be both plastic (irrecoverable) and elastic (recoverable) strains.
However, we can ignore the elastic strains, assuming that the plastic strains dominate we can
therefore treat the material as rigid perfect plastic:
How do we then relate stress and strain?
Since plasticity is a form of flow, we can relate the strain rate, d/dt, to stress,
Plastic flow is similar to fluid flow, except that any rate of flow (strain rate) can occur for the same
yield stress.
From symmetry, we can show the following axiom:
In an isotropic body the principal axes of stress and strain rate coincide
i.e., ‘it goes the way you push it’.
The behaviour is best described by the Lévy-Mises equations.
With respect to principal axes, the relationships between strain rate and stress take the form
''' 3
3
2
2
1
1
where t
id
d (i = 1,3) is the normal strain rate parallel to the i
th axis.
and i' is the deviatoric component of the normal stress parallel to the ith
axis.

C12 – 41 – C12

C12 – 42 – C12
Example of the analysis of plastic flow
Expansion of a thin-walled cylinder by internal pressure.
r
l
2
1
This geometry is commonly used for pressure vessels. To design against catastrophic failure, we
wish them to flow plastically before fracture (i.e., ‘leak before fracture’) when subjected to
unexpectedly high stresses.
Defining axes 1 and 2 as shown, it is apparent that axis ‘3’ perpendicular to these two will be along
the cylinder radius through a small element of interest.
[By symmetry, the principal axes are circumferential, longitudinal and radial.]
Since we are dealing with a thin-walled cylinder, 3 = 0, and so we have plane stress conditions in
12 space.
Suppose the internal pressure is P and the wall thickness is t.
It follows from C4 (Tensor Properties) that
t
Pr1 and
t
Pr
22
If we now apply the von Mises yield condition, we find that at yield

C12 – 43 – C12

C12 – 44 – C12

C12 – 45 – C12
The pressured thin-walled tube is one example of plastic behaviour, where there is both plane stress
and plane strain. Other practical engineering examples arise which are examples of either plane
stress or plane strain.
In plane strain, one principal strain (say 3) is zero, so that 3 = 0. Such a situation arises in
forging and rolling, where flow in a particular direction is constrained by other material or by a
well-lubricated wall.
Thus, in rolling, all the deformation is perpendicular to the roll axes. The invariance in length of an
internally pressurised tube is a second example of plane strain conditions.
ti
1
2
3
tf slab
w
F
Example of plane strain sheet drawing. The width w in the ‘3’ direction is unchanged as a result of
the drawing operation; all deformation occurs in the 1-2 plane, so that a slab shown is deformed
plastically by being compressed in the ‘2’ direction and extended in the ‘1’ direction by the applied
force, F.
In plane stress, one principal stress is zero, e.g., a material in the form of a thin sheet is subjected to
uniaxial or biaxial tension. This is important in sheet metal forming. The internally pressurised thin
walled cylinder is a second example of plane stress.
Discussion of the practical deformation processes of rolling, forging, extrusion, drawing, stamping,
deep drawing and pressing can be seen in the TLP ‘Introduction to Deformation Processes’ at
http://www.msm.cam.ac.uk/doitpoms/tlplib/metal-forming-2/index.php

C12 – 46 – C12
Examples of typical forming operations

C12 – 47 – C12
Extrusion operations can be either (a) direct or (b) indirect

C12 – 48 – C12
Plastic deformation in plane stress
Let 3 = 0, i.e. consider ‘3’ to be the direction perpendicular to the plane of a thin sheet.
If we now consider uniaxial tensile behaviour of a thin sheet, we have:
A
B
1
2
1'
2'
elastic
elastic
yielded
1 0, 2 = 3 = 0.
Plastic flow will start at some point within the sheet – it will not occur simultaneously all over the
sheet.
Because of the constraint of neighbouring elastic material, the plastically deforming material forms
in a band across the sheet at a characteristic angle to the angle of loading.
At the boundary between the elastic material and the plastically deformed material, the longitudinal
strains must match for continuity. Since the strains in the elastic material are in effect zero (i.e.,
treating the material as a rigid - perfectly plastic material), the plastic strain increments along the
line AB in the above diagram must also be zero, i.e.,
AB = 0
The line AB is parallel to the axis 2' which is rotated anticlockwise by (90° ) with respect to axis
2. Axis 1' is also rotated anticlockwise by (90° ) with respect to axis 1:
1
2
90
1'
2'
90

C12 – 49 – C12

C12 – 50 – C12

C12 – 51 – C12
This phenomenon of plane deformation in plane stress is well-known in mild steel:
The bands created just after the material has yielded are known as Lüders bands. These bands
require less stress for their propagation than for their formation because of the freeing of
dislocations from their solute atmospheres (c.f., Part IB).
Lüders bands occur in certain types of steel, such as low carbon steel (mild steel), but not in other
metallic alloys, such as aluminium alloys and titanium alloys. This is because plastic strain
localisation is normally suppressed by work hardening, which tends to make plastic flow occur
rather uniformly in a metal, particularly in the early stages of plastic flow, i.e., just after yield has
taken place.
However, in certain types of low carbon steel at room temperature, Cottrell atmospheres of carbon
atoms which have been able to segregate preferentially to dislocation cores pin dislocations until the
upper yield point is reached. Once the upper yield point is reached, there is a load drop, and then a
sudden burst of plastic straining at a constant externally applied load, as cascades of dislocations are
able escape their Cottrell atmospheres. This is rather specialised behaviour, caused by the ability of
carbon atoms to diffuse relatively easily interstitially in these steels, but it is actually necessary
behaviour for the formation of Lüders bands.
Conventional work hardening in metallic alloys in the early stages of plastic deformation makes any
strain localisation (as demonstrated by the formation of Lüders bands) unlikely. This is also the case
for pure metals, and for metals at high temperature, where large plastic strains can occur without a
significant load increase once plastic deformation begins.
Therefore, Lüders bands only form if a limited burst of plastic straining is able to take place at
constant load. Mild steels heated to sufficiently high temperatures (> 400 °C) and then tensile tested
do not exhibit Lüders bands because the carbon atoms present in the mild steel are too mobile to pin
the dislocations effectively.
[Note that Calladine, p. 27, incorrectly states that Lüders bands form at 45° to the tensile axis.]

C12 – 52 – C12
Plastic deformation in plane strain
Here, one principal strain is zero. Let this be 3. Then, 3 = 0.

C12 – 53 – C12

C12 – 54 – C12
Suppose that we have uniaxial compression of a rigid – perfectly plastic material where plastic
strain only takes place in the 1-2 plane, so that 3 = 0, and that there is no friction between the
workpiece and the die faces (platens), e.g.:
2 < 0
2 < 0
1 = 0 1 = 0
2
workpiece
1
To achieve very low friction between the workpiece and the die faces, the interface between the
workpiece and the die faces must be well lubricated.
Under these circumstances,

C12 – 55 – C12
The direction of maximum shear stress, here 45° to the 1 and 2 axes, are slip lines along which
plastic sliding occurs, e.g.:
[Note: we are avoiding additional complexities here such as work hardening – remember that we
have assumed the material exhibits rigid – perfectly plastic behaviour.]
The above simple example is a special case of the more general situation where the stress tensor can
be written in the form
000
00
00
00
00
00
k
k
p
p
p
ij
hydrostatic: deviatioric:
(can vary in magnitude (pure shear yield stress: k
through object in general) is the same everywhere)
i.e., in the more general situation p is not the same as k. We will use this more general result when
we examine the indentation of a material by a flat, frictionless punch.

C12 – 56 – C12
Slip line field theory
The preceding analysis of plane strain plasticity in a simple case of uniaxial compression has just
established the basis of slip-line field theory, which enables us to map out directions of plastic
flow in plane strain plasticity problems.
There will always be two perpendicular directions of maximum shear stress in the 1-2 plane.
These generate two families of slip lines intersecting orthogonally, as in the diagram on page 55.
These are called -lines and -lines.
Choosing a right-handed set of orthogonal axes, so that the 1-2 plane is seen looking down the ‘3’
axis towards the 1-2 plane, the convention for labelling the lines is as follows:
An anticlockwise rotation from to crosses 1, the maximum principal stress axis.
The example below shows the convention applied to the analysis in the simple forging situation
where there is no sticking friction.
This is seen experimentally to be a realistic plastic deformation situation, e.g.:
1. PVC seen under polarised light conditions (exploiting strain birefringence)
2. Nitrogen-containing steels can be etched using Fry’s reagent to reveal regions of plastic
flow, e.g., in notched bars and thick-walled cylinders.
3. Under dull red heat in forging we see a distinct red cross (T > 100 °C relative to the
remainder of the forging), due to dissipation of mechanical energy on the slip planes.

C12 – 57 – C12
To develop slip-line field theory to more general plane strain conditions, we recognise that the
stress can vary from point to point within the workpiece
p can vary, but k is a material constant
Therefore, the directions of maximum shear stress and the directions of the principal stresses 1 and
2 can vary along a slip line.
The relevant equations to describe this are known as the Hencky relations:
The hydrostatic pressure p varies linearly with the angle turned by a slip line.
p + 2k is constant along an line
p – 2k is constant along a line
where the angle is in radians.
To see where these come from, we have to consider the equations of equilibrium in plane strain
with respect to some fixed x and y axes in this plane.

C12 – 58 – C12
Equations of equilibrium for plane strain:
In plane strain plasticity, we have in general tensile stresses σxx and σyy and shear stresses τxy = τyx.
The shear stresses τzx and τyz are zero. The tensile stress σzz = 1/2(σxx + σyy). Hence the stress tensor
can be written in the form
yyxx
yyxy
xyxx
zz
yyxy
xyxx
2
100
0
0
00
0
0
σ
It follows that the plastic strain increment δεzz = 0.
If the stress can vary from point to point, we need σxx, σyy and τxy to satisfy the equilibrium
equations
0
0
yx
yx
yyxy
xyxx
To see why, consider a small element of material upon which the stress system is acting with
orthogonal sides of lengths Δx, Δy and Δz, as in the diagram below. For simplicity the diagram only
shows σxx, σyy and τxy, acting on faces A, B, C and D of the element; σzz is not shown.
τxyB
τxyC
σxxC x
z
y
σyyB
σxxA
A τxyA τxyD
σyyD
Δz
Δx
Δy
The tensile stresses σxx on opposite faces A and C are similar, but not the same, because the stress is
able to vary from point to point. The same principle applies to σyy on faces B and D and τxy on faces
A, B, C and D.
Since the element is in equilibrium, the net forces in the x-, y- and z-directions must be zero.

C12 – 59 – C12

C12 – 60 – C12

C12 – 61 – C12
In general, we need to examine the stresses on a small curvilinear element in the x-y plane upon
which a shear stress and a hydrostatic stress are acting, and where the principal stresses are – p – k
and – p + k for a situation where there is plane strain compression, such as in forging or indentation
in which k is a constant but p can vary from point to point:
x
y
p
p
p
p
k
k
k
k
We can then identify on this diagram the directions of principal stress 1 and 2 (remembering that
1 > 2), and which of the lines are -lines and which are -lines. We can also specify the angle
of the -lines with respect to the x-axis:
x
y
p
p
p
p
k
k
k
k
1
2
2
1
Suppose that the α-slip line passing through the element makes an angle with respect to reference
x- and y-axes, as in the above diagram. The β-slip line must then make an angle of 90° + with
respect to the x-axis, so that an anticlockwise rotation from the α-slip line to the β-slip line crosses
the direction of maximum principal stress, σ1.
The direction parallel to the principal stress σ1 makes an angle of 45° + with respect to the x-axis
and the direction parallel to the principal stress σ2 makes an angle of 135° + 45° with
respect to the x-axis.

C12 – 62 – C12
To summarise: with respect to the reference x- and y-axes,
rotating anticlockwise by , we move to directions parallel to the α-slip lines;
rotating anticlockwise by 45° + , we move to directions parallel to σ1;
rotating anticlockwise by 90° + , we move to directions parallel to the β-slip lines;
rotating anticlockwise by 135° + , we move to directions parallel to σ2;
On a Mohr’s circle (where angular movements are all doubled), this all looks like:
where A and B represent the stress states along the - and -lines respectively.
Hence, from the above,
2cos290 sin
2sin290 cos
2sin290 cos
kk
kpkp
kpkp
xy
yy
xx
while the tensile stress in the z-direction in plain strain plastic yielding is simply 1/2(σxx + σyy) = p.
p
k
k
yy
xx
xy
xy
A
B
90 + 2

C12 – 63 – C12
Substituting these expressions into the equilibrium equations
0
0
yx
yx
yyxy
xyxx
and recognising that k is a constant independent of x and y, we obtain two equations for p and as a
function of x and y:
02cos22sin2
02sin22cos2
yk
y
p
xk
yk
xk
x
p
When = 0°, 2π, 4π, etc., the and lines coincide with the external x- and y-axes respectively at
a particular position. Under such circumstances, these equations become
02 )2(
02 )1(
kpy
kpx
Integrating these equations we find
22
11
)(2 )2(
)(2 )1(
Cxfkp
Cyfkp
as the solutions of these two equations. However, we know that when is exactly zero, p must have
the same value in both (1) and (2). Hence it follows that f1(y) = f2(x) = 0.
In general for points in a slip-line field we have therefore proved that the Hencky relations have to
be satisfied:
Hencky relations
The hydrostatic pressure p varies linearly with the angle turned by a slip line.
p + 2k is constant along an line
p – 2k is constant along a line
where the angle is in radians.

C12 – 64 – C12
Application of the Hencky relations: indentation of a material by a flat, frictionless, punch:
K M
45°
M'
P
L
y
L'
x
In the above diagram there are free surfaces at M and M'. At both of these positions yielding will
have just occurred.

C12 – 65 – C12

C12 – 66 – C12
Hence, in the hardness test, the pressure P, required to cause yielding beneath the punch, leading to
indentation, is 3Y.
This is because of plastic constraint – flow is constrained by the metal around the plastically
deforming region.
Therefore, the material of the punch needs to be > 3 times stronger than the indented material if it is
not to flow first.
This result is also useful in situations which are not ideal plane strain, e.g., cylindrical strain where
there is axial symmetry.
Deeply notched bar
A doubly slotted block of perfectly plastic material has exactly the same slip line field as in the
indentation problem. Yield occurs at 3Y over the notched area as in the diagram on the next page.
This can lead to brittle fracture, quite apart from any elastic stress concentration effect due to the
notches.
The notches raise locally the plastic flow stress, so that it may be that the raised value is above the
stress F required for brittle fracture.
If F > 3Y, the material always flows first: the material is said to be ‘simply ductile’.
If F < Y, the material always fractures first: the material is said to be ‘simply brittle’.
If Y < F < 3Y, the material is ‘notch brittle’.
(using Orowan’s nomenclature).

C12 – 67 – C12
Examples of slip line fields
(1) Frictionless indentation with a flat punch
(2) Tension applied to a doubly slotted block of perfectly plastic material
(3) Notched bar in plane bending

C12 – 68 – C12
More general plane strain situations
Other situations are more complex, e.g., a notched bar in plane bending, as in the example overleaf,
but note that even here the slip lines have to meet free surfaces at 45°. This requirement is also true
for frictionless surfaces, as in the simple example of forging.
In more general cases, the slip lines do not meet boundaries at 45° because of friction. If, in the
limit, we have sticking friction (in essence a perfectly rough interface), then we get slip lines at 90°
to the interface and along the interface.
Therefore, in the case of sticking friction, we have shear along the interface.
The slip-line patterns that we have discussed are very useful for analysing plane strain deformation
in a rigid – perfectly plastic isotropic solid. However, we have not yet discussed how we arrive at
the slip-line pattern.
This is the tricky bit (!). Either it is derived from model experiments in which the slip-line field is
apparent or it is postulated from experience of problems with similar geometry.
For a slip-line field to be a valid solution (but not a unique solution necessarily), the stress
distribution throughout the whole body, not just in the plastic region, must not violate stress
equilibrium, nor must it violate the yield criterion outside the slip-line field.
The resultant velocity field must also be evaluated to ensure that strain compatibility is satisfied,
i.e., matter is conserved.
These are stringent conditions and mean that obtaining a slip-line field solution is often not simple.
Instead, it is useful to take a more simple approach to the analysis of deformation processing
operations where one or other of the stringent conditions is relaxed to give useful approximate
solutions for part of the analysis, e.g., an estimate of the load required, or the work required.
The possible approaches are:
(1) The work formula method
(2) Limit analysis – upper bound method
– lower bound method

C12 – 69 – C12
Work formula method
With this approach we assume that the change in geometry in a processing operation is carried out
in the most efficient way possible.
Therefore, we estimate the minimum amount of work required and can also estimate the minimum
force required.
Consider, for example, a uniaxial tensile deformation process of a rigid – perfectly plastic material:
F F
In this process, 1 = Y, 2 = 3 = 0 where Y is the uniaxial yield stress.
Suppose that at some instant the bar is of length l and cross-sectional area, A. The volume V = Al.
If the bar is extended plastically by an amount l, the increment of work done per unit volume, W,
is given by the expression
Yl
lY
Al
lF
V
lFW
where is the increment in true strain.
Therefore, if the bar extends from an original length l0 to a final length l1, the work done per unit
volume, W, is
0
1lnd
1
0
l
lY
l
lYWW
l
l
or, alternatively,
f
0
f
d
YYWW
where f is the final true strain.

C12 – 70 – C12
We can apply this formula to wire drawing.
In wire drawing, a force is applied to the product (i.e., the wire after it has gone through the die),
rather than to the billet (as in extrusion for example):
F
die
die
A1
A0
Here, the cross-sectional area of the wire is reduced from A0 to A1 as a result of the wire drawing
process.

C12 – 71 – C12

C12 – 72 – C12
Wire drawing of work hardening materials
If a material can work harden during the wire drawing process, so that for example, the relationship
between true stress and true strain takes the form
nK
for some work hardening exponent n, the amount of reduction can be slightly greater than 63%. In
this case the fractional reduction, r, is given by the formula
ner 11
To see why, we need to look first at the equation for dW, the work done per unit volume extending a
bar by a length dl:
dKl
dlYdW n
Hence, in stretching a wire from an original length l0 to a final length l1 (and a final true strain f),
the total work done per unit volume is
1
1f
0
f
nKdK
l
dlYdWW
nn
where the final true strain f is, as before,
0
1f ln
l
l
Clearly, the situation for n = 0 which we have already examined for the rigid – perfect plastic
material is a special case of this more general formula for W.
In extending the wire a distance l1, the work done by the force = Fl1. From the formula for the work
done/unit volume extending the bar from an original length l0 to a final length l1, it follows that
1
1f
111n
KlAFln
Hence, the drawing stress, draw, is now
1
1f
1
draw
nK
A
Fn
and we know that draw yield stress of material at a strain of f, i.e., n
K fdraw .

C12 – 73 – C12
Therefore, it follows that
nn
Kn
K f
1f
1
and so the fractional reduction, r, is now determined by the equality
1f n
Hence
)1(
1
0
0
1 111 nel
l
A
Ar
and so for n > 0, r will be greater than 0.632. Typical values of n for most metals are in the range
0.1 – 0.5. Thus, for n = 0.1, r = 0.667 and for n = 0.5, r = 0.777.

C12 – 74 – C12
Redundant work
The theoretical drawing ratio will not be achieved in practice, even with good lubrication, In
practice, the best reduction obtainable for real dies is 50% or so reduction.
To allow for redundant work, we can apply empirical corrections, e.g., by using a value of
efficiency, :
work totalActual
estimate formulawork
and so
estimate formulawork work totalActual
Typical values of are:
Extrusion: = 45 – 55 %
Wire drawing: = 50 – 65 %
Rolling: = 60 – 80 %
Clearly, the work formula method gives a lower bound to the true force required for a given
deformation processing operation because we are neglecting ‘redundant work’.
For metalworking it is often preferable to have an overestimate of the load needed, so that we can
be sure that a given operation or process is possible.

C12 – 75 – C12
Empirical formulae allowing for redundant work give reasonably good estimates of the pressure
required for processes to function.
Thus, for extrusion, the pressure required, p, is given tolerably well by the empirical equation
RY
pln5.18.0
where R is the ratio of areas before and after extrusion and Y the uniaxial compressive yield stress,
rather than the ideal work formula
RY
pln
Depending on whether the Tresca criterion or the von Mises criterion is used, Y in these formulae
can be replaced either by 2k or k3 .

C12 – 76 – C12
Limit analysis
This approach gives us both lower bounds and upper bounds to a deformation load required. It is
much easier to apply to a problem than the slip-line field approach and is nearly as accurate.
In limit analysis we apply techniques known as ‘load bounding’ to obtain two estimates of the load
needed to cause plastic flow, e.g., to cause indentation or to carry out a forging operation.
These are:
(a) The upper-bound value – a definite overestimate
(b) The lower-bound value – a definite underestimate
The true value must lie somewhere between these two values. If the two limits coincide, we clearly
have the true value.
The upper-bound value is the one we shall look at very closely because of its attraction for
analysing metalworking processes.
The lower-bound value is valuable in engineering design, e.g., when designing a structure which
must not collapse – it provides a conservative estimate of the collapse load.
For these bounds, one of two conditions have to be satisfied:
(1) Geometrical compatibility between internal and external displacements or strains. This is
usually concerned with kinetic conditions – we must have velocity compatibility to ensure
no gain or loss of material at any point.
(2) Stress equilibrium: the internal stress field must balance the externally applied stresses
and forces.
The basis of limit analysis rests upon the following two theorems which can be proved
mathematically:
Lower-bound theorem:
If a statically admissible stress field exists such that the stresses are everywhere just below those
necessary to cause yielding, then the loads associated with that field form a lower-bound solution.
Upper-bound theorem:
If a kinematically admissible strain or velocity field exists, the loads required to cause that velocity
field to operate constitute an upper-bound solution.
Reasonably rigorous proofs are given by Johnson and Mellor, pp. 416418.

C12 – 77 – C12
In simple terms, the theorems are:
Lower bound: Any stress system which only just prevents yielding forms a lower-bound
solution.
(i.e., we consider stress equilibrium, but ignore geometrical compatibility)
Upper bound: Any velocity field which can operate is associated with an upper-bound
solution.
(i.e., we satisfy the geometrical compatibility, but ignore stress equilibrium)
In practice, we find an upper-bound load by postulating a deformation pattern, working out the rate
at which energy is dissipated by shear in this pattern, and then equating it to the work done by the
(unknown) external force.
The minimum upper bound is clearly the best when considering deformation processing operations.

C12 – 78 – C12
Examples of limit analysis
Two practical examples of the use of limit analysis are the notched bar in tension and the notched
bar in plane bending:
Notched bar in tension, plane strain
Lower bound:
P P
kh
Breadth of slab = b (b >> h for plane strain conditions)

C12 – 79 – C12
Upper bound:
Assume yielding by slip on 45° shear planes AB, AC with shear stress k:
P P A
C B

C12 – 80 – C12
Notched bar, breadth b, in plane bending
Lower bound:
M M 2 k
2 k
= 0
Neutral axis h
Assume stress system as above, with elements experiencing zero stress in the length of the bar
where there is a notch, tensile stresses (above neutral axis) and compressive stresses (below neutral
axis).
Equating couples, M = bkhh
bh
k 25.02
..2
.2
[ bh
k .2
.2 is the magnitude of the forces in the tensile and compressive regions, and 2
h is the
distance between the centres of these two regions]
Upper bound:
Assume failure is by sliding around a ‘plastic hinge’ along circular arcs of length l and radius r (i.e.,
the blocks to the left and right of the hinge slide around the hinge).
If the rotation is , the internal work done = rblk ... along one arc.
External work done = M by one moment.
Hence,
klbrM
but we have yet to make any assumptions about the relationship between l and r.
The upper-bound theorem tells us that whatever value we take for l and r, we will have an upper
bound estimate. Clearly, we wish to find the lowest possible.
M M k k

C12 – 81 – C12
C12 – 82 – C12
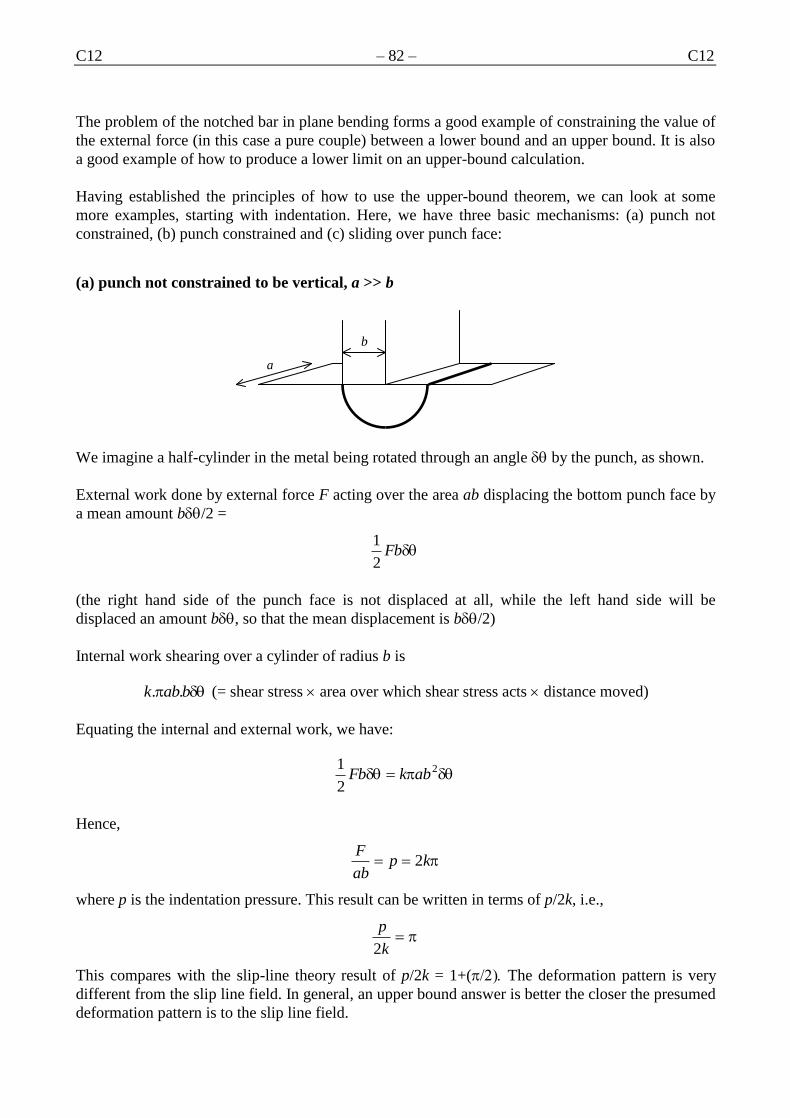
The problem of the notched bar in plane bending forms a good example of constraining the value of
the external force (in this case a pure couple) between a lower bound and an upper bound. It is also
a good example of how to produce a lower limit on an upper-bound calculation.
Having established the principles of how to use the upper-bound theorem, we can look at some
more examples, starting with indentation. Here, we have three basic mechanisms: (a) punch not
constrained, (b) punch constrained and (c) sliding over punch face:
(a) punch not constrained to be vertical, a >> b
We imagine a half-cylinder in the metal being rotated through an angle by the punch, as shown.
External work done by external force F acting over the area ab displacing the bottom punch face by
a mean amount b/2 =
Fb2
1
(the right hand side of the punch face is not displaced at all, while the left hand side will be
displaced an amount b, so that the mean displacement is b/2)
Internal work shearing over a cylinder of radius b is
babk .. (= shear stress area over which shear stress acts distance moved)
Equating the internal and external work, we have:
2
2
1abkFb
Hence,
kpab
F2
where p is the indentation pressure. This result can be written in terms of p/2k, i.e.,
k
p
2
This compares with the slip-line theory result of p/2k = 1+( The deformation pattern is very
different from the slip line field. In general, an upper bound answer is better the closer the presumed
deformation pattern is to the slip line field.
a
b

C12 – 83 – C12
(b) punch constrained to be vertical – upper-bound solution
b
We can postulate a deformation pattern as shown above, in which we imagine five rigid blocks of
metal moving in response to the applied force. The shaded block in the centre is presumed to be a
‘dead metal’ zone moving at the same downwards velocity as the punch. Internal energy dissipation
takes place by shearing on eight shear planes.
Fortunately, there is a plane of symmetry, so we need only consider one half of the problem to
analyse the physical situation:
A B E
C D
b/2
An (imaginary) particle will travel a path as shown: it is first sheared when it meets the line BC to
cause it to move by shear parallel to CD. It is then sheared along DB to cause it to move by shear
parallel to DE.
To analyse this, it is worth looking at the basic equation for the rate of energy dissipation in an
upper bound solution in more detail.

C12 – 84 – C12
Basic equation for energy dissipation in an upper bound solution
a v1
A B
C D
S
S'
v2
A'
B'
C'
D'
In the above diagram, ABCD is distorted into A'B'C'D' by shear along the vector 'SS at a velocity vs
in the metal. The shear stress required to cause this deformation process is k.
Suppose ABCD moves towards the shear plane at a velocity v1 and that there is a pressure p acting
on the area al where l is the dimension out of the plane of the paper helping to cause this movement.
We can take l to be unit length, but to ensure units of various quantities are correct, we will not do
so.
In the above diagram, the rate of performance of work externally = pal|v1|
Rate of performance of work internally = k|SS'|l|vs|
because the only internal work assumed is work required to effect the shear deformation so that
ABCD is distorted into A'B'C'D'.
Hence equating these two quantities,
pal|v1| = k|SS'|l|vs|
and so if we set the magnitude of the initial velocity, v1, as unity, we find that
pa = k|SS'||vs|

C12 – 85 – C12
Simple vector algebra relates v1, v2, and vs, as on the diagram below:
v1
v2 vs
If, in a more general deformation process, we have n shear planes of the type SS'n on which the
shear velocities are vsn, we have
sn
n
n vkpa 'SS
The diagrams showing the relative velocities of the various parts of a deformation process are called
‘hodographs’.
Rules for constructing a hodograph
1. Label all regions of the model which move relative to each other.
2. Define an origin of the hodograph, corresponding to a stationary component of the system.
3. Draw the velocity vector of the unknown force, of unit length, on the hodograph.
4. Draw vectors in the known directions of the moving components, relative to the origin and
to each other on the hodograph.
5. Each vertex where these vectors intersect represents one (or more) of the labelled regions of
the model.
6. Velocity vectors must be oriented parallel to slip planes (conservation of matter).

C12 – 86 – C12
We are now in a position to analyse the constrained punch situation with a dead metal zone
immediately below the punch face using a suitable hodograph:
(b) punch constrained – upper bound solution
Q
Q' R S O
1
o
s
r
qq'
b
b/2
The above hodograph is labelled using Bow’s notation. This notation was originally developed for
trusses in the 19th century by Robert Henry Bow, FRSE (18321908). In Bow’s notation, the
spaces in and around a truss are labelled, rather than the joints. The notation is introduced on page
53 of the book ‘Economics of construction in relation to framed structures’ published by Bow in
1873. It turns out to be very useful for labelling hodographs. Of course, in the notation used here,
regions of metal are labelled, i.e. Q, Q' R, S and O, rather than the space in and around a truss.
Punch velocity = 1.0
Q and Q' move downwards at the same unit velocity. O is a stationary component of the system,
here the surrounding rigid metal.
oq and oq' are velocity vectors of unit magnitude defining the motion of particles in regions Q (the
punch) and Q' (the dead metal zone).
q'r is a vector defining the shear velocity parallel to the common line of shear between Q' and R. or
is the velocity of particles in region R, etc.
From the hodograph, we have for the magnitudes of the various velocities involved,
sin2
1rsos ,
sin
1rq' ,
sin
cos
tan
1or
b

C12 – 87 – C12
Using the rate of performance of work formula for the general case, we have

C12 – 88 – C12
(c) (i) frictionless sliding over punch face
Again, the punch width is b, but we need only consider half of the problem:
1
qr
O s
t
Q
R S T O
For this situation, in the absence of friction at the punch face (so that shear with energy dissipation
takes place on OR, RS, OS, ST and TO, but not QR), we also find:
cos sin
cos1
2
2
k
p
As before, oq = 1.0.
The material in R travels in the direction shown with a velocity or = 1/sin, etc.
From the hodograph,
or = rs = st = ot = sin
1
os = sin
cos2
qr =
sin
cos
tan
1
In the drawing of the indentation process,
QR = OS = 2
b
OR = RS = ST = OT = cos4
b
Using the rate of performance of work formula for the general case, we have

C12 – 89 – C12

C12 – 90 – C12
(c) (ii) frictional sliding over punch face
If there is friction at the face QR, we can take it to be sticking friction, so that there is a shear stress
k acting and the slippage velocity = qr.
In this case,

C12 – 91 – C12

C12 – 92 – C12
Examples of upper bound solutions for extrusion through a smooth die
Define extrusion ratio R = ratio of areas before and after extrusion
For plane strain,
h
H
A
AR
1
0
so that R = 4 corresponds to a 75% reduction in area, r.
(a) square die: sliding on die face
2/1min
)1(2/
R
Rkp
Extrusion ratio R (= H/h) 1.33 2 4 10
Reduction r 25% 50% 75% 90%
pmin/2k 2.02 2.12 2.50 3.48
ln R (ideal work formula estimate) 0.29 0.69 1.39 2.30
(b) square die: dead metal zone at 45°.
1122/2/1
min Rkp
Extrusion ratio R (= H/h) 1.33 2 4 10
Reduction r 25% 50% 75% 90%
pmin/2k 1.05 1.46 2.47 4.63
A
B
C
O
h /2
H /2
c a o
b
B C
O
h /2
H /2 A D
c a
o,d
b
45°
45°

C12 – 93 – C12
Extrusion through a smooth square die: models for extrusion pressure
0
0.5
1
1.5
2
2.5
3
3.5
4
4.5
5
1 2 3 4 5 6 7 8 9 10
Extrusion ratio, R
Pre
ssu
re, p
/2k
The formula
Rk
pln5.18.0
2
is an empirical formulae (p. 75) with the uniaxial yield stress Y = 2k using the Tresca yield criterion
allowing for redundant work which gives reasonably good estimates of the pressure required for
processes to function and is also useful for non-plane-strain problems.
The formula
Rk
pln
2
is the ideal work formula estimate with the uniaxial yield stress Y = 2k using the Tresca yield
criterion.
The mathematics behind the results quoted on page 92 for sliding on the die face and sliding on the
dead metal zone are shown in Appendix 2.
ln R
die face sliding
0.8 + 1.5 ln R
dead metal zone

C12 – 94 – C12
Examples of upper bound solutions for forging
(a) h >> b
b
(b) h > b
h/2
(c) h b
h
b
(d) h << b
h
b
b

C12 – 95 – C12
Models for forging pressure: upper bound solutions
Case (a): p/2k = 22
Case (b): p/2k = b
h
h
b
18
7
2
3
Case (c): p/2k =
b
h
h
b
2
1
Case (d): p/2k = 1 if there is no sticking friction
=
h
b
41 if there is sticking friction (upper bound solution)
These four solutions can be plotted as shown below:
The result for (d) with sticking friction is also true if we subject the region of thickness h to tension.
Hence, if there is no void formation under hydrostatic stress and there is perfect interface adhesion,
adhesive, brazed or soldered joints with plane strain geometry for b/h 100 can have much greater
tensile strengths than the bulk strength of the joining medium.
(a)
(b) (c)
0
0.5
1
1.5
2
2.5
3
3.5
4
0 1 2 3 4 5 6 7 8 9 10
h /b
Pre
ssu
re, p
/2k
(d) (no sticking friction)

C12 – 96 – C12
Case (d): Forging of a slab
The diagram below shows a rigid block deformation pattern for forging of a slab with b/h = 3.
h
b
p
p
From symmetry, it is apparent that we only need to examine one quarter of the deformation pattern,
such as the top left quarter. We only therefore need to draw the hodograph for this quarter.
We begin by labelling this quarter of the diagram and showing the relative movement of the various
parts of the slab being forged relative to a stationary reference point O in the laboratory reference
frame:
h
b
A B
C D
O
G
By symmetry, the central region A moves with the face of the forge, G. If there is no sticking
friction, shear only occurs along planes AB, BC and CD for the top left quarter of the deformation
pattern, so that the downward velocity of the faces of the forge and the central region, A, is one
third of the magnitude of the velocity at which material at D in the slab moves laterally after this
shearing process (since b = 3h).
The hodograph is straightforward:
d
c
b
a
o
45°
1.0
If we take the velocity of the die faces to be unity, then in the above hodograph |oa| = 1.

C12 – 97 – C12

C12 – 98 – C12
Forging with sticking friction
If we have sticking friction on the die faces, we need to take account of the work done shearing
material from the slab past the die faces.
For b/h = 3 for the top left hand quarter, this introduces an additional term in the formula for the
rate of performance of work to take into account shear of region C past the die face, G. We now
have

C12 – 99 – C12

C12 – 100 – C12
Slab analysis of forging with friction
An alternative analysis of forging to upper bound solutions via hodographs considers the diagram
below. The workpiece (slab) being forged is within two parallel lubricated dies. However, friction is
unavoidable between the slab and the dies, and needs to be taken into account in the analysis.
As before, we let the slab height be h and its width be b. There is a pressure distribution along the
die, p(x), to enable the slab to be forged. Plane strain conditions can be assumed, so that the strain
perpendicular to the page of the slab is zero.
x
x h
b
p(x)
In this analysis it is convenient to focus on the magnitudes of the pressure p(x) and the compressive
stress (x) in the slab. By symmetry we need only consider x > 0: the situation for x < 0 will be a
mirror in the line x = 0 of the situation for x > 0.
x
h
p(x)
(x)
x
(x)
p(x)
x + x
If we consider the equilibrium of an element of width x, height h and unit depth into the page at a
general position, x (> 0), as in the diagram above, we have:
01..21.. xxhx
C12 – 101 – C12
hx
x
2
d
d
i.e., the magnitude of the compressive stress x decreases from the centre of the slab to the edge at
x = b/2 where x is zero.
If the shear stress is small in comparison with the magnitudes of p and x at a position x, then, to a
good approximation, the principal stresses in the x-y plane at x are p and x.
Hence, in plane strain using the Tresca yield criterion, we have:
kYp x 2
where Y is the uniaxial yield stress and k is the shear yield stress, since in plane strain the third
principal stress at x coming out of the paper has then to be the mean of p and x.
Differentiating this equation with respect to x, we have
0d
d
d
d
d
d
x
Y
xx
p x
because the yield stress is position-independent for a material which is rigidperfect plastic, i.e.,
one which does not work harden. We can therefore rewrite the equation
hx
x
2
d
d
in the form
hx
p
2
d
d
We can now choose our friction law to integrate this equation. We will examine two cases, that of
Coulomb friction and the situation where friction scales with the shear yield stress, k.
Coulomb friction
If we choose Coulomb friction, = p, where is the coefficient of friction. Hence, we have
phx
p
2
d
d
which can be rearranged in the form
xhp
pd
2d
Integrating we have for x > 0,

C12 – 102 – C12
xh
p2
ln
where is a constant of integration. Clearly, for forging to occur, the slab has to (just) yield at the
edges of the slab, i.e., at x = b/2 if x > 0. Therefore, at x = b/2, p = Y = 2k, and so
2
22ln
b
hk
Hence, in general, for 0 < x < b/2,
2
22ln
2ln
b
hkx
hp
which can be rearranged in the form
x
b
hk
p
2
2exp
2
For b/2 < x < 0,
x
b
hk
p
2
2exp
2
so that at x = b/2, p = 2k.
We therefore have the result that the pressure varies exponentially across the slab – there is a
‘friction hill’ associated with friction between the dies and the slab:
x
b
pmin = 2k
p
pmax = 2k exp (b/h)

C12 – 103 – C12
Friction scaling with the shear yield stress
Under these circumstances, = mk where 0 < m < 1. If m = 1 we have sticking friction. Hence,
h
mk
x
p 2
d
d
and so
xh
mkp
2
where is a constant of integration. Since p = 2k at x = b/2,
2
22
b
h
mkk
and so, in general, for 0 < x < b/2,
x
b
h
m
k
p
21
2
For b/2 < x < 0, we have by symmetry,
x
b
h
m
k
p
21
2
and so in this case we have a linear ‘friction hill’ describing the pressure as a function of x across
the slab:
x
b
pmin = 2k
p
pmax = 2k(1+(mb/2h))

C12 – 104 – C12
The mean pressure, pAV, for 0 < x < b/2 is then

C12 – 105 – C12
Rolling loads and torques: analogy with forging
In rolling there is also a ‘friction hill’. The sense of the frictional force reverses along the arc of
contact, with a maximum pressure in the friction hill between the entrance point C and exit point D
of the rolling mill.
VIN
VOUT
C
D
At C, VIN < R, where R is the radius of each roller. At D, VOUT > R. The position where both the
rollers and the strip have the same speed is the ‘no slip’ point, where the pressure p on the strip is a
maximum:
Entry Exit
p/Y
1 a
Work hardening of the metal strip as it passes through the rollers means that the yield stress of the
strip on exit is higher than on entrance, as in the above schematic.
Since the total rolling load, P, across the arc of contact can be considered to be concentrated at the
no-slip point a distance a from the line joining the centre of the rollers, it follows that the two
rollers together supply a torque Q = 2Pa to enable the rolling operation to take place.
Applying a horizontal tension to the strip material being rolled can significantly reduce the rolling
load – this can be appreciated quite simply in a plane strain rolling situation using the Tresca yield
criterion.

C12 – 106 – C12
Finite Element Modelling (FEM)
Finite element modelling has nowadays superseded upper-bound and slip line field methods for
realistic, rather than idealised, metalforming processes.
It is a very powerful, but computationally intensive, technique. It can deal with complex geometries
and enables stress distributions, temperature distributions and operational parameters to be
specified.
However, to be able to use such programmes, you need to be able to understand the basics (e.g., to
check your computer predictions are reasonable!), which is what I have attempted to put across in
this course.
Example of FEM: The production of gudgeon pins (small lengths of tube)
Gudgeon pins are pins which hold a piston rod and a connecting rod together.
The production process consists of (i) upsetting1, in which the starting billet is compressed
(squashed) until it fills the die into which it has been put, (ii) indentation of the dumped billet to
guide the punch in the back extrusion operation, and finally (iii) backward extrusion of the indented
slug.
After this production process the base of the cup formed at the base of the die is punched out to
produce the gudgeon pin.
The process can be visualised very well with the help of the finite element (FE) mesh. The grid
distortions during the various process stages agree very well indeed with experimentally observed
distorted grids.
Initial FE mesh for the forming of a gudgeon pin
1 ‘Upsetting’ is the working of a piece of metal so that its length is shortened and its cross-sectional area is increased.

C12 – 107 – C12
(a) – (g) Predicted FE mesh distortions for the upsetting, indentation
and backward extrusion stages in the forming of a gudgeon pin.
(from G.W. Rowe, C.E.N. Sturgess, P. Hartley and I. Pillinger, Finite-element Plasticity and
Metalforming Analysis, CUP, 1991. Reproduced with permission from Cambridge University
Press.)

C12 – 108 – C12
Appendix 1: Mathematics of the modified von Mises yield criterion
In principal stress space, the modified von Mises criterion takes the form
2H02
132
322
21 6 k
where the orthogonal principal stresses are 1, 2 and 3, is a dimensionless pressure coefficient,
k0 is the shear yield stress at zero hydrostatic pressure and
321H3
1
is a hydrostatic stress. The shape of this modified von Mises criterion is that of a circular sectional
cone with its axis along 1 = 2 = 3.
To appreciate why this the shape of this yield surface in principal stress space, it is convenient to
transform to a set of orthogonal axes i, j and k where k is along the axis of the cone and i and j are
perpendicular to this., e.g.,
'3
1'
3
1'
3
1
'6
2'
6
1'
6
1
'2
1'
2
1
kjik
kjij
jii
where i', j' and k' are unit lengths along the 1, 2 and 3 axes respectively. A vector [x, y, z]
referred to axes i, j and k is related to the description [1, 2, 3] in the axis system i', j' and k'
through the equation
z
y
x
3
1
6
20
3
1
6
1
2
13
1
6
1
2
1
3
2
1
(see, for example, Kelly and Knowles, Crystallography and Crystal Defects, Appendix 4), and
conversely,
3
2
1
3
1
3
1
3
16
2
6
1
6
1
02
1
2
1
z
y
x

C12 – 109 – C12
Hence,
yx
yx
x
6
3
2
1
6
3
2
1
2
32
31
21
z 3321
and so the modified von Mises criterion becomes
2
0
22
2 3
66
3
26
3
22
zk
yxyxx
i.e.,
2
022
3
2
zkyx
If = 0, the surface becomes
20
22 2kyx
i.e., independent of z. Hence, as an aside, we have shown that the von Mises yield criterion is a
cylinder along the z axis with a radius of 2 k0.
Returning to the modified von Mises criterion for 0, it is apparent from the right hand side of
the equation in the above box that the radius of the cylinder is a function of z.
When 3/ 0 zk we have a point. Either side of this the locus of the equation is a cone (although
we can ignore one of these cones as being unphysical by only considering solutions for which
3/ 0 zk .
Suppose z = z0 at the point. The modified von Mises yield criterion then becomes
2
0
20
22
z 1 2
zkyx
and so the semi-angle of the cone, , is then defined by the equation
3
22tan
0
0
z
k

C12 – 110 – C12
The modified von Mises criterion in plane stress
In plane stress (e.g., if 3 = 0), the modified von Mises criterion becomes
2
2102
12
22
213
6
k
i.e.,
2
210212
22
13
3
k
If we transform the modified von Mises yield criterion to X- and Y-axes at 45° to the 1 and 2 axes,
a coordinate position (1, 2) will be transformed into a coordinate position (X, Y) so that
Y
X
45cos45sin
45sin45cos
2
1
i.e.,
YX
YX
2
1
2
1
2
1
Hence substituting into the equation
2
210212
22
13
3
k
we have
2
022
3
2 3
2
1
2
1
2
1
XkYXYXYXYX
i.e.,
2
0
22
3
2 3
2
3
2
Xk
YX

C12 – 111 – C12
that is,
XkXk
YX0
22
20
22
3
22
9
2 3
2
3
2
Rearranging this, we have
32
322
3
2
2
1
20
2
0
22 k
YXkX
[1]
This can be manipulated to be in the form
1
2
2
2
2
b
Y
a
PX [2]
i.e., an ellipse centred at (P, 0) with major and minor axes a and b respectively, as in the schematic
on page 40.
[Note that when = 0 the surface is simply
126
20
2
20
2
k
Y
k
X
which describes an ellipse centred at the origin (0, 0) with a major axis 6 k0 and a minor axis
2 k0, i.e., an ellipse where the ratio of the major axis to the minor axis is 3 : 1]
Returning to equation [2], this is an equation of the form
22222222 2 PabYaPXbbX [3]
where each term has been multiplied by a constant , to be evaluated.
Comparing [1] and [3], it is apparent that we have four equations for the four unknowns a, b, and
P:
20
222
2
02
22
3
2
3
2
3
2
2
1
kPab
a
kPb
b

C12 – 112 – C12
Hence,
202
20
22
22
2
2
0
3
3
2
2
1
2
3
2
2
1
2
3
3
2
2
1
1
2
3
3
2
2
1
2
kk
b
a
kP
Rearranging the last equation, we have:
20
220
22
02
02
22
22
3
3
2
2
132
3
2
2
1
2
3kkkk
whence
22
20
22
20
3
41
4
1
3
2
2
11
kk
and so
3
41
22
3
41
2
3
41
6
2
3
2
0
2/12
0
2
0
kP
kb
ka

C12 – 113 – C12
Appendix 2: Upper bounds solutions for extrusion
Square die sliding: the mathematics behind the equation for pmin
To analyse this situation it is convenient to define angle ocb in the hodograph as and the angle oab
as . Thus the plane of shear between B and C makes an angle with the horizontal extrusion axis,
and the plane of shear between A and B makes an angle with the horizontal extrusion axis.
Let oa be a velocity vector of unit magnitude in the hodograph, i.e., oa = 1. Hence,
R
oc and
sin
tanbc ,
cos
1ab ,tanob
where R is the extrusion ratio, = H/h.
From the above diagram of the extrusion process it follows that
tan
tan so and ,
tan2tan2 h
HR
Hh
Applying the general formula
sn
n
n vkpa 'SS
we then have
BC.bcAB.ab2
kH
p
where AB is the length of the line dividing regions A and B and BC is the length of line dividing
regions B and C in the diagram of the extrusion operation.
A
B
C
O
h /2
H /2
c a o
b

C12 – 114 – C12
Now,
sin2BC and
sin2AB
HH
and so
sin
tan.
2sincos
1.
2sin2
hHk
Hp
sin
tan.
2sincos
1.
2sin
HHk
substituting for h tan. Hence,
cossin
1
cossin
1kp
Now,
tan
1tan
tan
1tan
cossin
cossin
cossin
1 22
RR
and likewise
tan
1tan
cossin
1
whence
tan
1tan1
RRkp
To obtain the lowest value of p, pmin, we minimise this function with respect to tan . If we let tan
= x, then
Rx
xRkp1
1
and so the function is a minimum when R x2 = 1. Hence,
R
R
k
p 1
2
min
for this model of extrusion in which there is sliding on the die face.

C12 – 115 – C12
Dead metal zone at 45°: the mathematics behind the equation for pmin
Mathematically, this is more complicated than the situation in which there is sliding on the die face.
In the hodograph, it is convenient to define angle ocb in the hodograph as and angle cab as , as
shown. By definition, angle aob is 45°. R = H/h is the extrusion ratio.
Applying the general formula
sn
n
n vkpa 'SS
we then have
BC.bcDB.dbAB.ab2
kH
p
where AB is the length of the line dividing regions A and B, DB is the length of line dividing
regions D and B and BC is the length of line dividing regions B and C in the diagram above of the
extrusion operation.
Now,
sin2
BC and 2
1DB ,
sin2AB
hhH
H
In the hodograph, op = 1 and or = R, the extrusion ratio, i.e., voa = 1 and voc = R. From triangle opq
we have, using the sine rule,
cossin
1ab so and ,
45sin
1
45sin
ab
Likewise,
cossin
sin2db so and ,
45sin
1
180sin
db
Finally, in triangle abc, we find
sin
1.
cossin
sinbc so and ,
sin
bc
sin
ab
B C
O
h /2
H /2 A D
c a
o,d
b
45°
45°

C12 – 116 – C12
Hence, noting that R = H/h = (H/2)/(h/2), we can substitute in the equation for p:
2sin
1
cossin
sin
cossin
sin22
sincossin
1.
RR.kpR
We can eliminate from this expression by observing from the diagram of the extrusion operation
that
cot1cot i.e., ,22tan2tan2
RRhHHh
and so
cot)1(2cot21 cot 2222 RRRRR
and we know from trigonometry that
2
22
sin
1 cosec cot1
Therefore,
cot)1(222sin
cot)1(222cot sin
12
2222
2RRR
RRRRRR
Hence,
cot)1(222
sin22 sin
sin cosin 2
2
RRRR
RR
s
kpR
cot)1(2
sinsin
sincossin 2
2
RRRRk
cos12
sin
1
cossinR
RkR
i.e.,
cos12
sin
1
cossin2
1
2R
R
k
p
and to find the minimum value of p, we have to minimise the right-hand side with respect to by
setting the derivative of the right-hand side with respect to to zero.

C12 – 117 – C12
Now,
d
d
d
d1
d
d2
v
v
uu
vv
u
and so the condition is
0sincos cos12sin
1cossin sin12cos
sin
)1(2
R
RR
R
Multiplying this out,
01sin
cos
sin
cos
sin
cos )1( cossincos cossinsin 12
2
222
RR
Tidying this up,
01 cot cot2)1(12 2 RR
or
01
3 cot2 cot 2
R
R
whence
1
21
1
)3(11 cot
RR
R
However, we want a value of > 45 from the diagram on page 115, and so we are looking for
solutions where cot < 1. Hence, the solution we require to determine minp depends on the
condition
1
21 cot
R
Returning to our initial equation,
cos12
sin
1
cossin2
1
2R
R
k
p
It can be rearranged conveniently in the form

C12 – 118 – C12
cot1)cot1(
2
1
cot1
1
2
2 RR
k
p
Substituting the condition
1
3 cot2 cot 2
R
R
we have:
cot1
1
3cot21
2
1
cot1
1
2
min RR
RR
k
p
11 cot
2
3
2
1
cot1
1RR
RR
cot22
cot1
1
Substituting the condition
1
21 cot
R
we obtain the result
1122
min Rk
p

C12QS1 PART II MATERIALS SCIENCE C12QS1
Course C12: Plasticity and Deformation Processing
KMK/MT14
Question Sheet 1
1. The relative displacement tensor, eij, associated with slip on a single slip system is given by
eij = nji
where is the shear strain angle (assumed to be small), n is a unit vector normal to the slip
plane and is a unit vector in the slip direction.
Write down the components of the strain tensor, ij, associated with the deformation.
Lead sulphide, PbS (galena), is cubic holosymmetric (i.e., it has the maximum point group
symmetry associated with cubic crystals) and slips on <011>{100}, even though it has the
rock salt structure. Write down strain tensors corresponding to slip on the six physically
distinct slip systems. How many of these slip systems are independent? What can you deduce
about the ductility of PbS?
2. The state of stress imposed on a metal is defined by the principal stress tensor
00
00
00
3
2
1
ij
Using suitable equations from the Tensor Properties course (C4), determine the magnitude of
the shear stress on the )1 1 1( plane. Show that this is the same as the magnitude of the shear
stress on the (111), )1 1 1( and )1 1 1( planes.
Prove that yielding according to the von Mises criterion occurs when:
(i) the magnitudes of the shear stresses on each of the octahedral {111} planes reaches a
critical value, C1, and
(ii) the quadratic invariant, J2, of the deviatoric stress tensor derived from ij reaches a
critical value, C2.
Determine the values of C1 and C2 in terms of the uniaxial yield stress, Y, of the metal.
3. The yield stress of an aluminium alloy in uniaxial tension is 320 MPa. The same alloy also
yields under the combined stress state
MPa
15000
07095
095330
ij
Is the behaviour of this alloy better described by the von Mises or the Tresca yield criterion?
At what stress would the material yield in plane strain compression?
C12QS1 – 2 – C12QS1
4. Determine the ratio of the lengths of the major and minor axes of the ellipse specifying the
form of the yield surface for the von Mises yield criterion in plane stress for isotropic metallic
materials.
A thin isotropic sheet of metal is subjected to biaxial tension with 1 0, 2 0 and 3 = 0.
The sheet obeys the von Mises yield condition. Show that the vector sum of the principal
plastic strains in the plane of the sheet, 1 and 2, is normal to the yield locus at (1, 2).
The principal plastic strains in the plane of a particular isotropic sheet subjected to biaxial
tension are found to be 2 = 1/3. Determine the stress ratio 1/2 and the magnitude of
the third principal plastic strain, 3. Show that the vector sum of 1, 2 and 3 is normal to
the yield locus at this value of 1/2.
5. Poly(methylmethacrylate) (PMMA) obeys a yield criterion of the modified von Mises type, in
which the shear yield stress k depends on the hydrostatic stress, 3213
1H , in
such a way that
k = 72 0.4 H MPa
Specify the forms of the yield surface for PMMA (i) in principal stress space and (ii) for plane
stress.
A tube of PMMA with mean radius 50 mm and wall thickness 2 mm is subjected to internal
pressure. Show that the tube will yield when the internal pressure is increased to 4.1 MPa.
6. (a) A fully annealed isotropic sheet of Ti6Al4V is subjected to the following stress state:
MPa
40000
0200300
0300700
ij
Use the von Mises yield criterion to determine if yielding will occur if the uniaxial yield stress
of this material is 950 MPa. Would yielding be expected on the Tresca yield criterion?
(b) For anisotropic materials, the von Mises yield criterion can be modified as follows:
12
212
132
32 HGF
where the constants F, G and H define the degree of anisotropy. F, G and H are calculated
from the uniaxial yield stresses X, Y and Z corresponding to the principal 1, 2 and 3 directions
respectively using the formulae
2
1
XHG
2
1
YFH
2
1
ZGF
If X = Z = 925 MPa and Y = 1020 MPa for cold rolled Ti6Al4V sheet, with the principal
stresses of the stress state in (a) defined so that 1 > 2 > 3, determine whether or not
yielding occurs for the stress state described in (a).

C12QS1 – 3 – C12QS1
7. The radial and tangential principal stresses (r and ) in the wall at a distance r from the axis
in a thick-walled tube of internal radius a and external radius b, subjected to an internal
hydrostatic pressure P, are given for elastic behaviour by
Pr
b
ab
a
Pr
b
ab
ar
2
2
22
2
2
2
22
2
1
1
For such a tube, closed at both ends by plugs attached to the tube, the axial stress can be
assumed to be independent of r. By balancing the total axial force in the wall with the force
exerted by the pressure on the end-plugs, derive an expression forz and show that
z = (r + )/2.
A steel tube with b/a = 2 is internally pressurised to a pressure of 300 MPa. Its external
diameter is found to have increased by 0.08% and its length by 0.02%. When the internal
pressure is removed, the tube reverts to its original dimensions. Show that the Young’s
modulus for the steel is 214.3 GPa and the Poisson’s ratio is 0.286.
As the internal pressure is further increased, part of the tube will eventually yield. Where does
yield first occur? For a steel which obeys Tresca’s criterion and has a tensile yield stress of
1000 MPa, show that the internal pressure required to cause yield is 375 MPa.
8. A soil is found to obey the MohrCoulomb failure criterion
= * n tan
where and n are the shear stress and the normal tensile stress on the plane on which failure
take place, * = 18 kPa and =34.6°. It is found to slip when subjected to a shear stress of
50 kPa along the slip plane.
Show that the normal stress on the slip plane is 46.39 kPa and that the maximum and
minimum principal compressive stresses acting on the soil are 141.62 kPa and 20.14 kPa
respectively.


C12QS2 PART II MATERIALS SCIENCE C12QS2
Course C12: Plasticity and Deformation Processing
KMK/MT14
Question Sheet 2
1. A thin-walled pressure vessel is made from a low alloy steel with a uniaxial yield stress of
500 MPa, Young’s modulus of 210 GPa and Poisson’s ratio of 0.3. A 45° strain gauge rosette
of three rosettes is attached at a critical point in the structure. When the vessel is pressurised
to 5 MPa, the three gauges read
ε0 = 300 106
, ε45 = 120 106
, ε90 = 100 106
Suppose that the principal strains in the surface are ε1 and ε2 where ε1 > ε2 and let the ‘0’
strain gauge make an angle of with the direction of ε1.
Using a Mohr’s circle construction, express the strains read on the strain gauges in terms of
suitable functions of ε1, ε2 and .
Show that the centre of the Mohr’s circle is defined by the strain
0 90
2
Show that
900
45900 22tan
Calculate the principal strains ε1 and ε2 at this point in the structure.
Hence show that the principal stresses at this point in the structure are 80.69 MPa and
39.31 MPa.
Assuming that the steel yields and that the through-thickness stress is zero, determine the
pressure that would cause yielding at this point in the structure according to the von Mises
yield criterion.
2. Explain clearly why Lüders bands seen on sheet steel subjected to uniaxial tension form at an
angle of 54.7° to the tensile axis.
A specimen of sheet steel is tested in unequal biaxial tension, and Lüders bands form at 60° to
one of the tensile axes. What is the ratio between the two principal stresses in the plane of the
sheet? If the greater of these two principal stresses is 500 MPa and the steel obeys the von
Mises yield criterion, show that the yield stress in uniaxial tension is 458 MPa.

C12QS2 – 2 – C12QS2
3. What is meant by the efficiency of a deformation process? If the deformation is adiabatic
(i.e., with no heat loss to the atmosphere or to the tooling), estimate the temperature rise that
will result from extrusion of the materials in the table below, for an extrusion ratio of 3.
Assume the efficiency of the extrusion process is 40% and that 95% of the work done in the
process is converted to heat.
Material Density
(Mg m3
)
Specific heat
(J kg1
K1
)
Uniaxial yield stress
(MPa)
Aluminium 2.7 900 100
Copper 9.0 385 150
Mild steel 7.9 450 300
4. Use a work formula approach, show that the minimum pressure required to extrude
aluminium curtain rail of I-section, 12 mm high with 6 mm wide flanges, all 1.6 mm thick,
from 25 mm circular diameter bar stock, as shown in the diagram below, is 404 MPa.
1.6 mm
1.6 mm
1.6 mm
6 mm
12 mm
Suggest a more realistic estimate using a suitable empirical formula for the extrusion pressure
of extruded material.
[The mean uniaxial yield stress for aluminium for heavy deformation at room temperature is
150 MPa].

C12QS2 – 3 – C12QS2
5. The slip-line field solution for the plane-strain indentation of a semi-infinite block of isotropic
material by a flat frictionless punch of width 2a, in which there is frictionless sliding over the
punch face, is shown in the diagram below. The four right-angled triangles are identical in
shape with angles of 45°, 45° and 90°. Show that this solution predicts that the pressure, P,
required to cause indentation in terms of the shear yield stress, k, of the material being
indented, is given by the expression
57.22
12
k
P
2a
P
45°
A possible deformation pattern to determine an upper bound solution for P is shown in the
diagram below. The triangles shown are all equilateral triangles. From this deformation
pattern show that an upper bound to P is given by the expression
887.23
5
2
k
P
2a
P

C12QS2 – 4 – C12QS2
6. Half of a possible deformation pattern for the direct plane-strain extrusion of a metal slab is
shown in the diagram below. The slab is initially 40 mm thick. It passes through a
symmetrical 45° tapering die, with an extrusion ratio of 2. A, B, C and D are points on the
diagram. The angles BCD and CBD are both 45°. The distance AB is 15 mm. The width of
the slab is 100 mm and its yield stress in pure shear is 150 MPa. Arrows indicate the direction
of movement of material in each region.
Show that upper bounds to the extrusion force F acting on the slab are
(i) 1.2 MN if the extrusion process is frictionless, and
(ii) 2.25 MN if sticking friction acts both on the die face BD and also on the wall of the
die AB.
Compare your answers to (i) and (ii) with a simple work-formula estimate and comment on
the reasons for any differences.
The same reduction in thickness could be achieved by indirect extrusion, as shown in the
above diagram. Again, half the deformation pattern is shown and the arrows indicate the
direction of movement of material as the plunger is moved into the metal. The metal not
deforming plastically can be regarded as ‘dead metal’, relative to which the plastically
deforming metal has to shear, as shown.
For this case, show that upper bounds to the extrusion force are
(iii) 1.2 MN if the extrusion process is frictionless, and
(iv) 1.8 MN if sticking friction acts on the plunger face and within the billet container.
Hence comment on the possible advantages of indirect extrusion over direct extrusion.
10 mm
D
C
B A
F/2
F/2
10 mm
Dead
metal
zone
Removable
backing
plate

C12QS2 – 5 – C12QS2
7. A possible deformation mode for the plane strain compression of a rigid-plastic plate,
thickness h and length L between rough parallel platens is shown in the figure below.
p
h
p
L
Draw the corresponding hodograph and hence show that an upper bound to the pressure p on
the platens needed to cause yielding in the plate is given by:
h
L
L
h
k
p
2
1
2
An alternative deformation mode is proposed using a different upper bound field for the same
values of h and L, with the width of the dead metal cap at the centre of the plate defined as w:
p
h
p
L
w
Show that, for this deformation mode,
h
w
hL
w
h
L
L
h
k
p
2222
3
2
2
For fixed h and L, determine the value of w for which p is a minimum in (b). At this value of
w, for what ratios of L/h would the alternative deformation mode predict a lower value of p
than the original deformation mode considered?

C12QS2 – 6 – C12QS2
8. A long rectangular slab of width b and height h is forged under plane strain conditions
between two open parallel dies, as in the diagram below. Friction exists between the slab and
each die face. The slab of material can be assumed to be an ideal isotropic rigid-plastic
material, i.e., one which is rigid prior to the onset of plastic deformation and does not work
harden once yield has occurred.
x
x h
b
p(x)
Show that the frictional stress between each die and the slab, x , is given by the equation
h
x
x
x
2
d
d
where x is the horizontal stress at x.
If the slab obeys the von Mises yield criterion and Coulomb friction occurs so that
xpx
where is the coefficient of friction, show using a Mohr’s circle that, for sufficiently small
x and xp are, to a very good approximation, the principal stresses in the x-y plane at
x.
Hence show that, under these circumstances, for 0 < x < b/2,
x
b
hk
xp
2
2exp
2
where k is the shear yield stress. Sketch the variation of xp for –b/2 x b/2.
Calculate the average die pressure needed to forge a bar of an aluminium alloy with a uniaxial
yield stress of 90 MPa, width 16 cm, height 2 cm and length 50 cm under plane strain
conditions if = 0.2.
What is the minimum average die pressure that could be attained if 0?


