
C-MORE Schofield Lecture 2
75
HOT D A YS ALONG THE WEST ANT ARCTIC PENI NSUL A Monday, July 2, 12
Transcript of C-MORE Schofield Lecture 2
7/31/2019 C-MORE Schofield Lecture 2
http://slidepdf.com/reader/full/c-more-schofield-lecture-2 1/75
HOT DAYS ALONG THE WEST ANTARCTIC PEN
Monday, July 2, 12

7/31/2019 C-MORE Schofield Lecture 2
http://slidepdf.com/reader/full/c-more-schofield-lecture-2 2/75
Current team
PI Hugh Ducklow (MBL)Bacteria-Biogeochemistry
Oscar Schofield (Rutgers) - Phytoplankton
Doug Martinson (LDEO) - Ocean PhysicsDebbie Steinberg (VIMS) - Zooplankton
Bill Fraser (Polar Associates)- Penguins & Fish
Scott Doney (WHOI)- Ocean Modeling
Sharon Stammerjohn (UCSC)
- Climate and Ice
Karen Baker (Scripps)- Data management
& Informatics
Beth Simmons (Scripps)- Education &
Outreach
Our Current g
Acknowledgements to past LTE
Barbara Prezelin, Robin Ross, Langdon QueVernet, Eileen Hoffman, John Klinck
The Boss!
Monday, July 2, 12

7/31/2019 C-MORE Schofield Lecture 2
http://slidepdf.com/reader/full/c-more-schofield-lecture-2 3/75
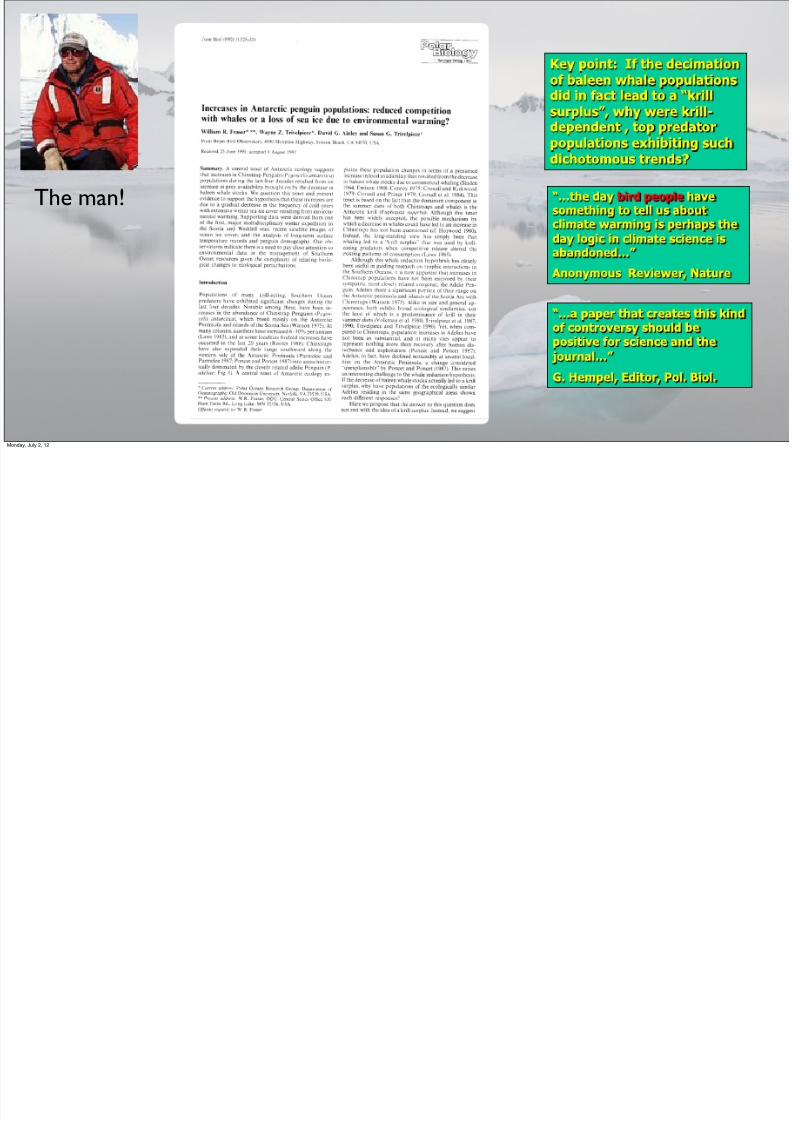
The man!
Monday, July 2, 12
7/31/2019 C-MORE Schofield Lecture 2
http://slidepdf.com/reader/full/c-more-schofield-lecture-2 4/75
The man!
Monday, July 2, 12
7/31/2019 C-MORE Schofield Lecture 2
http://slidepdf.com/reader/full/c-more-schofield-lecture-2 5/75
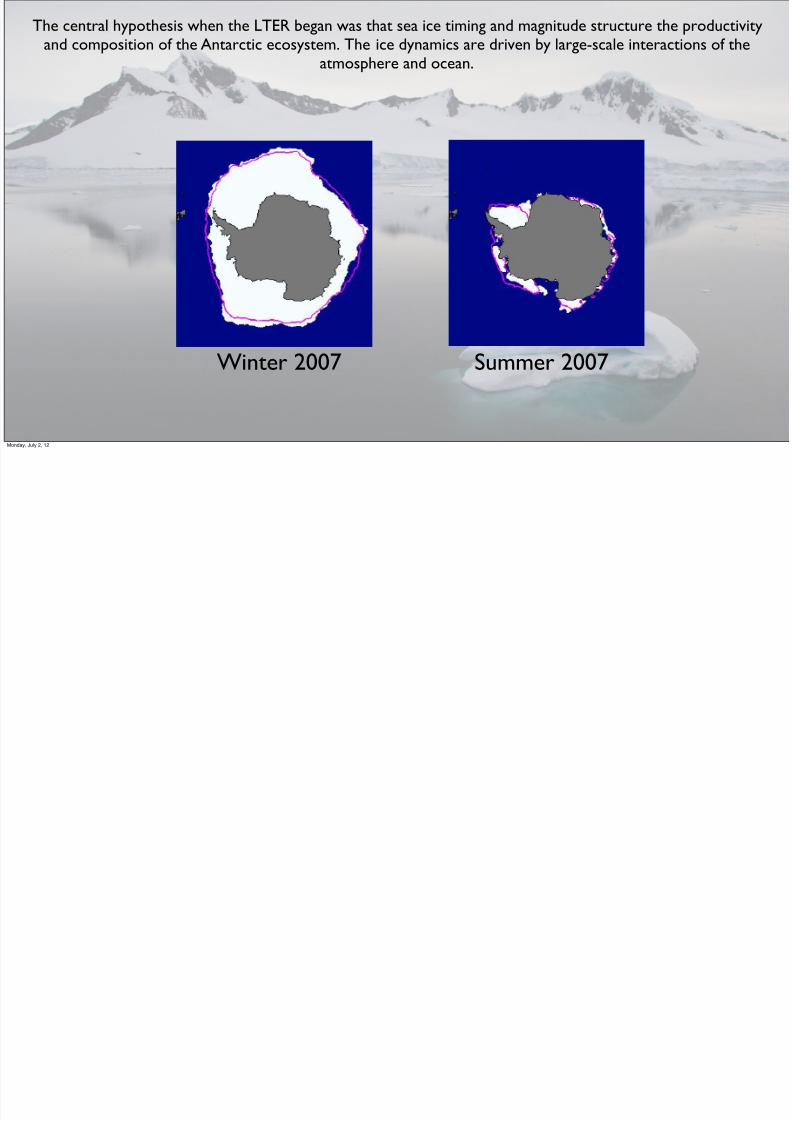
Winter 2007 Summer 2007
The central hypothesis when the LTER began was that sea ice timing and magnitude structurand composition of the Antarctic ecosystem. The ice dynamics are driven by large-scale int
atmosphere and ocean.
Monday, July 2, 12
7/31/2019 C-MORE Schofield Lecture 2
http://slidepdf.com/reader/full/c-more-schofield-lecture-2 6/75
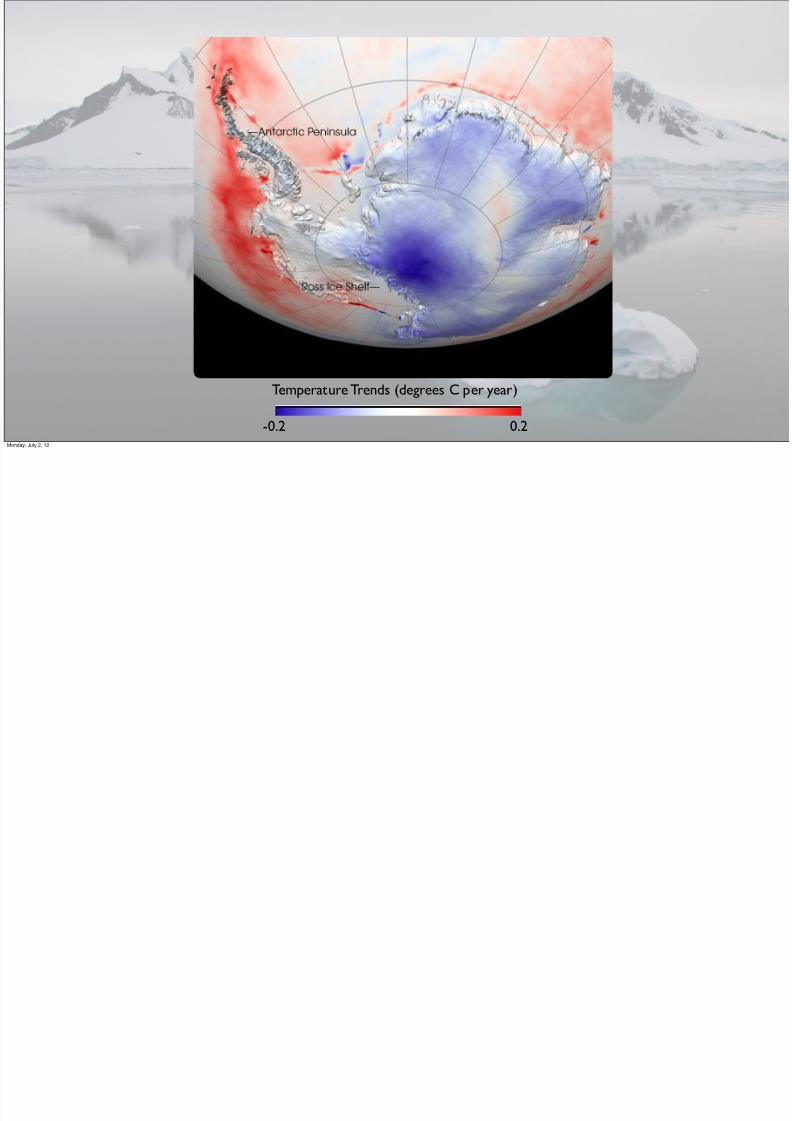
Temperature Trends (degrees C per year)
-0.2 0.2Monday, July 2, 12

7/31/2019 C-MORE Schofield Lecture 2
http://slidepdf.com/reader/full/c-more-schofield-lecture-2 7/75
The WAP peninsula is experiencing the largest winter warming
Black is British Faraday & Ukraine Vernadsky StationRed is US Palmer Station
Mean Winter TemperaturesSea ice duratio
Air temperatureincreases over the
peninsula
Monday, July 2, 12

7/31/2019 C-MORE Schofield Lecture 2
http://slidepdf.com/reader/full/c-more-schofield-lecture-2 8/75
The WAP peninsula is experiencing the largest winter warming
Monday, July 2, 12

7/31/2019 C-MORE Schofield Lecture 2
http://slidepdf.com/reader/full/c-more-schofield-lecture-2 9/75
Larson-B ice shelf after its collapseThanks to BAS & A. Clarke
The WAP peninsula is experiencing the largest winter warming
Monday, July 2, 12
7/31/2019 C-MORE Schofield Lecture 2
http://slidepdf.com/reader/full/c-more-schofield-lecture-2 10/75
!4.00%
!3.00%
!2.00%
!1.00%
0.00
1.00
2.00
3.00
4.00
4.00
4.50
5.00
5.50
6.00
6.50
7.00
7.50
8.00
1950 1960 1970 1980 1990 2000 2010 2020
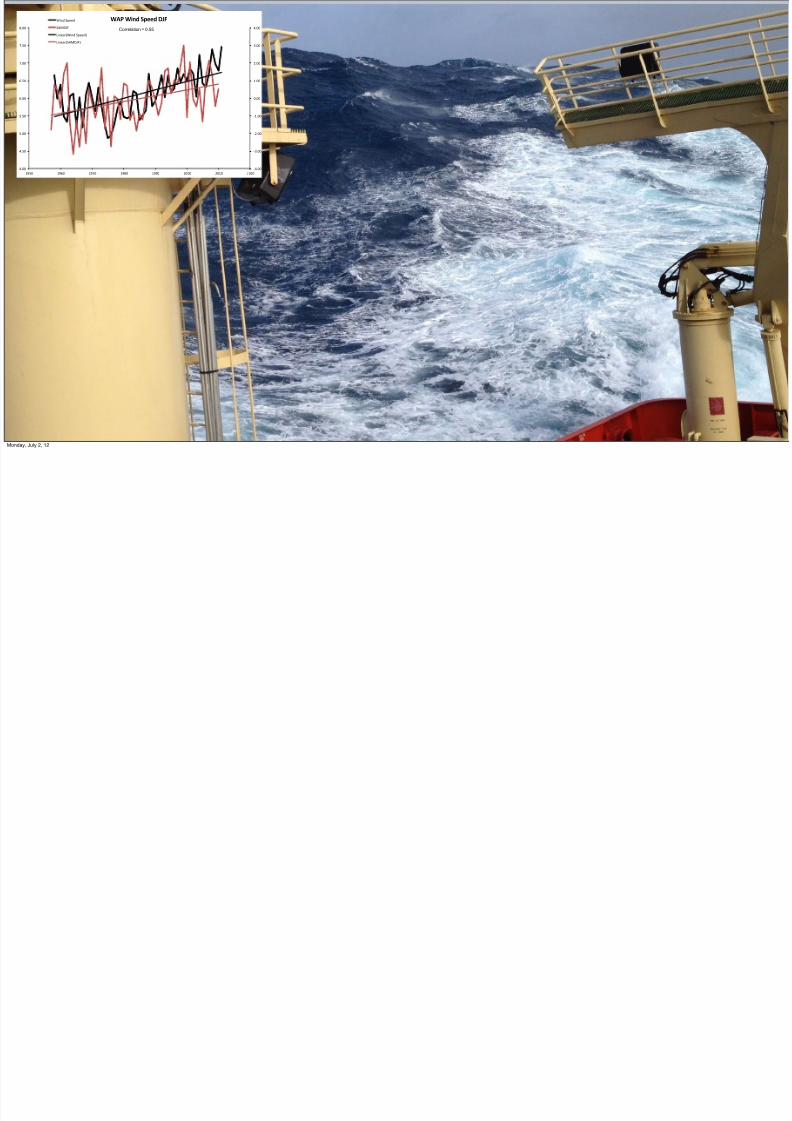
WAP$Wind$Speed$DJF$Wind%Speed%
SAMDJF
Linear(Wind%Speed)
Linear(SAMDJF)
Correlation = 0.55
Monday, July 2, 12
7/31/2019 C-MORE Schofield Lecture 2
http://slidepdf.com/reader/full/c-more-schofield-lecture-2 11/75
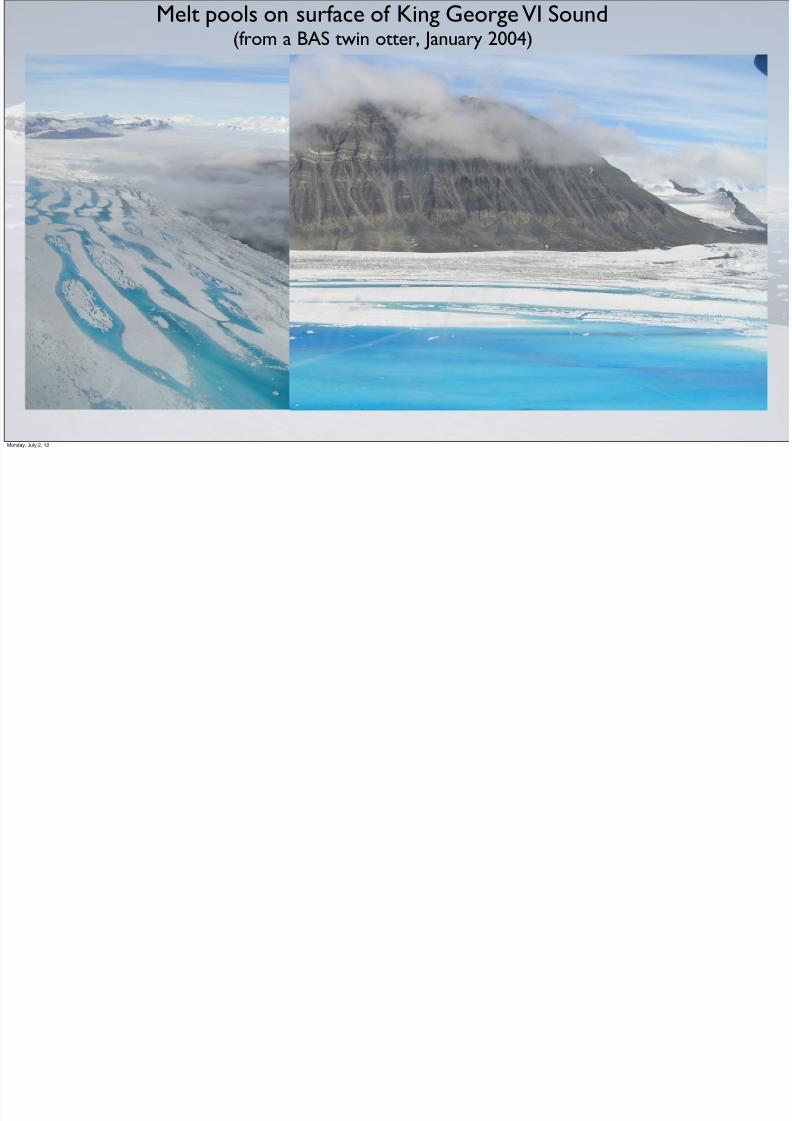
Melt pools on surface of King George VI Sound(from a BAS twin otter, January 2004)
Monday, July 2, 12

7/31/2019 C-MORE Schofield Lecture 2
http://slidepdf.com/reader/full/c-more-schofield-lecture-2 12/75
Y e a r
1 9 8 0
2 0 0 0
M a y 1
F e b 1
5% I c e c o v e r
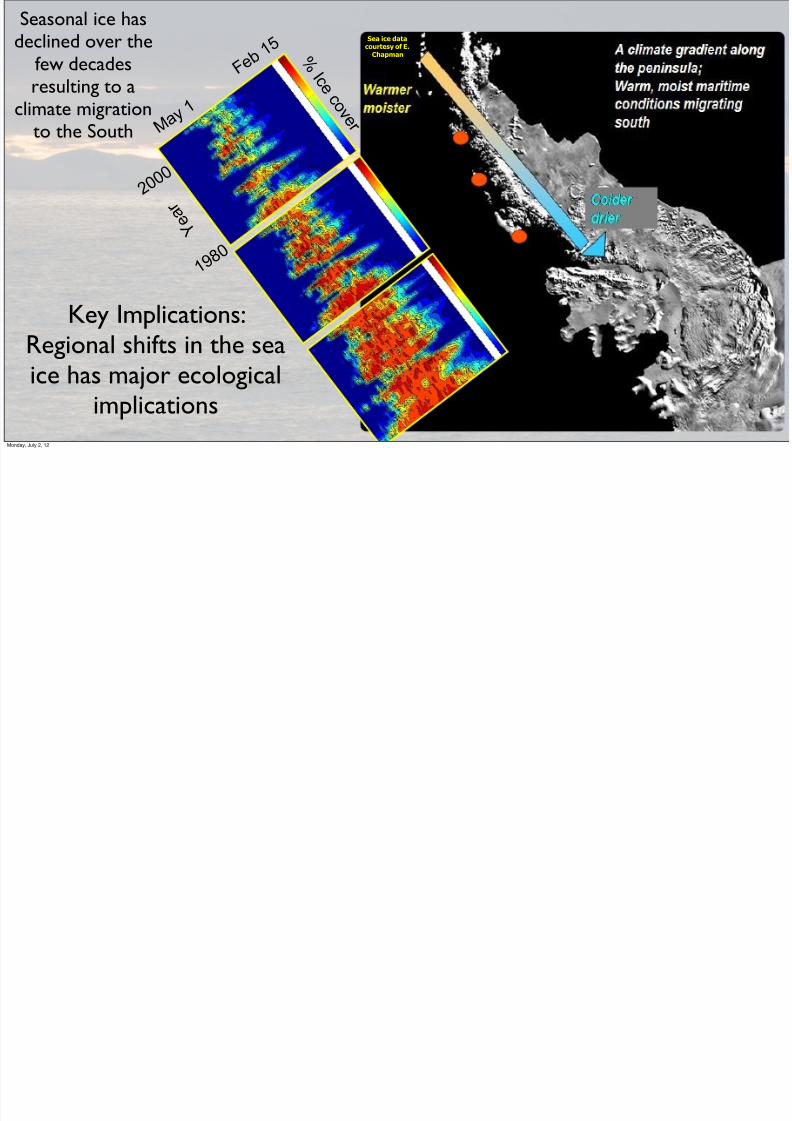
Seasonal ice hasdeclined over the
few decadesresulting to a
climate migration
to the South
Sea ice dataSea ice data
courtesy of E.courtesy of E.
ChapmanChapman
Monday, July 2, 12
7/31/2019 C-MORE Schofield Lecture 2
http://slidepdf.com/reader/full/c-more-schofield-lecture-2 13/75
Y e a r
1 9 8 0
2 0 0 0
M a y 1
F e b 1
5% I c e c o v e r
Seasonal ice hasdeclined over the
few decadesresulting to a
climate migration
to the South
Sea ice dataSea ice data
courtesy of E.courtesy of E.
ChapmanChapman
Key Implications:Regional shifts in the seaice has major ecological
implicationsMonday, July 2, 12

7/31/2019 C-MORE Schofield Lecture 2
http://slidepdf.com/reader/full/c-more-schofield-lecture-2 14/75
1990
As a grad studentMonday, July 2, 12

7/31/2019 C-MORE Schofield Lecture 2
http://slidepdf.com/reader/full/c-more-schofield-lecture-2 15/75Monday, July 2, 12
7/31/2019 C-MORE Schofield Lecture 2
http://slidepdf.com/reader/full/c-more-schofield-lecture-2 16/75
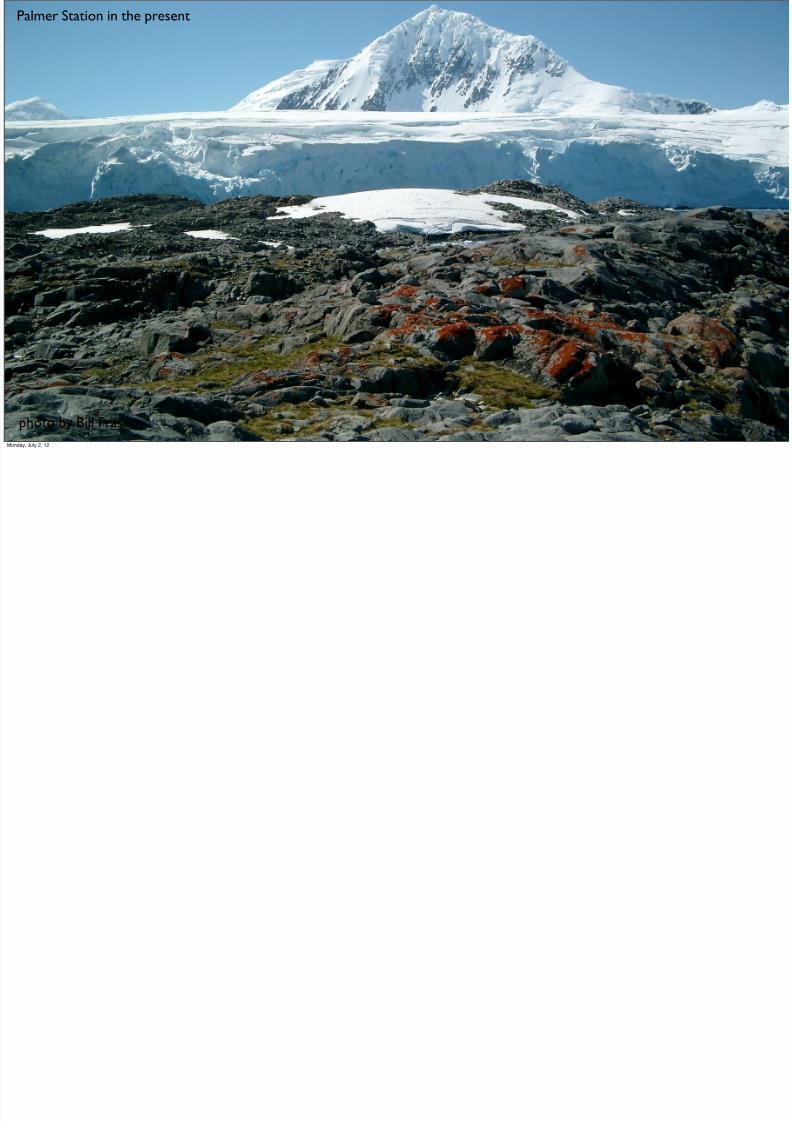
Palmer Station in the present
photo by Bill Fraser
Monday, July 2, 12

7/31/2019 C-MORE Schofield Lecture 2
http://slidepdf.com/reader/full/c-more-schofield-lecture-2 17/75
Plants at Palmer Stathe greening of Anta
Monday, July 2, 12
7/31/2019 C-MORE Schofield Lecture 2
http://slidepdf.com/reader/full/c-more-schofield-lecture-2 18/75
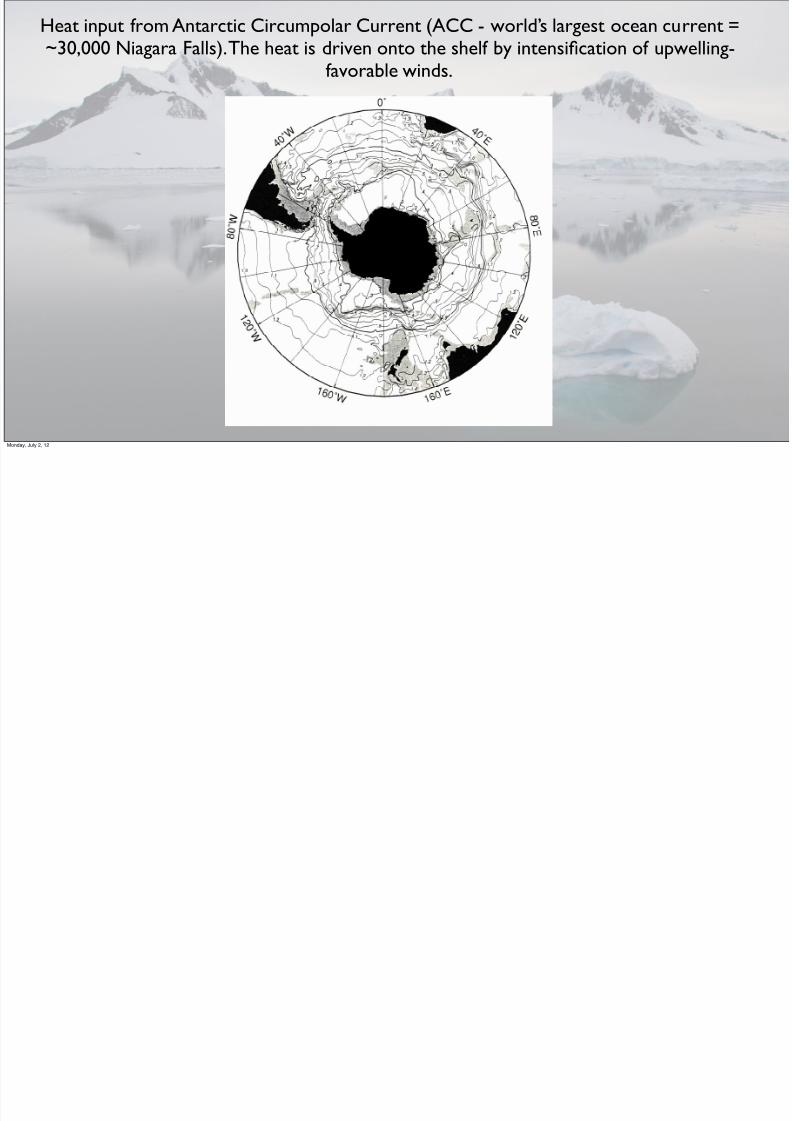
Heat input from Antarctic Circumpolar Current (ACC - world’s largest ocea~30,000 Niagara Falls). The heat is driven onto the shelf by intensification of
favorable winds.
Monday, July 2, 12
7/31/2019 C-MORE Schofield Lecture 2
http://slidepdf.com/reader/full/c-more-schofield-lecture-2 19/75
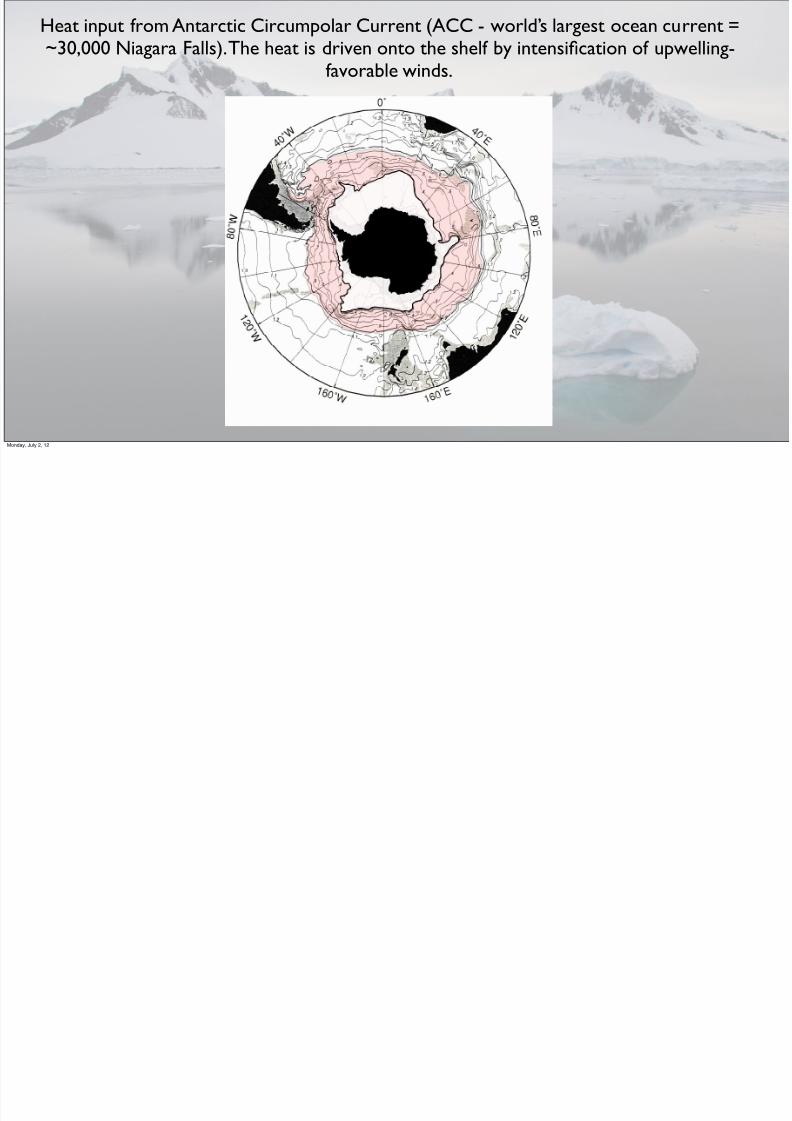
Heat input from Antarctic Circumpolar Current (ACC - world’s largest ocea~30,000 Niagara Falls). The heat is driven onto the shelf by intensification of
favorable winds.
Monday, July 2, 12

7/31/2019 C-MORE Schofield Lecture 2
http://slidepdf.com/reader/full/c-more-schofield-lecture-2 20/75
Heat input from Antarctic Circumpolar Current (ACC - world’s largest ocea~30,000 Niagara Falls). The heat is driven onto the shelf by intensification of
favorable winds.
The WAP is theonly location in theAntarctic where theACC is adjacent tothe shelf break. TheACC is Antarctica’s
warmest water
Monday, July 2, 12

7/31/2019 C-MORE Schofield Lecture 2
http://slidepdf.com/reader/full/c-more-schofield-lecture-2 21/75
10 year analysis annual trends
ice decline
Monday, July 2, 12
7/31/2019 C-MORE Schofield Lecture 2
http://slidepdf.com/reader/full/c-more-schofield-lecture-2 22/75
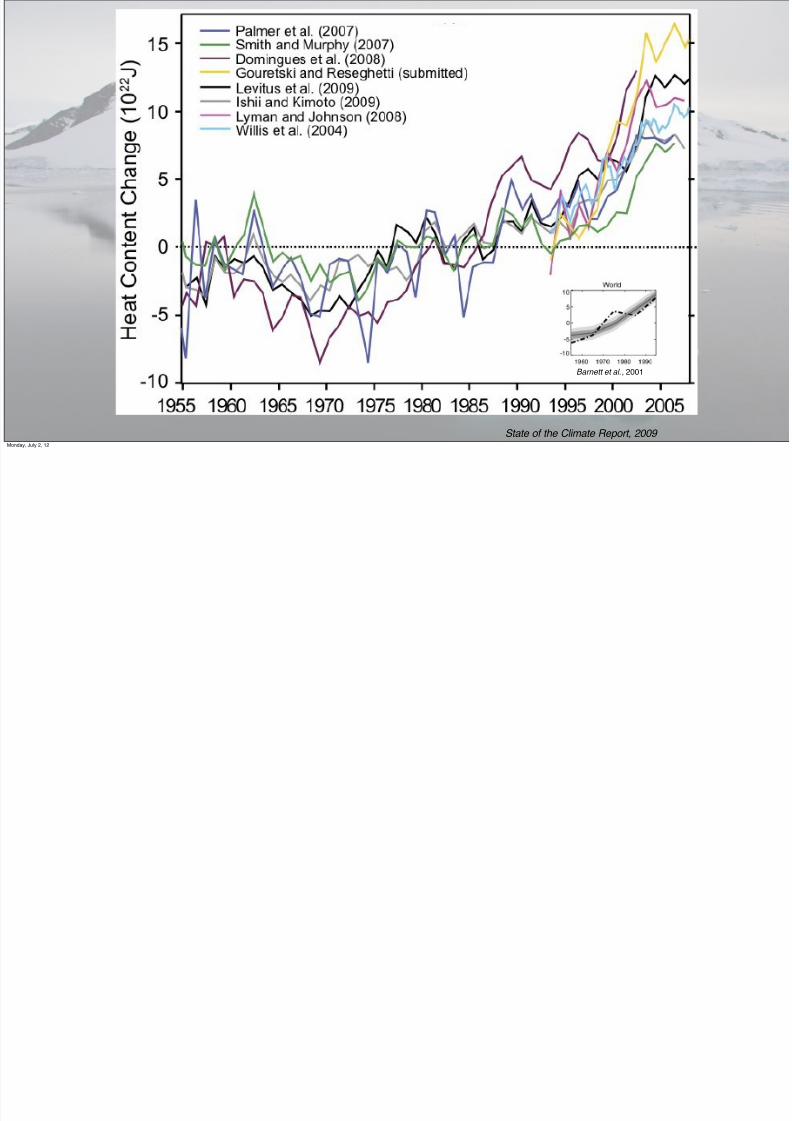
State of the Climate Report, 20
Barnett et al., 2001
Monday, July 2, 12

7/31/2019 C-MORE Schofield Lecture 2
http://slidepdf.com/reader/full/c-more-schofield-lecture-2 23/75
Tmax
UCDW
WW
A n t a r c t i c P e n i n s u l a
Distance Offshore (km)
D e p t h ( m )
thankMonday, July 2, 12

7/31/2019 C-MORE Schofield Lecture 2
http://slidepdf.com/reader/full/c-more-schofield-lecture-2 24/75
Upwelling favorable winds result in Ekman mass transport
Monday, July 2, 12
7/31/2019 C-MORE Schofield Lecture 2
http://slidepdf.com/reader/full/c-more-schofield-lecture-2 25/75
2.0
1.9
1.8
1.7
1.6
1.5
1.4
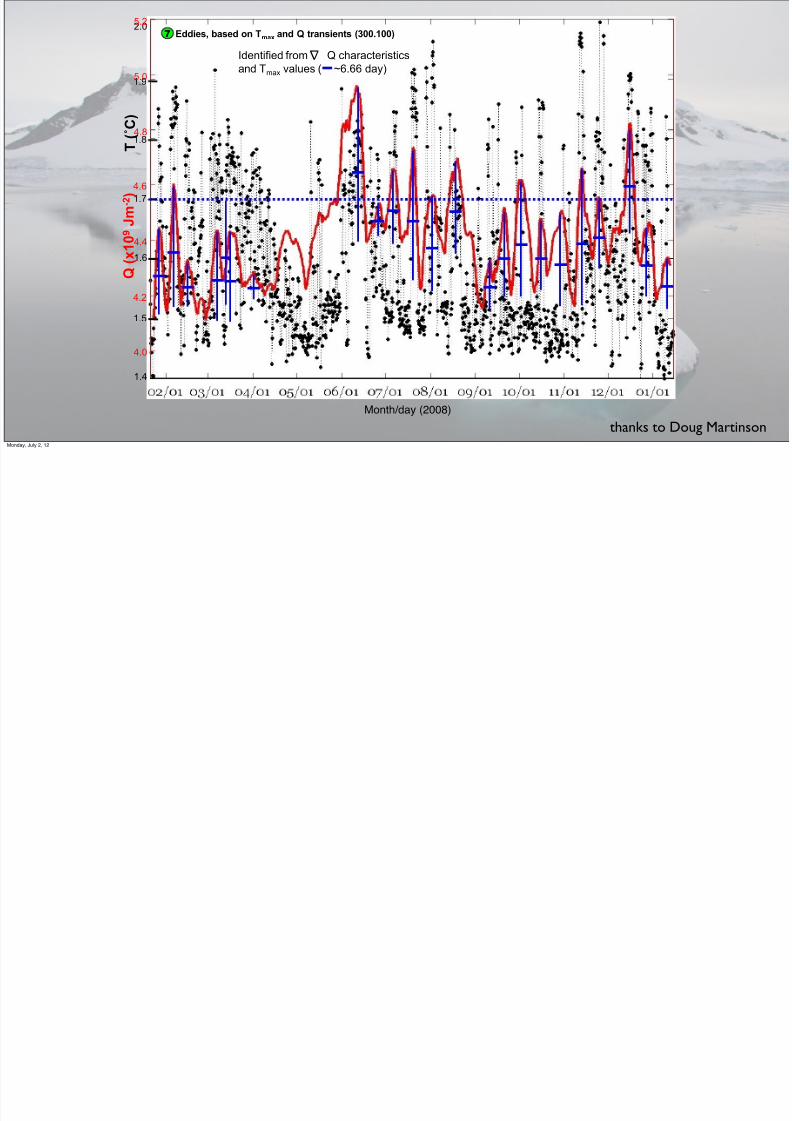
Identified from Q characteristics
and Tmax values ( ~6.66 day)
5.2
5.0
4.8
4.6
4.4
4.2
4.0
Eddies, based on Tmax and Q transients (300.100) 7
T ( ˚ C )
Q
( x 1 0 9 J
m - 2 )
∆
Month/day (2008)thank
Monday, July 2, 12
7/31/2019 C-MORE Schofield Lecture 2
http://slidepdf.com/reader/full/c-more-schofield-lecture-2 26/75
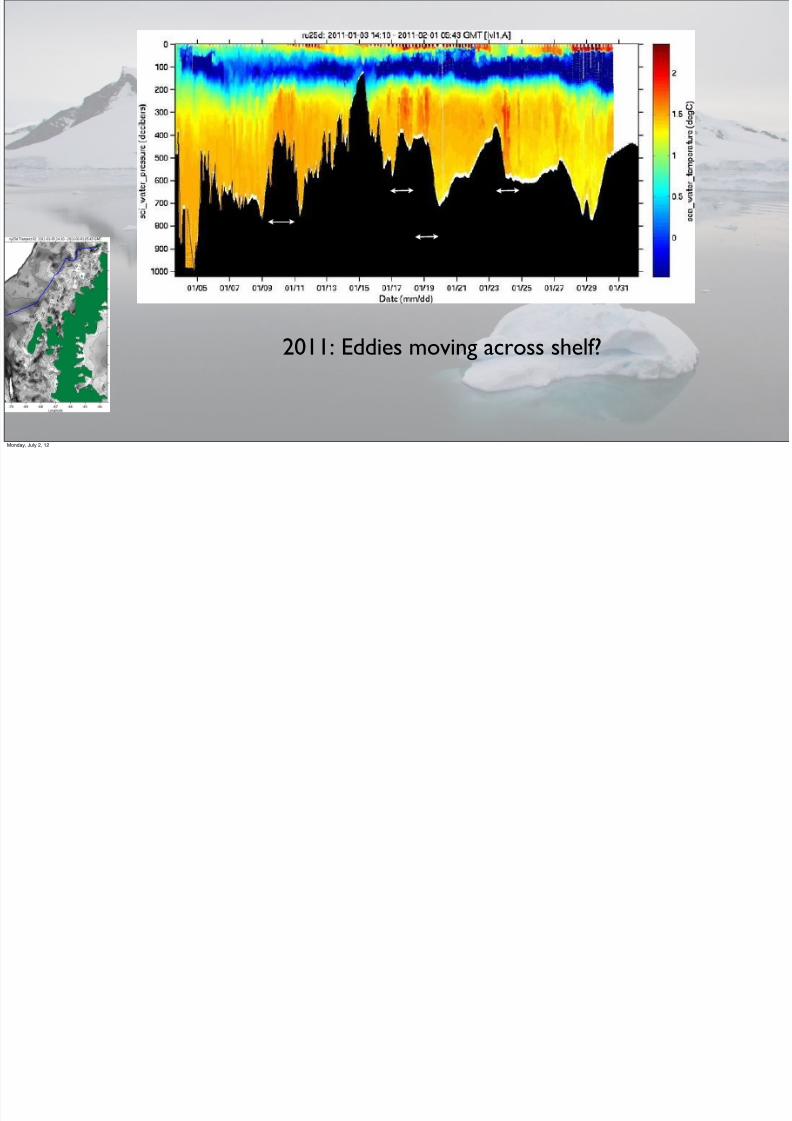
2011: Eddies moving across shelf?
~ 1.5 days~40-50 km
~ 1 day~30 km
~ 1 day~30 km
~ 1 day~30 km
Monday, July 2, 12

7/31/2019 C-MORE Schofield Lecture 2
http://slidepdf.com/reader/full/c-more-schofield-lecture-2 27/75
Red = offshore transportBlue = onshore transport
Monday, July 2, 12

7/31/2019 C-MORE Schofield Lecture 2
http://slidepdf.com/reader/full/c-more-schofield-lecture-2 28/75
The decadal changes have resulted changes in the phytoplankto
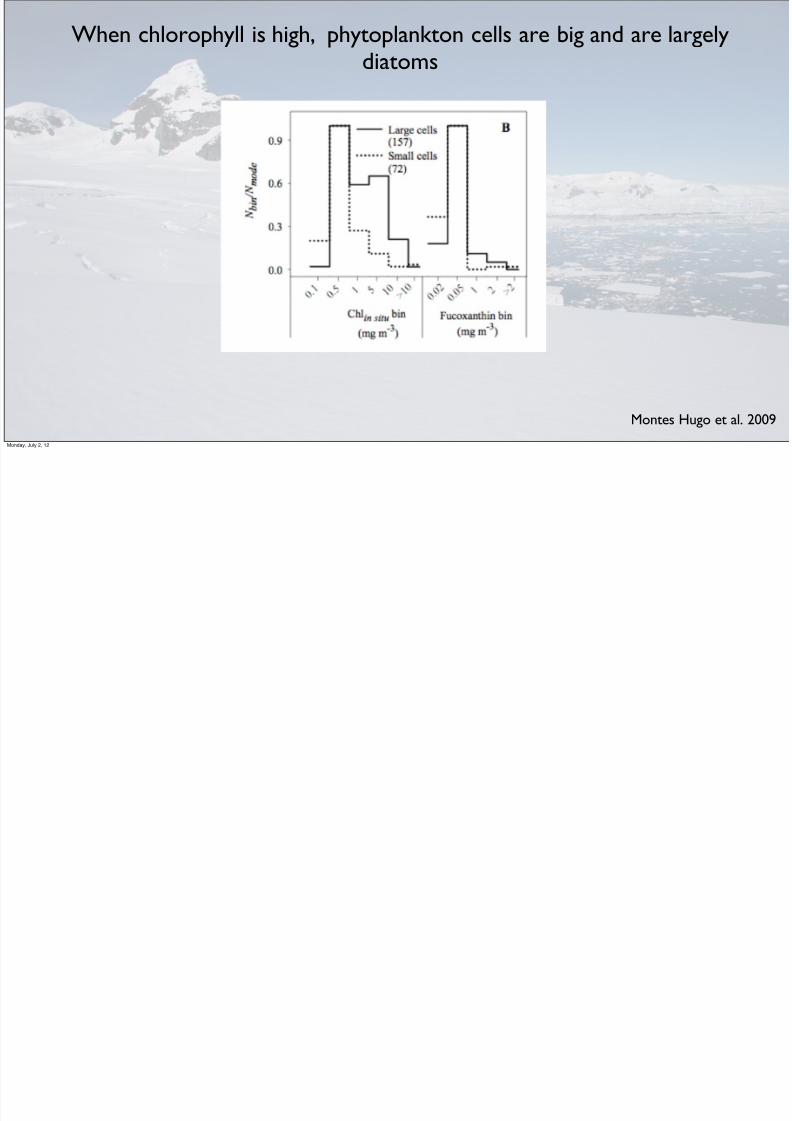
Montes Hugo et al. Science 2009
The change in chlorophyll since the 1970’s
The changes driven by a decice, wind and sun
Monday, July 2, 12
7/31/2019 C-MORE Schofield Lecture 2
http://slidepdf.com/reader/full/c-more-schofield-lecture-2 29/75
When chlorophyll is high, phytoplankton cells are big and ardiatoms
M
Monday, July 2, 12

7/31/2019 C-MORE Schofield Lecture 2
http://slidepdf.com/reader/full/c-more-schofield-lecture-2 30/75
15 yeaseries o
carmeasuralso su
North grad
Vernet et al. DSR 2008
Monday, July 2, 12
7/31/2019 C-MORE Schofield Lecture 2
http://slidepdf.com/reader/full/c-more-schofield-lecture-2 31/75
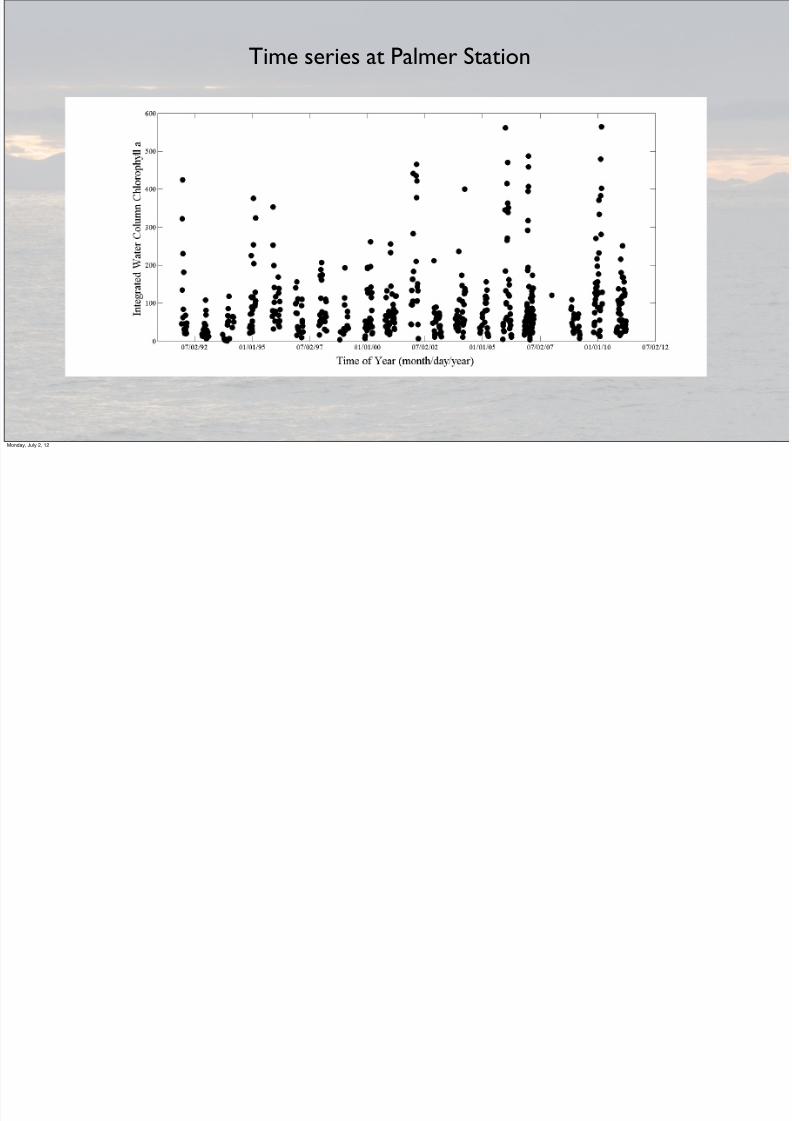
Time series at Palmer Station
Monday, July 2, 12

7/31/2019 C-MORE Schofield Lecture 2
http://slidepdf.com/reader/full/c-more-schofield-lecture-2 32/75
S A M ,ME I
P C 1 S e a W I F S C h
l - a
!1.5%
!1.0%
!0.5%
0.0%
0.5%
1.0%
1.5%
-0.30
-0.20
-0.10
0.00
0.10
0.20
0.30
1996 1998 2000 2002 2004 2006 2008 2010 2012
EOF_1
(SAM - DJF) & MEI - Yearly
Correlation = 0.53
-63-65-67-69
SeaWiFS Chl-a EO
Thanks GraceMonday, July 2, 12
7/31/2019 C-MORE Schofield Lecture 2
http://slidepdf.com/reader/full/c-more-schofield-lecture-2 33/75
Monday, July 2, 12
Wh l h l k bl i hi i

7/31/2019 C-MORE Schofield Lecture 2
http://slidepdf.com/reader/full/c-more-schofield-lecture-2 34/75
0 10 20 30 40 50
0
50
100
150
200
250
300
350
mixed layer dep
I n t e
g r a t e d c h l o r o p h y
l l a
a b o v e t h e m i x e d l a y
e r
2
0
DEC JAN FEB
CHL a
NO3
PO4
25
0
3
0
mg m-3
mol l-1
mol l-1
UML
What regulates phytoplankton blooms in this regio
0
1000
0
100
100
Monday, July 2, 12

7/31/2019 C-MORE Schofield Lecture 2
http://slidepdf.com/reader/full/c-more-schofield-lecture-2 35/75
B) cryptoph
D) prasinoph
A) diatoms
C) mixed flagellates
100
50
0100
50
0
% c
h l o r o p h y l l a a s s o c i a t e d w i t h p h y t o p l a n k t o n t a x a
01/01/95 01/01/05
Date (day/month/year)01/01/95 01/01/05
E) type-4 haptophytes
80% of the chlorophyll varcan be explained by diato
The next most significant pare the cryptomonads (~1
Monday, July 2, 12

7/31/2019 C-MORE Schofield Lecture 2
http://slidepdf.com/reader/full/c-more-schofield-lecture-2 36/75
Cryptomonas cryophila
Thalassiosira antarctica
Corethron criophilum
Palmer Cryptophytes --> 8 ± 2µm
10µm
100µm
SEM Micrographs from McMinn and Hodgson 1993
Monday, July 2, 12

7/31/2019 C-MORE Schofield Lecture 2
http://slidepdf.com/reader/full/c-more-schofield-lecture-2 37/75
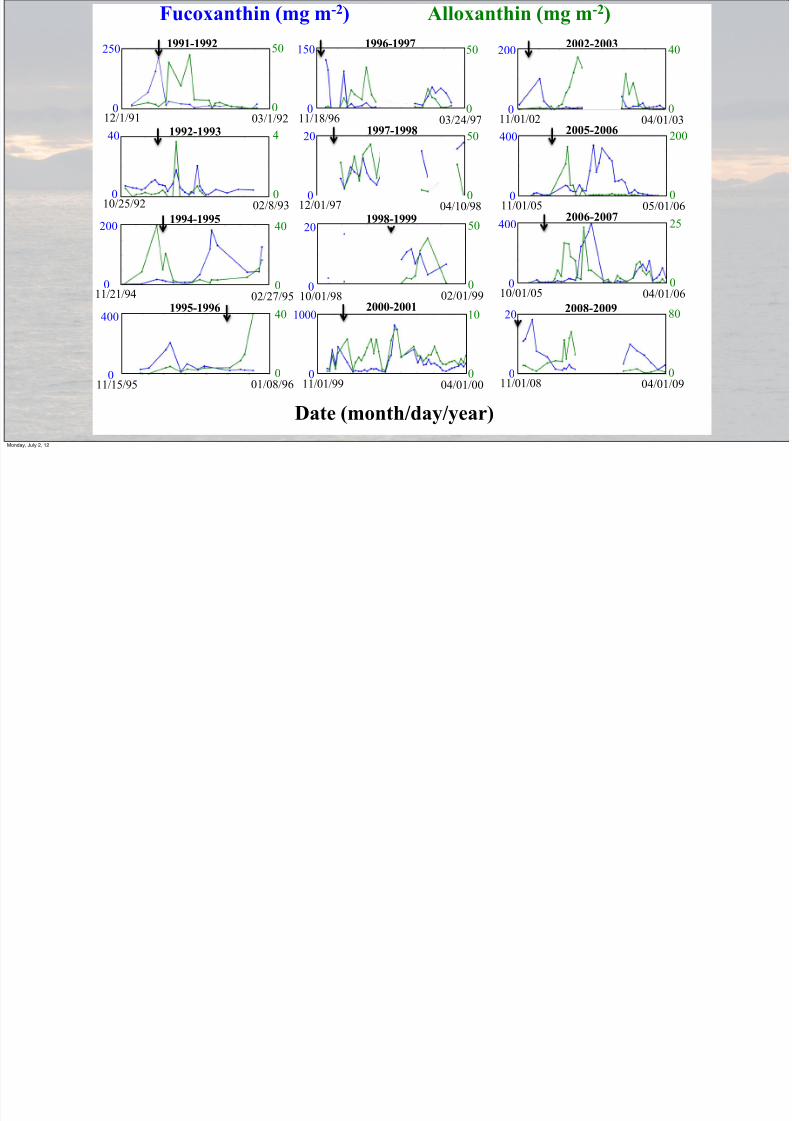
W a t e r c
o l u m n I n t e g r a t e d A l l o x a n t h i n
Watercolumn Integrated Fucoxanthin
Data from the 20 yearPalmer time series
Monday, July 2, 12
Fucoxanthin (mg m-2) Alloxanthin (mg m-2)
7/31/2019 C-MORE Schofield Lecture 2
http://slidepdf.com/reader/full/c-more-schofield-lecture-2 38/75
0
250
12/1/910
50
03/1/92
1991-1992
0
40
10/25/92
1992-1993
0
4
02/8/93
0
200
11/21/940
40
02/27/95
0
400
11/15/95
0
40
01/08/96
1994-1995
1995-1996
Date (month/day/year)
0
150
11/18/960
50
03/24/97
1996-1997
0
20
12/01/970
50
04/10/98
0
20
10/01/980
50
02/01/99
1997-1998
1998-1999
0
1000
11/01/990
10
04/01/00
0
200
11/01/02 0
2002-2003
0
400
11/01/05
2005-2006
0
400
10/01/05
2006-2007
0
20
11/01/08 0
2000-2001 2008-2009
Fucoxanthin (mg m ) Alloxanthin (mg m )
Monday, July 2, 12
7/31/2019 C-MORE Schofield Lecture 2
http://slidepdf.com/reader/full/c-more-schofield-lecture-2 39/75
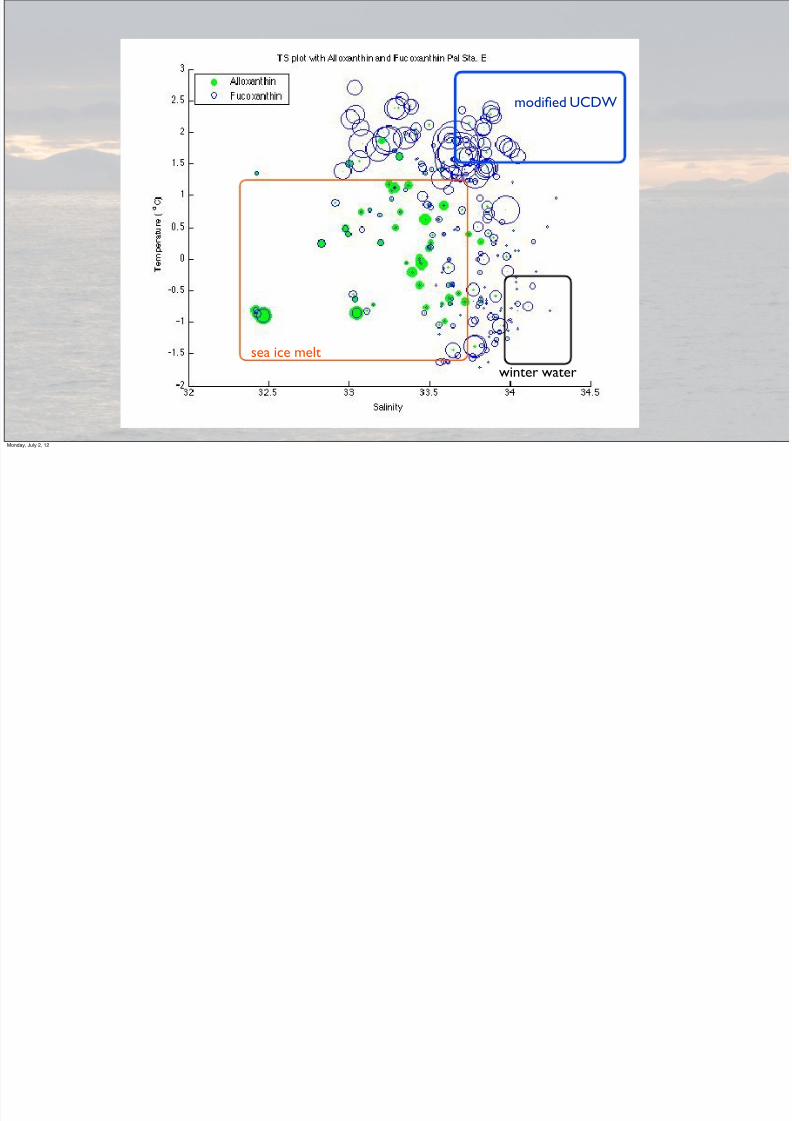
modified UCDW
sea ice melt
winter water
Monday, July 2, 12

7/31/2019 C-MORE Schofield Lecture 2
http://slidepdf.com/reader/full/c-more-schofield-lecture-2 40/75
Monday, July 2, 12
A l f t i th i WAP
7/31/2019 C-MORE Schofield Lecture 2
http://slidepdf.com/reader/full/c-more-schofield-lecture-2 41/75
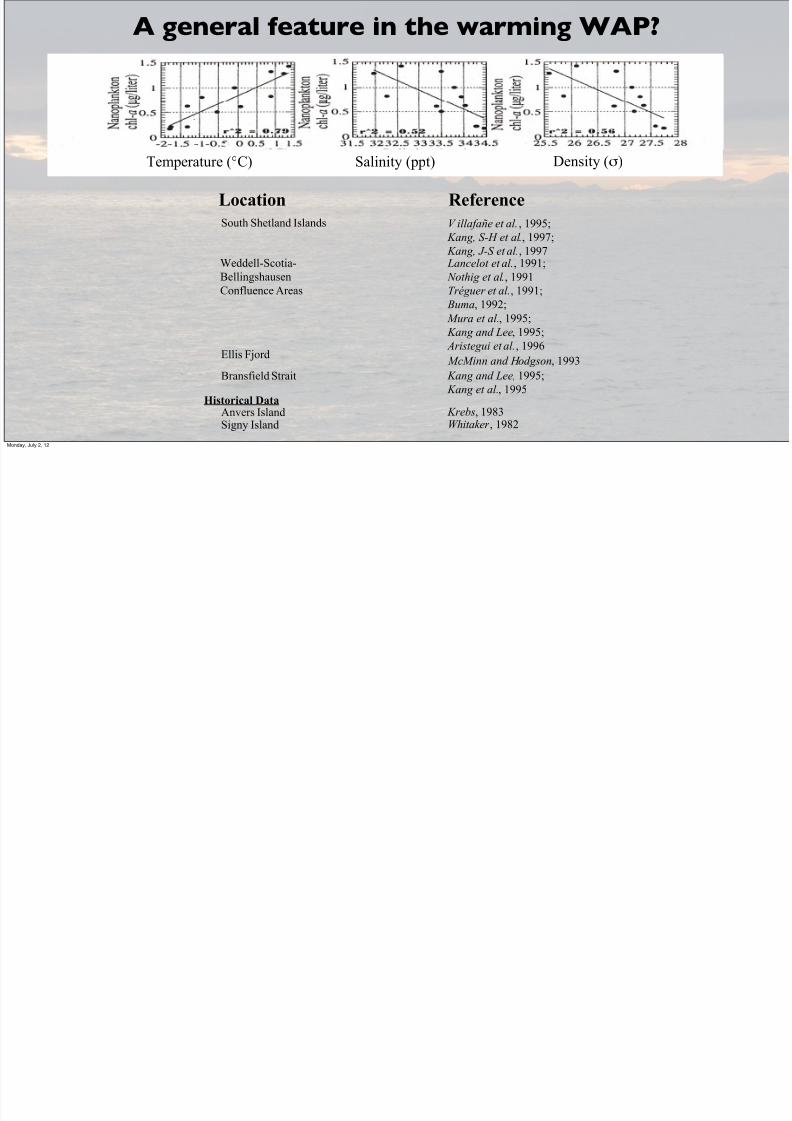
Temperature (°C) Salinity (ppt) Density (σ)
A general feature in the warming WAP
V illafañe et al., 1995;
Kang, S-H et al., 1997;
Kang, J-S et al., 1997
Location Reference
South Shetland Islands
Lancelot et al., 1991;
Nothig et al., 1991Tréguer et al., 1991;
Buma, 1992;
Mura et al., 1995;
Kang and Lee, 1995;
Aristegui et al., 1996
Weddell-Scotia-
BellingshausenConfluence Areas
McMinn and Hodgson, 1993Ellis Fjord
Kang and Lee, 1995;
Kang et al., 1995
Bransfield Strait
Krebs, 1983Anvers IslandWhitaker , 1982Signy Island
Historical Data
Monday, July 2, 12
Salinity (p.p.t)

7/31/2019 C-MORE Schofield Lecture 2
http://slidepdf.com/reader/full/c-more-schofield-lecture-2 42/75
% Cryptophytes
0 25 50
33.3 33.6 33.8
64°W
Palmer Station
Antarctic
Peninsula
65°S
65°S
Monday, July 2, 12
Shi id (N l l )
7/31/2019 C-MORE Schofield Lecture 2
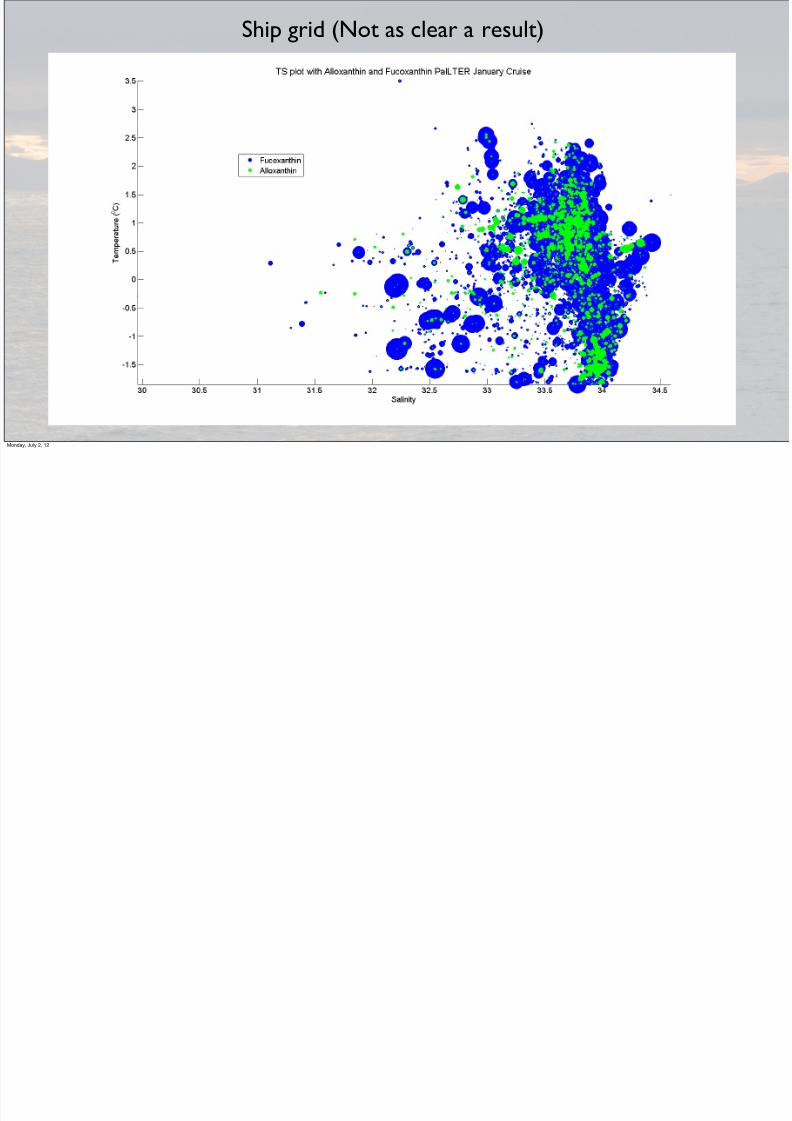
http://slidepdf.com/reader/full/c-more-schofield-lecture-2 43/75
Ship grid (Not as clear a result)
Monday, July 2, 12
7/31/2019 C-MORE Schofield Lecture 2
http://slidepdf.com/reader/full/c-more-schofield-lecture-2 44/75
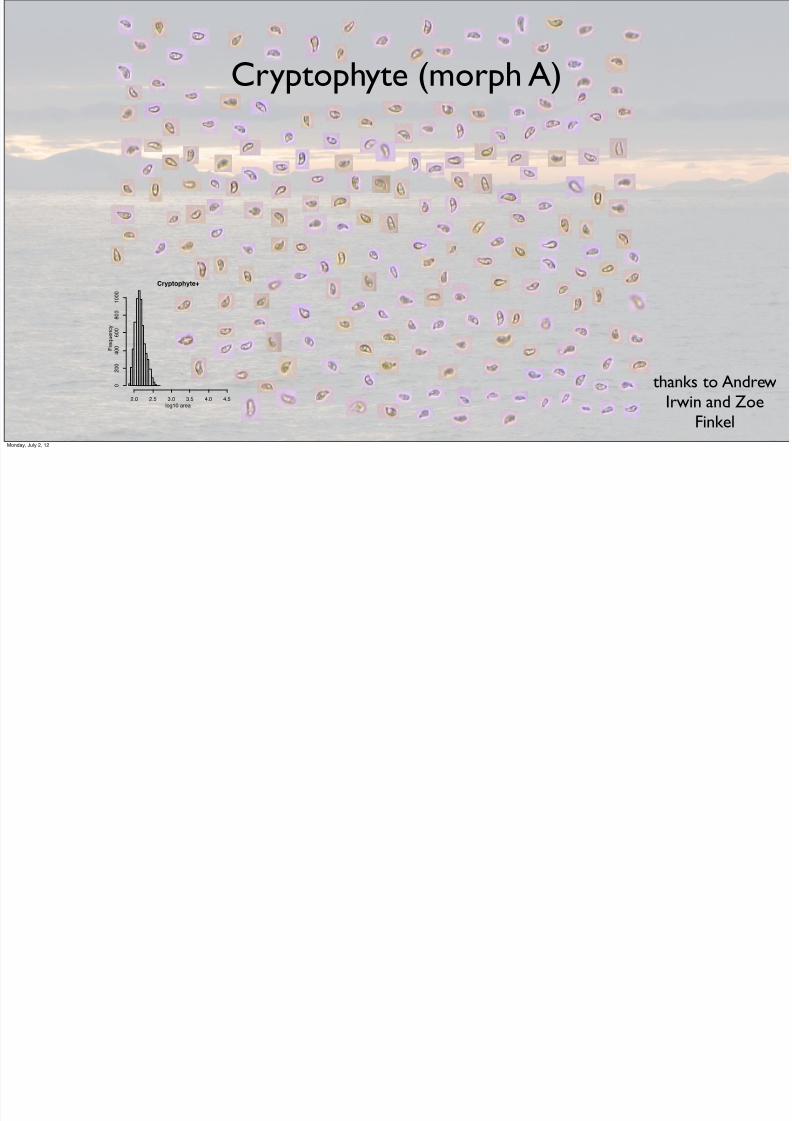
Cryptophyte (morph A)
Cryptophyte+
log10 area
F r e q u e n c y
2.0 2.5 3.0 3.5 4.0 4.5
0
2 0 0
4 0 0
6 0 0
8 0 0
1 0 0 0
Monday, July 2, 12
C

7/31/2019 C-MORE Schofield Lecture 2
http://slidepdf.com/reader/full/c-more-schofield-lecture-2 45/75
Cryptostrai ht mor h
Monday, July 2, 12

7/31/2019 C-MORE Schofield Lecture 2
http://slidepdf.com/reader/full/c-more-schofield-lecture-2 46/75
Classification
summary
Classified as Larger category
C ry pt op hy te A F la ge ll at e al l
C ry pt op hy te F F la ge ll at e al l
C ry pt op hy te H F la ge ll at e al l
Diatom Diatomall
Diatom(charisma6c) Diatomall
D ia to m (f uz zy ) D ia to m all
Diatom (pot en6al) Diatom al l
D ot fl ag el la te F la gel la te a ll
D ot fl ag el la te 2 F la ge ll at e al l
Flagell at e st raight Flagell at e al l
Fuzzy Discard
G ym no di ni um 1 F la ge ll at e al l
G ym no di ni um 2 F la ge ll at e al l
Gyrodinium Flagellateall
Junk Discard
LRT Other
N an ofl ag el la te F la ge ll at e al l
Pigment Discard
P ra si no ph yt e F la gel la te a ll
Telonemaspp. Other
T or od in iu m sp p F la ge ll at e al l
Unknown Other
Airbubble Discard
Bead Discard
Ciliate Discard
C or eth ro ns pp. D ia to m all
D in ofl ag ell at e F la gel la te a ll
G on ya ul ac ac ea e F la ge ll at e al l
Phaeocys6sspp.(cells) Other
Phaeocys6sspp.(colony) Other
Spines Discard
Tin6nnid Discard
Group Count %
Cryptophytes 11484 51
Diatoms 7360 32
Dinos 555 2.4
Flag. predator 486 2.1Others 2850 12.5
Total 22735
Flagellate Diatom Dinoflagellate
Flagellate 3939 940 115
Diatom 5 803 31
Dinoflagellate 202 7 119
Other 487 323 73
Discard 33 1392 2
%agree 70 71 32
Automatic class
H u m a n c l a s s i fi c a t i o
n
Automatic classification matches 74% of
All particles were classified/corre
Human classification has an error/uncert
Monday, July 2, 12
Relative abundance of major groups

7/31/2019 C-MORE Schofield Lecture 2
http://slidepdf.com/reader/full/c-more-schofield-lecture-2 47/75
Relative abundance of major groups
−75 −70 −65
− 6 9
− 6 8
− 6 7
− 6 6
− 6 5
− 6 4
0.0
0.2
0.4
0.6
0.8
0
0. 2
0 . 2
0 . 4
0. 4
0.6
0. 8
Cryptophytes
−75 −70 −65
− 6 9
− 6 8
− 6 7
− 6 6
− 6 5
− 6 4
0.00
0.05
0.10
0.15
0.20
0
0. 0 5
0. 1
0 . 1 5
0 . 2
CryptAH
−75 −70 −65
− 6 9
− 6 8
− 6 7
− 6 6
− 6 5
− 6 4
0.00
0.05
0.10
0.15
0.20
0
0. 0 5
0 . 0
5
0 . 0 5
0 . 0
5
0 . 1
0 . 1
0 . 1
0 . 1 5
0 . 1 5
0 . 1 5
CryptF
−75 −70
− 6 9
− 6 8
− 6 7
− 6 6
− 6 5
− 6 4
0
0
0. 2
0. 4
0 .6
FlagStraight
−75 −70 −65
− 6 9
− 6 8
− 6 7
− 6 6
− 6 5
− 6 4
0.1
0.2
0.3
0.4
0.5
0.6
0.7
0 . 1
0. 2
0.3
0 . 4
0. 4
0 . 5
0 . 6
0 . 7
Diatom
−75 −70 −65
− 6 9
− 6 8
− 6 7
− 6 6
− 6 5
− 6 4
0.05
0.10
0.15
0.20
0 .0 5
0 .1
0 . 1
5
Dinoflagellate
−75 −70 −65
− 6 9
− 6 8
− 6 7
− 6 6
− 6 5
− 6 4
0.020
0.025
0.030
0 .0 2
0 . 0 2
0. 0 2 5
0.025
0 .0 3
0 . 0 3
Predator
−75 −70
− 6 9
− 6 8
− 6 7
− 6 6
− 6 5
− 6 4
0 . 1
0 . 1 6
0
. 1 8
0 . 2
Other
Monday, July 2, 12

7/31/2019 C-MORE Schofield Lecture 2
http://slidepdf.com/reader/full/c-more-schofield-lecture-2 48/75
Zooplankton are dominated by krill or salps
Krill greatest biomass o
Monday, July 2, 12
7/31/2019 C-MORE Schofield Lecture 2
http://slidepdf.com/reader/full/c-more-schofield-lecture-2 49/75
Monday, July 2, 12

7/31/2019 C-MORE Schofield Lecture 2
http://slidepdf.com/reader/full/c-more-schofield-lecture-2 50/75
020406080
100
McClatchie and Boyd 19
020406080
100 Boyd et al. 1984
01020304050
Quetin and Ross 1985
% R
e t e n t i o n b y K
r i l l
5-10
Phytoplankton Size (µ m)
>15
5-10 >15
5-10 >15
Monday, July 2, 12
From Loeb et al., 1997

7/31/2019 C-MORE Schofield Lecture 2
http://slidepdf.com/reader/full/c-more-schofield-lecture-2 51/75
80 82 84 86 88 90 92 94 96
K r i l l : S a l p
Year
I c e I n d e x
K r i l l : S a l p
Ice Index
K r i l l : S a l p
Mean Air Temperature (°C)
,
Monday, July 2, 12

7/31/2019 C-MORE Schofield Lecture 2
http://slidepdf.com/reader/full/c-more-schofield-lecture-2 52/75
Monday, July 2, 12
Is there an impact on higher trophic levels?

7/31/2019 C-MORE Schofield Lecture 2
http://slidepdf.com/reader/full/c-more-schofield-lecture-2 53/75
Is there an impact on higher trophic levels?
Monday, July 2, 12

7/31/2019 C-MORE Schofield Lecture 2
http://slidepdf.com/reader/full/c-more-schofield-lecture-2 54/75
Monday, July 2, 12
One focus idea of the LTER is testing, is that system is undergoing climate m

7/31/2019 C-MORE Schofield Lecture 2
http://slidepdf.com/reader/full/c-more-schofield-lecture-2 55/75
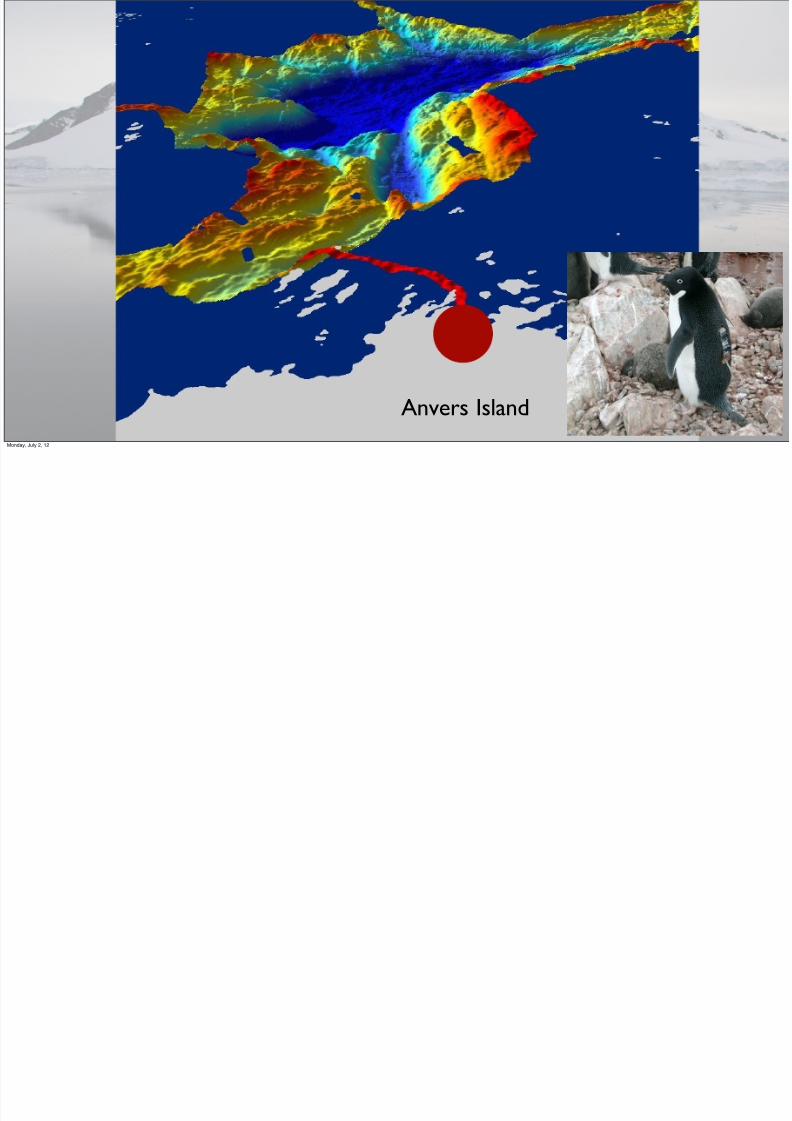
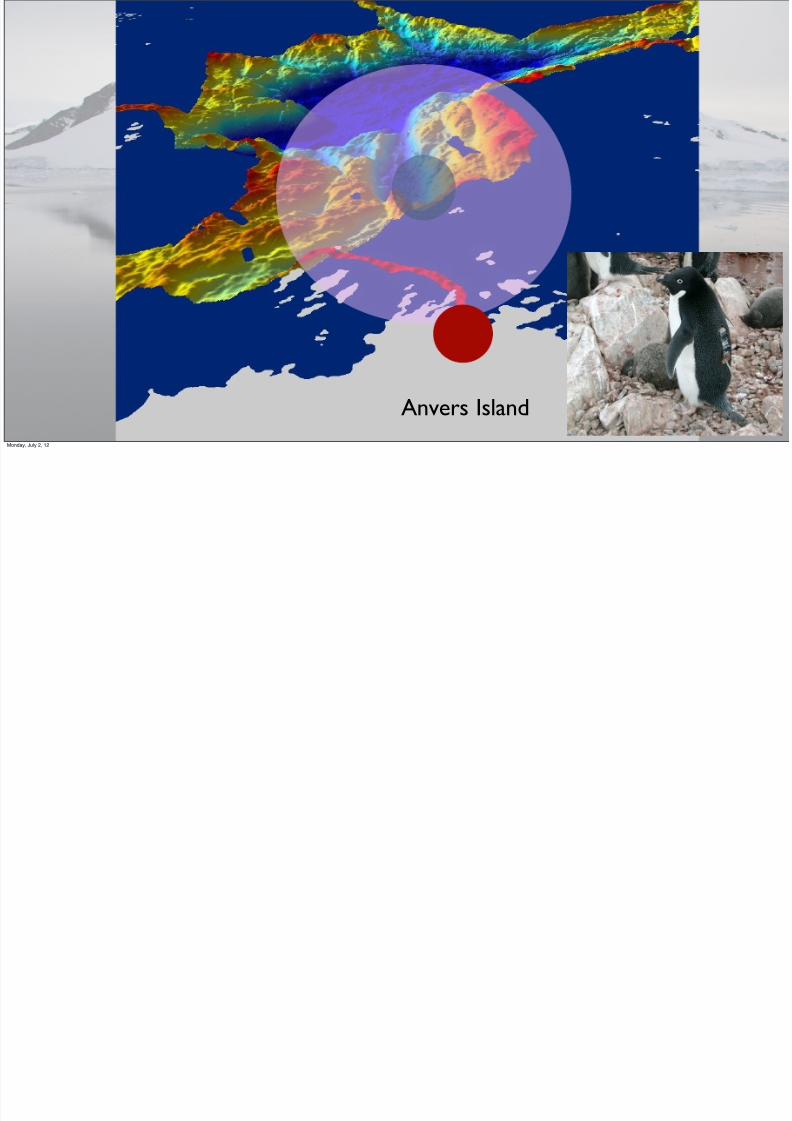
have structured sampling around the major Adelie penguin breeding areapeninsula.
To be expanded by NASAgrant awarded in Dec.
Summerforaging
areas for Adeliepenguins
Winterforaging
areas for Adeliepenguins
Monday, July 2, 12
7/31/2019 C-MORE Schofield Lecture 2
http://slidepdf.com/reader/full/c-more-schofield-lecture-2 56/75
Anvers Island
Monday, July 2, 12
7/31/2019 C-MORE Schofield Lecture 2
http://slidepdf.com/reader/full/c-more-schofield-lecture-2 57/75
Anvers Island
Monday, July 2, 12
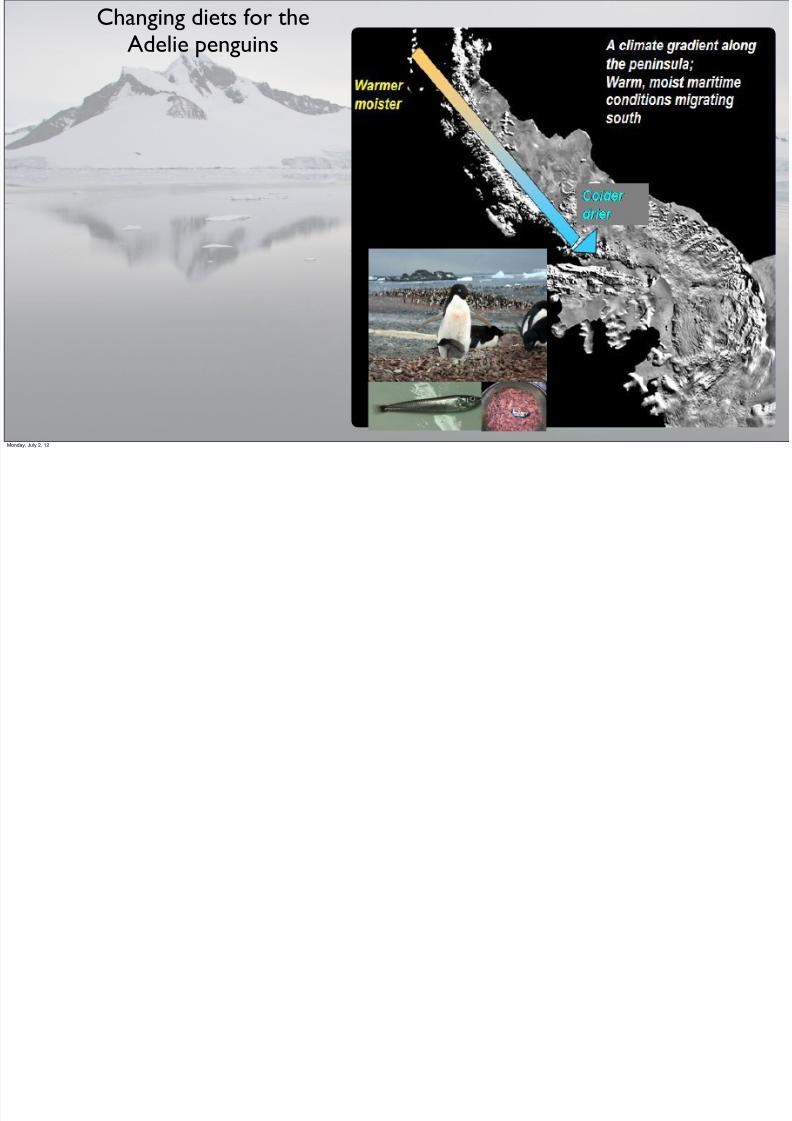
Changing diets for the
7/31/2019 C-MORE Schofield Lecture 2
http://slidepdf.com/reader/full/c-more-schofield-lecture-2 58/75
g gAdelie penguins
Monday, July 2, 12
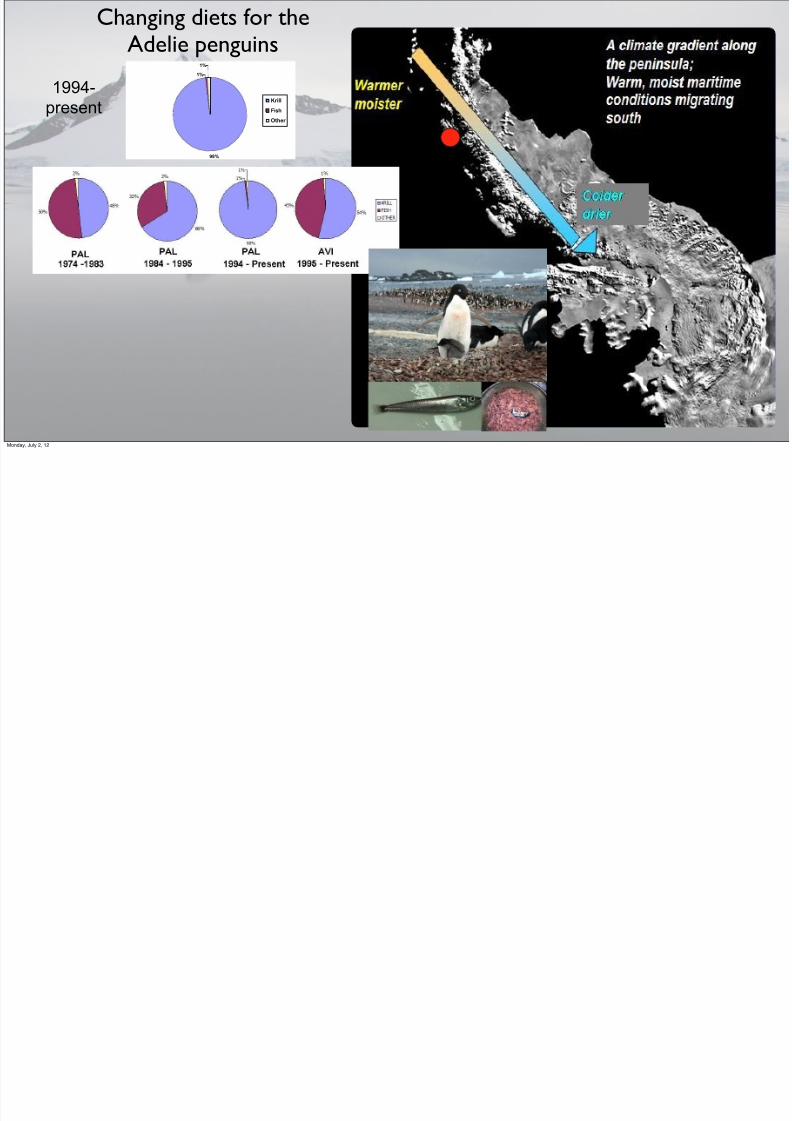
Changing diets for the
7/31/2019 C-MORE Schofield Lecture 2
http://slidepdf.com/reader/full/c-more-schofield-lecture-2 59/75
98%
1%
1%
Krill
Fish
Other
1994-
present
g gAdelie penguins
Monday, July 2, 12
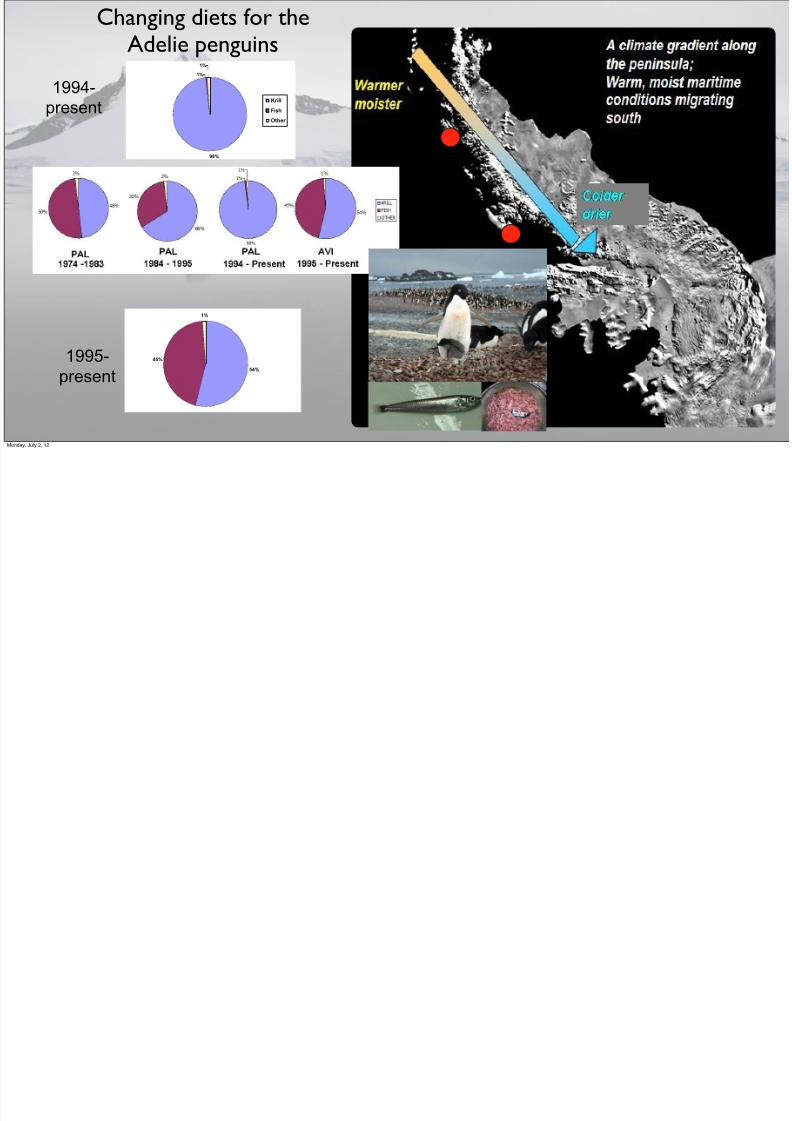
Changing diets for the
7/31/2019 C-MORE Schofield Lecture 2
http://slidepdf.com/reader/full/c-more-schofield-lecture-2 60/75
98%
1%
1%
Krill
Fish
Other
1994-
present
54%
45%
1%
1995-
present
g gAdelie penguins
Monday, July 2, 12
7/31/2019 C-MORE Schofield Lecture 2
http://slidepdf.com/reader/full/c-more-schofield-lecture-2 61/75
16-25
26-30
31-35
36-40
41-45
46-50
51-55
56-65
8 7 - 8 8
8 8 - 8 9
8 9 - 9 0
9 0 - 9 1
9 1 - 9 2
9 2 - 9 3
9 3 - 9 4
9 4 - 9 5
9 5 - 9 6
9 6 - 9 7
9 7 - 9 8
9 8 - 9 9
9 9 - 0 0
0 0 - 0 1
0 1 - 0 2
0 2 - 0 3
0 3 - 0 4
0 4 - 0 5
0 5 - 0 6
0 6 - 0 7
0 7 - 0 8
0 8 - 0 9
0 9 - 1 0
1 0 - 1 1
1 1 - 1 2
S I Z E
C L A S S
YEAR
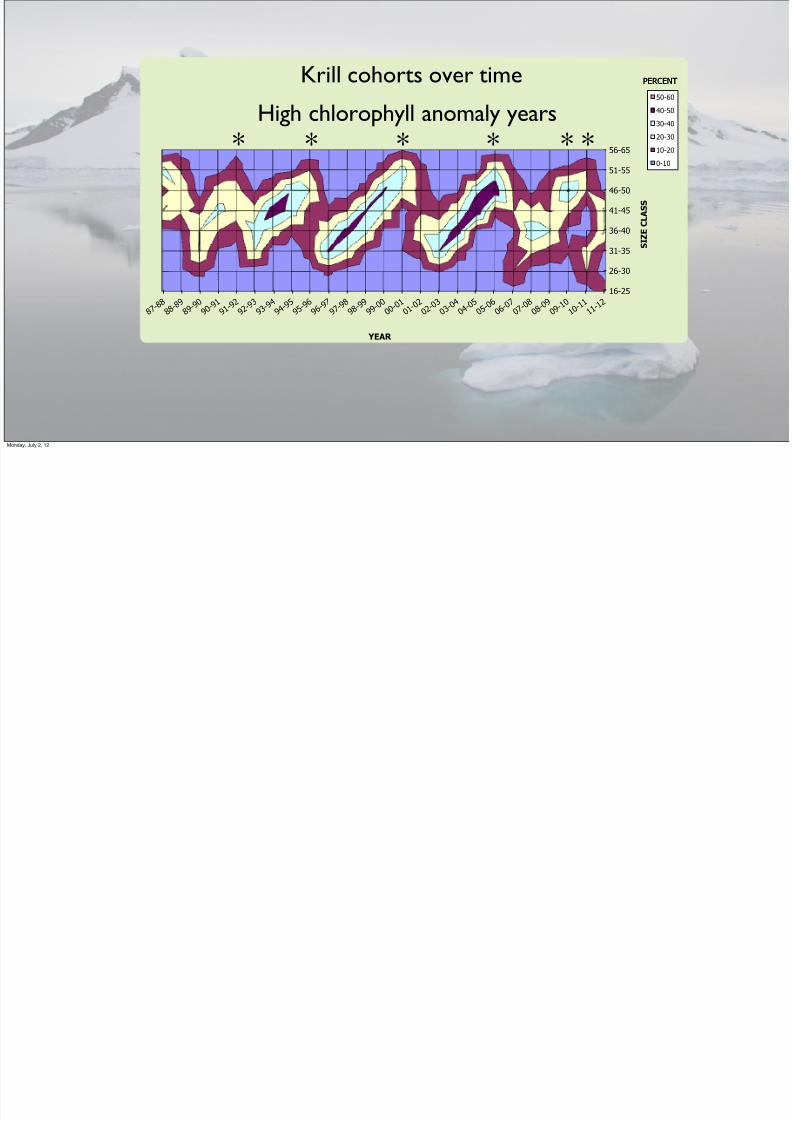
Krill cohorts over time
* * * * * *
High chlorophyll anomaly years
Monday, July 2, 12

7/31/2019 C-MORE Schofield Lecture 2
http://slidepdf.com/reader/full/c-more-schofield-lecture-2 62/75
Monday, July 2, 12

7/31/2019 C-MORE Schofield Lecture 2
http://slidepdf.com/reader/full/c-more-schofield-lecture-2 63/75
-1
-0.5
0
0.5
1
1.5
2
2.5
1 9 7 4
1 9 7 5
1 9 7 6
1 9 7 7
1 9 7 8
1 9 7 9
1 9 8 0
1 9 8 3
1 9 8 7
1 9 8 8
1 9 8 9
1 9 9 0
1 9 9 1
1 9 9 2
1 9 9 3
1 9 9 4
1 9 9 5
1 9 9 6
1 9 9 7
1 9 9 8
1 9 9 9
2 0 0 0
2 0 0 1
YEAR
N O R
M A L I Z E D O T O L I T H A B U N D A N C E I N D I E T
S A M P L E S
ANTARCTIC SILVERFISH
LANTERFISH
Silverfish
Lanternfish
Monday, July 2, 12
If that was not enough, warmer temps leads to more moist

7/31/2019 C-MORE Schofield Lecture 2
http://slidepdf.com/reader/full/c-more-schofield-lecture-2 64/75
If that was not enough, warmer temps leads to more moistmore snow. Breeding failure...........
Monday, July 2, 12
7/31/2019 C-MORE Schofield Lecture 2
http://slidepdf.com/reader/full/c-more-schofield-lecture-2 65/75
Monday, July 2, 12
70 West 69 West

7/31/2019 C-MORE Schofield Lecture 2
http://slidepdf.com/reader/full/c-more-schofield-lecture-2 66/75
Old Day Communication
HAM Operator Coms Palmer Station 1988
68 South
AdelaideIsland
OceanStationObama
W
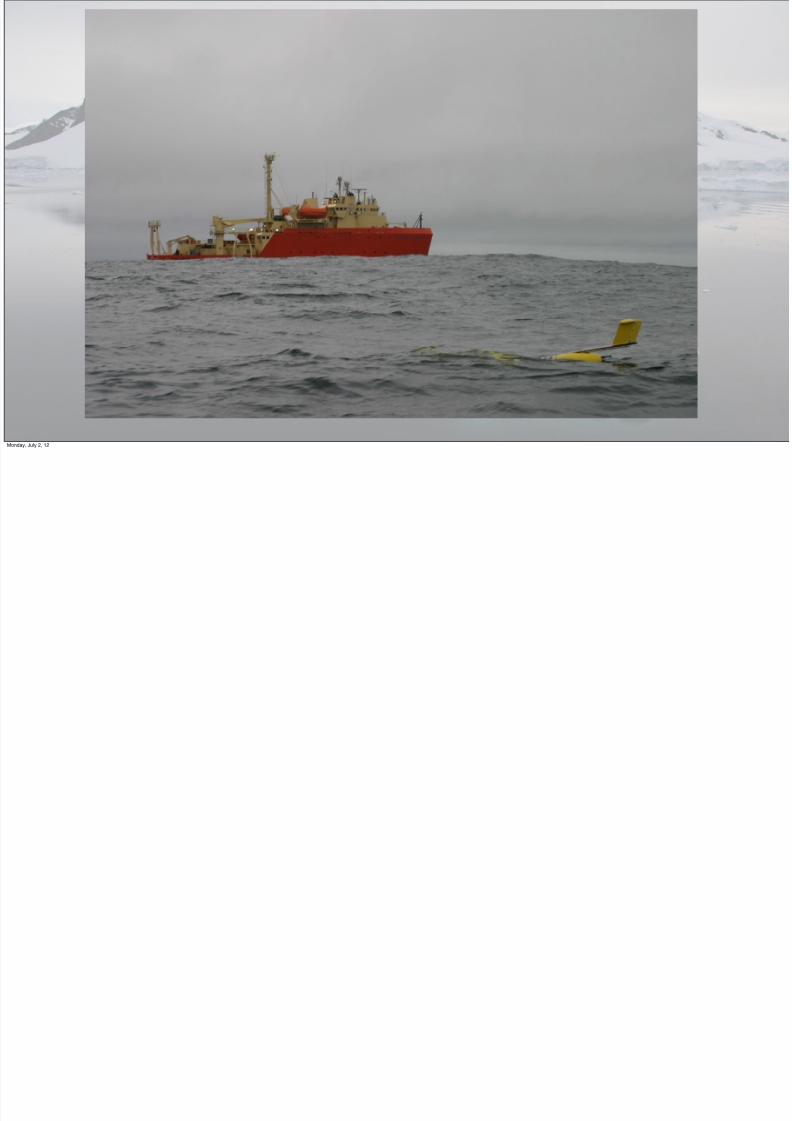
RV Gould
Rutgers
COOLroom
RotheraBaseReal time
comms
Brave NewDay
Monday, July 2, 12
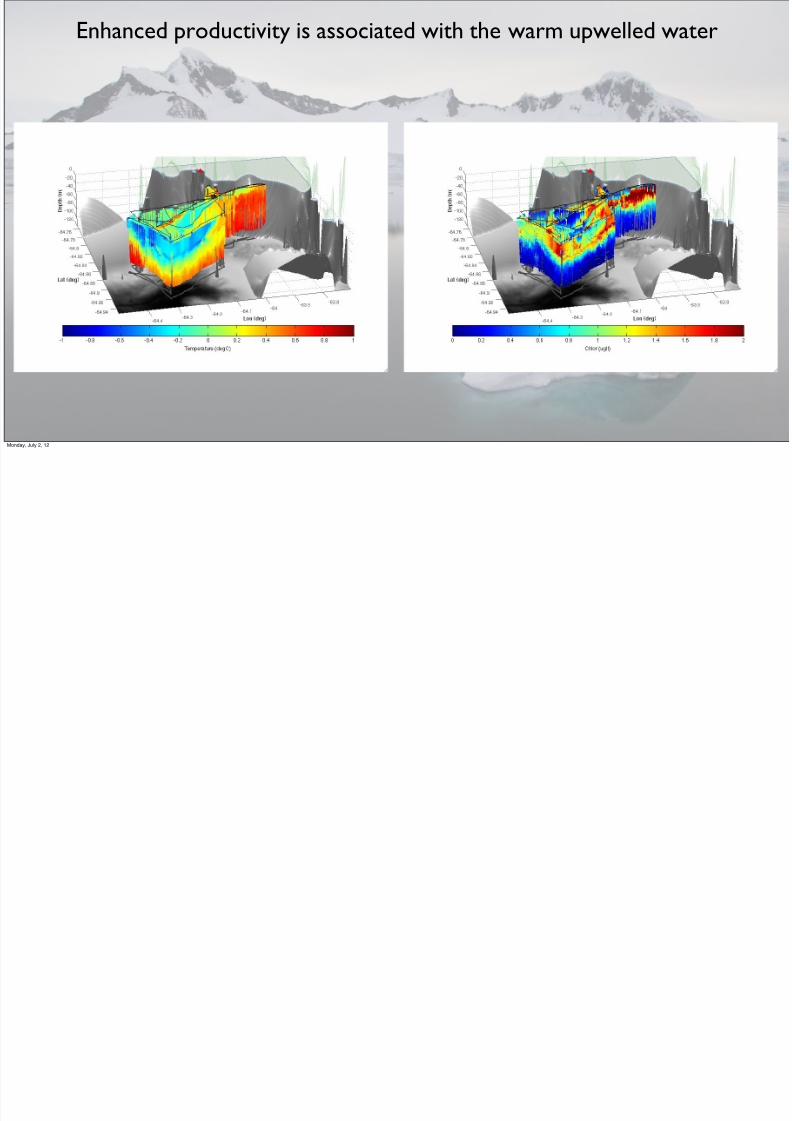
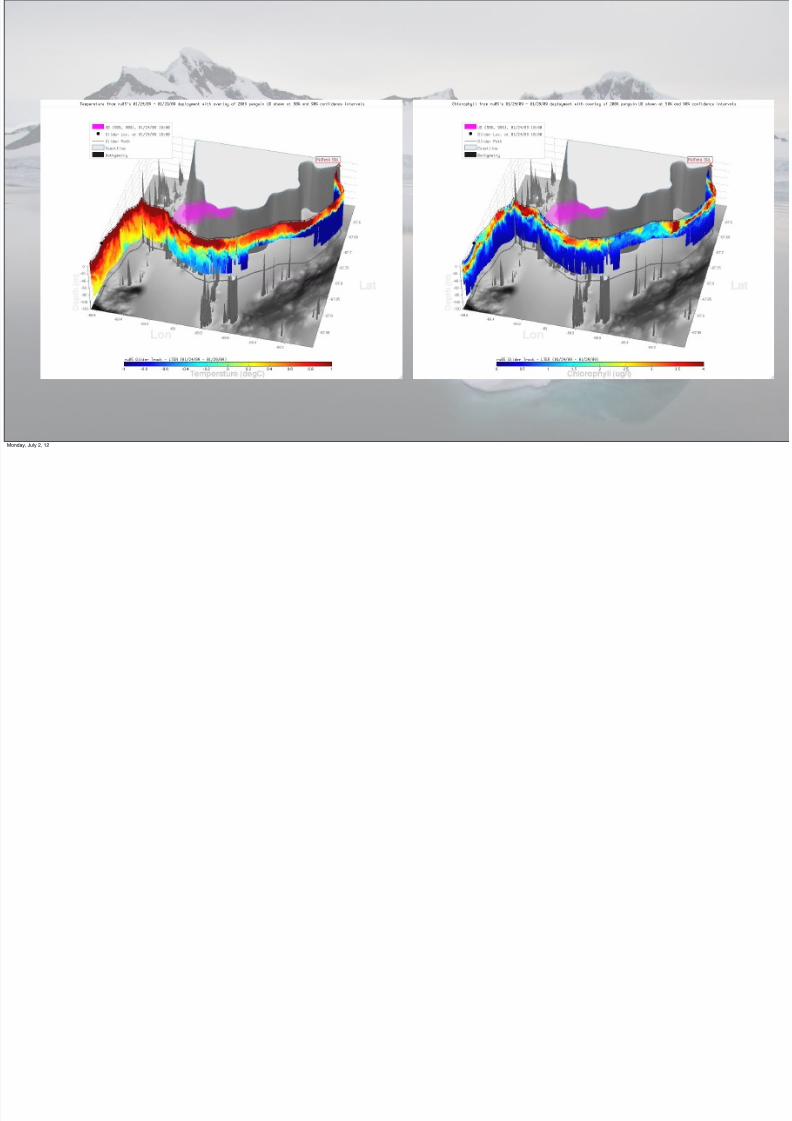
Enhanced productivity is associated with the warm upwelle
7/31/2019 C-MORE Schofield Lecture 2
http://slidepdf.com/reader/full/c-more-schofield-lecture-2 67/75
Enhanced productivity is associated with the warm upwelle
Monday, July 2, 12
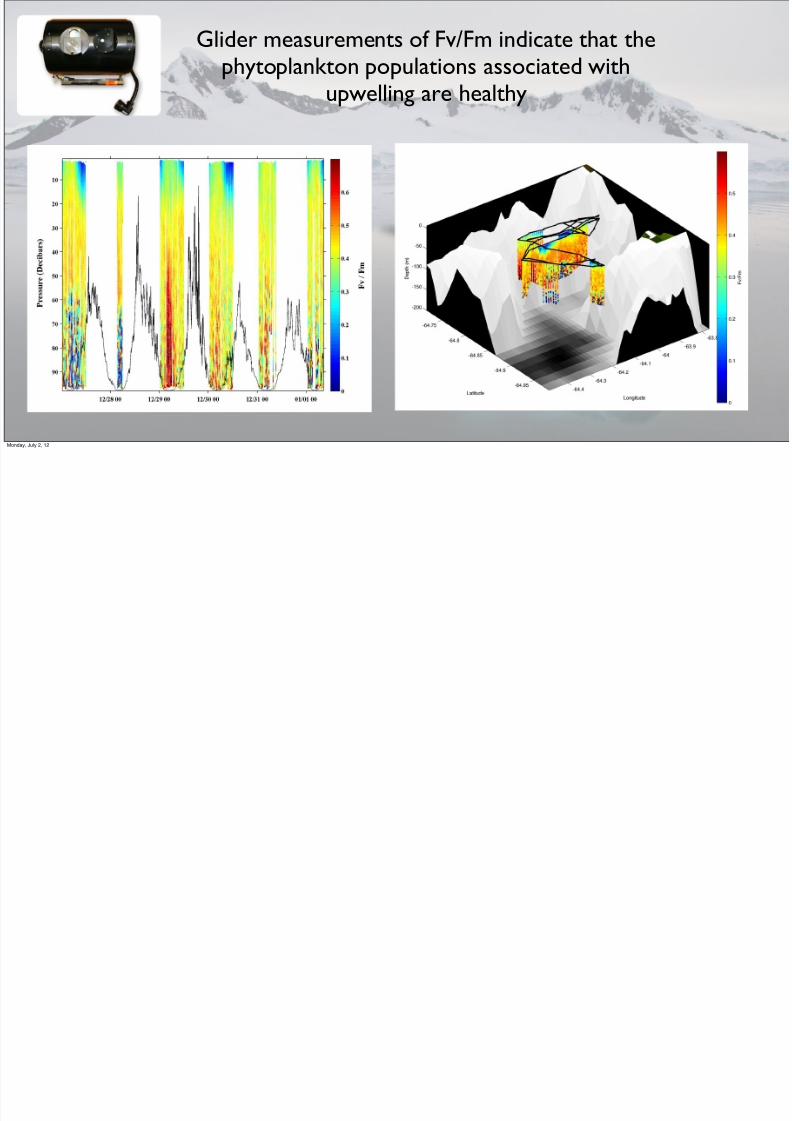
Glider measurements of Fv/Fm indicate that th
7/31/2019 C-MORE Schofield Lecture 2
http://slidepdf.com/reader/full/c-more-schofield-lecture-2 68/75
Glider measurements of Fv/Fm indicate that thphytoplankton populations associated with
upwelling are healthy
Monday, July 2, 12
7/31/2019 C-MORE Schofield Lecture 2
http://slidepdf.com/reader/full/c-more-schofield-lecture-2 69/75
Monday, July 2, 12
7/31/2019 C-MORE Schofield Lecture 2
http://slidepdf.com/reader/full/c-more-schofield-lecture-2 70/75
Monday, July 2, 12
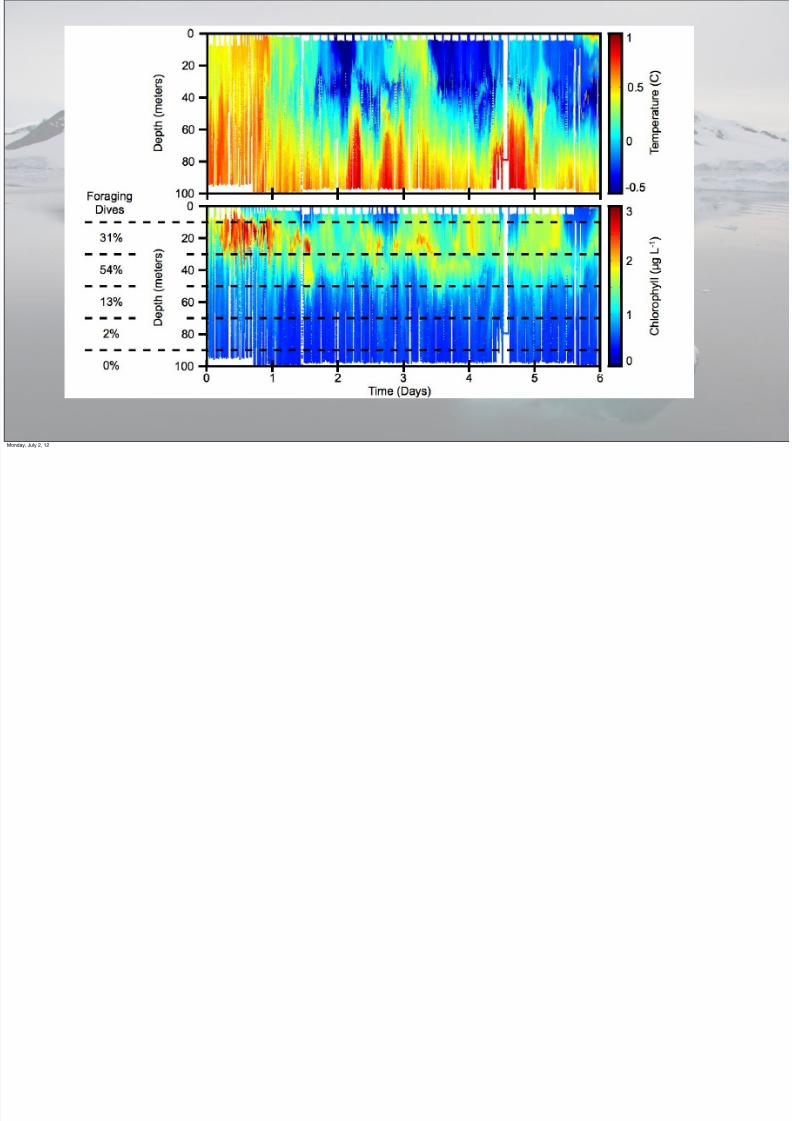
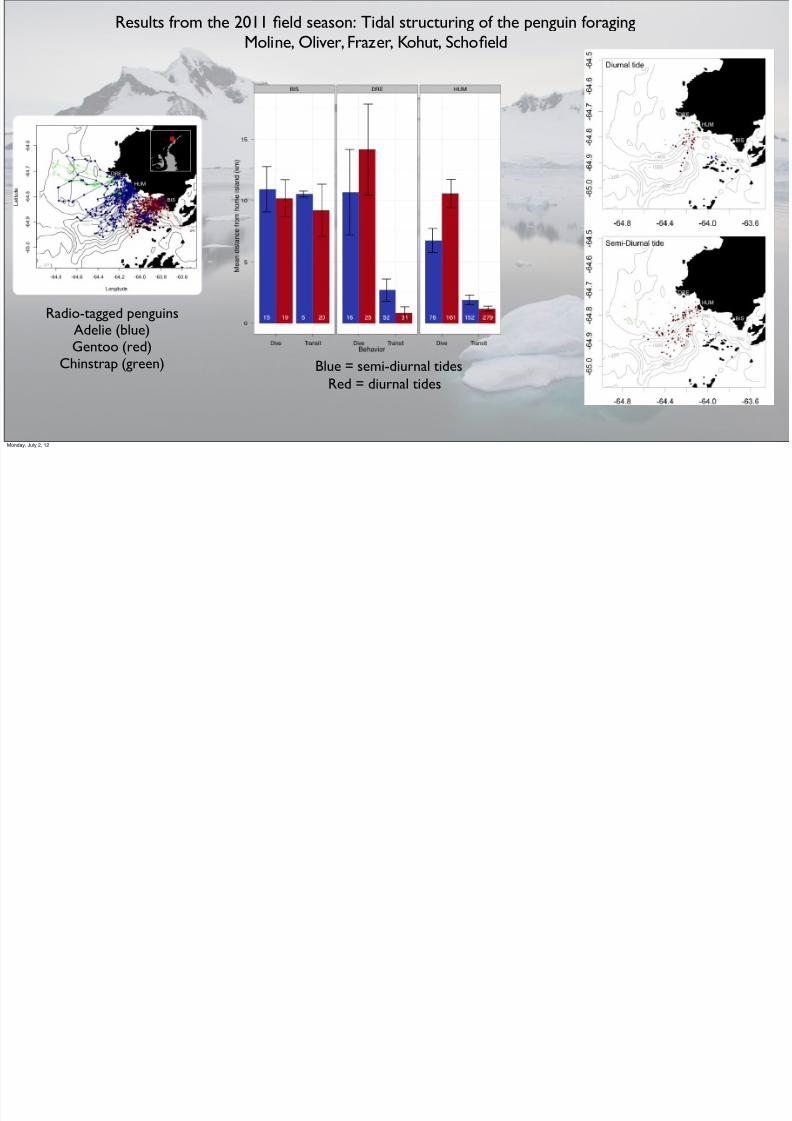
Results from the 2011 field season: Tidal structuring of the penguin foragingM li Oli F K h t S h fi ld
7/31/2019 C-MORE Schofield Lecture 2
http://slidepdf.com/reader/full/c-more-schofield-lecture-2 71/75
Moline, Oliver, Frazer, Kohut, Schofield
Radio-tagged penguinsAdelie (blue)Gentoo (red)
Chinstrap (green) Blue = semi-diurnal tides
Red = diurnal tides
Monday, July 2, 12
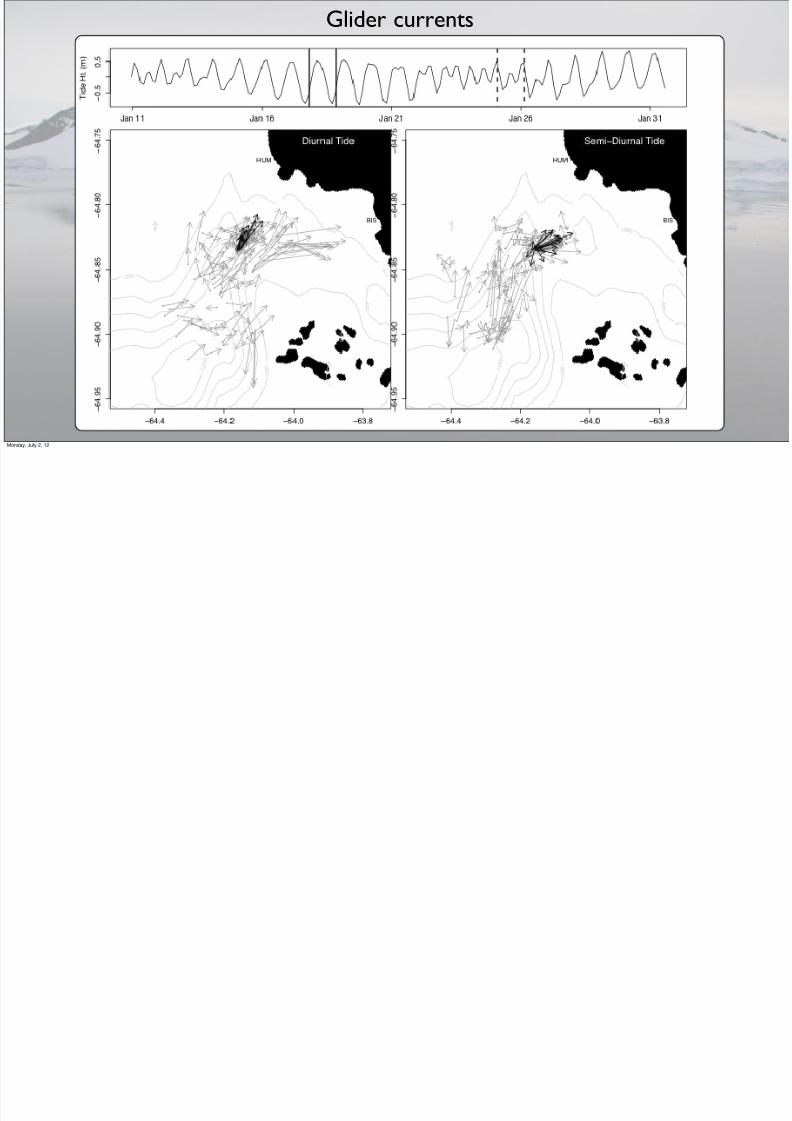
Glider currents
7/31/2019 C-MORE Schofield Lecture 2
http://slidepdf.com/reader/full/c-more-schofield-lecture-2 72/75
Monday, July 2, 12
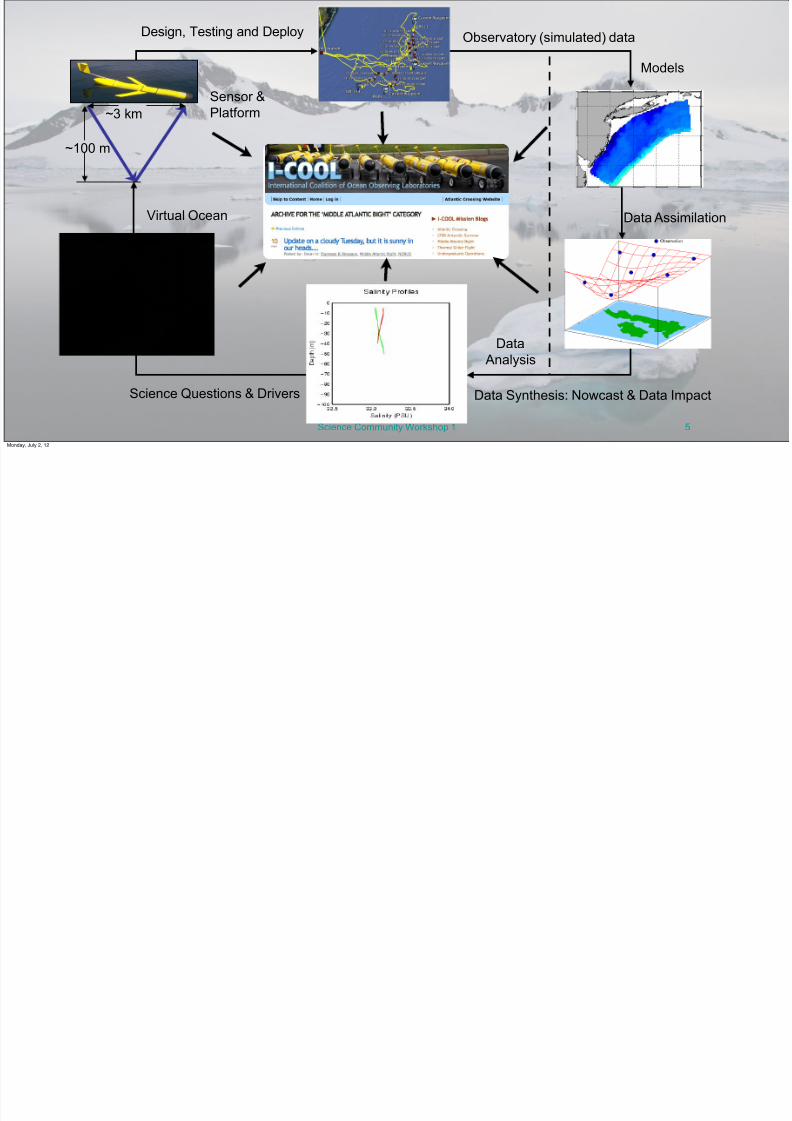
Observatory (simulated) dataDesign, Testing and Deploy
7/31/2019 C-MORE Schofield Lecture 2
http://slidepdf.com/reader/full/c-more-schofield-lecture-2 73/75
Science Community Workshop 1
Observatory (simulated) data
Virtual Ocean
M
Dat
Data
Analysis
Science Questions & Drivers
~100 m
~3 km
Sensor &
Platform
Data Synthesis: Nowcast & D
Monday, July 2, 12
7/31/2019 C-MORE Schofield Lecture 2
http://slidepdf.com/reader/full/c-more-schofield-lecture-2 74/75
Monday, July 2, 12
7/31/2019 C-MORE Schofield Lecture 2
http://slidepdf.com/reader/full/c-more-schofield-lecture-2 75/75


