by Stephanie Diamond · riencing increased consumer empowerment, global supply chains, aging...
51
Transcript of by Stephanie Diamond · riencing increased consumer empowerment, global supply chains, aging...


by Stephanie Diamond and Anuj Marfatia
Predictive Maintenance
IBM Limited Edition
These materials are the copyright of John Wiley & Sons, Inc. and any dissemination, distribution, or unauthorized use is strictly prohibited.

Predictive Maintenance For Dummies®, IBM Limited EditionPublished by John Wiley & Sons, Inc. 111 River St. Hoboken, NJ 07030-5774 www.wiley.com
Copyright © 2013 by John Wiley & Sons, Inc., Hoboken, New Jersey
No part of this publication may be reproduced, stored in a retrieval system or transmitted in any form or by any means, electronic, mechanical, photocopying, recording, scanning or otherwise, except as permitted under Sections 107 or 108 of the 1976 United States Copyright Act, without the prior written permission of the Publisher. Requests to the Publisher for permission should be addressed to the Permissions Department, John Wiley & Sons, Inc., 111 River Street, Hoboken, NJ 07030, (201) 748-6011, fax (201) 748-6008, or online at http://www.wiley.com/go/permissions.
Trademarks: Wiley, For Dummies, the Dummies Man logo, The Dummies Way, Dummies.com, Making Everything Easier, and related trade dress are trademarks or registered trademarks of John Wiley & Sons, Inc. and/or its affiliates in the United States and other countries, and may not be used without written permission. IBM and the IBM logo are registered trademarks of IBM. All other trademarks are the property of their respective owners. John Wiley & Sons, Inc., is not associated with any product or vendor mentioned in this book.
LIMIT OF LIABILITY/DISCLAIMER OF WARRANTY: THE PUBLISHER AND THE AUTHOR MAKE NO REPRESENTATIONS OR WARRANTIES WITH RESPECT TO THE ACCURACY OR COMPLETENESS OF THE CONTENTS OF THIS WORK AND SPECIFICALLY DISCLAIM ALL WARRANTIES, INCLUDING WITHOUT LIMITATION WARRANTIES OF FITNESS FOR A PARTICULAR PURPOSE. NO WARRANTY MAY BE CREATED OR EXTENDED BY SALES OR PROMOTIONAL MATERIALS. THE ADVICE AND STRATEGIES CONTAINED HEREIN MAY NOT BE SUITABLE FOR EVERY SITUATION. THIS WORK IS SOLD WITH THE UNDERSTANDING THAT THE PUBLISHER IS NOT ENGAGED IN RENDERING LEGAL, ACCOUNTING, OR OTHER PROFESSIONAL SERVICES. IF PROFESSIONAL ASSISTANCE IS REQUIRED, THE SERVICES OF A COMPETENT PROFESSIONAL PERSON SHOULD BE SOUGHT. NEITHER THE PUBLISHER NOR THE AUTHOR SHALL BE LIABLE FOR DAMAGES ARISING HEREFROM. THE FACT THAT AN ORGANIZATION OR WEBSITE IS REFERRED TO IN THIS WORK AS A CITATION AND/OR A POTENTIAL SOURCE OF FURTHER INFORMATION DOES NOT MEAN THAT THE AUTHOR OR THE PUBLISHER ENDORSES THE INFORMATION THE ORGANIZATION OR WEBSITE MAY PROVIDE OR RECOMMENDATIONS IT MAY MAKE. FURTHER, READERS SHOULD BE AWARE THAT INTERNET WEBSITES LISTED IN THIS WORK MAY HAVE CHANGED OR DISAPPEARED BETWEEN WHEN THIS WORK WAS WRITTEN AND WHEN IT IS READ.
For general information on our other products and services, or how to create a custom For Dummies book for your business or organization, please contact our Business Development Department in the U.S. at 877-409-4177, contact [email protected], or visit www.wiley.com/go/custompub. For information about licensing the For Dummies brand for products or services, contact BrandedRights&[email protected].
ISBN: 978-1-118-67971-5 (pbk); ISBN: 978-1-118-68921-9 (ebk)
Manufactured in the United States of America
10 9 8 7 6 5 4 3 2 1
These materials are the copyright of John Wiley & Sons, Inc. and any dissemination, distribution, or unauthorized use is strictly prohibited.

Table of ContentsIntroduction . . . . . . . . . . . . . . . . . . . . . . . . . . . . . . . . . . . . . .1
About This Book ........................................................................ 2Icons Used in This Book ............................................................ 2
Chapter 1: Understanding Predictive Maintenance . . . .3Defining Predictive Maintenance ............................................. 3Understanding Problems That Organizations Are Facing .... 6Looking at Use Cases for PdM .................................................. 9
Chapter 2: Identifying Typical Asset Applications . . . .11Identifying Assets ..................................................................... 11Discovering What Industries Can Benefit from PdM ........... 12
Chapter 3: Optimizing Process Performance . . . . . . . . .17Operations Is an Enterprise-Wide Responsibility ................ 18Recognizing the Importance of Quality ................................. 19Optimizing Inventory Management ....................................... 21Improving Financial Processes .............................................. 22Refining the Warranty Process............................................... 24
Chapter 4: Maximizing Employee Productivity . . . . . . .27Improving Employee Performance ........................................ 28Increasing Customer Satisfaction .......................................... 30
Chapter 5: Discovering How Technologies Work Together . . . . . . . . . . . . . . . . . . . . . . . . . . . . . . . . .31
Understanding the Analytical Process .................................. 32Clarifying Common Myths ...................................................... 35Choosing the Right Application ............................................. 36
Chapter 6: Ten Steps to Get Started with PdM . . . . . . .39
These materials are the copyright of John Wiley & Sons, Inc. and any dissemination, distribution, or unauthorized use is strictly prohibited.

Publisher’s AcknowledgmentsWe’re proud of this book and of the people who worked on it. For details on how to create a custom For Dummies book for your business or organization, contact [email protected] or visit www.wiley.com/go/custompub. For details on licensing the For Dummies brand for products or services, contact BrandedRights&[email protected]. Some of the people who helped bring this book to market include the following:
Acquisitions, Editorial, and Vertical WebsitesProject Editor: Carrie A. BurchfieldEditorial Manager: Rev MengleBusiness Development Representative:
Sue BlessingCustom Publishing Project Specialist:
Michael Sullivan
Composition ServicesSenior Project Coordinator: Kristie ReesLayout and Graphics: Carrie A. Cesavice,
Christin SwinfordProofreader: Robert SpringerSpecial Help: Beth Narrish,
Scott Groenendal, Ishan Sehgal
Publishing and Editorial for Technology DummiesRichard Swadley, Vice President and Executive Group PublisherAndy Cummings, Vice President and PublisherMary Bednarek, Executive Director, AcquisitionsMary C. Corder, Editorial Director
Publishing and Editorial for Consumer DummiesKathleen Nebenhaus, Vice President and Executive Publisher
Composition ServicesDebbie Stailey, Director of Composition Services
Business DevelopmentLisa Coleman, Director, New Market and Brand Development
These materials are the copyright of John Wiley & Sons, Inc. and any dissemination, distribution, or unauthorized use is strictly prohibited.

Introduction
O rganizations are looking at their operations and how to reduce costs more than ever before. They’re expe-
riencing increased consumer empowerment, global supply chains, aging assets, raw material price volatility, increased compliance, and an aging workforce. An area of opportunity for many organizations is a focus on their assets. Although organizations lack not only visibility but also predictability into their assets’ health and performance, maximizing asset productivity and ensuring that the associated processes are as efficient as possible are key aspects for organizations striving to gain strong financial returns.
In order for your physical asset to be productive, it has to be up, running, and functioning properly. Maintenance is a necessary function and directly affects the bottom line. If the asset fails or doesn’t work properly, it takes a lot of time, effort, and money to get it back up and running. If the asset is down, you can’t use it — for example, you can’t manufacture products, mine for minerals, drill for oil, and so on.
Maintenance has evolved with the technology, organizational processes, and times. Predictive maintenance (PdM), a software technology, is becoming more popular and mainstream for organizations. Several reasons for this include the following:
✓ Availability of large amounts of data due to more instrumented and connected assets
✓ Increased coupling of technology within businesses
✓ Requirements to do more with less — for example, stretching the useful life of an asset
✓ Relative ease of use of garnering insights from raw data
✓ Reduced cost of computing, network, and storage technology
✓ Convergence of Information Technology with operational technology
These materials are the copyright of John Wiley & Sons, Inc. and any dissemination, distribution, or unauthorized use is strictly prohibited.

Predictive Maintenance For Dummies, IBM Limited Edition 2PdM helps provide organizations with key insights regarding asset failure and product quality, enabling them to optimize their assets, processes, and employees. Organizations are realizing the value of PdM and how it can be a competitive advantage. Given the economic climate and pressure on everyone to do more with less, PdM is a welcome game-changer for most organizations.
About This BookWelcome to Predictive Maintenance For Dummies, IBM Limited Edition. In this book, we present the concepts you need to get started and quickly provide value to your organization by using PdM. The information in this book covers ideas, techniques, and best practices based on the experiences of IBM employees but isn’t intended to cover every single detail about the topic. We hope this book helps you enhance your assets and operational processes for increased profitability.
Icons Used in This BookThis book is written to provide you with basic yet key infor-mation about PdM. To help ensure that this is the case, we use the following icons:
If you see this icon on the page, you know that we found a spot in the content where we thought we could make some-thing easier or quicker for you to understand.
This icon represents information we want to alert you to remember. Hopefully, when you reach into your memory bank, this information comes to the surface.
The warning icon should alert you to something that requires your strict attention. Make sure to note it!
These materials are the copyright of John Wiley & Sons, Inc. and any dissemination, distribution, or unauthorized use is strictly prohibited.

Chapter 1
Understanding Predictive Maintenance
In This Chapter▶ Defining predictive maintenance▶ Dealing with asset downtime▶ Looking at use cases
I n today’s cutthroat and complex world, if an organization doesn’t produce a product or service efficiently, a
competitor will.
The need to balance costs, ensure maximum quality, and get the product to market as quickly as possible means that organizations have to be flexible enough to handle the evolving marketplace. One area that affects all those aspects is the management and maintenance of assets.
Because operations budgets are often the first to be cut, it no longer makes sense to employ a wait-for-it-to-break mentality. Executives say that the biggest impact on operations is failure of critical assets. In this chapter, we show you how predictive maintenance (PdM) helps.
Defining Predictive MaintenancePdM is an approach based on various types of information that allow maintenance, quality, and operational decision makers to predict when an asset needs maintenance. While
These materials are the copyright of John Wiley & Sons, Inc. and any dissemination, distribution, or unauthorized use is strictly prohibited.

Predictive Maintenance For Dummies, IBM Limited Edition 4preventative maintenance was popular in the 20th century, PdM is the focus of the 21st century. Many believe that PdM is focused purely on asset data, but it’s much more. It includes information from the surrounding environment in which the asset operates and the associated processes and resources that interact with the asset.
Fundamentally, PdM leverages various analytical techniques to provide better visibility of the asset to the decision maker(s). PdM gathers and analyzes various types of data to provide the following benefits:
✓ Identifies factors that are key predictors
✓ Determines the likelihood of predictive outcomes
✓ Optimizes decisions by systematically applying institutional knowledge
It’s important to understand the data that’s being analyzed. PdM is usually based on usage and wear characteristics of the asset, as well as other asset condition information.
Typical data includes (but isn’t limited to) the following:
✓ Measurement data
✓ Log data
✓ Failure data
Data comes in many different formats. The data can be at rest (meaning data that’s fixed and doesn’t change over time) or streaming (where data changes over time).
Structured dataStructured data is the most common data available that’s collected from such places as Customer Relationship Management (CRM) systems, Enterprise Resource Planning (ERP) systems, industrial control systems (such as SCADA), HR systems, financial systems, and information in data warehouses, relational databases, and Microsoft Excel.
These materials are the copyright of John Wiley & Sons, Inc. and any dissemination, distribution, or unauthorized use is strictly prohibited.

Chapter 1: Understanding Predictive Maintenance 5
Relational databases house data that’s collected from systems that have data sets in tables. Examples of this include inventory information, production line information, financial information, and specifically data such as asset name, asset location, last time maintenance was conducted, type of main-tenance conducted, and operator information.
Unstructured dataText data in the form of e-mails, maintenance and operator logs, social media data, and other free-form data that’s available today in limitless quantities is unstructured data. Most organizations aren’t sure how to utilize this data. To accommodate this data, a text analytics program must be in place to make the content useable. An example of this could be the data from operators’ logs regarding asset performance.
Looking at Big DataYou may come across the term Big Data. Every day 2.5 quintillion bytes of data are created. Just to get a visual idea of that number, imagine that everyone in the world had eight 32GB tablets stored with info. That’s how much data we’re talking about. Now that’s a lot of data!
Big Data spans four primary dimensions:
✓ Volume: Large amount of data to process
✓ Velocity: Incoming speed of data
✓ Variety: Data in many different formats
✓ Veracity: Uncertainty about the data
After gaining benefits from PdM, you’ll be able to add the fifth dimension of V — Victory!
When you look at where this explosive data growth is coming from, you see that it’s messy stuff: text, images, videos, audio, and sensor data. PdM must deal with all four dimensions of data for it to produce meaningful and actionable recommendations.
These materials are the copyright of John Wiley & Sons, Inc. and any dissemination, distribution, or unauthorized use is strictly prohibited.

Predictive Maintenance For Dummies, IBM Limited Edition 6
Streaming dataStreaming data is information that needs to be collected and analyzed in real time. It includes information from sensors, satellites, and programmable logic controllers (PLCs), which are digital computers used for automation of electromechanical processes, such as control of machinery on factory assembly lines, amusement rides, or light fixtures. Examples of stream-ing data include telematic, measurement, and weather infor-mation — this format is currently gaining the most traction as the need for quick decision making grows.
Understanding Problems That Organizations Are Facing
Imagine that you’re driving your car to work. You’re already running a few minutes late, and you finally get through traffic and see the road ahead. Just as you accelerate, a car brakes ahead of you. As you hit the brake pedal, you realize that your car isn’t braking! You panic and hit the pedal a few more times, including the emergency brake, without any luck. The red brake light on the dashboard blinks every time you hit the brake pedal, but you already know that the brake has failed. What do you do?
If this happens to you, try to focus on your surroundings and think of a way out. Also, don’t purchase another car from the same manufacturer. While we hope that you are never in such a situation, many organizations deal with panic situations every day — a failed manufacturing line, an electrical grid fail-ure, or a stalled oil drill.
Everyone in an organization is affected by equipment break-downs whether they’re aware of it or not because productiv-ity is hampered, costs for repairs go sky high, and revenue is impacted. This includes C-level executives, directors of opera-tions, finance, and sales, and the business analyst — even the janitor.
These materials are the copyright of John Wiley & Sons, Inc. and any dissemination, distribution, or unauthorized use is strictly prohibited.

Chapter 1: Understanding Predictive Maintenance 7 For example, in a typical manufacturing situation, you often
see the following scene play out:
1. A production asset stops working.
If this happens, try to remain calm. The last thing you want is to run around like a chicken with its head cut off.
2. The machine operator looks at the monitor and reac-tively starts taking action, which may include press-ing buttons.
Randomly pressing buttons is a trial-and-error method and usually doesn’t give you a high probability of success.
3. The manufacturing engineer comes over and decides on options with the production line supervisor.
This is where the organization starts to balance pro-duction schedules against time to fix the problem.
4. Next, the maintenance staff is notified of the issue.
There is often second-guessing, finger-pointing, and temporary workarounds to fix the problem. That is a waste of time. Focus on solving the problem instead of placing blame.
5. Decision making is based primarily on experience.
This may fix the problem. If not, the machine manufac-turer is called in, and the machine is moved to another location for repair, or the machine is cordoned off so it’s not a safety hazard. If you need to call the machine manufacturer, plan to not run the machine until the next day and allocate money to pay for the services.
This scenario uses up a lot of time, money, resources, and effort. If the problem could’ve been anticipated, much could’ve been saved. The organization now runs the risk of impacting its delivery dates, quality, and other unexpected secondary problems.
What if you could accurately identify the characteristics that affect downtime before asset failure? While it’s important for the brake light on your car to blink red when the brakes don’t
These materials are the copyright of John Wiley & Sons, Inc. and any dissemination, distribution, or unauthorized use is strictly prohibited.

Predictive Maintenance For Dummies, IBM Limited Edition 8work, it’s much more valuable to know when the brakes are most likely to fail so you can plan accordingly.
Organizations have been trying to solve this problem for decades, and the pressure to solve it is getting worse. An Aberdeen Group report found that there were significant pressures being placed on managers to get more from their assets. The top pressures are noted in Figure 1-1.
Figure 1-1: The top managerial pressures.
In order to gain more from less, historically most organizations try to leverage some sort of preventative maintenance — fixing assets based on a predetermined schedule or reactive maintenance — just reacting to asset failure. While decision-making is still based on manual processes and gut-feel, most use the following to various degrees of sophistication to guide their decisions:
✓ Spreadsheets
✓ Alerting systems
✓ Operator, maintenance, and incident logs
✓ Beginning and ending shift meetings
As a company matures, it begins to understand the need to get proactive to save both time and money. It recognizes the need to be able to predict with some certainty. It notices that it’s already collecting a lot of data, and it can be used to gain insight.
Every organization has the capability to move along a path to maintenance maturity (shown in Figure 1-2).
These materials are the copyright of John Wiley & Sons, Inc. and any dissemination, distribution, or unauthorized use is strictly prohibited.

Chapter 1: Understanding Predictive Maintenance 9
Figure 1-2: The Maintenance Maturity Model.
It doesn’t matter where you are on the maturity scale now. It matters where you want to be tomorrow and in the future.
Looking at Use Cases for PdMThere are two primary use cases where PdM can apply — asset failure and product quality. Leveraging analytics to predict when and how an asset is going to fail and determining those components or products that are anomalies can provide many benefits to organizations.
Predicting asset failure and extending lifeThere’s growing recognition that the ability to predict asset failure has great long-term value for an organization. The benefits include the ability to
✓ Optimize maintenance intervals
✓ Minimize unplanned downtime
These materials are the copyright of John Wiley & Sons, Inc. and any dissemination, distribution, or unauthorized use is strictly prohibited.

Predictive Maintenance For Dummies, IBM Limited Edition 10 ✓ Uncover in-depth root cause analysis of failures
✓ Enhance equipment and process diagnostics capabilities
✓ Determine optimum corrective action procedures
Predicting part and production qualityQuality issues are at the forefront for every manufacturing company. Reputations can be damaged when quality is questioned. To mitigate this concern, analytics can be used for the following:
✓ Reduce part inspection frequency and lot size requirements
✓ Understand, monitor, predict, and control process variability
✓ Reduce scrap and rework
✓ Identify production uniformity issues
✓ Identify supplier part anomalies impacting yield
PdM is critical to asset management and maintenance because it allows organizations to reduce costs, improve efficiencies, and increase productivity.
While organizations may be focused on reducing costs with PdM, by improving maintenance and quality, they can inherently increase customer satisfaction. Products are produced with high quality, get out the door on time with fewer production failures, and lead to increased revenues. Ultimately, PdM provides a benefit to both sides of the profit equation.
These materials are the copyright of John Wiley & Sons, Inc. and any dissemination, distribution, or unauthorized use is strictly prohibited.

Chapter 2
Identifying Typical Asset Applications
In This Chapter▶ Defining types of assets▶ Looking at asset-intensive industries
O rganizations are getting a lot of value from predictive maintenance (PdM) and are using it as a competitive
differentiator. Because PdM primarily focuses on asset health, in this chapter, you find out more about these assets — how to define them, what industries can benefit the most, and examples of how companies can leverage PdM.
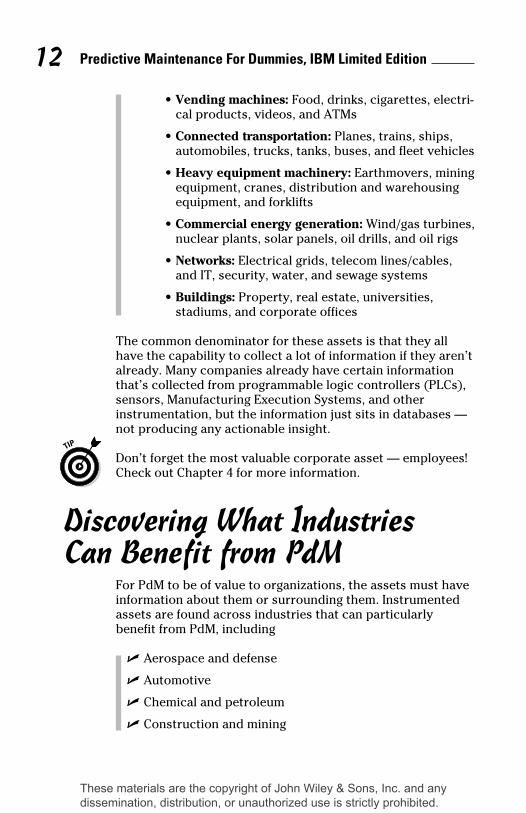
Identifying AssetsPdM is primarily focused on physical assets. Physical assets can be categorized in the following way:
✓ Manufacturing assets: These include production line and assembly machinery used to create a product. Some examples are milling, forming, molding, and casting machines; computer numerically controlled (CNC) machines; dies, presses, lathes, and welding machines; and robotic arms.
✓ Field-level assets: These can further be sub-categorized:
•Consumer appliances: Washers, dryers, hot water heaters, dishwashers, furnaces, air conditioners, and HVAC systems
These materials are the copyright of John Wiley & Sons, Inc. and any dissemination, distribution, or unauthorized use is strictly prohibited.
Predictive Maintenance For Dummies, IBM Limited Edition 12 •Vending machines: Food, drinks, cigarettes, electri-
cal products, videos, and ATMs
•Connected transportation: Planes, trains, ships, automobiles, trucks, tanks, buses, and fleet vehicles
• Heavy equipment machinery: Earthmovers, mining equipment, cranes, distribution and warehousing equipment, and forklifts
• Commercial energy generation: Wind/gas turbines, nuclear plants, solar panels, oil drills, and oil rigs
• Networks: Electrical grids, telecom lines/cables, and IT, security, water, and sewage systems
•Buildings: Property, real estate, universities, stadiums, and corporate offices
The common denominator for these assets is that they all have the capability to collect a lot of information if they aren’t already. Many companies already have certain information that’s collected from programmable logic controllers (PLCs), sensors, Manufacturing Execution Systems, and other instrumentation, but the information just sits in databases — not producing any actionable insight.
Don’t forget the most valuable corporate asset — employees! Check out Chapter 4 for more information.
Discovering What Industries Can Benefit from PdM
For PdM to be of value to organizations, the assets must have information about them or surrounding them. Instrumented assets are found across industries that can particularly benefit from PdM, including
✓ Aerospace and defense
✓ Automotive
✓ Chemical and petroleum
✓ Construction and mining
These materials are the copyright of John Wiley & Sons, Inc. and any dissemination, distribution, or unauthorized use is strictly prohibited.
Chapter 2: Identifying Typical Asset Applications 13 ✓ Electronics
✓ Energy and utilities
✓ Government agencies
✓ Healthcare
✓ Telcos
This section exhibits how various organizations can gain value from PdM for their manufacturing and field-level assets.
Electronics manufacturer predicts asset healthAn electronics manufacturing company builds processor chips. Various automated machinery is involved in the process from initial fabrication to final output. If a robot goes down, it can cause millions of dollars in lost revenue and robot fixes.
Management and the production line supervisor wanted better insight about the functioning of the robots. By utilizing the information collected by sensors and incorporating previous history on stoppages, corrective actions, and their outcomes, they were able to use PdM to predict when a robot would fail and which specific component needed to be replaced.
Energy provider keeps the power onKeeping the lights on for an entire country is no small feat. Complex equipment, volatile demand, unpredictable weather, and other factors can combine in unexpected ways to cause power outages. An energy provider used PdM to understand when and why outages occurred so it could take steps to pre-vent them. Streaming meter data helped the provider analyze enormous volumes of historical data to uncover usage pat-terns. PdM helped define the parameters of normal operation for any given time of day, day of the week, holiday, or season and detected anomalies that signaled a potential failure.
These materials are the copyright of John Wiley & Sons, Inc. and any dissemination, distribution, or unauthorized use is strictly prohibited.

Predictive Maintenance For Dummies, IBM Limited Edition 14Historical patterns showed that multiple factors in combina-tion increased the likelihood of an outage. When national events caused a spike in energy demand and certain turbines were nearing the end of their life cycle, there was a higher likelihood of an outage. This foresight helped the company take immediate action to avoid an imminent outage and schedule maintenance for long-term prevention. With PdM, this energy provider
✓ Reduced costs by up to 20 percent (based on similar previous cases) by avoiding the expensive process of reinitiating a power station after an outage
✓ Predicted turbine failure 30 hours before occurrence, while previously only able to predict 30 minutes before failure
✓ Saved approximately $100,000 in combustion costs by preventing the malfunction of a turbine component
✓ Increased the efficiency of maintenance schedules, costs and resources, resulting in fewer outages and higher customer satisfaction
Petroleum company avoids dangerous ice floesA large multinational company that explores and produces oil and gas conducts exploration in the Arctic. Drilling locations are often remote, and landfall can be more than 100 miles away. Further, the drilling season is short — typically between July and October.
The most considerable dangers that put people, platforms, and structures at risk are colliding with or being crushed by ice floes, which are flat expanses of moving ice that can mea-sure up to six miles across. Should a particularly thick and large ice floe threaten a rig, companies typically have less than 72 hours to evacuate personnel and flush all pipelines to protect the environment.
Although most rigs and structures are designed to withstand some ice-floe collisions, oil producers often deploy tugboats and icebreakers to manage the ice and protect their rigs and
These materials are the copyright of John Wiley & Sons, Inc. and any dissemination, distribution, or unauthorized use is strictly prohibited.

Chapter 2: Identifying Typical Asset Applications 15platform investments. This is easily warranted: a single oil rig costs $350 million and has a life cycle that can span decades.
To better safeguard its oil rigs, personnel, and resources, the company had to track the courses of thousands of moving potential hazards. The company utilized PdM by analyzing direction, speed, and size of floes using satellite imagery to detect, track, and forecast the floe trajectory. In doing so, the company
✓ Saved roughly $300 million per season by reducing mobi-lization costs associated with needing to drill a second well should the first well be damaged or evacuated
✓ Saved $1 billion per production platform by easing design requirements, optimizing rig placement, and improving ice management operations
✓ Efficiently deployed icebreakers when and where they were needed most
University conserves energyA university with over 60 campus buildings wanted to go beyond the standards required for the Leadership in Energy and Environmental Design (LEED) certification program to fur-ther reduce energy consumption, as well as reduce costs.
The university utilized historic energy consumption, building characteristics, occupancy and activities, historic weather behavior, energy pricing, greenhouse gas emissions, and the output from sensors and meters. With PdM it
✓ Optimized energy use and scheduling of energy consumption
✓ Provided the ability to conduct what-if scenarios for estimating the impact of energy-saving initiatives and behaviors
✓ Targeted opportunities for reducing the campus’ carbon footprint and greenhouse emissions
These materials are the copyright of John Wiley & Sons, Inc. and any dissemination, distribution, or unauthorized use is strictly prohibited.

Predictive Maintenance For Dummies, IBM Limited Edition 16
These materials are the copyright of John Wiley & Sons, Inc. and any dissemination, distribution, or unauthorized use is strictly prohibited.

Chapter 3
Optimizing Process Performance
In This Chapter▶ Understanding the role of Operations▶ Looking at why quality matters▶ Managing inventory▶ Recognizing how the financial process is affected▶ Dealing with the warranty process
P redictive maintenance (PdM) starts with understanding the data related to the asset. As an organization gains
insight about its asset data and its surroundings, that can lead to increased understanding and better performance of business processes associated with those assets. While PdM is focused on reducing costs and improving efficiencies, organizations that focus on PdM can ultimately improve customer satisfaction and increase revenues. If organizations ensure that their assets are functioning as they should and they proactively identify potential issues, their processes can become more optimized. Ultimately, they’re able to provide a higher-quality product on time to the customer.
In this chapter, you look at business processes that organizations face every day. Those processes include quality, inventory, financial, and warranty. Another key process — human resources — is covered in Chapter 4.
These materials are the copyright of John Wiley & Sons, Inc. and any dissemination, distribution, or unauthorized use is strictly prohibited.

Predictive Maintenance For Dummies, IBM Limited Edition 18
Operations Is an Enterprise-Wide Responsibility
Before you dive into the processes, you may want to under-stand how organizational processes are interconnected and how they impact every part of the organization. Operations is an enterprise-wide responsibility, and everyone plays a part in making the enterprise a success.
To understand how these processes each play a role, take a look at a practical example. Customers have numerous choices when purchasing a car. While the process may not be fun as a consumer, it’s fairly straightforward. After research-ing online, speaking with friends, visiting dealerships, and test-driving various cars, the consumer determines which one to purchase. After negotiating, the consumer completes paperwork and then provides a form of payment. The con-sumer then drives off with a new car.
But, from an organizational standpoint, many processes have to run smoothly to ensure that the customer has an enjoyable experience before, during, and after the purchase:
✓ Marketing informs Product Development of what features should be included in the next vehicle launch.
✓ Product Development designs the car with its specifications.
✓ Manufacturing producs the highest quality possible.
✓ Marketing creates a buzz in the market and determined the price.
✓ Sales leverages dealerships to interact with customers and closes the sale.
✓ Distribution makes sure that the right car is available at the right dealership.
✓ Customer Service ensured that it had the right answers for its customers in case there are issues.
✓ Finance guarantees that profitability is a focus for each vehicle.
✓ Human Resources trains employees in all departments to excel in their jobs.
These materials are the copyright of John Wiley & Sons, Inc. and any dissemination, distribution, or unauthorized use is strictly prohibited.

Chapter 3: Optimizing Process Performance 19 ✓ IT secures properly functioning computers, applications,
and websites for all parties.
Assets are an important part of these processes. If the asset is malfunctioning or not working at all, various processes can be impacted quickly, and the car could be unusable by the customer. In an ideal world, all departments work in a stream-lined and efficient manner. This reduces costs for the organi-zation and meets consumer demands.
Recognizing the Importance of Quality
One department that’s interconnected with asset failure is Quality. Maximizing quality has always been a costly issue for manufacturing. The key to reducing costs is to quickly deter-mine the problem and embed the quality control process into the front end of the system instead of having to inspect and scrap defective products on the back end. When an asset fails, overall product quality may decrease because side processes are created to ensure that production schedules are met.
For example, if a production line asset fails, a lean cell may be created, where employees manually assemble certain parts in a specific area, instead of having the machine do it in a pro-duction line. Employees can’t guarantee the quality of every single product at the scale a machine can, so in this scenario quality takes a back seat.
To those focused on quality, PdM provides two key benefits:
✓ Identifies small deviations and patterns in the informa-tion that can cause big problems down the line
✓ Enables better root cause analysis because it can provide not only metrics for Key Performance Indicators (KPI) but also Key Performance Predictors (KPP)
Even if PdM doesn’t get you to a final answer, it does help pri-oritize where organizations can focus their time.
These materials are the copyright of John Wiley & Sons, Inc. and any dissemination, distribution, or unauthorized use is strictly prohibited.
Predictive Maintenance For Dummies, IBM Limited Edition 20
Automotive manufacturer maintains quality levels
An engine block manufacturer began seeing uniformity problems on its production line. A high number of engine blocks were produced with minor cracks and had to be recycled or scrapped. In such instances, the company usually goes through a time-consuming process of stopping the machine/line, moving it to another area of the plant, breaking the complete line down to find the problem, and reassembling it. Instead, the manufacturer utilized PdM for both asset maintenance and production quality to analyze the following:
✓ Chamber conditions such as temperature and cabin pressure
✓ How long the asset had been continuously working
✓ The speed of the conveyor belt
✓ Previous fixes conducted
✓ Conditions surrounding the asset such as ambient temperature, humidity, and liquid chemical composition
With PdM, the company determined that almost all failures occurred during the afternoon and also when there was a spike in humidity. The team discovered that the manufacturing line was below a window, and during the afternoon, the sunlight hit the asset and its surrounding environment, causing humidity fluctuations. The humidity caused subtle changes in the chemical composition of the liquid metal, causing the engine block to crack at the end of the process. So the manufacturer installed a window shade on that particular window. This simple solution reduced costs and improved quality. By using PdM to solve the problem, the company reduced the scrap rate by 80 percent in 12 weeks.
The benefits of PdM in the realm of Quality include the following:
✓ Higher-quality output
✓ Reduced quality costs
✓ Improved root-cause identification
✓ Increased customer satisfaction
These materials are the copyright of John Wiley & Sons, Inc. and any dissemination, distribution, or unauthorized use is strictly prohibited.

Chapter 3: Optimizing Process Performance 21
Optimizing Inventory ManagementInventory management is an important issue for all compa-nies. Inventory ties up a large portion of an organization’s budget in raw materials, work-in-progress goods, and goods awaiting packaging and shipping. In addition, there are car-rying costs and the cost of managing and maintaining the inventory. Because many organizations are focused on cutting costs, companies are solving this problem by optimizing their inventory. (Inventory refers to both the inventory of goods and of spare parts for the asset.) This means that they have to constantly balance how much of each part they keep on hand.
When an asset fails, production is negatively affected. For example, if an assembly machine on the manufacturing floor can’t function, finished goods can’t be produced. Additionally, manufactured subcomponents or parts from suppliers need to slow down; otherwise, there can be a glut of those parts wait-ing on the failed asset — adding waste and cost in the system. Also, the organization needs to know that it has enough spare parts for the specific asset that failed so the maintenance team can fix the asset as soon as possible.
With PdM, organizations can predict what spare parts are needed for which asset. They can also optimize inventory levels throughout every phase of the supply chain, from sub-suppliers to warehouses to retailers. Some data that could be analyzed to improve inventory includes the following:
✓ Existing spare parts for each asset
✓ Supplier information of spare parts
✓ Costs to attain/manufacture certain parts
✓ Supplier info regarding component delivery schedules
✓ Existing work-in-progress and finished goods info in warehouses and manufacturing facilities
✓ Finished goods at retailers
✓ Expected demand of product
These materials are the copyright of John Wiley & Sons, Inc. and any dissemination, distribution, or unauthorized use is strictly prohibited.
Predictive Maintenance For Dummies, IBM Limited Edition 22
Crane manufacturer improves spare parts inventory
When cranes fail in the field, much time is lost on the job due to repairs. To combat that, a crane manufacturer spent $2 million each year in spare parts and stored them in its warehouse. The company didn’t know exactly what parts it would need, so it kept the recommended parts based on manufacturers’ suggestions and employee experience. To avoid extended downtime situations, it also warehoused some additional parts that had a two-week lead time.
Every year, the manufacturer noticed that its actual versus planned inventory wildly fluctuated — to the
tune of hundreds of thousands of dollars. By using PdM, the company analyzed its own specific usage data, such as boom angle, loading weight, and operator information, and determined causes of failures and better understood the interactions with the operator. This led to
✓ Better allocation of the budget for spare parts inventory
✓ Optimal usage of spare parts inventory
✓ Increased operator training
✓ The ability to focus the budget on hiring and innovation
The benefits include the following:
✓ Reducing inventory costs by optimizing inventory levels
✓ Increasing cash flow by reducing working capital invested in inventory
✓ Improving customer service levels with better availability
✓ Enhancing facility production
✓ Predicting how much and when to make to order and make to stock
Improving Financial ProcessesWhen assets are involved, an important stakeholder is the finance department. They’re interested when assets such as a plant machine or an oil drill aren’t functioning properly. Ideally, they know when the assets were purchased and
These materials are the copyright of John Wiley & Sons, Inc. and any dissemination, distribution, or unauthorized use is strictly prohibited.

Chapter 3: Optimizing Process Performance 23managed, when they need to be decommissioned, and when another asset needs to be purchased to replace it.
Most finance departments don’t have information about the asset until it’s too late — until it fails and Production or Field Operations has to obtain large funding for an immediate pur-chase. As you can imagine, Finance doesn’t like to be in this situ-ation. So most organizations budget for upcoming maintenance and parts inventory regarding their assets. Unfortunately, bud-geting tends to be more art than science at times.
By using PdM, organizations can feed the latest information regarding an asset directly to financial systems and processes so Finance gets a real-time view of asset performance and can update its budget accordingly throughout the year. Additionally, understanding when an asset will fail also improves an organi-zation’s sales and operations (S&OP) processes.
A properly implemented S&OP process routinely reviews cus-tomer demand and supply resources. It reassesses the orga-nization’s current state against corporate metrics, and it also monitors the execution of the company’s strategies.
With PdM, organizations can ultimately ensure that their production schedules can meet consumer demand. By using PdM, organizations can
✓ Increase the accuracy of budget plans
✓ Enable more movement of allocations from capital expen-ditures (CAPEX) to operational expenditures (OPEX)
✓ Drive an effective S&OP process that integrates demand, supply, and financial plans for better executive decision making
✓ Analyze customer, product, market, and channel profitability to optimize customer service and financial performance
✓ Comply with legislation (for example, SOX) and regula-tory requirements (for example, OSHA and EPA)
✓ Enable reallocation of funds for increased R&D or hiring
To understand how this works, look at a multinational com-pany that develops a wide range of agricultural products and solutions. The company wanted to:
These materials are the copyright of John Wiley & Sons, Inc. and any dissemination, distribution, or unauthorized use is strictly prohibited.

Predictive Maintenance For Dummies, IBM Limited Edition 24 ✓ Reduce the number of reporting systems
✓ Streamline infrastructure
✓ Optimize data assets for global consistency and timelines
✓ Implement a system for planning and financial consolidation
✓ Improve supply chain operations to optimize inventory
✓ Synchronize global communication and collaboration both internally and externally with customers and suppliers
The company utilized PdM by getting information from its manufacturing machines and incorporating that into its processes. Now the global organization has consistent information for improved collaboration. This leads to more customer-focused product improvements, better customer service, and shorter lead times. It also eliminated previous manual efforts and spreadsheets. It has significantly increased productivity, which allows employees to focus more time on analytics — delivering improved decisions and outcomes. They’ve accomplished the following:
✓ Enhanced reporting capabilities and reduction of reports from approximately 450 to 50 in a single business area
✓ Streamlined report production environment
✓ Improved maintenance
Refining the Warranty ProcessPdM can also help organizations with their returns and war-ranty processes. Basically, a purchase return is made when a customer isn’t satisfied with the performance of a product and wants some action taken. Increasing complexities in manufacturing and operations has taken a toll on quality and warranty costs. Manufacturers spend anywhere from 0.5 to 7 percent of product revenue on warranty claims.
When there’s an asset failure, it may produce bad-quality parts, which eventually find their way to the consumer. The consumer may then return the product. PdM can help provide visibility into the return and help determine whether it in fact was due to an asset issue. Also, because PdM helps improve quality processes, inherently warranty issues will decrease.
These materials are the copyright of John Wiley & Sons, Inc. and any dissemination, distribution, or unauthorized use is strictly prohibited.

Chapter 3: Optimizing Process Performance 25Because the answer lies in the data, organizations need to look at their quality and warranty information, which may reside in their customer relationship management, call center, and enterprise resource planning systems.
With PdM, organizations can accomplish the following:
✓ Identify upcoming warranty issues and perform associ-ated root cause analysis
✓ Identify when an asset is likely to produce parts that will become warranty issues
✓ Predict the optimal warranty terms (based on cost)
✓ Predict total warranty costs for next year and subse-quent years, including vendors and suppliers
For example, a world leader in HVAC (heating, ventilation, air conditioning) systems offers a ten-year warranty and mainte-nance service for its HVAC components. That warranty is ful-filled through a network of certified service dealers. Though beneficial to customers, the warranty creates a web of inef-ficiencies and risk:
✓ Each division uses its own warranty system, which results in high costs, redundant support staff, and exten-sive complexity.
✓ Processing claims is labor-intensive and slow.
✓ Widespread product defects are undetected for too long, causing expensive delays in recalls.
✓ The company is vulnerable to fraud and financial loss.
For all the data generated by the warranty systems, the company was unable to unlock the insights within. It needed to understand the underlying patterns and spot the outliers, judging each claim within a larger context to improve accuracy and reduce financial risk. It also needed a way to extract deep intelligence from that data so it could identify root causes of problems, predict claim rates, and project the life expectancies of individual components.
When a furnace stops heating in the middle of winter, the owner is bound to make a warranty claim. But how does a provider verify the claim is valid? This HVAC provider uses PdM to understand the patterns underlying the constant influx of warranty claims.
These materials are the copyright of John Wiley & Sons, Inc. and any dissemination, distribution, or unauthorized use is strictly prohibited.
Predictive Maintenance For Dummies, IBM Limited Edition 26The solution aggregates customer claims, dealer service reports, and real-time data from sensors on installed HVAC components that automatically communicate component fail-ures, defects, and other info to the central web-based system. By integrating network of devices with the central claims pro-cessing system, the company can recognize patterns in claim volume, product wear, defects, and more. PdM allows the organization to
✓ Spot trends and anomalies that help the company vali-date individual claims for faster processing
✓ Identify defective parts that may require a recall
✓ Project the lifespan of equipment
By using both regularly scheduled and ad-hoc reports, the company can spot trends and anomalies in product perfor-mance in the field, pinpoint root causes, and take corrective actions. If a dip in performance is related to date of manufac-ture, claim date, or a particular distributor, dealer or region, the company can see that, too.
For example, analysis may show that a particular furnace coil is 25 percent likely to fail after five years. Any claim involving this component in the expected timeframe will be recognized as legitimate and expedited accordingly. A claim that doesn’t match any known failure patterns, on the other hand, is flagged for investigation before any payments are issued.
With PdM, the company was able to
✓ Identify those factors that led to HVAC failure
✓ Reduce warranty claim processing times by 20 to 30 percent, which increased internal efficiency and boosted customer satisfaction
✓ Reduce support personnel required to maintain multiple warranty systems by 5 to 10 percent, thereby eliminating duplicate efforts and lowering costs
Warranty info is usually stored and available within an organi-zation, although few organizations analyze that in conjunction with other info such as production and quality.
These materials are the copyright of John Wiley & Sons, Inc. and any dissemination, distribution, or unauthorized use is strictly prohibited.

Chapter 4
Maximizing Employee Productivity
In This Chapter▶ Focusing on employee performance▶ Linking PdM to customer satisfaction
A sk yourself the following question: “If you’re expanding your company, should you focus on your customers,
employees, or financials?” Conventional wisdom indicates employee satisfaction has a large impact on customer satis-faction and profits because if an organization focuses on its employees by ensuring they’re properly trained and incentiv-ized, that training makes happier employees, which in turn makes happier customers, and the company will tend to be profitable.
The focus of predictive maintenance (PdM) is physical asset performance and failure and its associated processes. One key aspect that tends to be overlooked, but is critical to ensure PdM sustainability, is Human Resources. Every asset is managed, maintained, and run by an operator or employee. PdM enables organizations to ensure that they have the right employee assigned to the right asset.
In this chapter, you discover how PdM can help ensure you’re making the right decisions for your employees, so they can maximize their performance.
These materials are the copyright of John Wiley & Sons, Inc. and any dissemination, distribution, or unauthorized use is strictly prohibited.

Predictive Maintenance For Dummies, IBM Limited Edition 28
Improving Employee Performance
When an asset fails, failure could be caused by problems with the machine, process, or operator. The process of determin-ing if the root cause was in fact operator error can be a stressful situation.
The value of using a PdM framework is that it gives manag-ers enough information to evaluate employees and help them improve their performance. No guesswork or favoritism is involved. More significantly, it can also measure how effective an employee is. It can take machine readings, logs, and sen-sors and see how the physical assets performed while being operated by that employee.
Employees can be defensive in the face of accusations. Therefore, it’s even more important that operator information be also included as part of PdM. Many organizations already have enough information about employees either in their HR, ERP, or manufacturing databases. They just haven’t analyzed the information in coordination with other data they may have access to.
Some typical types of operator information include
✓ Name
✓ Work duration
✓ Previous asset experience
✓ Training courses taken
✓ Previous asset failures and corrective actions taken
The data tells the tale. For example, if a machine consistently fails when the same employee operates it, the data can tell you whether it’s related to something he’s doing when operat-ing the machine. There may be no correlation, or it may be the root cause, but PdM can tell you which is at play.
These materials are the copyright of John Wiley & Sons, Inc. and any dissemination, distribution, or unauthorized use is strictly prohibited.

Chapter 4: Maximizing Employee Productivity 29
PdM improves trucker accident ratesThe long-distance trucking business gives new meaning to the phrase remote assets. Among trucking companies’ most important assets are the people who drive the trucks, followed by the trucks themselves. When it comes to their trucks on the roads, operators have a lot to look at. First and foremost is safety, measured not only by fatalities and injuries resulting from accidents but also by the financial costs that such accidents represent in the form of lost cargo, delayed delivery, insurance premiums, and workers’ compensation payments. With the number of deaths rising nearly 25 percent annually and the number of commercial trucks on the road growing by roughly 20 percent annually, there’s a strong incentive for trucking operators to do what they can to encourage safe driving among employees.
Because drivers are hundreds or even thousands of miles away from company headquarters, the options for trucking companies to actively manage their all-important driver fleet are constrained. The key challenge is figuring out what they
can do to prevent accidents, given that no two drivers are exactly alike.
Whether it’s vehicle data from telematics, safety records from internal systems, or scheduled load assignments, the company saw the opportunity to translate this huge pool of data into actionable, driver-specific insights. For each of its truck drivers, a powerful new predictive modeling solution translates into quantitative risk ratings related to the likelihood of on-the-job accidents, giving operators the cue they need to intervene proactively to prevent such accidents and to save lives.
PdM calculated score-based risk indexes for each driver, helping the company proactively intervene to increase safety and retain valuable employees. PdM helped drivers reduce the incidence of minor accidents by 20 percent and serious accidents by as much as 80 percent and showed an increase in driver retention of roughly 30 percent, a significant accomplishment in an industry in which employee turnover is ultra-high.
These materials are the copyright of John Wiley & Sons, Inc. and any dissemination, distribution, or unauthorized use is strictly prohibited.

Predictive Maintenance For Dummies, IBM Limited Edition 30
The benefits of using PdM include the following:
✓ Workforce optimization: Accurately allocate employee’s time and tasks within a workgroup, minimizing costly overtime
✓ Best employee on task: Ensure that the right employee is performing the most valuable tasks
✓ Training effectiveness: Know which training will benefit the employee and the organization
✓ Safety: Maintain high standards of safety in the plant
✓ Reduction in management time: Fewer management hours needed to plan and supervise employees
✓ A more satisfied, stable workforce: Make people feel they’re contributing to the good of the organization and feel productive
Some organizations are limited by the amount of information they’re allowed to gather based on union policies or a lack of comfort by employees providing information. If this is the case for you, try conducting employee surveys and incentiv-izing employees to complete them, as well as conducting tra-ditional one-on-one interviews.
Increasing Customer SatisfactionIf organizations ensure that their assets are functioning, their processes are streamlined, and their operators are doing what they should, consumers can receive products on time. That product has the highest quality possible and meets customer needs, which hopefully leads to increased satisfaction and more purchases that increase revenue.
For example, take an auto manufacturer. It utilizes PdM to deter-mine when the brakes, carburetor, engine, or battery will fail. The manufacturer then exhibits those insights directly to the driver’s dashboard. So, the dashboard informs the driver that the brakes will fail in a certain number of miles, based on the current driv-ing style and conditions. Now the driver can plan accordingly and knows how much time she has to schedule a maintenance visit. Without PdM, the driver may not have had time to react to a brake failure, which could result in a crash. With PdM, the crash could’ve been avoided, and that’s the ultimate value of PdM.
These materials are the copyright of John Wiley & Sons, Inc. and any dissemination, distribution, or unauthorized use is strictly prohibited.

Chapter 5
Discovering How Technologies Work
TogetherIn This Chapter▶ Delving into the analytics process▶ Clearing up some common myths▶ Comparing custom versus out-of-the-box applications
T he key for asset-intensive companies is to ensure that their assets are safe, reliable, and available to support
their business. Companies have found that simply adding more people or scheduling more maintenance sessions doesn’t produce cost-effective results. In order for organizations to effectively utilize predictive maintenance (PdM), they must understand the analytical process, how it works, its underlying techniques, and its integration with existing operational processes; otherwise, the work to incorporate PdM in your organization will be for naught.
In this chapter, you discover how various technologies work together to optimize asset performance, mitigate asset and process risk, and enhance operational efficiency.
These materials are the copyright of John Wiley & Sons, Inc. and any dissemination, distribution, or unauthorized use is strictly prohibited.

Predictive Maintenance For Dummies, IBM Limited Edition 32
Understanding the Analytical Process
As organizations find themselves with more data, fewer resources to manage them, and a lack of knowledge about how to quickly gain insight from the data, the need for PdM becomes evident. It is based on two premises:
✓ The world is more instrumented and interconnected, which yields a large amount of potentially useful data.
✓ Analytics transforms data to quickly create actionable insights that help organizations run their businesses more cost-effectively.
Companies have developed systems that leverage the entire analytical process. Each part of the process can be detailed in three major phases.
Phase 1: AlignThe align phase is all about the data. You understand what data sources exist, where they’re located, what additional data may be needed or can be acquired, and how the data is integrated or can be integrated into operational processes.
With PdM, it doesn’t matter if your data is structured or unstructured, streaming or at rest. You just need to know which type it is so you can integrate and analyze the data appropriately.
Phase 2: AnticipateIn this phase, you leverage PdM to gain insights from your data. You can utilize several capabilities and technologies to analyze the data and predict outcomes:
✓ Descriptive analytics provides simple summaries and observations about the data. Basic statistical analy-ses, for which most people utilize Microsoft Excel, are included in this category. For example, a manufacturing machine failed three times yesterday for a total down-time of one hour.
These materials are the copyright of John Wiley & Sons, Inc. and any dissemination, distribution, or unauthorized use is strictly prohibited.

Chapter 5: Discovering How Technologies Work Together 33 ✓ Data mining is the analysis of large quantities of data to
extract previously unknown interesting patterns and dependencies. There are several key data mining techniques:
•Anomaly detection: Discovers records and pat-terns that are outside the norm or unusual. This can also be called outlier, change, or deviation detection. For example, out of 100 widgets, widgets #23 and #47 are much larger than the rest.
•Association rules: Searches for relationships, dependencies, links, or sequences between vari-ables in the data. For example, a drill tends to fail when the ambient temperature is greater than 100 degrees Fahrenheit, it’s past 5:00 p.m., and it’s been functioning for more than ten and a half hours straight.
•Clustering: Groups a set of objects in such a way that objects in the same group are more similar to each other than to those in other groups. For example, offshore oil platforms that are located in North America and Europe are grouped together because they tend to be surrounded by cooler air temperatures, while those in South America and Australia are grouped separately because they tend to be surrounded by warmer air temperatures.
•Classification: Identifies which of a set of categories a new data point belongs to. For example, a turbine may be classified as “old” or “new.”
•Regression: Estimates the relationships between variables and determines how much a variable changes when another variable is modified. For example, plant machinery tends to fail as the age of the asset and age of the operator increase.
✓ Text mining derives insights and identifies patterns from text data via natural language processing, which enables the understanding of and alignment between computer and human languages. For example, from maintenance logs, you may determine that the operator always cleans the gasket in the morning before starting, which leads to an extended asset life.
✓ Machine learning enables the software to learn from the data. For example, when an earthmover fails, there are
These materials are the copyright of John Wiley & Sons, Inc. and any dissemination, distribution, or unauthorized use is strictly prohibited.

Predictive Maintenance For Dummies, IBM Limited Edition 34three or four factors that come into play. The next time those factors are evident, the software will predict that the earthmover will fail.
You may come across predictive analytics. It is a category of analytics that utilizes machine learning and data mining techniques to predict future outcomes.
✓ Simulation enables what-if scenarios for a specific asset or process. For example, you may want to know how running the production line for 24 continuous hours will impact the likelihood of failure.
✓ Prescriptive analytics goes beyond predicting future outcomes by also suggesting actions and showing the implications of each decision option. For example, based on the data, organizations can predict when a water pipe is likely to burst. Additionally, the municipality can have an automated decision where for certain pipes, certain valves must be replaced by a Level-3 technician. Such an output provides the operations professional with the predictive outcome, the action, and who needs to con-duct the action.
A decision management framework that aligns and opti-mizes decisions based on analytics and organizational domain knowledge can automate prescriptive analytics.
Phase 3: ActAt the final stage, you want to act at the point of impact with confidence on the insights that your analysis provided. This is typically done by using a variety of channels including e-mail, mobile, reports, dashboards, Microsoft Excel, and enterprise asset management systems — essentially, however, your orga-nization makes decisions within your operational processes.
A prominent aspect of the act phase is being able to view the insights from the anticipate phase (see the preceding section) so employees can act on them. There are three common outputs:
✓ Reports: Display results, usually in list format
✓ Scorecards: Also known as balanced scorecards; automat-ically track the execution of staff activities and monitor the consequences arising from these actions; primarily utilized by management
These materials are the copyright of John Wiley & Sons, Inc. and any dissemination, distribution, or unauthorized use is strictly prohibited.

Chapter 5: Discovering How Technologies Work Together 35 ✓ Dashboards: Exhibit an organization’s key performance
indicators in a graphical format; primarily utilized by upper management
Organizations that utilize as many analytical capabilities of PdM as possible will be able to optimize the appropriate ana-lytics with the data. Ultimately, organizations will have better insights and make better decisions than those organizations that don’t.
It may be easier for you to leverage a single software vendor that can provide all of these capabilities and integrate all three phases in your operational processes so you can maxi-mize PdM’s benefits.
Clarifying Common MythsWhile data is the necessary input to PdM, and the analytics can provide insights, many organizations may still have con-cerns, may still believe in some myths, and ultimately, may still not believe in the value of PdM. In this section, we hope to dispel some common myths or hindrances:
✓ Myth #1: You can’t start the process unless you have all the data ready and waiting in a data warehouse. No one has exactly what they need at the start of a PdM proj-ect. Start with the information that you currently have, leverage PdM on that information, review the outputs (for example, insights), and find out what gaps exist with current information in order to enhance your business outcomes.
✓ Myth #2: You can’t proceed unless all your data is high quality. One of the values of undertaking a PdM project is to improve the quality of the data you collect. Even if some data points are missing, you can proceed. It’s more likely that you’ll be concerned about whether the size of your sample is large enough so it can be used to give you statistically significant conclusions. In either case, ana-lytics techniques are available to deal with both missing values and limited sample size, so you can move forward with the data that you have.
These materials are the copyright of John Wiley & Sons, Inc. and any dissemination, distribution, or unauthorized use is strictly prohibited.

Predictive Maintenance For Dummies, IBM Limited Edition 36 ✓ Myth #3: You need to focus all your efforts on data
capture and management to the exclusion of develop-ing strategic business initiatives for your project. In reality, your project will be successful only if you focus on your strategic goals. By undertaking this project, you get a better perspective on what data needs you really have, how to collect the data, and how it aligns with your initiatives. PdM isn’t useful or valuable if done indepen-dently of the business outcomes, which must align with the goals of your business; otherwise, PdM will just be a waste of time, effort, and money.
✓ Myth #4: Only PhD scientists can understand and manage all the analytical capabilities with PdM. Technology has advanced so much that business ana-lysts can understand the analytics. The business analyst may want to validate some of the work with a statistician or data scientist, but many software products have made it much easier and quicker for employees to gain power-ful insight from their data.
✓ Myth #5: PdM sounds great, but seems like it’s going to cost me an arm and a leg. First, instead of looking at costs, focus your metric to return on investment (ROI) or value. What value are you getting with PdM? How long would it potentially take to get a positive ROI? PdM is an investment, not a true cost. Additionally, the costs of such technology have dramatically decreased. In most cases, the ROI is so high that costs become a nonissue to utilizing PdM in an organization.
✓ Myth #6: Out-of-the-box software is better than custom software. It depends on the situation. To find out more, check out the next section, “Choosing the Right Application.”
Choosing the Right ApplicationWhen deciding how to proceed with any major software project, most organizations face the question of whether to choose an out-of-the-box application or create a custom one. Typically they weigh the factors presented in this section.
These materials are the copyright of John Wiley & Sons, Inc. and any dissemination, distribution, or unauthorized use is strictly prohibited.

Chapter 5: Discovering How Technologies Work Together 37
When choosing a solution type, there’s no right or wrong — it just depends on your organization’s situation. Working with vendors that offer both out-of-box and custom solutions can greatly minimize your costs and risks.
When purchasing a solution, whether it contains custom ele-ments or not, be aware of the software from production to maintenance. Some questions to ask include the following:
✓ Is the software used for the build phase of the project the same as for the production phase?
✓ Is this solution adaptable as I add more measurement types and assets?
✓ How can I integrate the results of this PdM solution to other parts of my business, some of which may be ready for integration and others which may not?
✓ What type of expertise do I have in-house and could training augment existing knowledge quickly?
✓ What is “in-the-box” and what are its terms and conditions?
Picking out-of-the-box softwareFor out-of-the-box software, organizations look at the pros and cons:
✓ Pros •It’susuallylessexpensivethandevelopingcustom
software and can be modified to some extent. •You’reupandrunningimmediatelyinsteadofwait-
ing for something to be created. •BypurchasingSupport,thevendorhandlesmost
problems and provides updates. ✓ Cons •Youmaybemissinganimportantcapabilityrel-
evant to your business. •Thevendormaynotplantoaddacapabilityyou
want to future updates. •Youhavetopayforupgradesandsupportforevery
capability that’s included, even though you may not use all of them now or in the future.
These materials are the copyright of John Wiley & Sons, Inc. and any dissemination, distribution, or unauthorized use is strictly prohibited.

Predictive Maintenance For Dummies, IBM Limited Edition 38
Selecting custom softwareWhen deciding about whether to create custom software, consider these pros and cons:
✓ Pros
•Youmaygetexactlywhatyouwant.
•Costscanbemodifiedastheworkprogresses, providing more budget flexibility.
•Itmaybeeasiertointegratewithsystemsyoualready have.
✓ Cons
•It’susuallymoreexpensiveandslowertogetstarted.
•Softwaremodificationscanbecostlybecausetheymay not be supported by a software vendor.
•Youmaybecreatinganapplicationthatgives you a narrow pool of outside developers who can maintain it.
Typically, organizations opt for something out of the box so they can experiment. These applications can be customized to some extent so they offer the opportunity to test solutions. After an organization feels comfortable that it knows the full extent of what’s needed, it can make larger expenditures.
These materials are the copyright of John Wiley & Sons, Inc. and any dissemination, distribution, or unauthorized use is strictly prohibited.

Chapter 6
Ten Steps to Get Started with PdM
In This Chapter▶ Defining problems to target▶ Discovering your analytics quotient▶ Refining the process to learn more
M ost executives that utilize predictive maintenance (PdM) know the great value that it provides to their
organizations. Regardless of whether you’ve read the entire book so far or you’ve skipped around, you may be asking, “How do I get started?” Deploying PdM can be a multistep pro-cess. Physical assets, processes, employees, and data can all align to make PdM successful. In this chapter, you look at the ten (okay, 11) steps you can take to bring PdM into your orga-nization and maximize your return on investment (ROI).
Step 1: Prioritize Problem AreasPrioritizing problem areas is probably the most difficult and critical step. Many problems can confront your organization every day — from operational to financial to customer. You probably can rattle off several that you want to deal with today. But, the key to a successful project is to focus on solv-ing the problems that have the most impact on the organiza-tion as a whole. Some problems are annoying but when fixed don’t result in a huge benefit to the company.
These materials are the copyright of John Wiley & Sons, Inc. and any dissemination, distribution, or unauthorized use is strictly prohibited.

Predictive Maintenance For Dummies, IBM Limited Edition 40
Step 2: Determine How the Problem Affects Profitability or Corporate Initiatives
Determining how the problem affects profitability or corporate initiatives gets the greatest interest from the executives to whom you’re presenting your case.
To make the case for your PdM program, focus on the big problems that keep executives up at night — optimizing oper-ations and managing risk. It’s important to understand what metrics the organization is focusing on and which of those metrics needs to be improved.
To demonstrate how PdM can affect the bottom line, consider asking your management the following questions:
✓ What if we could predict what assets are likely to fail and why?
✓ How does asset failure affect production schedules and overall costs?
✓ Can we accurately predict the manufacturing conditions that are resulting in poor product quality?
✓ How do increased warranty claims affect costs and customer satisfaction?
✓ Can we predict which spare parts we’ll need and how many are needed to maintain our assets?
✓ How does additional re-engineering and potentially remanufacturing affect supply chain metrics and costs?
Step 3: Uncover Organizational Gaps
Step 3 looks deeper into the problems and uncovers gaps in processes, people, or existing systems. Ask yourself if you have one big problem or a combination of the following:
These materials are the copyright of John Wiley & Sons, Inc. and any dissemination, distribution, or unauthorized use is strictly prohibited.

Chapter 6: Ten Steps to Get Started with PdM 41 ✓ Processes: What information do we have regarding the
process and its interconnectedness with other pro-cesses? The correct operational processes must be in place to ensure an expected outcome. If they aren’t, you need to begin to identify them. If they’re poorly docu-mented and not consistently followed, you’ve uncovered important information.
✓ People: Do we have performance information about our operators? Do the employees who manage assets support the idea of PdM? Are the right people running the right equipment? Does management understand the importance of PdM? Is there a culture of analytics within the organization?
✓ Systems: Look at the systems you have in place now. Where does your operational, financial, and customer information reside? Is it in one or several databases? Is it on someone’s desktop? What do you have access to now, and what can you get access to in the future? Collaborate with IT to determine all the systems currently in place.
Step 4: Ascertain Your Analytics Quotient (AQ)
Make sure you understand where you are from an analytics expertise view and determine your AQ, which measures your readiness and capability to apply insights to corporate prob-lems using analytics. AQ has two components:
✓ The answer to a series of 15 multiple choice questions
✓ Taking the score you received and applying it to a matu-rity scale
Determining your analytics maturity should align with your maintenance maturity (see Chapter 1 for more info). If not, you’re missing a golden opportunity and need to ask why not.
These materials are the copyright of John Wiley & Sons, Inc. and any dissemination, distribution, or unauthorized use is strictly prohibited.

Predictive Maintenance For Dummies, IBM Limited Edition 42
Step 5: Create a Phased-Approach Strategy
Determine where you currently reside on the maturity scale:
✓ Novice is designated for a score under 80. A novice orga-nization does a lot of manual calculations with its data. It can’t learn from its historical data or make predictions.
✓ Builder is designated for a score from 80–119. A builder organization collaborates within its own departments and uses both historical data and trends to make decisions.
✓ Leader is designated for a score from 120–140. A leader organization has VP-level accountability and collabo-rates across several departments. Predictive models are deployed.
✓ Master is designated for a score of 141 and above. A master organization is one that uses analytics to its high-est capabilities. It uses predictive models, collaborates across the entire organization, and is tremendously com-petitive in its industry.
After understanding your maturity, build a plan to reach the next level of AQ and maintenance maturity. Check out http://ibm.co/mUixuy for suggestions on each stage (and for more info on AQ in general).
Step 6: Determine What Data You Have and What Data Is Needed
Begin to look at useable data for your PdM project. See where the gaps are and whether you can begin to collect more asset-related data. Gather as many stakeholders as possible from each department as well as IT to see what’s available and what’s missing. Don’t worry if other departments aren’t fol-lowing your lead. Utilize what data you have to gain better insight because you need to start somewhere.
These materials are the copyright of John Wiley & Sons, Inc. and any dissemination, distribution, or unauthorized use is strictly prohibited.

Chapter 6: Ten Steps to Get Started with PdM 43
Step 7: Analyze Data and Predict Outcomes
At this point in the process, you look at the various statisti-cal, data mining, and predictive analytical techniques. Many technologies don’t require you to be a statistician or PhD to garner some insight. Just make sure to validate your analysis and methodology with someone who has that expertise to ensure that you’re on the right track.
Reassess the models to make sure they’re aligned and updated with the latest data. Depending on the technology, the models may be reassessed manually or by the software itself. The software may include machine learning algorithms, where the optimal model to be utilized based on the data set is automatically provided.
Step 8: Integrate Insights into Decision-Making Portals
Take the analytical and predictive information and incorpo-rate it into your decision-making processes. Every organiza-tion, department, and individual makes decisions differently. The key is to ensure that you’re able to input your analyti-cal outcomes regardless of where they may need to go — a spreadsheet, report, dashboard, e-mail, mobile device, enterprise asset management system, and so on. The greatest value for organizations is if decisions can be aligned to the analytical outcomes and those decisions can be optimized so the information that comes into the decision-making portal is the actual decision (where no additional thinking, analysis, or understanding is needed). Just follow the directions.
Step 9: Optimize the Analytical Process in Your Organization
After you’ve completed a successful PdM project in your orga-nization, make sure you share the information with all who can benefit. Hold presentations to explain how the information
These materials are the copyright of John Wiley & Sons, Inc. and any dissemination, distribution, or unauthorized use is strictly prohibited.

Predictive Maintenance For Dummies, IBM Limited Edition 44you’ve produced impacts profitability across the organization. It’s also important to automate the process as much as possi-ble. Ensure that no matter who’s working in the various depart-ments everyone understands the value of PdM and can use it.
Step 10: Continuously Monitor, Measure, Analyze, Predict, and Improve
At this step, focus on refining and improving your models, as well as any processes based on a continuous improvement methodology. PdM is based on data, and data constantly changes. You want to ensure that you aren’t using an older model or process for today’s information. Be sure to talk to your employees and ensure that the process for data collection and decision-making hasn’t changed. If so, modify accordingly.
Organizations may drop the ball at this step. They’re so focused on getting to the point where they can apply analyti-cal models that they forget about maintaining them. To guard against this, create an Analytics Center of Excellence (ACE), which is a formal structure that helps organizations maximize the value they obtain from their analytics programs. It keeps analytics at the forefront of the organization.
Step 11: Begin to Create a Culture of Analytics
Okay, so we couldn’t resist adding one more step just for good luck. Your organization may not have a culture of analytics when making decisions. You may feel that you’re alone in trying to utilize analytics, but you’re not. Exhibiting how PdM can affect the bottom line provides you with some air cover. Include the experts in your organization to incorporate their knowledge and intuition. Have these thought leaders participate in building and evaluating the analytic results. Make sure you can work on a problem that exhibits value quickly. After you show manage-ment and other departments the value of analytics, before you know it, people will be coming to you for advice.
These materials are the copyright of John Wiley & Sons, Inc. and any dissemination, distribution, or unauthorized use is strictly prohibited.


![Auditory Neural Plasticity in Tinnitus Mechanisms and ...downloads.hindawi.com/journals/np/2020/7438461.pdf · prevalence increased with aging and noise exposure [1]. ... counseling](https://static.fdocuments.net/doc/165x107/5f60e5eb8d6bd0546a15ec2d/auditory-neural-plasticity-in-tinnitus-mechanisms-and-prevalence-increased-with.jpg)