By Reham Mohsen M. Momee (B.Sc. Pharm. Sci, M.Sc. (Res))gala.gre.ac.uk/id/eprint/18140/1/Reham M....
195
Synthesis, physico-chemical properties and potential applications of colloidal gel particles By Reham Mohsen M. Momee (B.Sc. Pharm. Sci, M.Sc. (Res)) A thesis submitted in partial fulfillment of the University of Greenwich for the degree of Doctor of Philosophy March, 2015 Department of Pharmaceutical, Chemical and Environmental Sciences Faculty of Engineering and Science University of Greenwich, Medway Campus Chatham Maritime, Kent ME4 4TB, UK Declaration i
Transcript of By Reham Mohsen M. Momee (B.Sc. Pharm. Sci, M.Sc. (Res))gala.gre.ac.uk/id/eprint/18140/1/Reham M....

Synthesis, physico-chemical properties and potential applications of colloidal gel particles
By
Reham Mohsen M. Momee
(B.Sc. Pharm. Sci, M.Sc. (Res))
A thesis submitted in partial fulfillment of the University of Greenwich for the degree of Doctor of Philosophy
March, 2015
Department of Pharmaceutical, Chemical and Environmental Sciences
Faculty of Engineering and Science
University of Greenwich, Medway Campus Chatham
Maritime, Kent ME4 4TB, UK
Declaration
i

DECLARATION
“I certify that this work has not been accepted in substance for any degree, and is not
concurrently being submitted for any degree other than that of Doctor of Philosophy being
studied at the University of Greenwich. I also declare that this work is the result of my own
investigations except where otherwise identified by references and that I have not plagiarized
the work of others”.
(Reham Mohsen Momee) (Candidate)
Date
(Prof. Martin J. Snowden) (Supervisor)
Date
(Dr. Bruce Alexander) (Supervisor)
Date

ii Quote
"All that I am or ever hope to be, I owe to my angel Mother." ~ Abraham Lincoln
iii Abstract
ABSTRACT
Synthesis, physico-chemical properties and potential applications of colloidal gel particles
Four new N-isopropylacrylamide (NIPAM) based particles have been synthesized and
characterized. The first experimental chapter reports that fluorescent
poly(Nisopropylacrylamide-co-5% vinyl cinnamate) microgels were deposited on different
solid surfaces to produce new environmental responsive surfaces. The mass of microgel
particles deposited on glass pre-treated with acid, glass pre-treated with base, quartz, stainless
steel, gold and Teflon at 25°C and 60°C was determined using fluorescence spectroscopy. The
factors affecting the adsorption/desorption of the microgel particles were also investigated. The
study shows that the solid surface charge is the most significant factor, followed by that of
surface roughness and temperature; meanwhile, the hydrophobicity/hydrophilicity of the
surface was the least significant.
Fluorescent temperature/pH responsive p(NIPAM-co-5% acrylic acid)-rhodamine B particles
were studied. The results confirm the attachment of rhodamine B to the microgel particles. The
long chains attached to the particles caused the particles to be poly-dispersed which suggests
non-uniformity of particle size and behavior.
Fluorescent temperature/pH responsive poly(N-isopropylacrylamide-co-5% lucifer yellow)
(p(NIPAM-co-5% LY)) microgel particles were tested for toxicity. The particles were
negatively charged, mono-dispersed and were approximately 250 nm in diameter at 15°C. The
toxicity of different concentrations of p(NIPAM-co-5% LY), p(NIPAM) and NIPAM monomer
was tested on two cell lines (HeLa and Vero). The results show that the two particles maintain
cell viability over 80% (for both cell lines HeLa and Vero) up to a concentration of 3 mg/mL
while NIPAM monomer showed a cell viability of over 80% at a concentration equal to or less
than 0.3 mg/mL.
iv Abstract
The fourth experimental chapter explores the opportunity of using microgel particles as an
emulsifier. p(NIPAM-co-5% acrylic acid)-hexenol particles with both hydrophilic and
hydrophobic groups in their molecular structure were used to stabilize two emulsions
(tricaprylin-in-water and hexadecane-in-water). The stability of the emulsions increased with
increasing the concentration of the microgel. For the tricaprylin-in-water emulsion, a
concentration of 0.3% w/v of the novel microgel particles managed to stabilize the emulsion for
a week. In case of the hexadecane emulsion in water, 0.45% w/v microgel particles could show
an increase in the emulsion stability and a decrease in the creaming.

Reham Mohsen (B.Sc., M.Sc. (Res), AMRSC)
v Acknowledgements
ACKNOWLEDGEMENTS
I would like to express my deep thanks, appreciation and gratitude to my supervisors Prof.
Martin Snowden and Dr. Bruce Alexander; they have always been very generous with their
advice, time, care and support without which my project would not have been possible. I am
also very thankful to Prof. John Mitchell, Prof. B. Z. Chowdhry and Dr. Simon Richardson for
all their help and support throughout my work.
I was very lucky in having the chance to carry out my project in such an encouraging
environment as Medway Sciences, where people are very co-operative and helpful. My thanks
to Dr Joanna Thorne, Dr George Vine, Shashi Rudrangi, Ruchir Bhomia, Amanda Lewis and

Dr Vivek Trivedi. I also owe special thanks to Dr. Ian Slipper for his help with the SEM imaging
in different parts of my project. Also special thanks to Dr. Samer El-Daher for his continuous
support.
My genuine appreciation also goes to my family at MSA University in Cairo, to Mama Nawal
El-Degwi, Dr. Khayri Abdel-Hamid, Dr. Heba Osman and Dr. Gehan Safwat for all their care.
Special thanks to Dr. Ayman Diab for all his support and care.
I was blessed by being surrounded by very dear friends throughout my project, I appreciate all
the care and encouragement that they have always shown to me, and they are: Samer
Mouhandes, Bishoy Maher, Aicha Tigani, Mona Mokhatab and Hiba Hamidi.
I would also like to express my deepest thanks and love to my sisters Tasneem and Raghda, my
brother in-laws Kareem Rashed and Asser Omar and my best friends Sarah Salah and Islam
Mannaa who were always very loving, caring, encouraging and were always there for me
whenever I needed them.
My deepest love, thanks and appreciation go to my dear Mum for everything she has done for
me, without which I would have achieved nothing in my life. For all her love, care,
encouragement, for all her sacrifices and efforts. My prayers are for my Mum’s soul to rest in
peace and enjoy heaven!
vi Dedication

For her who will always be in my heart
For my MUM For my lovely little family
vii
Contents
ix
CONTENTS Title page i
Declaration 2
Quote 3
Abstract 4
Acknowledgements 6
Dedication 7
Contents ix
List of Figures xvi
List of Tables xxii
Abbreviations xxiv
Conferences/Seminars and Publications xxviii
Chapter One
Introduction
1.1 Microgels 1
1.1.1 N-isopropylacrylamide (NIPAM) 1
1.1.2 Types of microgels 2
1.1.3 Preparation of microgels 3
1.1.3.1 The mechanism of surfactant free emulsion polymerization 4
1.1.3.1.1 Thermal decomposition of the initiator 4
1.1.3.1.2 Initiation 4
1.1.3.1.3 Propagation 5
1.1.3.1.4 Termination 5
1.1.4 Properties of microgels 6 1.1.4.1 Swelling behaviour of microgels 6
1.1.4.1.1 The effect of temperature 6
1.1.4.1.2 The effect of pH 7 1.1.4.2 Electrophoretic mobility 8

Contents
x
1.1.5 Characterization of microgels 8 1.1.5.1 Dynamic light scattering 9
1.1.6 Colloidal stability and interactions of microgels 11 1.1.6.1 Electrical double layer 13
1.1.6.2 Origins of surface charge 13
1.1.6.3 Double layer interactions 14
1.1.6.4 Stern potential 14
1.1.6.5 Electrophoresis 14
1.1.6.6 DLVO theory 15
1.1.7 Fluorescent microgels 17
1.1.8 Applications of microgels 18
1.1.8.1 Microgels as drug delivery systems 19
1.1.8.1.1 Microgels and oral drug delivery 19
1.1.8.1.2 Microgels as transdermal drug delivery system 20
1.2 Environmental responsive surfaces 20
1.2.1 Deposition of microgels on surfaces 20
1.2.2 Applications of environmental responsive surfaces 22
1.2.2.1 Control of protein adhesion 22
1.3 Context 22
1.4 References
23
Chapter Two
Deposition of fluorescent poly(N-isopropylacrylamide-co-vinyl cinnamate) particles
on solid surfaces: quantitative analysis and the factors affecting it
2.1 Introduction 30
2.1.1 Vinyl cinnamate 32
2.2 Materials and methods 33
2.2.1 Microgel synthesis 33
2.2.2 Microgel characterization 33
2.2.2.1 Dynamic light scattering 33

Contents
xi
2.2.2.2 Fluorescence spectroscopy 34
2.2.3 Slide surface treatments 34
2.2.3.1 Glass and quartz 34 2.2.3.2 Stainless steel 34
2.2.3.3 Gold 34
2.3.3.4 Teflon 35
2.2.4 Surface deposition/desorption of microgel particles 35
2.2.5 Surface characterization 35
2.2.5.1 Fluorescence spectroscopy 35
2.2.5.2 Atomic force microscopy 36
2.2.5.3 Energy dispersive X-ray spectroscopy 36 2.3 Results and discussion 36
2.3.1 Characterization pf p(NIPAM-co-5% VC) microgel particles 36
2.3.1.1 Size and VPTT 36
2.3.1.2 Fluorescence spectroscopy 37
2.3.2 Characterization of solid surfaces 38
2.3.2.1 Energy dispersive X-ray spectroscopy 38
2.3.3 Factors affecting the mass of p(NIPAM-co-5% VC) deposited on different 41 surfaces
2.3.3.1 Effect of surface charge 41
2.3.3.2 Effect of surface roughness 46
2.3.3.3 Effect of hydrophilicity/hydrophobicity 48
2.3.3.4 Effect of temperature 49
2.4 Conclusions 51
2.5 References 51
Chapter Three Design, synthesis and characterization of poly(N-
isopropylacrylamide-co-acrylic acid)-ethylene diamine-rhodamine B particles
3.1 Introduction 54

Contents
xii
3.1.1 Rhodamine B 54
3.2 Materials and methods 55
3.2.1 Materials 55
3.2.2 Methods 56 3.2.2.1 Synthesis 56
3.2.2.2 Synthesis of p(NIPAM-co-5% AA) 56
3.2.2.3 Microgel-EDA coupling 56
3.2.2.4 Microgel-EDA-rhodamine B coupling 56
3.2.2.5 Characterization of microgel particles 57
3.2.2.5.1 Dynamic light scattering 57 3.2.2.5.2 Fluorescence spectroscopy
58 3.2.2.5.3 Infrared spectroscopy 58
3.2.2.5.4 Microscopy 58
3.2.2.5.4.1 Scanning electron microscopy 58
3.2.2.5.4.1 Fluorescence microscopy 59
3.3 Results and discussion 59
3.3.1 Particle size analysis 61
3.3.1.1 Effect of temperature 61
3.3.1.2 Effect of pH 63
3.3.2 Electrophoretic mobility 64
3.3.3 Fluorescence spectroscopy 66
3.3.31 Effect of addition of rhodamine B 66
3.3.3.2 Effect of temperature 67
3.3.3.3 Effect of pH 70
3.3.4 Infrared spectroscopy 72 3.3.5 Fluorescence microscopy 75
3.3.6 Scanning electron microscopy 75
3.4 Conclusions and future work 77
3.4.1 Conclusions 77
3.4.2 Future work 78
3.5 References 78 Chapter Four Design, synthesis, characterization and toxicity studies of poly(Nisopropylacrylamide-co-lucifer yellow) for drug delivery applications
4.1 Introduction 81

Contents
xiii
4.1.1 Lucifer yellow VS 82
4.2 Materials and methods 83 4.2.1 Materials 83
4.2.2 Methods 83
4.2.2.1 Synthesis of p(NIPAM-co-5% LY) 83
4.2.2.2 Dynamic light scattering 83 4.2.2.3 Fluorescence spectroscopy
84 4.2.2.4 Infrared spectroscopy 84
4.2.2.5 Microscopy 84
4.2.2.5.1 Scanning electron microscopy 84
4.2.2.5.2 Fluorescence microscopy 84
4.2.2.6 Toxicity studies 85
4.2.2.6.1 Sterilization 85
4.2.2.6.2 Preparation of media 85
4.2.2.6.3 Cell sub-culturing 85
4.2.2.6.4 Cell seeding 85 4.2.2.6.5 Sample preparation 86
4.2.2.6.6 Cell dosing 86
4.2.2.6.7 MTT assay 87
4.2.2.6.8 Growth curves 87
4.3 Results and discussion 88
4.3.1 Particle size 88
4.3.1.1 Effect of temperature 88
4.3.1.2 Effect of pH 89
4.3.2 Electrophoretic mobility 91
4.3.2.1 Effect of temperature 91
4.3.2.2 Effect of pH 92 4.3.3 Fluorescence spectroscopy 92
4.3.3.1 Effect of addition of lucifer yellow 92
4.3.3.2 Effect of temperature 95
4.3.3.3 Effect of pH 95
4.3.4 Infrared spectroscopy 96
4.3.5 Microscopy 100

Contents
xiv
4.3.5.1 Scanning electron microscopy 100
4.3.5.2 Fluorescence microscopy 101
4.3.6 Toxicity studies 101
4.6 Conclusions and future work 109
4.6.1 Conclusions 109
4.6.2 Future work 110
4.7 References
110
Chapter Five
Synthesis, characterization and emulsification properties of poly(N-
isopropylacrylamide-co-acrylic acid)-hexenol
5.1 Introduction 118
5.2 Materials and methods 120
5.2.1 Materials 120
5.2.2 Methods 120
5.2.2.1 Synthesis of p(NIPAM-co-5% AA)-hexenol 120
5.2.2.2 Dynamic light scattering 121
5.2.2.3 Infrared spectroscopy 122
5.2.2.4 Scanning electron microscopy 122
5.2.2.5 Emulsification 122
5.2.2.6 Synthesis of microgellosomes 122
5.2.2.7 Optical microscopy 123
5.2.2.8 Fluorescence microscopy 123
5.2.2.9 Scanning electron microscopy 123
5.3 Results and discussion 123
5.3.1 Characterization of p(NIPAM-co-5% AA)-hexenol particle 125
5.3.1.1 Particle size 125
5.3.1.1.1 Effect of temperature 125
5.3.1.1.2 Effect of pH 125
5.3.1.2 Electrophoretic mobility 127
5.3.1.2.1 Effect of temperature 127

Contents
xv
5.3.1.2.2 Effect of pH 128
5.3.1.2 Infrared spectroscopy 128
5.3.1.3 Scanning electron microscopy 132
5.3.2 Characterization of the emulsion stabilized by p(NIPAM-co-5% AA)hexenol particles 133
5.3.3 Microgellosomes 138
5.3.3.1 Characterization of microgellosomes 138
5.3.4 Characterization of emulsions stabilized by microgellosomes 140
5.4 Conclusions and future work 141
5.4.1 Conclusions 141
5.4.2 Future work 141
5.5 References
142
Chapter Six
Conclusions and future work
6.1 Conclusions 145
6.2 Future work 149
6.3 References
151

List of figures
xvi
LIST OF FIGURES
Chapter One
Introduction
Figure 1.1 Structure of NIPAM monomer and structure of the polymer where “n” represents 2 the number of monomer units
Figure 1.2 A schematic of the swelling-deswelling transition of a pH-responsive and a 3 temperature-responsive microgel
Figure 1.3 Mechanism for the preparation of microgel particles by SFEP 5
Figure 1.4 Schematic illustrating the conformational change at the VPTT for 6 thermoresponsive microgels
Figure 1.5 Schematic illustrating the conformational change at the pKa of the monomer for 7 pH-responsive microgels
Figure 1.6 Optical arrangement of the ZS for size measurements 10
Figure 1.7 Types of possible emuslion interactions in a colloidal system 12
Figure 1.8 A schematic representing the electrical double layer 13
Figure 1.9 A schematic representing the DLVO potential energy diagram showing interaction
curves; van der Waals attractive forces (VA) and electrostatic repulsive forces 16 (VR) and the
net total interactive forces (VT)
Chapter Two Deposition of fluorescent poly(N-isopropylacrylamide-co-vinyl
cinnamate) particles on solid surfaces: quantitative analysis and the factors affecting
it
Figure 2.1 Molecular structure of vinyl cinnamate 32
Figure 2.2 The effect of temperature (heating) on the particle size of p(NIPAM-co-5% VC)
at pH 3 and 10 across temperature range (15-60°C) 37 Figure 2.3 Comparison between the emission spectra of 50 μg/mL of 100 % p(NIPAM) and
p(NIPAM-co-5% VC) in water, excited at 300 nm at 25°C 39

List of figures
Figure
xvii
Figure 2.4 Calibration curve of p(NIPAM-co-5% VC) in water at 25°C, excited at 300 nm 39 and emitted at 350 nm
Figure 2.5 Fluorescence intensity of 50 µg/mL 100% p(NIPAM) and p(NIPAM-co-5% VC) in
water in response to heating/cooling from 15-60°C, excited at 300 nm and emitted at 350 39 nm
Figure 2.6 Energy-dispersive x-ray analysis of stainless steel, quartz, glass and Teflon 40
Figure 2.7 AFM topography and line profile for glass, quartz, stainless steel, gold and 47
Teflon before deposition of microgel particles
60°C
50
Chapter Three
Design, synthesis and characterization of poly(N-isopropylacrylamide-co-acrylic
acid)-ethylene diamine-rhodamine B particles
Figure 3.1 The molecular structure of rhodamine B 55
Figure 3.2 The suggested molecular structure of p(NIPAM-co-5% AA)-EDA-RhB 60
Figure 3.3 The effect of temperature on the particle size of p(NIPAM-co-5% AA), p(NIPAM-co-5% AA)-EDA and p(NIPAM-co-5% AA)-EDA-RhB at pH 11.5 62
Figure 3.4 The effect of temperature on the electrophoretic mobility of p(NIPAM-co-5%
AA)p(NIPAM-co-5% AA)-EDA and p(NIPAM-co-5% AA)-EDA-RhB at pH 11.5 65
Figure 3.5 The fluorescence spectra of 0.2 μg/mL p(NIPAM-co-5% AA)-EDA, p(NIPAM- 67
List of figures
xviii
Figure 2.8 AFM images of p(NIPAM-co-5% VC) particles deposited on glass at 25°C and at co-
5% AA)-EDA-RhB and RhB excited at 540 nm at 25°C at pH 6.5

List of figures
Figure
xix
Figure 3.6 Fluorescence emission spectra of 0.2 μg/mL p(NIPAM-co-5% AA)-EDA-RhB at, pH
2, pH 6.5 and pH 11.5 and 0.2 μg/mL RhB excited at 540 nm at pH 2, pH 6.5 and 11.5 at 69
25°C, 35°C and 45°C
3.7 Fluorescence of 0.2 μg/mL RhB excited at 540 nm at 25°C at pH 2.5, 6.5 and
11.5 70
Figure 3.8 Fluorescence of 0.2 μg/mL p(NIPAM-co-5% AA)-EDA-RhB excited at 540 nm at 25°C at pH 2.5, 6.5 and 11.5 70
Figure 3.9 FT-IR spectra of p(NIPAM-co-5% AA)-EDA-RhB, p(NIPAM-co-5% AA)-EDA, p(NIPAM-co-5% AA) and RhB 74
Figure 3.10 Fluorescence microscopy images of p(NIPAM-co-5% AA)-EDA-RhB at 25°C 75
Figure 3.11 SEM images of p(NIPAM-co-5% AA), p(NIPAM-co-5% AA)-EDA and
p(NIPAM-co-5% AA)-EDA-RhB at 25°C
76
Chapter Four
Design, synthesis, characterization and toxicity studies of poly(N-isopropylacrylamideco-
lucifer yellow) for drug delivery applications
Figure 4.1 Molecular structure of lucifer yellow VS dilithium salt 82
Figure 4.2 Structure and organization of the 96 well plates used for toxicity studies. 87
Figure 4.3 The effect of temperature on the particle size of p(NIPAM-co-5% LY) at pH 7 across temperature range (15-60°C) 88
Figure 4.4 The effect of pH on the hydrodynamic diameter of p(NIPAM-co-5% LY) at 25°C 89
Figure 4.5 The effect of temperature (heating) across a range (15-60°C) on the electrophoretic mobility of p(NIPAM-co-5% LY) and p(NIPAM) in 10-4 M NaCl at pH 7 91
Figure 4.6 The effect of pH on the electrophoretic mobility of p(NIPAM-co-5% LY) in 1 x 10-
4 M NaCl at 25°C 92

List of figures
xx
Figure 4.7 Fluorescence spectra of 0.01 μg/mL LY, 0.2 μg/mL p(NIPAM-co-5% LY) and
0.2 μg/mL p(NIPAM) excited at 430 nm at pH 7 at temperatures 25°C and 45°C 94
Figure 4.8 Fluorescence spectra of 0.01 μg/mL LY, 0.2 μg/mL p(NIPAM-co-5% LY) and
0.2 μg/mL p(NIPAM) excited at 430 nm at 25°C at pH 3 and 7 94
Figure 4.9 FT-IR spectra of p(NIPAM), p(NIPAM-co-5% LY) and LY in the region (3800-
1400 cm-1) 98

List of figures
Figure
xxi
4.10 FT-IR spectra of p(NIPAM), p(NIPAM-co-5% LY) and LY in the region (1300-
750 cm-1) 99
Figure 4.11 SEM pictures of p(NIPAM-co-5% LY) at pH 3 100
Figure 4.12 Fluorescence microscopy pictures of 2 μg/mL p(NIPAM-co-5% LY) 101
Figure 4.13 Growth curves of HeLa cells and Vero cells
Figure 4.14 percentage cell viability (after 72 hours) versus log concentration (across conc.
102
range of 0.03 μg/mL to 3000 μg/mL) of dextran, NIPAM monomer, p(NIPAM), p(NIPAMco-
5% LY) and PEI on 1 x 10⁴ HeLa cell/mL
Figure 4.15 percentage cell viability (after 72 hours) versus log concentration (across conc.
102
range of 0.03 μg/mL to 3000 μg/mL) of dextran, NIPAM monomer, p(NIPAM), p(NIPAMco-
5% LY) and PEI on 1 x 10⁴ Vero cell/mL
103
Chapter Five
Synthesis, characterization and emulsification properties of poly(N-
isopropylacrylamide-co-acrylic acid)-hexenol
Figure 5.1 The suggested structure of p(NIPAM-co-5% AA)-hexenol 124
Figure 5.2 The hydrodynamic diameter of p(NIPAM-co-5% AA)-hexenol at pH 7 in response to increasing the temperature (15-55°C) 126
Figure 5.3 The hydrodynamic diameter of p(NIPAM-co-5% AA)-hexenol at 25°C in response to pH change 126
Figure 5.4 The electrophoretic mobility of p(NIPAM-co-5% AA)-hexenol in response to temperature change (15-55°C) at pH 7 127
Figure 5.5 The electrophoretic mobility of p(NIPAM-co-5% AA)-hexenol at 25°C in response to pH change 128
Figure 5.6 The FT-IR spectra of p(NIPAM-co-5% AA)-hexenol, p(NIPAM-co-5% AA) and
5 hexen-1-ol
131

xxii
Figure 5.7 SEM pictures of p(NIPAM-co-5% AA)-hexenol at 25°C with a magnification of
(a) х25,000 and (b) х35,000 132
5.8 Emulsions of tricaprylin/water mixtures in the presence of different concentrations of
p(NIPAM-co-5% AA)–hexenol, different concentrations (w/v) of microgel
134 dispersions before emulsification, samples just after emulsification and samples after 1 week of emulsification
Figure 5.9 Emulsions of hexadecane/water mixtures in presence of different concentrations 135 of p(NIPAM-co-5% AA)– hexenol, samples after emulsification
Figure 5.10 Optical and fluorescent microscopy images of tricaprylin/water emulsion in the 136 presence of 0.1, 0.2, 0.25 and 0.3% w/v of p(NIPAM-co-5% AA)– hexenol.
Figure 5.11 Optical and fluorescent microscopy images of hexadecane/water emulsion in 137 presence of 0.2, 0.3, 0.4 and 0.45% w/v of p(NIPAM-co-5% AA)– hexenol
Figure 5.12 Representation of the molecular structure of microgellosomes 139
Figure 5.13 SEM image of microgellosomes formed by polymerizing p(NIPAM-co-5% 140
AA)-hexenol
Figure 5.14 Optical microscopy image of microgellosomes (0.1 w/v) stabilized emulsion 140 List of tables
LIST OF TABLES
Chapter One
Introduction
Table 1.1 Characterization methods for microgels
8

List of figures
Figure
xxiii
Chapter Two
Deposition of fluorescent poly(N-isopropylacrylamide-co-vinyl cinnamate) particles on
solid surfaces: quantitative analysis and the factors affecting it
Table 2.1 Expected and measured characteristics of solid surfaces before deposition of
microgel particles (surface charge, relative hydrophobicity and surface roughness), and microgel particle mass deposited and % desorbed from slide surfaces at 25°C and 60°C
42
Table 2.2 Comparison between the surface roughness averages of glass, quartz, stainless steel,
gold and Teflon coated with p(NIPAM-co-5% VC) microgel particles at 25°C and 60°C
50
Chapter Three
Design, synthesis and characterization of poly(N-isopropylacrylamide-co-acrylic
acid)-ethylene diamine-rhodamine B particles
Table 3.1 Particle size and polydispersity index values of p(NIPAM-co-5% AA), p(NIPAMco-5% AA)-EDA and p(NIPAM-co-5% AA)-EDA-RhB 62
Table 3.2 The fluorescence intensity of 0.2 μg/mL p(NIPAM-co-5% AA)-EDA, p(NIPAMco-5% AA)-EDA-RhB and RhB excited at 540 nm at 25ºC at pH 6.5
66
Table 3.3 FT-IR bands of p(NIPAM-co-5% AA) and p(NIPAM-co-5% AA)-EDA-RhB 72
Table 3.4 FT-IR bands of RhB 73

xxiv
List of tables
Chapter Four Design, synthesis, characterization and toxicity studies of poly(N-
isopropylacrylamideco-lucifer yellow) for drug delivery applications
Table 4.1 The design of plates A and B and the concentrations used for the toxicity testing of 87 dextran, NIPAM monomer, p(NIPAM), p(NIPAM-co-5% LY) and poly(ethylenimine) (PEI)
Table 4.2 FT-IR bands values of p(NIPAM) and p(NIPAM-co-5% LY) 96
Table 4.3 FT-IR bands values of LY 97
Table 4.4 LC50 of dextran, NIPAM monomer, p(NIPAM), p(NIPAM-co-5% LY) and PEI on
HeLa and Vero cells 103
Chapter Five Synthesis, characterization and emulsification properties of poly(N-
isopropylacrylamide-co-acrylic acid)-hexenol
Table 5.1 FT-IR bands of p(NIPAM-co-5% AA) and p(NIPAM-co-5% AA) hexenol 129
Table 5.2 FT-IR bands of 5 hexen-1-ol 130
ABBREVIATIONS

Abbreviations
xxv
Symbol
AA
AFM
ATR
BA
BMA
CPS
Dh
DLS
DMAPAAm
DMEM
DMSO
EDA
EDC
EDX
FBS
FITC
FITC-BSA
FPBA
GPC
HeLa CCL2
Hex
HPLC
HSDSC
IR
KPS
Description
Acrylic acid
Atomic force microscopy
Attenuated total reflection
N,N'-methylenebisacrylamide
Butyl methacrylate
Counts per second
Hydrodynamic diameter
Dynamic light scattering
N,N'-dimethylaminopropylacrylamide
Dulbecco’s Modified Eagle Medium
Dimethyl sulphoxide
Ethylene diamine
1-ethyl-3-(3-dimethyl aminopropyl) carbodiimide
Energy dispersive X-ray spectroscopy
Fetal Bovine Serum
Fluorescein isothiocyanate filter
Flourescein isothiocyanate bovine serum albumin
2-aminomethyl-5-fluorophenylboronic acid
Gel permeation chromatography
Human cervical epithelial cells
Hexenol
High performance liquid chromatography
High sensitivity differential scanning calorimetry
Infrared spectroscopy
Potassium persulphate
kV kilovolt LY Lucifer yellow
MEM Minimum essential medium
MeOH Methanol

Abbreviations
xxvi
MES 4-Morpholineethanesulfonic acid monohydrate
MTT (3-(4,5-Dimethylthiazol-2-yl)-2,5-diphenyltetrazolium bromide
NIPAM N-isopropylacrylamide
NMR Nuclear magnetic resonance
p(NIPAM) Poly(N-isopropylacrylamide)
p(NIPAM-co-5% AA) Poly(N-isopropylacrylamide-co-5% acrylic acid)
p(NIPAM-co-5% LY) Poly(N-isopropylacrylamide-co-5% lucifer yellow)
p(NIPAM-co-5% VC) Poly(N-isopropylacrylamide-co-5% vinyl cinnamate)
p(NIPAM-co-HDT) Poly(N-isopropylacrylamide-co-hexadecanethiol)
PBS Phosphate buffered saline
PCS Photon correlation spectroscopy
PdI Polydispersity index
PEI Branched poly(ethylenimine)
pKa Acid dissociation constant
PSG Penicillin-Streptomycin-Glutamine
PTFE Poly(tetrafluoroethene)
PZC Point of zero charge
RfD Reference dose
RhB Rhodamine B
SANS Small-angle neutron scattering
SEM Scanning electron microscope
SFEP Surfactant-free emulsion polymerization
SLS Static light scattering
VC Vinyl cinnamate
Vero CCL-81 Normal kidney of Cercopithecus aethiops VPTT Volume phase transition temperature w/v Weight per volume
w/w Weight per weight
λ Wavelength

Abbreviations
xxvii
λex Excitation wavelength
λem Emission wavelength
Conferences/Seminars and publications
xxviii
CONFERENCES/SEMINARS
AND PUBLICATIONS
CONFERENCES/SEMINARS
Title: Design, synthesis, characterization and suggested application of novel poly(N-isopropylacrylamide)-co-5% lucifer yellow particles
Conference: University of Greenwich – American Academy of Pharmaceutical Sciences Student Chapter Conference 16th -18th July, 2014.
Type:
Poster Presentation
Title: Temperature/pH sensitive fluorescent nanogels for drug delivery applications
Conference: Third Euro-India International Conference on Nanomedicine and Tissue Engineering (ICNT 2013) Kottayam, Kerala, India, August 9th 11th, 2013.
Type:
Oral Presentation (Invited speaker)
Title: Deposition of fluorescent NIPAM based nanoparticles on different solid surfaces; quantitative analysis and the factors affecting it
Conference: University of Greenwich- AAPS Student Chapter Conference, March 25th, 2013.
Type:
Poster Presentation

Conferences/Seminars and publications
xxix
Title: pH induced flocculation of microgel particles Conference: UK Polymer Colloids Forum, 14th UKPCF Annual Meeting, University of Hull
14th-16th of September 2009.
Type:
Poster Presentation

Conferences/Seminars and publications
xxx
Publications
Title: Characterization of thermo and pH responsive NIPAM based microgels and their membrane blocking potential
Authors: Reham Mohsen, George J. Vine, Natasa Majcen, Bruce D. Alexander, Martin J. Snowden
Journal:
Colloids and Surfaces A: Physicochemical and Engineering Aspects, 2013, 428, 53-59.
Title: Deposition of fluorescent NIPAM-based nanoparticles on solid surfaces: quantitative analysis and the factors affecting it
Authors: Reham Mohsen, Joanna B. Thorne, Bruce D. Alexander and Martin J. Snowden
Journal:
Colloids and Surfaces A: Physicochemical and Engineering Aspects, 2014,
457, 107-115.
Title: Design, synthesis, characterization and toxicity studies of poly(Nisopropylacrylamide-co-lucifer yellow) particles for drug delivery applications
Authors: Reham Mohsen, Bruce D. Alexander, Simon C.W. Richardson, John C.
Mitchell, George J. Vine, Ayman A. Diab and Martin J. Snowden
Status: To be submitted.
Title: Synthesis, characterization and emulsification properties of poly(N-isopropylacrylamide)-co-5% AA-hexenol
Authors: Reham Mohsen, Anupam Das, Bruce D. Alexander, Vesko Puavnov and Martin J. Snowden

Conferences/Seminars and publications
xxxi
Status: Langmuir, 2015, to be submitted.
Title: Design, synthesis and characterization of fluorescent poly(Nisopropylacrylamide)-co-acrylic acid-rhodamine B particles
Authors: Reham Mohsen, Blerina Shkodra, Bruce D. Alexander, John C.
Mitchell and Martin J. Snowden
Status: Polymer, 2015, in preparation.


Introduction Chapter One
1
Chapter One Introduction
1.1 Microgels
A microgel is defined as “a cross linked latex particle which is swollen by a good solvent”.
The term microgel was first introduced by Baker but microgels were first prepared by
Staudinger and Husmann (1). Microgels are considered as a class of smart materials, as they
are highly sensitive to the environmental changes around them, which cause them to
dramatically change their physico-chemical properties (e.g. particle size). This is facilitated
by the high surface-area-to-volume ratio of the microgels which make it easier for an
environmental stimulus, such as the pH or temperature, to affect the particles. The high
surface-area-to volume ratio also contributes to the biomedical and industrial importance of
this class of smart materials (2).
Microgels have the same polymer chemistry as bulk gels, but their different physical
molecular arrangement (discrete gel-like particles) causes some differences such as the bulk
viscosity characteristics, the surface-area-to-volume ratios and the speed at which
conformational changes occur. Microgels undergo conformational changes in seconds, while
other kinds of gels like hydrogels may take hours or even days (2).
1.1.1 N-isopropylacrylamide (NIPAM)
There are many monomers used for the preparation of thermo-responsive microgels of which
the most commonly used is NIPAM. The lower critical solution temperature (LCST) for
linear poly(N-isopropylacrylamide) (p(NIPAM)) chains in water is 32°C; accordingly the
polymer swells when below 32°C and de-swells when the temperature further increases (3).
The structure of NIPAM (Figure 1.1) and its properties are similar to acrylamide (4). NIPAM
has a hydrophilic amide group and a hydrophobic isopropyl group.
p(NIPAM) microgels were first prepared in 1986 by Pelton and Chibante (5), using a
surfactant-free emulsion polymerization (SFEP) process by which they produced a
monodisperse microgel which was found to have a thermo-reversible conformational
transition in water at around 34°C.

Introduction Chapter One
2
Figure 1.1 Structure of NIPAM monomer (left) and structure of the polymer (right) where “n” represents the number of monomer units
When NIPAM molecules are heated in presence of an initiator and a cross linker, they
undergo cross-linking to give a temperature sensitive gel network which shrinks by expelling
water within a narrow temperature range. The temperature at which the gel acquires the
largest and sharpest swellability changes is called the volume phase transition temperature
(VPTT). Even for a temperature sensitive microgel, the temperature is not the only factor
that affects swellability; other factors include the type of microgel, the hydrophilicity of the
particle, degree of cross-linking and monomer and/or co-monomer composition and
concentration.
Being hydrophilic in nature, p(NIPAM) is completely soluble and swells in aqueous solvents
when the temperature is below 34oC (VPTT), while above it, the polymer phase separates.
1.1.2 Types of microgels
Microgels can be composed of one monomer (in addition to the initiator and cross linker),
and accordingly, it acquires the properties of this monomer only. p(NIPAM) is the most
common homo-polymer microgel but other examples include N-ethylacrylamide (6) and N-
ethylmethacrylamide (7).
Also, a small amount of a co-polymer can be incorporated in the microgel (1-5 % w/w of the
main monomer), the resultant microgel is highly affected by the co-polymer properties. This
makes it possible to control and alter the properties of microgels according to the properties
of the co-monomer used. VPTT modifications of temperature-sensitive microgels can be
achieved using co-monomers with different hydrophobicities (8-11).
Introduction Chapter One
3
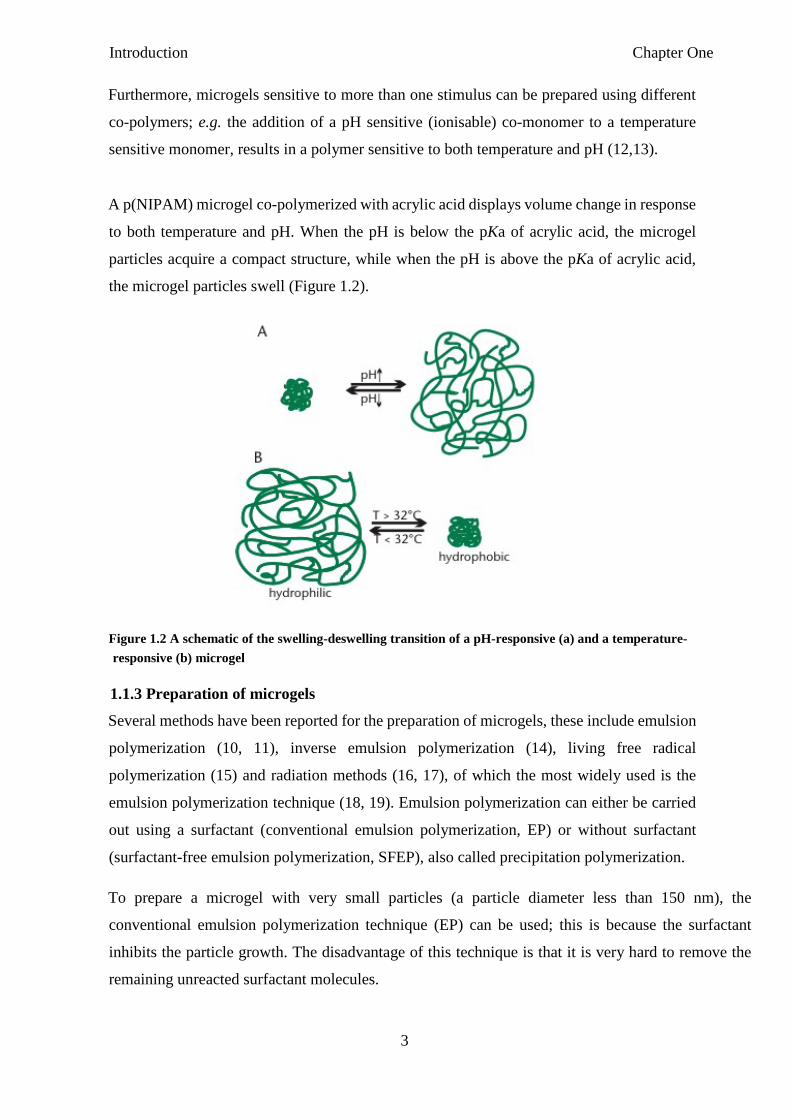
Furthermore, microgels sensitive to more than one stimulus can be prepared using different
co-polymers; e.g. the addition of a pH sensitive (ionisable) co-monomer to a temperature
sensitive monomer, results in a polymer sensitive to both temperature and pH (12,13).
A p(NIPAM) microgel co-polymerized with acrylic acid displays volume change in response
to both temperature and pH. When the pH is below the pKa of acrylic acid, the microgel
particles acquire a compact structure, while when the pH is above the pKa of acrylic acid,
the microgel particles swell (Figure 1.2).
Figure 1.2 A schematic of the swelling-deswelling transition of a pH-responsive (a) and a temperature- responsive (b) microgel
1.1.3 Preparation of microgels
Several methods have been reported for the preparation of microgels, these include emulsion
polymerization (10, 11), inverse emulsion polymerization (14), living free radical
polymerization (15) and radiation methods (16, 17), of which the most widely used is the
emulsion polymerization technique (18, 19). Emulsion polymerization can either be carried
out using a surfactant (conventional emulsion polymerization, EP) or without surfactant
(surfactant-free emulsion polymerization, SFEP), also called precipitation polymerization.
To prepare a microgel with very small particles (a particle diameter less than 150 nm), the
conventional emulsion polymerization technique (EP) can be used; this is because the surfactant
inhibits the particle growth. The disadvantage of this technique is that it is very hard to remove the
remaining unreacted surfactant molecules.

Introduction Chapter One
4
For larger particle sizes (up to 1000 nm), SFEP is the method of choice (20). Conditions for
applying this method include the use of continuous phase of a high dielectric constant (e.g.
water) and the addition of ionic initiators (e.g. potassium persulphate K2S2O8). The extensive
use of SFEP is due to its advantages, of which the most important is avoiding the risk of
surfactant contamination (the main disadvantage of the EP), this is because the
polymerization reaction yields charged polymer chains that are surface active which stabilize
the growing particles without the need to use surfactants. Also this method is characterized
by a high product yield (around 95 %) of monodispersed particles that are regular in both
size and composition. The main disadvantage of this method is that it produces dilute
dispersions (low particle concentration).
1.1.3.1 The mechanism of surfactant free emulsion polymerization
1.1.3.1.1 Thermal decomposition of the initiator
When heated, the ionic initiator is thermally decomposed to form ionic water-soluble free
radicals. Metal persulphates are of the most commonly used sources of free radicals in
aqueous solutions (21). Potassium and ammonium salts for example are used to initiate
polymerization in aqueous and emulsion systems. Equation 1.1 illustrates the thermal
decomposition mechanism of persulphates.
O
2 -
O Equation 1.1
1.1.3.1.2 Initiation The ionic radicals react with the monomer molecules forming monomeric radicals. Equation 1.2
shows the reaction between the persulphate radical and the monomer M.
M MSO4− Equation 1.2
O O S S - O O -
O
O O
O 2 K +
∆
+ 2K + O S O .

Introduction Chapter One
5
1.1.3.1.3 Propagation Further reaction of the formed monomeric radicals with other monomer molecules leads to
the formation of surface active oligomeric radicals. These are characterized by having a polar
head and a non-polar tail as shown in Equation 1.3.
M х +⋅
MSO Equation 1.3
The solubilization of oligomeric radicals in water continues till the chain length exceeds the
solubility limit of the solvent. The oligomer chains aggregate with each other and hence
increase the surface charge and form small particles. The formed particles contain
hydrophobic non-polar chains in the center and polar head groups to the outside. The polar
heads on the particles surface mainly originate from the initiator and stabilize the dispersion
by the electrostatic repulsion forces between the surface charged groups. The particles grow
more and more due to the adsorption of further monomers or oligomers, causing particle
swelling.
1.1.3.1.4 Termination
Reaction termination takes place when the monomers are totally depleted or when another
free radical reacts with the growing particle and terminates the reaction. SFEP technique is
characterized by short nucleation period (minutes) the production of monodispersed particles
regular in both size and composition (18, 22). Figure 1.3 shows the mechanism of the
synthesis of microgel particles using SFEP.
Introduction Chapter One
6
Figure 1.3 Mechanism for the preparation of microgel particles by SFEP where M represents a monomer (18) 1.1.4 Properties of microgels
1.1.4.1 Swelling behaviour of microgels As swelling-deswelling is the most characteristic property of the microgels, it also tends to
be the most important one (23). There are many factors that affect the swelling properties of
microgels such as the cross-linker. Highly cross-linked microgels acquire a tighter and less
swelled structure than the similar microgels with lower cross-linking ratio (the ratio of the
moles of cross-linking agent to the moles of the polymer repeating units) (23). Furthermore,
microgels with a high cross-linker concentration will undergo more rapid conformational
changes because the polymer chains are close to each other, which will allow quicker
collapse. Microgels with low cross-linker concentrations have properties similar to those of
the high molecular weight polymers.
Another factor that affects the swelling of the microgels is the chemical structure of the
polymer. In water or aqueous solvents, a polymer with more hydrophilic groups (such as
p(NIPAM), Fig. 1.1) swells more than that with hydrophobic ones. On the other hand,
microgels with hydrophobic groups (e.g. isopropyl methacrylate (24)) collapse in aqueous
solvents and hence swell less than the microgels with hydrophilic ones (e.g. acrylic acid (1)).
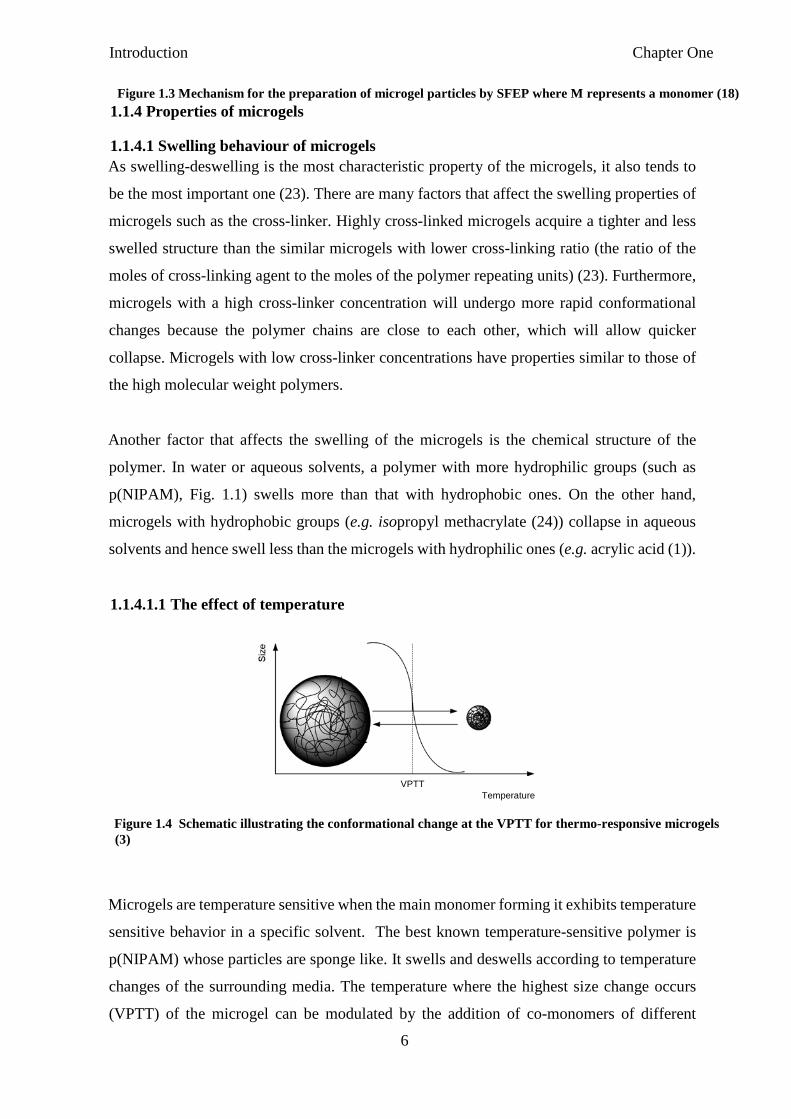
1.1.4.1.1 The effect of temperature
VPTT
Temperature
Figure 1.4 Schematic illustrating the conformational change at the VPTT for thermo-responsive microgels (3)
Microgels are temperature sensitive when the main monomer forming it exhibits temperature
sensitive behavior in a specific solvent. The best known temperature-sensitive polymer is
p(NIPAM) whose particles are sponge like. It swells and deswells according to temperature
changes of the surrounding media. The temperature where the highest size change occurs
(VPTT) of the microgel can be modulated by the addition of co-monomers of different

Introduction Chapter One
7
hydrophilic/hydrophobic properties. Accordingly, co-polymer microgels can acquire a range
of VPTT values dependent on the type of co-monomer incorporated (10).
Below the VPTT, both the polymer-polymer and polymer-solvent interactions are weak, the
interstitial spaces between the microgel particles are filled with water and the microgel
particles are swollen {Pelton, 1986}. Above the VPTT, the polymer-polymer interactions
become stronger than the polymer-solvent ones and so the polymer particles tend to collapse
(Figure 1.4). When the temperature is increased, the polymer chains tend to interact with
each other rather than with the solvent molecules and the hydrogen bonding between the
polymer chains and the solvent molecules is reduced, this causes most of the solvent
entrapped within the interstitial spaces of the polymer matrix to be expelled, forming hard
sphere particles and the microgel tends to shrink. During this collapsed state, the particles
are dispersed; this is due to the repulsion between the similar ionic charges on the particle
surface caused by the ionic initiators. This process (deswelling) is reversible, so if the
temperature goes back below the VPTT, the interactions between the polymer and the solvent
improve and the microgel swells again {Pelton, 1986}.
1.1.4.1.2 The effect of pH
Microgels sensitive to both pH and temperature can be prepared by incorporating acidic or
basic co-monomers into p(NIPAM) microgel matrix. An example of this is the p(NIPAMco-
acrylic acid) microgel (18). The pH conformational transition point depends upon the pKa of
the functional groups incorporated. At pH values below the pKa of acrylic acid, the microgel
particles are in a collapsed state but when the pH is more than the pKa, the electrostatic
repulsion forces between the ionized acrylic acid molecules within the polymer matrix cause
the gel to acquire a more swollen configuration (Figure 1.5).
pKa pH
Figure 1.5 Schematic illustrating the conformational change at the pKa of the monomer for pHresponsive microgels (25)

Introduction Chapter One
8
1.1.4.2 Electrophoretic mobility The electrical properties of microgels are induced by the surface charge of the particle, which
is caused by the initiator. The surface charge arises during the microgel synthesis, the formed
oligomers have hydrophilic heads and hydrophobic tails •Mx+1SO4- (Figure 1.3). These
oligomers then aggregate together forming micelles and since the solvent is water, the
hydrophilic groups are on the surface (in contact with the solvent) while the hydrophobic
ones are inside. The electrophoretic mobility of a microgel is temperature dependant. In the
swollen state, a microgel particle has an electrophoretic mobility close to zero and increases
by heating as the temperature reaches the VPTT (26).
1.1.5 Characterization of microgels
Several methods have been reported for the characterization of microgels (summarized in Table
1.1).
Table 1.1 Characterization methods of microgels (2) TECHNIQUE PARAMETER REFERENCES
Dynamic light scattering (DLS)/Photon correlation spectroscopy (PCS)
Hydrodynamic diameter and polydispersity
(23, 27-30)
Static light scattering (SLS) Particle molecular weight (31, 32)
Gel permeation chromatography (GPC)
Molecular weight and polydispersity
(33)
Nuclear magnetic resonance
(NMR)
Internal structure (24, 35)
Transmission electron microscopy (TEM), Scanning electron microscopy (SEM)
Visual assessment of the particles, measuring of particles diameter
(14, 27, 30)
UV-vis spectroscopy Determination of VPTT, monitoring stability/flocculation
(24, 35, 36)
Small-angle neutron scattering (SANS)
Particle composition (3, 27, 30)
High sensitivity differential
scanning calorimetry (HSDSC)
Thermodynamic properties, determination of VPTT
(37)
Introduction Chapter One
9
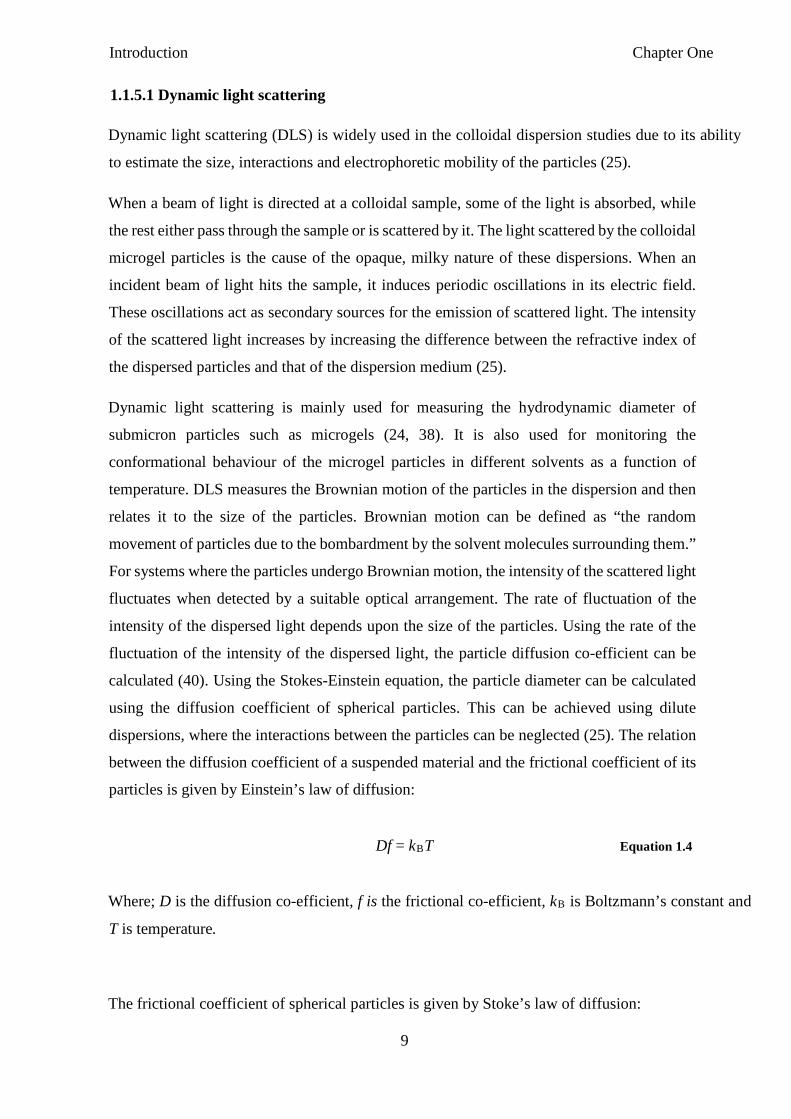
1.1.5.1 Dynamic light scattering
Dynamic light scattering (DLS) is widely used in the colloidal dispersion studies due to its ability
to estimate the size, interactions and electrophoretic mobility of the particles (25).
When a beam of light is directed at a colloidal sample, some of the light is absorbed, while
the rest either pass through the sample or is scattered by it. The light scattered by the colloidal
microgel particles is the cause of the opaque, milky nature of these dispersions. When an
incident beam of light hits the sample, it induces periodic oscillations in its electric field.
These oscillations act as secondary sources for the emission of scattered light. The intensity
of the scattered light increases by increasing the difference between the refractive index of
the dispersed particles and that of the dispersion medium (25).
Dynamic light scattering is mainly used for measuring the hydrodynamic diameter of
submicron particles such as microgels (24, 38). It is also used for monitoring the
conformational behaviour of the microgel particles in different solvents as a function of
temperature. DLS measures the Brownian motion of the particles in the dispersion and then
relates it to the size of the particles. Brownian motion can be defined as “the random
movement of particles due to the bombardment by the solvent molecules surrounding them.”
For systems where the particles undergo Brownian motion, the intensity of the scattered light
fluctuates when detected by a suitable optical arrangement. The rate of fluctuation of the
intensity of the dispersed light depends upon the size of the particles. Using the rate of the
fluctuation of the intensity of the dispersed light, the particle diffusion co-efficient can be
calculated (40). Using the Stokes-Einstein equation, the particle diameter can be calculated
using the diffusion coefficient of spherical particles. This can be achieved using dilute
dispersions, where the interactions between the particles can be neglected (25). The relation
between the diffusion coefficient of a suspended material and the frictional coefficient of its
particles is given by Einstein’s law of diffusion:
Df = kBT Equation 1.4
Where; D is the diffusion co-efficient, f is the frictional co-efficient, kB is Boltzmann’s constant and
T is temperature.
The frictional coefficient of spherical particles is given by Stoke’s law of diffusion:

Introduction Chapter One
10
f = 6πηRh Equation 1.5
Where Rh is the hydrodynamic diameter of the particles and η is the solvent viscosity.
Combining the above two equations, allows the calculation of the hydrodynamic diameter of
a particle from its diffusion coefficient (Stoke-Einstein equation):
kBT
Rh = Equation 1.6 3πηD
In this case, the particle diameter is referred to as the hydrodynamic diameter due to its relation to the
particle diffusion through a liquid (40).
Figure 1.6 Optical arrangement of the Zetasizer for size measurements (25, 40)
Figure 1.6 illustrates the optical arrangement of the Zetasizer. The laser beam represents the
light source, which illuminate the sample in the cell. In case of dilute dispersions such as
microgels, some of the laser beam is scattered by the particles, while most of it passes through
the sample. The scattered light is measured by the detector which is placed at 173oC from the
Introduction Chapter One
11
laser beam, which passes straight through the sample. The detector is placed in this position
to detect the backscattered light. The advantages of the detector can be summarized as
follows: (1) it reduces the multiple scattering, since the laser beam is not required to pass
through the whole sample and (2) using back-scattered detection will partially exclude the
effect of large particles (such as dust), since the large particles generally scatter light in a
forward direction (39). The function of the attenuator is to optimize the intensity of the light
beam passing through the sample. It prevents the saturation of the detector by reducing the
intensity of the laser beam passing through a strong scattering sample or increase it in case
of a weakly scattering one. The attenuator can also change the position of the measurement
point from the center of the cuvette in order to obtain optimum scattering. The scattering
signal passes from the detector to a digital processing board called the correlator. This
correlator determines the rate of change in intensity by comparing the scattering intensity at
successive time intervals. The data then passes from the correlator to the computer where it
is analyzed by the software to derive the hydrodynamic diameter (40).
1.1.6 Colloidal stability and interactions of microgels
To make good use of colloidal systems, such as microgels, it is very important to study the
stability of these systems (1, 40). A colloidal system is said to be stable when the particles
remain dispersed as single particles for a long period of time such as months or years (39).
Stability can be achieved using the balance of attractive and repulsive forces between the
colloidal particles.
Properties of the colloidal systems are determined by factors such as (41):
• Particle size
• Particle shape and flexibility • Surface properties (including the surface charge density) • Particle-particle interactions • Particle-solvent interactions • Temperature, pH and ionic strength of the particulate system.
Since the stability depends upon two kinds of interactions (particle-particle and
particlesolvent interactions), the stability between particles of the same size differs from that
between particles of different sizes in the same medium. While suspended, there are many
factors that cause the particles to display random particle collisions; these factors include
thermal, hydrodynamic, external forces such as shear, agitation, flow and intrinsic Brownian

Introduction Chapter One
12
motion. In the case of large particles, sedimentation can also be an effective factor (1). These
collisions may cause the particles to be rebound or to aggregate, this aggregation may cause
a permanent contact called coagulation or a temporary one called flocculation. Figure 1.7
shows the possible types of interactions in a colloidal dispersion.
Figure 1.7 Types of possible emulsion interactions in a colloidal system (15)
If the aggregating system is made up of one type of particle, then the process is called
homoaggregation, while in the case of different kinds of particles, it is heteroaggregation,
heterocoagulation or heteroflocculation (2). Permanent irreversible particle contact is
generally referred to as heterocoagulation. Temporary reversible particle associations are
defined as heteroflocculation and heteroassociation, while the term heteroaggregation is
generally applied for particle aggregation. Colloidal particles have different particle size,
composition, shape, surface charge and surface potential (1). Particles with dissimilar
surfaces are more likely to react with each other than those of the same type (42-45).
1.1.6.1 Electrical double layer In aqueous colloidal dispersions, particles usually possess a surface charge. The origins of
this charge include the ionization of surface charge groups, differential loss of ions and
adsorption of charge species. The surface charge affects the distribution of nearby ions in a
polar solution where ions of the same charge (co-ions) are repelled and those of opposite
charge (counter-ions) are attracted to the surface. This leads to the formation of an electrical

Introduction Chapter One
13
double layer; Figure 1.8 shows the negatively charged particle surface is surrounded by
positively charged counter ions.
Figure 1.8 A schematic representing the electrical double layer
1.1.6.2 Origins of surface charge Microgel particles suspended in an aqueous solution usually carry an electric charge. The
surface charge arises from various sources that depend upon the dispersion media as well as
the nature of the particle. When particles are dispersed in a liquid, the dissociation of the
functional surface groups and/or adsorption of ions are the most important sources of surface
charge. A net surface charge can be acquired by the unequal adsorption of oppositely charged
ions (46).
1.1.6.3 Double layer interactions
In aqueous solution, ionized particles interact with each other by electrostatic forces. These
interactions are affected by two main factors; oppositely charged ions are attracted to each
other (at least loosely) and electrostatic forces are screened by ions in the bulk solution (46).

Introduction Chapter One
14
The electrical double layer consists of two main regions; an inner region where the ions are
strongly bound (Stern layer) and an outer region where they are loosely attached (diffuse
region). The diffuse layer is balanced by the electrostatic forces and the random thermal
motion. The charge potential is maximized close to the particle surface and decays as the
distance increases away from the particle surface till it reaches zero in the bulk solution. The
bound and the diffuse layers are separated by a surface (slipping plane or surface of shear)
where the particles and the solution move in opposite directions when an external field is
applied. The electrostatic potential on that surface is called the zeta potential (46).
1.1.6.4 Stern potential
The Stern double layer model is usually used to describe the charge distribution.
Electrokinetic measurements are used to estimate the Stern potential (Ψd). Electrical charges
on the surface of the particles cause them to be affected by an applied electrical field; this is defined as electrokinetic effects. The electrokinetic behavior of a particle mainly depends on the potential at the slipping plane between the charged surface and the electrolyte solution. This potential is called the electrokinetic or zeta potential (ξ) (46).
1.1.6.5 Electrophoresis
The movement of a charged entity in a surrounding fluid with an electric field either causing
or resulting from it is referred to as electrophoresis. When an electric field is applied across
an electrolyte, charged particles suspended in the electrolyte are attracted towards the
electrode of the opposite charge. The velocity of the particle movement depends upon the
strength of the electric field, the dielectric constant, the viscosity of the medium and the zeta
potential. The velocity of the particles in a unit field is called “electrophoretic mobility”. For
hard particles where there is a well-defined boundary, the electrophoretic mobility may be
translated into zeta potential. This however is not the case for microgels as they have a diffuse
outer layer. The exact position of which is not well defined. The electrophoretic mobility of
a particle can be related to its zeta potential using the Henry equation for conducting and
non-conducting spheres (46):
UE = Equation 1.7 2 ε ξ f ( ka )
3η
Introduction Chapter One
15
Where UE = electrophoretic mobility, ξ = zeta potential, ε = dielectric constant, η = viscosity
and f(ka) = Henry’s function which describes the thickness of the double layer and the
particle diameter.
Particles dispersed in non-polar media have a minimum f(ka) of 1 while those dispersed in
polar media have a maximum f(ka) value of 1.5. This value is used in the Smoluchowski
approximation (46):
UE = Equation 1.8
So, for systems that fit the Smoluchowski model, the zeta potential can be directly calculated
from the electrophoretic mobility. An example of such a system is dispersion of particles of
particles size larger than 200 nm with an electrolyte concentration of 10-3 M NaCl (46).
1.1.6.6 DLVO theory
The acronym DLVO refers to the two names of the groups who developed this model. These
are Derjaguin and Landau (47) in 1940 and Verwey and Overbeek (48) in 1948. The model
describes the changes in potential energy resulting from colloidal forces when two spherical
monodispersed particles approach each other. Colloidal dispersions are characterized by the
tendency of their particles to aggregate. When particles are dispersed in a liquid, they undergo
continuous collisions. The interaction between the particles during collisions determine the
stability of the dispersion (47,48). Particle aggregation is mainly caused by the long range
van der Waals attractive forces between particles. So, to sustain the dispersion stability, an
equal long-range repulsive force (usually electrostatic) is required to counteract van der
Waals attractive ones.
DLVO theory assumes the stability of a colloidal system is accounted for by the interaction
between charged colloidal particles. It is used to calculate the sum of the total potential
energy (VT), this includes the van der Waals attractive potential (VA) initiated when the
particles approach each other and the repulsive electrostatic potential (VR) (arising from the
electrical double layer around the particle) which prevents particle aggregation (equation
1.13).
2 ε ξ
3η
Introduction Chapter One
16
VT = VA + VR Equation 1.9
Dispersions that are mainly stabilized by electrostatic repulsion aggregate in the presence of an electrolyte due to the compression of the electrical double layer. This enables the particles to come in close contact with each other allowing van der Waals attractive forces (VR) to
predominate and induce aggregation. When VR ˃ VA, the particles are stable, while when
VR < VA, they tend to aggregate.
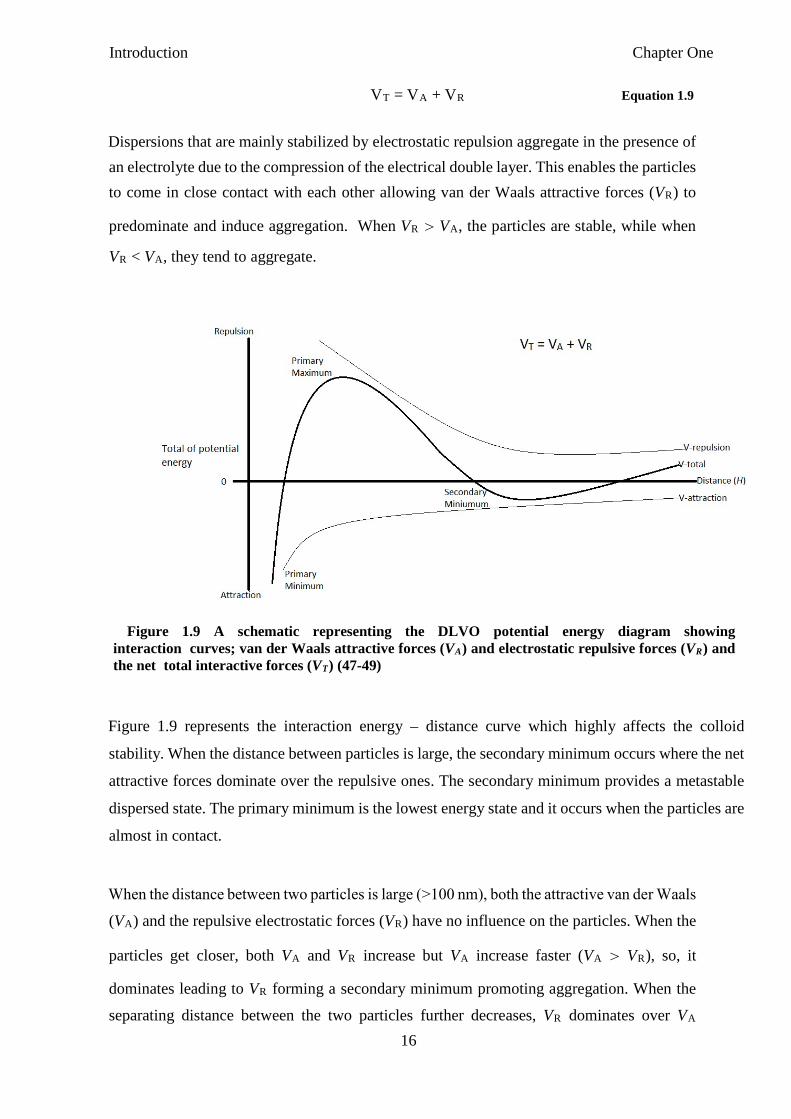
Figure 1.9 A schematic representing the DLVO potential energy diagram showing interaction curves; van der Waals attractive forces (VA) and electrostatic repulsive forces (VR) and the net total interactive forces (VT) (47-49)
Figure 1.9 represents the interaction energy – distance curve which highly affects the colloid
stability. When the distance between particles is large, the secondary minimum occurs where the net
attractive forces dominate over the repulsive ones. The secondary minimum provides a metastable
dispersed state. The primary minimum is the lowest energy state and it occurs when the particles are
almost in contact.
When the distance between two particles is large (˃100 nm), both the attractive van der Waals
(VA) and the repulsive electrostatic forces (VR) have no influence on the particles. When the
particles get closer, both VA and VR increase but VA increase faster (VA ˃ VR), so, it
dominates leading to VR forming a secondary minimum promoting aggregation. When the
separating distance between the two particles further decreases, VR dominates over VA

Introduction Chapter One
17
preventing aggregation and leading VT to form a primary maximum. This represents the
energy barrier that must be overcome before the particles can aggregate (47). At very small
separating distances, VA dominates again leading to particle aggregation (in the primary
minimum), aggregation that occurs in this stage is irreversible.
1.1.7 Fluorescent microgels
Many co-monomers have been incorporated into microgel particles to confer a new property
to environmental responsive particles. Synthesis of coloured and/or fluorescent particles have
been carried out recently and used for different applications.
Liu et al. have synthesized a NIPAM based smart microparticle incorporating picolinamine
based acceptors (Cu2+ detector) and a fluorophore (dansylaminoethyl – acrylamide) for the
selective determination of Cu2+. This has provided a Cu2+ detection system that can be
dispersed in water and also enhanced the detection sensitivity of Cu2+. When the temperature
is below the VPTT, the fluorescent microgel particles are swollen and can selectively bind
to Cu2+ leading to the quenching of the particle fluorescence intensity. When the temperature
increases above the VPTT, the detection limit of the particle highly improves (the particles
can detect even lower amounts of Cu2+). For example, for a particle concentration of 3 x 10-
6 g/mL, the Cu2+ detection limit below the VPTT is 46 nmol while above the VPTT it
decreases to 8 nmol (50).
In 2010, Chen-Yen Chen and Chao-Tsen Chen incorporated 3-hydroxyflavone (3-HF) in
p(NIPAM) particles to produce fluorescent thermo-sensitive microgel particles. 3-HF is
characterized by the display of a dual band emission band associated with normal excited
state intramolecular charge transfer. 3HFs display a greenish emission in polar and aprotic
solvents and a blue one in highly polar and protic solvents. Based upon this property, the new
p(NIPAM-co-3HF) acquired/displayed a two-band fluorescence that changes around the
VPTT. Below the VPTT, the particles are swollen in the surrounding aqueous media which
acts as a highly polar and protic environment which leads to a blue fluorescent emission.
When the temperature exceeds the VPTT, the particles shrink leading to a more hydrophobic
environment giving rise to a greenish emission. The fluorescence shift is characterized by
being sensitive and reversible. The authors suggested the use of the new particles as a
thermometer especially because the sensing temperature range is in the range of 33-40°C

Introduction Chapter One
18
which makes it a very suitable candidate for the use in measurements of biological activity
such as cell imaging (51).
Other trials to incorporate fluorophores in environmental responsive microgel particles
include the incorporation of azo-dyes (52) and pyran based fluorophores (53). Suggested
applications for such particles include sensors and dye-sensitized solar cells, respectively
(53).
1.1.8 Applications of microgels
The properties of microgels can have many applications. Examples of the fields where microgels can
be used include:
Drug delivery systems (54-59)
Cosmetic and pharmaceutical applications (10, 60, 61)
Surface coating industry (3, 62)
Printing industry (3)
Biosciences application (8)
Water purification (63)
Oil recovery (64)
Microgels in Biotechnology (65)
Removal of water from biodiesel (66)
Treatment of dentinal hypersensitivity (25)
Templates for nano-particle synthesis (59)
1.1.8.1 Microgels as drug delivery systems
Site specific drug delivery mainly aims at delivery of the drug to a certain organ and/or
specific tissues in the body; it may also be used to accurately control the release rate of the
drug. The development of polymer and material science caused a great improvement in the
drug delivery systems and thus serving the pharmaceutical aspects.

Introduction Chapter One
19
One of the main limitations of traditional drug delivery systems is the management of the
system to release the required amount of the drug at a specific rate (67). The more the
concepts of chronopharmacokinetics and the variations in the disease symptoms are
understood, the more it becomes desirable to find an ideal drug delivery system that
overcomes the disadvantages of the traditional ones. The assumed system should release a
specific amount of the drug, in a specific site in the body at a specific rate. It is also suggested
that the system releases the drug in response to the need of the body for the drug, for example,
a drug delivery system that releases insulin according to the blood sugar level. The swelling
properties of microgels enable them to play the role of a drug delivery system that can protect
sensitive drugs and control the release of rapidly metabolized ones. Many scientists are
currently testing the ability of microgels to play this role especially as oral or transdermal
drug delivery systems.
1.1.8.1.1 Microgels and oral drug delivery
The ability of the microgel to change its conformation according to the surrounding
environmental conditions can be used for oral drug delivery. Since stomach conditions are
different from those outside the stomach, pH/temperature sensitive microgels were used for
the delivery of peptide and protein drugs. The controlled delivery of insulin using
(Nisopropylacrylamide/butyl methacrylate/acrylic acid) co-polymer microgels was tested
(66). Under environmental conditions similar to the stomach (pH 2, which is below the pKa
of acrylic acid), the microgel particles are collapsed and thus the drug cannot be released.
Under environmental conditions similar to the gastrointestinal tract (pH 7.4, which is above
the pKa of acrylic acid), the microgel particles swell and start releasing the insulin slowly for
eight hours.
1.1.8.1.2 Microgels as transdermal drug delivery systems
The ability of thermo-responsive microgels to play the role of a model transdermal drug
delivery system was studied by Snowden et al. (69). The surfactant-free emulsion
polymerization technique was used to synthesize a microgel based on a co-polymer of
p(NIPAM-co-10 % butyl acrylate)
Inspite of the great progress in the field of drug delivery, protein macromolecules still rapidly
degrade due to their sensitivity to the surrounding environmental conditions. This made the
parenteral route the most convenient one for protein macromolecules. The entrapment of the
biomacromolecules (as proteins) enables its administration as an injection. Different

Introduction Chapter One
20
materials are used as polymers and co-polymers, providing a wide range of hydrophilicity
and hydrophobicity; examples of these are the poly(D, L lactidecoglycolide). Being “soft
and rubbery” and with water content, microgels are like natural living tissues causing
minimal irritation to the surrounding tissues; furthermore, microgels exhibit all the properties
required for a drug delivery system such as environment responsiveness, injectability,
degradability and biocompatibility (7).
1.2 Environmental responsive surfaces
1.2.1 Deposition of microgels on surfaces
Recently, environmental responsive surfaces have attracted the attention of many researchers
due to their potential applications (53, 50-74). Researchers have deposited environmental
responsive particles on different surfaces using different techniques, qualitatively tested their
response to environmental conditions and studied the possible applications of the new
surfaces (75-78). However, very few scientists have approached the quantitative analysis of
the deposition of environmental responsive particles on surfaces (79). Determining the
amount of particles deposited on surfaces is very important in order to determine the extent
of response of the surface to environmental conditions and also for commercial
considerations. To move the suggested application from the research phase to a practical
application one requires a clear understanding of the amount of particles that can be deposited
on each surface and the factors affecting deposition.
Burdokova et al. (80) have studied the p(NIPAM) induced hydrophilic/hydrophobic
transition, the effect of p(NIPAM) on the surface charge of silica surfaces and the p(NIPAM)
induced hydrophobic attraction and adhesion between silica surfaces using contact angle
measurement, zeta potential measurements and atomic force spectroscopy, respectively. The
contact angle measurement results showed that the presence of p(NIPAM) at silica glass
surfaces causes the silica surfaces to become more hydrophobic. Increasing the molecular
weight of the p(NIPAM) leads to a significant increase in the degree of hydrophobicity,
regardless of the temperature. However, if the temperature is raised above the LCST, the
increase in hydrophobicity is significantly greater than that at a lower temperature. The zeta
potential measurements showed that at room temperature at pH 6, the silica surfaces carry a
strong negative charge. However, the zeta potential decreases at 50°C. The results also
showed that zeta potential significantly decreases by increasing the molecular weight of the
polymer regardless of the temperature. The authors explained that the addition of a non-ionic

Introduction Chapter One
21
polymer onto the charged silica surface shifts the shear plane away from the surface of the
particles leading to a decrease in the diffusion layer potential (zeta potential). The results also
showed that p(NIPAM) adsorbs on a silica surface at low temperature (below the LCST) but
to a much lesser extent than at a higher temperature. The atomic force microscopy (AFM)
results showed net repulsive forces between silica surfaces both in the presence and absence
of p(NIPAM); the surfaces with higher molecular weight p(NIPAM) showed longer range
repulsion which was attributed to steric repulsion.
Studies revealed that p(NIPAM) can be highly useful in facilitating mineral aggregation and
consolidation (80). During mineral flotation procedures, p(NIPAM) can serve as an effective
flotation collector (these are reagents that render the surfaces more hydrophobic and thus
enhance its attachment to air bubbles). At high temperature (above the LCST), when
p(NIPAM) is adsorbed on the surface of the mineral particles, it increases its hydrophobicity.
Zavgorodnya and Serpe (79) also studied the deposition of microgels onto solid surfaces.
They deposited p(NIPAM-co-acrylic acid) (AA) on glass substrates coated with
polyelectrolyte multilayers with different layer thickness and surface charges at different pHs
(below and above the pKa of AA). These multilayers are composed of the polycation
poly(allyl amine hydrochloride) (PAH) and the polyanion poly(sodium 4-styrenesulfonate)
(PSS). During their study they used different techniques such as digital image correlation,
microgel counting, SEM and AFM. They concluded that the charge of the particles is the
most important factor affecting the number of particles deposited on the surface.
1.2.2 Applications of environmental responsive surfaces
1.2.2.1 Control of protein adhesion
The reaction of environmental responsive surfaces with proteins can be either specific or
non-specific. Switching the adsorption of proteins on and off is desirable in both cases, each
of which has its own application. The specific surface – protein interaction can be used to
switch the adsorption/desorption of a specific protein on the environmental responsive
surface and repel the other biological species available (73).
Examples of non-specific protein binding on smart surfaces include the work of Alexander
et al. (72). They managed to switch the adsorption/desorption of fluorescein isothiocyanate
labelled bovine serum albumin (FITC-BSA) on p(NIPAM-co-hexadecanethiol)
micropatterned surfaces tuned by the VPTT of the microgel. Meanwhile, this behavior was

Introduction Chapter One
22
less pronounced after repeated heating/cooling cycles or prolonged incubation. Also,
Uhlmann et al. (51) managed to coat silicon surfaces with a pH-thermo-responsive polymer
coating of poly(2-vinyl pyridine) and p(NIPAM). They used this system to control the
binding of BSA adsorption by changing the temperature from below to above the VPTT.
An example of the specific smart surface – protein interactions is the approach of Zhang et
al. (81). They prepared a p(NIPAM) microgel with a metal chelate co-monomer N-(4vinyl)-
benzyl iminodiacetic acid. In the presence of Cu2+ ions, this co-monomer forms a
coordination complex with the template protein. Accordingly, the addition or omission of
Cu2+ ions can be used to switch the imprinted microgel-protein interactions.
1.3 Context This work aims at designing new NIPAM based particles to be used in different applications.
Four new particles have been designed, synthesized, characterized using different techniques
and used for a relevant application. One of the applications investigated in this work is the
quantitative use of fluorescent p(NIPAM-co-5% vinyl cinnamate) microgel particles to
produce smart surfaces. For p(NIPAM-co-5% lucifer yellow), toxicity studies were
conducted aiming at studying the possibility of using these fluorescent temperature/pH
responsive particles in drug delivery applications. Finally, the ability of p(NIPAM-co-5%
acrylic acid)-hexenol to act as a surfactant was tested using two different oils (tricaprylin and
hexadecane). Also, in this work, various techniques have been used to attach different co-
monomers to p(NIPAM) particles. These include direct polymerization, coupling reactions
and esterification reaction.
1.4 References
1. Saunders B. R., Crowther H. M., Morris G. E., Mears S. J., Cosgrove T., Vincent B. Factors affecting the swelling of poly(N-isopropylacrylamide) microgel particles: fundamental and commercial implications. Colloids and Surfaces A-Physicochemical and Engineering Aspects. 1999;149(1-3):57-64.
2. Gracia L. H., Snowden M. J., Williams P. A. Handbook of Industrial water soluble
polymers. Williams PA, Blackwell; 2007.
3. Crowther H. M., Saunders B. R., Mears S. J., Cosgrove T., Vincent B., King S. M., Yu G. E. Poly(NIPAM) microgel particle de-swelling: a light scattering and small-angle neutron scattering study. Colloids and Surfaces A - Physicochemical and Engineering Aspects. 1999;152:327-333.

Introduction Chapter One
23
4. Ali M. M., Aguirre S. D., Xu Y., Filipe C. D., Pelton R., Li Y. Detection of DNA using bioactive paper strips. Chemical Communications. 2009;6640-6642.
5. Pelton R. H., Chibante P. Preparation of Aqueous Lattices with N- Isopropylacrylamide. Colloids and Surfaces. 1986; 20:247-56.
6. Lowe J. S., Chowdhry B. Z., Parsonage J. R., Snowden M. J. The preparation and physico-chemical properties of poly(N-ethylacrylamide) microgels. Polymer. 1998;39:1207-1212.
7. Hazot P., Delair T., Pichot C., Chapel J. P., Elaissari A. Poly(N- ethylmethacrylamide) thermally-sensitive microgel latexes: effect of the nature of the crosslinker on the polymerization kinetics and physicochemical properties. Comptes Rendus Chimie. 2003;6:1417–24. 8. Eke I., Elmas B., Tuncel M., Tuncel A. A new, highly stable cationicthermosensitive
microgel: Uniform isopropylacrylamide-dimethylaminopropylmeth- acrylamide copolymer particles. Colloids and Surfaces A-Physicochemical and Engineering Aspects. 2006;279(1-3):247-253.
9. Kaggwa G. B., Carey M. J., Such C., Saunders B. R. A new family of waterswellable
microgel particles. Journal of Colloid and Interface Science. 2003;257:392-397.
10. Chen K., Ku Y., Lee C., Lin H., Lin F., Chen T. Immobilization of chitosan gel with cross-linking reagent on PNIPAAm gel/PP nonwoven composites surface. Materials Science & Engineering C-Biomimetic and Supramolecular Systems. 2005;25472-478.
11. Yildiz B., Isik B., Kis M. Synthesis and characterization of thermoresponsive
isopropylacrylamide-acrylamide hydrogels. European Polymer Journal. 2002;38:13431347.
12. Christensen M. L., Keiding K. Study of the compositional heterogeneity in poly(Nisopropylacrylamide-acrylic acid) microgels by potentiometric titration experiments. Colloids and Surfaces A-Physicochemical and Engineering Aspects. 2005;252:61-69.
13. Kim H. I., Park S. J., Kim S. I,, Kim N. G., Kim S. J. Electroactive polymer hydrogels
composed of polyacrylic acid and poly(vinyl sulfonic acid) copolymer for application of biomaterial. Synthetic Metals. 2005;155:674-676.
14. Kaneda I., Sogabe A., Nakajima H. Water-swellable polyelectrolyte microgels
polymerized in an inverse microemulsion using a nonionic surfactant. Journal of Colloid and Interface Science. 2004;275:450-457.
15. http://malverninstruments.co.kr/LabEng/industry/colloids/colloids_stability.htm.
Accessed on 24th of November, 2011.
16. Rosiak J. M. Radiation formation of hydrogels for drug-delivery. Journal of Controlled Release. 1994;31:9-19.

Introduction Chapter One
24
17. Ulanski P., Kadlubowski S., Rosiak J. M. Synthesis of poly(acrylic acid) nanogels by preparative pulse radiolysis. Radiation Physics and Chemistry. 2002;63:533-537.
18. Saunders B. R., Vincent B. Microgel particles as model colloids: theory, properties and
applications. Advances in Colloid and Interface Science. 1999;80:1-25. 19. Murray M. J., Snowden M. J. The preparation, characterization and applications of
colloidal microgels. Advances in Colloid and Interface Science. 1995;54:73-91. 20. Snowden M. J., Vincent B. The temperature-controlled flocculation of cross-linked
latex-particles. Chemical Communications. 1992:1103-1105. 21. Price G., Clifton A. Sonochemical acceleration of persulfate decomposition. Polymer.
1996;37:3971-3973. 22. Goodwin J. W., Ottewill R. H., Pelton R., Vianello G., Yates D. E. Control of particle-
size in formation of polymer lattices. British Polymer Journal. 1978;10:173-180. 23. Benee L. S. Smart Materials: polymeric microgels, their preparation, properties and
application. PhD thesis, University of Greenwich; 2002. 24. Ma X., Xi J., Huang X., Zhao M., Tang X. Novel hydrophobically modified temperature-
sensitive microgels with tunable volume-phase transition temperature. Materials Letters. 2004;58:3400-3404.
25. Majcen N. The development of novel smart wound dressings based on colloidal
microgels and cotton fabric. PhD thesis, University of Greenwich; 2008. 26. Nur H. Colloidal microgels; synthesis, characterization and applications. PhD thesis,
University of Greenwich; 2009. 27. Kratz K. Hellweg T., Eimer W. Structural changes in PNIPAM microgel particles as
seen by SANS, DLS, and EM techniques. Polymer. 2001;42:6631-6639. 28. Lopez V. C., Hadgraft J., Snowden M. J. The use of colloidal microgels as a
(trans)dermal drug delivery system. International Journal of Pharmaceutics. 2005;292:137147.
29. Snowden M. J., Chowdhry B. Z., Vincent B., Morris G. E. Colloidal copolymer
microgels of N-isopropylacrylamide and acrylic acid: pH, ionic strength and temperature effects. Journal of Chemical Society, Faraday Transactions. 1996;92:5013-5016.
30. Hatto N., Cosgrove T., Snowden M. J. Novel microgel-particle colloids: the detailed
characterisation of the layer structure and chain topology of silica: poly(NIPAM) core-shell particles. Polymer. 2000;41:7133-7137.
31. Narumi A. Kaga H., Miura Y., Satoh T., Kaneko N., Kakuchi T. Synthesis of polystyrene
microgel with glucose as hydrophilic segment via controlled free-radical polymerization. Polymer. 2006;47:2269-2273.

Introduction Chapter One
25
32. Zimm B. H. Apparatus and methods for measurements and interpretation of angular
variation of light scattering: preliminary results on polystyrene solutions. Journal of Chemical Physics. 1948;16:1099-1117.
33. Kim K. S., Cho S. H., Shin J. S. Preparation and characterization of monodisperse
polyacrylamide microgels. Polymer. 1995;27:508.
34. Sierra-Martin B., Romro-Cano M. S., Cosgrove T., Vincent B., Fernandez-Barbero A. Solvent relaxation of swelling PNIPAM microgels by NMR. Colloids and Surfaces A - Physicochemical and Engineering Aspects. 2005;270-271:296-300.
35. Cao Z., Liu W., Gao P., Yao K., Li H., Wang G. Toward an understanding of
thermoresponsive transition behavior of hydrophobically modified N-isopropylacrylamide copolymer solution. Polymer. 2005;46:5268-5277.
36. Erbil C. Sezai Saraç A. Description of the turbidity measurements near the phase
transition temperature of poly(N-isopropyl acrylamide) copolymers: the effect of pH, concentration, hydrophilic and hydrophobic content on the turbidity. European Polymer Journal. 2002;38:1305-1310.
37. Woodward N. C., Chowdhry B. Z., Snowden M. J., Leharne S. A., Griffiths P. C.,
Winnington A. L. Calorimetric investigation of the influence of cross-linker concentration on the volume phase transition of poly(N-isopropylacrylamide) colloidal microgels. Langmuir. 2003;19:3202-3211.
38. Kratz K. Hellweg T., Eimer W. Structural changes in PNIPAM microgel particles as
seen by SANS, DLS, and EM techniques. Polymer. 2001;42:6631-6639. 39. Malvern Instruments. Dynamic light scattering: An introduction in 30 minutes.
www.malvern.com.2006. Accessed on 1st of December, 2011. 40. Gracia L. H., Chowdhry B. Z., Snowden M. J. Stabilization of Colloids by Polymers.
Encyclopedia of surface and colloid science. 2006:5775. 41. Shaw D. J. Colloid and surface chemistry. Fourth edition ed.: Elsevier Science; Oxford;
1992. 42. Vincent B., Young C. A., Tadros T. F. Euilibrium aspects of hetero-flocculation in mixed
sterically-stabilized dispersions. Faraday Disc.Chem.Soc.1978;74:337-47. 43. Wang G., Nicholson P. S. Heterocoagulation in ionically stabilized mixed-oxide
colloidal dispersions in ethanol. Journal of the American Ceramic Society. 2001;84:1250-
6. 44. Kim A. Y., Berg J. C. Fractal heteroaggregation of oppositely charged colloids. Journal
of Colloid and Interface Science. 2000;229:607-14.
Introduction Chapter One
26
45. Kim A. Y., Hauch K. D., Berg J. C., Martin J. E., Anderson R. A. Linear chains and
chain-like fractals from electrostatic heteroaggregation. Journal of Colloid and Interface Science. 2003;260:149-59.
46. Pinkrah V. T. The synthesis and physico-chemical characterization of novel microgel
particles. PhD thesis, University of Greenwich; 2004. 47. Derjaguin B.V., Landau L. Theory of the stability of strongly charged lyophobic sols
and the adhesion of strongly charged particles in solutions of electrolytes. Acta Physicochim. 1941;14:633-62.
48. Verwey E.J., Overbeek J.Th. Theory of the stability of lyophobic colloids, the interaction
of sol particles having an electric double layer. Elsevier; Amsterdam; 1948. 49. Thorne J. B. Controlling the interfacial behaviour of colloidal microgel systems. PhD
thesis, University of Greenwich; 2012. 50. Yin J., Guan X., Wang D., Liu S. Y. Metal-Chelating and Dansyl-Labeled
Poly(Nisopropylacrylamide) Microgels as Fluorescent Cu2+ Sensors with Thermo-Enhanced Detection Sensitivity. Langmuir. 2009;25:11367–74.
Burkert S., Bittrich E., Kuntzsch M., Muller M., Eichhorn K. J., Bellmann C., Uhlmann P., Stamm M. Protein Resistance of PNIPAAm Brushes: Application to Switchable Protein Adsorption. Langmuir. 2010;26:1786–95. 52. Lee E. M., Gwon S. Y., Ji B. C., Kim S. H. Temperature and Acid/base-driven Dual
Switching of Poly(N-isopropylacrylamide) Hydrogel with Azo Dye. Fibers and Polymers. 2011;12:142-4.
53. Kim S. H. Hwang I. J., Gwon S. Y., Son Y. A. The thermoresponsive behaviour of
a poly(N-isopropylacrylamide) hydrogel with a D-p-A type pyran-based fluorescent dye. Dyes and Pigments. 2010;87:84-8.
54. Gref R., Amiel C., Molinard K., Daoud-Mahammed S., Sebille B., Gillet B., Beloeil
J. C., Ringard C., Rosilio V., Poupaert J., Couvreur P. New self-assembled nanogels based on host-guest interactions: Characterization and drug loading. Journal of Controlled Release. 2006;111:316-24.
55. Lin S. Y., Chen K. S., Liang R. C. Design and evaluation of drug-loaded wound
dressing having thermo responsive, adhesive, absorptive and easy peeling properties. Biomaterials. 2001;22:2999-3004.
56. Shin Y, Chang J. H., Liu J., Williford R., Shin Y. K., Exarhos G. J. Hybrid nanogels
for sustainable positive thermosensitive drug release. Journal of Controlled Release. 2001;73:1-6.
57. Soppimath K. S., Kulkarni A. R., Aminabhavi T. M. Chemically modified
polyacrylamide-g-guar gum-based crosslinked anionic microgels as pH-sensitive

Introduction Chapter One
27
drug delivery systems: preparation and characterization. Journal of Controlled Release. 2001;75:331-45.
58. Vihola H., Laukkanen A., Hirvonen J., Tenhu H. Binding and release of drugs into
and from thermosensitive poly(N-vinyl caprolactam) nanoparticles. European Journal of Pharmaceutical Sciences. 2002;16:69-74.
59. Zhang X. Z., Lewis P. J., Chu C. C. Fabrication and characterization of a smart drug
delivery system: microsphere in hydrogel. Biomaterials. 2005;26:3299-309. 60. Kaneda I., Sogabe A. Rheological properties of water swellable microgel
polymerized in a confined space. Colloids and Surfaces A-Physicochemical and Engineering Aspects. 2005;270:163-70.
61. Lin F. H., Tsai J. C., Chen T. M., Chen K. S., Yang J. M., Kang P. L., Wu T. H.
Fabrication and evaluation of auto-stripped tri-layer wound dressing for extensive burn injury. Materials Chemistry and Physics. 2007;102:152-8.
62. Pelton R. Temperature-sensitive aqueous microgels. Advances in Colloid and
Interface Science. 2000;85:1-33. 63. Morris G. E., Vincent B., Snowden M. J. Adsorption of lead ions onto
Nisopropylacrylamide and acrylic acid copolymer microgels. Journal of Colloid and Interface Science. 1997;190:198-205.
64. Snowden M. J., Vincent B. inventor. A novel method for the enhanced oil recovery.
1996b. Patent, application number GB 2262117A. 65. Shiroya T., Tamura N., Yasui M., Fujimoto K., Kawaguchi H. Enzyme
immobilization on thermosensitive hydrogel microspheres. Colloids and Surfaces BBiointerfaces. 1995;4:267-74.
66. Nur H., Snowden M. J., Cornelius V. J. Mitchell J. C., Harvey P. J., Benee L. S.
Colloidal microgel in removal of water from biodiesel. Colloids and Surfaces APhysicochemical and Engineering Aspects. 2009;335:133-7.
67. Pinkrah V. T., Beezer A. E., Chowdhry B. Z., Gracia L. H., Cornelius V. J., Mitchell
J. C., Castro-Lopez V., Snowden M. J. Swelling of cationic polyelectrolyte colloidal microgels: Thermodynamic considerations. Colloids and Surfaces APhysicochemical and Engineering Aspects. 2005;262:76-80.
68. Ramkissoon-Ganorkar C., Liu F., Baudys M., Kim S. W. Modulating insulinrelease
profile from pH thermosensitive polymeric beads through polymer molecular weight. Journal of Controlled Release. 1999;59:287-98.
69. Castro Lopez V., Hadgraft J., Snowden M. J. The use of colloidal microgels as a
(trans)dermal drug delivery system. International Journal of Pharmaceutics. 2005;292:137–47.

Introduction Chapter One
28
70. Kanazawa H., Nishikawa M., Mizutani A., Sakamoto C., Morita-Murase Y., Nagata Y., Kikuchi A., Okano T. Aqueous chromatographic system for separation of biomolecules using thermoresponsive polymer modified stationary phase. Journal of Chromatography A. 2008;1191:157-61.
71. Ayano E., Nambu K., Sakamoto C., Kanazawa H., Kikuchi A., Okano T. Aqueous
chromatography system using pH- and temperature-responsive stationary phase with ionexchange groups. Journal of Chromatography A. 2006;1119:58-65.
72. Alarcon C. D., Farhan T., Osborne V. L., Huck W. T., Alexander C. Bioadhesion at
micro-patterned stimuli-responsive polymer brushes. Journal of Materials Chemistry. 2005;15:2089–94.
73. Wischerhoff E., Badi N., Laschewsky A., Lutz J. F. Smart polymer surfaces: concepts and applications in biosciences. Advanced Polymer Science. 2011;240:1-33. 74. Sakamoto C., Okada Y., Kanazawa H., Ayano E., Nishimura T., Andob M, Kikuchi
A., Okano T. Temperature- and pH-responsive aminopropyl-silica ion-exchange columns grafted with copolymers of N-isopropylacrylamide. Journal of Chromatography A. 2004;1030:247-53.
75. Kvítek O., Bot M., Svorcík V. Gold nanoparticles grafting on glass surface. Applied
Surface Science. 2012;258:8991-5. 76. Guilherme M. R., De Moura M. R., Radovanovic E., Geuskens G., Rubira A. F.,
Muniz E. C. Novel thermo-responsive membranes composed of interpenetrated polymer networks of alginate-Ca2+ and poly(N-isopropylacrylamide). Polymer. 2005;46:2668-74.
77. Da Silva R. M., Mano J. F., Reis R. L. Smart thermoresponsive coatings and surfaces
for tissue engineering: switching cell-material boundaries. Trends in Biotechnology. 2007;25:578-83.
78. Nerapusri V., Keddie J. L., Vincent B., Bushnak I. A. Swelling and Deswelling of
Adsorbed Microgel Monolayers Triggered by Changes in Temperature, pH, and Electrolyte Concentration. Langmuir. 2006;22:5036-41.
79. Zavgorodnya O., Serpe M. J. Assembly of poly(N-isopropylacrylamide)-co-acrylic
acid microgel thin films on polyelectrolyte multilayers: Effects of polyelectrolyte layer thickness, surface charge, and microgel solution pH. Colloid and Polymer Sci. 2011;289:591-602.
80. Burdukova E., Li H., Ishida N., O’Shea J. P., Franks G. V. Temperature controlled
surface hydrophobicity and interaction forces induced by poly(N-isopropylacrylamide). Journal of Colloid and Interface Science. 2010;342:586-92.
81. Qin L., He X. W., Zhang W., Li W. Y., Zhang Y. K. Macroporous Thermosensitive
Imprinted Hydrogel for Recognition of Protein by Metal Coordinate Interaction. Analytical Chemistry. 2009;81:7206–16.

Introduction Chapter One
29

p(NIPAM-co-5% VC) Chapter Two
30
Chapter Two Deposition of fluorescent poly(N-isopropylacrylamide-co-vinyl
cinnamate) particles on solid surfaces: quantitative analysis and the factors
affecting it
2.1 Introduction
The deposition of environmentally responsive colloidal microgel particles on surfaces has
been carried out to produce environmentally responsive surfaces. The latter can be used in
many applications such as the control of cell and protein adhesion, (1-4) and bioseparation
(5, 6). For example, the reaction of stimuli-responsive surfaces with proteins can be either
specific or non-specific, each of which has its own application. In the case of specific stimuli-
responsive surfaces, the interactions of proteins with the surface can be controlled in order
to switch the adsorption/desorption of a specific protein onto/from the surface and repel the
other biological species available (7). Alarcón et al. (1) managed to switch the
adsorption/desorption of fluorescein isothiocyanate-labelled bovine serum albumin
(FITCBSA) on poly(N-isopropylacrylamide-co-hexadecanethiol) (p(NIPAM-co-HDT))
micropatterned surfaces, which was controlled by the volume phase transition temperature
(VPTT) of the microgel particles. This behaviour was less pronounced after repeated
heating/cooling cycles or prolonged incubation. Burkert et al. (2) coated silicon surfaces
with a pH-thermo-responsive polymer layer of poly(2-vinyl pyridine) and p(NIPAM). This
system was used to control the binding of BSA adsorption by changing the temperature from
below to above the VPTT. Qin et al. (3) prepared p(NIPAM) microgel particles with a metal
chelate co-monomer N-(4-vinyl)-benzyl iminodiacetic acid. In the presence of Cu2+ ions,
this co-monomer forms a co-ordination complex with the template protein. Accordingly, the
addition or omission of Cu2+ ions can be used to switch the imprinted particle-protein
interactions.
In eukaryotic cell culture, some cells can be grown in free suspension while most cells
derived from solid tissues need to be cultured on a solid surface. To lift the cells off the
surface, common protocols include the use of digestive enzymes such as trypsin but as a
consequence it is impossible to harvest completely intact cells. Using a stimuli-responsive
surface for cell culture solves this problem. Changing environmental conditions (e.g.
temperature) at the surface changes its physicochemical properties such as surface charge
and hydrophilicity; this can be used to automatically switch the cell adhesion at the surface
p(NIPAM-co-5% VC) Chapter Two
31
on and off. Different physicochemical triggers were used to control cell adhesion, including
electrochemistry, light and temperature (7).
Edahiro et al. used a photo- and thermo-responsive surface (cell culture substrate) modified with a polymerizable spiropyran derivative and a copolymer of NIPAM to switch the adhesion of Chinese hamster ovary cells on and off (8). At 37°C, when the surface was
irradiated with UV light (λ=365 nm), the spiropyran was isomerized to a zwitterionic
merocyanine form, which caused the cells to adhere to the surface. Reversing the
isomerization by irradiating the surface with visible light (λ=400 nm) and washing the
surface with cold water caused the cells to be lifted off. Further experiments proved the viability of the cells after the UV and visible light irradiation.
Other researchers have used exclusively thermo-responsive polymers such as p(NIPAM) to
coat surfaces for different applications (4). At 37°C cells tend to adhere more to hydrophobic
surfaces than to hydrophilic ones. Accordingly, using the latter will provide easier removal
of the cells from the surface (7).
One application of thermo-responsive polymer coatings is the separation of biomolecules.
For example, silica beads modified with temperature-sensitive p(NIPAM) were used as a
stationary phase for HPLC for the temperature-modulated separation of steroids and
peptides.
The Okano group (5) has made progress in designing new stationary phases. In 2006, they
developed a new HPLC method for the analysis of non-steroidal anti-inflammatory drugs
such as ibuprofen and ketoprofen (6). They designed a new temperature/pH sensitive
stationary phase by modifying aminopropyl silica beads with a NIPAM-based microgel
particles with two incorporated co-monomers: butyl methacrylate (BMA) and
N,Ndimethylaminopropylacrylamide (DMAPAAm). Changing the temperature and pH
caused the surface of the modified stationary phase to switch between
hydrophilic/hydrophobic and charged/uncharged forms. Temperature changes can also
cause the ion exchange groups to be exposed on the surface or hidden. This highly affects
the retention time of the analytes. The authors suggest the new method will be suitable for
the separation of charged biomolecules such as proteins, DNA and peptides, and they refer
to this technique as “temperature-responsive chromatography.”

p(NIPAM-co-5% VC) Chapter Two
32
The work reported herein aims to determine the quantity of microgel particles deposited on
different surfaces under specified conditions and to discuss the factors affecting it (substrate
surface charge, surface roughness, hydrophilicity/hydrophobicity and the temperature at
which the deposition/desorption processes take place). This is important to move the
applications of stimuli responsive surfaces from the research phase to the practical
application one with special consideration to the commercial factors associated with this
process. To determine the amount of microgel particles deposited on a surface, a simple dip-
coating technique was used, where the solid surface was dipped into a microgel dispersion
of known loading, then left for three hours before the concentration of the supernatant was
measured to infer the number of microgel particles deposited on the surface. A new
fluorescent-labelled microgel particle (poly(N-isopropylacrylamide-co-5% vinyl cinnamate)
was synthesized and fluorescence spectroscopy was used to determine the concentration of
the microgel particles in the dispersions before and after solid dipping. This increases the
sensitivity and reliability of the quantitation of deposited particles.
2.1.1 Vinyl cinnamate Vinyl cinnamate (Figure 2.1) is a fluorescent molecule that is partially miscible in water and
is believed to possess nematicidal activity (9). It was reported that cinnamates are photo-
responsive and photo-cross-linkable and are therefore used in microelectronics (10).
Figure 2.1 Molecular structure of vinyl cinnamate

p(NIPAM-co-5% VC) Chapter Two
33
2.1. Materials and methods
2.2.1 Microgel synthesis
In a 1 L reaction vessel, 1.84 mmol of the initiator 2,2-azobis(2-methylpropionamidine) was
dissolved in 800 mL of distilled water. A three-necked lid was clamped to the reaction vessel,
which was then heated to 70°C with continuous stirring. The monomer (41.97 mmol
NIPAM), co-monomer (1.43 mmol vinyl cinnamate, VC) and cross linker (3.24 mmol N,N’-
methylenebisacrylamide) were stirred in distilled water (200 ml) then transferred into the
reaction vessel containing the initiator and continuously stirred at 70°C for six hours under
an inert atmosphere of nitrogen. When the reaction was complete, the microgel dispersion
was allowed to cool to room temperature. Given the photosensitivity of VC, all the glassware
used was wrapped in aluminium foil to protect the reaction from light and avoid the
dimerization of VC molecules, which may have interfered with the polymerization reaction.
The microgel dispersion was dialyzed in fresh de-ionized water changed daily for a week,
centrifuged to decrease the water content and then the pellet was freeze dried. The resulting
novel poly(NIPAM-co-5% vinyl cinnamate) microgel particles are herein referred to as
p(NIPAM-co-5%VC) .
A 100% p(NIPAM) dispersion was also prepared using the same method (without
incorporation of the VC co-monomer), so that the characteristics of the novel p(NIPAMco-
5% VC) co-polymer particles could be compared with those of a standard, well characterized
system.
2.2.2 Microgel characterization
2.2.2.1 Dynamic light scattering
Dynamic light scattering (DLS) measurements were carried out using a Malvern Zetasizer
Nano ZS and a quartz cuvette with two polished windows (Starna Type 1). All samples were
diluted with deionized water (1 mL of dialysed microgel dispersion was diluted with 2 mL
of water) before measurements. The hydrodynamic diameter of the particles was measured
in response to temperature change from 15 to 60°C). The temperature of the dispersion was
controlled by a Peltier thermocouple. Data were collected every 1°C and the samples were
equilibrated for 2 min before each data collection point. Three measurements, each
consisting of 13 subruns, were taken at each temperature to obtain an average hydrodynamic
diameter. The pH of the samples was adjusted to pH 3 or 10 using diluted HCl and NaOH
to test for the effect of changing pH upon the size of the particles.

p(NIPAM-co-5% VC) Chapter Two
34
2.2.2.2 Fluorescence spectroscopy
A Horiba Jobin Yvon Fluoromax 4 spectrofluorometer was used for fluorescence
experiments to determine the mass of microgel particles either deposited, or subsequently
desorbed from, each surface. Firstly, a calibration curve was obtained using a known
concentration of p(NIPAM-co-5% VC) dispersion that was prepared by re-dispersing freeze
dried particles in water then underwent serial dilution. All samples were excited at 300 nm
and the full emission spectra (315-540 nm) were recorded with bandwidth of 5 nm at 25°C.
A 10 mm path length quartz cuvette with four polished windows (Starna Type 3) was used
for all the measurements.
2.2.3 Slide surface treatments
2.2.3.1 Glass and quartz
Glass microscope slides were supplied by Sail Brand (75 x 25 mm, 1-1.2 mm thick). Quartz
microscope slides (75 x 25 mm) were supplied by GPE Scientific Limited. To study the
effect of surface treatment on the mass of microgel particles adsorbed on the surface, two
types of glass surface were tested. The acid pre-treated glass and quartz slides were prepared
in the same way: they were thoroughly washed with de-ionized water, sonicated in
MeOH:HCl (1:1) (pH 0.12) for 30 min, thoroughly washed with de-ionized water, sonicated
in 2 M H2SO4 for 30 min then finally rinsed with de-ionized water and stored in MeOH.
The base pre-treated glass slides were thoroughly washed with de-ionized water, sonicated
in MeOH:NaOH (1:1) (pH 11) for 30 min, rinsed with deionised water and stored in MeOH.
Prior to use, all the slides were thoroughly washed with water and dried under N2.
2.2.3.2 Stainless steel
Stainless steel slides were supplied by Reco Engineering Components Limited (75 x 25 mm,
1.2 mm thick). The slides were physically cleaned with wire wool, sonicated in 1.5% NaOH
(pH 11) for an hour and then dried in oven at 50°C for an hour before use.
2.2.3.3 Gold
Clean microscope glass slides were coated with gold obtained from Agar Scientific by
sputter coating from an Edwards 150B sputter coater. Both sides of the glass slides were
coated before being kept in a clean container and used without any further treatment.

p(NIPAM-co-5% VC) Chapter Two
35
2.2.3.4 Teflon
A PTFE plastic sheet stock was supplied by RS Company and laser cut into slides (75 x 25
mm). The slides were thoroughly washed and sonicated for an hour in fresh soapy water
(Teepol multipurpose detergent), then stored in fresh soapy water. Prior to use, slides were
thoroughly washed with de-ionized water and dried under N2.
2.2.4 Surface deposition/desorption of microgel particles
Dip coating was used to deposit microgel particles onto the different slide surfaces. The solid
slides were dipped into Petri dishes containing 20 mL of a 2% w/v dispersion of p(NIPAM-
co-5% VC). For each type of solid surface, three samples were coated (deposited) at 25°C
and three at 60°C. Control experiments (of microgel dispersion alone, with no dipping of
slides) were conducted in parallel to account for the adsorption of microgel particles on Petri
dishes.
The slides were left covered in the Petri dishes for 3 hours. The slides were then removed
from the residual microgel dispersions, which were then analysed using fluorescence
spectroscopy (Section 2.5.1).
For desorption experiments, the solid slides previously used in the deposition experiments
(Section 2.4.1) were dipped in Petri dishes containing 20 mL of deionized water and left for
3 hours. Again for each type of solid surface, three samples were desorbed at 25°C and three
were desorbed at 60°C. Parallel control experiments were carried out to account for the
deposition of microgel particles on Petri dishes. The residual microgel dispersions were then
analysed using fluorescence spectroscopy (Section 2.5.1).
2.2.5 Surface characterization
2.2.5.1 Fluorescence spectroscopy
For the fluorescence measurements in all the deposition experiments, as well as the glass,
quartz and stainless steel desorption experiments, the residual microgel dispersions
remaining after deposition/desorption were firstly stirred then diluted by a factor of 1/4000.
For the gold and Teflon desorption experiment fluorescent measurements, the residual
microgel dispersions remaining after desorption were stirred but used undiluted.
Measurements were carried out the same way as section 2.2.2.

p(NIPAM-co-5% VC) Chapter Two
36
The concentration of microgel particles (w/v) in the residual dispersions was calculated from
the fluorescence intensity measurements using the calibration curve (Figure 2.4), then the
mass of microgel particles in each residual dispersion was determined. The mass of microgel
particles deposited was calculated by subtracting the mass of microgel particles in the
residual dispersion from that in the control (2 % w/v microgel dispersion in a Petri dish that
is treated the same as the sample).
2.2.5.2 Atomic force microscopy (AFM)
A Nanosurf easyscan 2 AFM was used to analyse both bare surfaces and surfaces with
deposited microgel particles. Tapping mode was used using Tap190Al-G tips supplied by
Budget Sensors. The image size per run was 10 µm by 10 µm at a resolution of 1024 lines,
each containing 1024 points. The time per line was 1.5 s. Three sites per slide and three
slides of each sample were tested to look at the uniformity of results.
2.2.5.3 Energy dispersive X-ray spectroscopy (EDX)
A Hitachi SU8030 FEG-SEM with a Thermo-Noran NSS system 7 EDX was used to
determine the elemental composition of the bare solid surfaces before the deposition of the
microgel particles.
2.3 Results and discussion
Cinnamic acid derivatives are widely used as fluorescent probes (11). They also possess
some biological activity including an anti-tumor effect (11, 12). In this work, VC was used
as a co-monomer to synthesize fluorescent colloidal microgel particles. The presence of a
pendant vinyl group in the molecular structure of VC makes it readily polymerizable.
2.3.1 Characterization of p(NIPAM-co-5% VC) microgel particles
2.3.1.1 Size and VPTT
Figure 2.2 shows the change in particle size of p(NIPAM-co-5% VC) in response to
temperature change. The initial particle diameter (below the VPTT) is approximately 280
nm and shrinks to 160 nm upon increasing the temperature above the VPTT. This is
significantly smaller than 100% p(NIPAM) (synthesized in the same way) with a typical
initial particle size of 550 nm (13) that shrinks to 290 nm above the VPTT. The incorporation
of a hydrophobic co-monomer such as VC decreases the extent of water incorporation in the
particle in comparison to 100% p(NIPAM), leading to a smaller particle size.

p(NIPAM-co-5% VC) Chapter Two
37
Temp. (°C) pH 10 pH 3
Figure 2.10 over a temperature range of 15-60°C 2 The effect of temperature (heating) on the particle size of p(NIPAM-co-5% VC) at pH 3 and
Figure 2.2 also indicated that the VPTT of the p(NIPAM-co-5% VC) particles is around
33°C, very similar to the VPTT of 34°C reported for the p(NIPAM) microgel particles (11).
Together, these results confirm that incorporation of VC did not lead to a loss of
thermosensitivity of the microgel particles but did influence (reduce) the particle size and
extent of de-swelling.
Figure 2.2 also shows no significant difference between the particle size at pH 3 and 10. This
is because the VC molecule does not include ionizable groups that would be affected by the
change in pH. The minimal difference observed between the two pH values can be attributed
to the cationic initiator groups on the particle surface.
2.3.1.2 Fluorescence spectroscopy
In order to confirm whether the VC co-monomer had been incorporated into the microgel
particle structures, the emission spectra of 100% p(NIPAM) was compared with that of
p(NIPAM-co-5% VC) when excited at the same wavelength (300 nm) (Figure 2.3). There is
a clear shift in the emission band when comparing the two spectra. Furthermore, the
p(NIPAM-co-5% VC) has the same reported λem as that of VC (350 nm) (14), which also

p(NIPAM-co-5% VC) Chapter Two
38
supports the conclusion that VC was incorporated into the new particles. In order to
determine the concentration (w/v) of dispersions containing an unknown quantity of
p(NIPAM-co-5% VC), a calibration curve at 25°C was prepared (Figure 2.4).
Figure 2.5 compares the response of 50 µg/mL p(NIPAM-co-5% VC) and 100% p(NIPAM)
to changing temperature (heating-cooling) using fluorescence spectroscopy. When the
temperature increases, the temperature-sensitive microgel particles shrink. This increases
the local density of the incorporated VC fluorophores within the particle, leading to an
increase in the overall fluorescence intensity of the microgel dispersion. The figure also
shows that the VPTT p(NIPAM) is around 35°C while that of p(NIPAM-co-5% VC) is
around 30°C. This is close to the VPTT shown by the DLS data in figure 2.2.
Figure 2.5 shows that the fluorescence intensity of p(NIPAM-co-5% VC) is almost five times
greater than that of 100% p(NIPAM) considering that both dispersions are of the same
concentration. Therefore, addition of a VC fluorophore co-monomer provides a sensitive
method (at a concentration of 50µg/mL) for the quantitative analysis of the concentration
(w/v) of microgel dispersions.
2.3.2 Characterization of solid surfaces
2.3.2.1 Energy dispersive X-ray spectroscopy
Figure 2.6 shows the EDX spectra and element composition of stainless steel, quartz, glass
and Teflon samples used in this work as detected by EDX. The data show that the main
component of stainless steel is iron followed by a considerable amount of chromium. This
agrees with the results of Tanaka et al. (15). The stainless steel slides also contain nickel and
traces of manganese. Unlike glass, quartz samples are purely composed of SiO2. EDX results
show that the glass surface include sodium, calcium and traces of magnesium, aluminium,
potassium and sulphur.
The table also shows that the main constituents of Teflon used in this work are carbon and
fluorine without any other impurities. This is to be predicted given that the Teflon molecular
structure is CF2-CF2 (16).

p(NIPAM-co-5% VC) Chapter Two
39
p(NIPAM) p(NIPAM-co-5% VC) Figure 2.3 Comparison between the emission spectra
of 50 μg/mL of 100 % p(NIPAM) and5% VC) in
water, excited at 300 nm at 25°C p(NIPAM-co
1200000
Conc. (μg/mL)
Figure 2.4 Calibration curve of p(NIPAM-co5% VC) in water at 25°C, excited at 300 nm and emitted at 350 nm
Temp. (°C) Heating p(NIPAM) 5% VCHeating p(NIPAM-co-5% VC) Cooling p(NIPAM) 5% VCCooling p(NIPAM-co-5% VC)
Heating p(NIPAM)Cooling p(NIPAM)
Figure 2.5 Fluorescence intensity of 50 µg/mL 100% p(NIPAM) and p(NIPAM-co-5% VC) in water in response to heating/cooling from 15-60°C, excited at 300 nm and emitted at 350 nm
0
100000
200000
300000
400000
500000
600000
340 390 440 490 540 λ (nm)
y = 2E+07x - 226759 R² = 0.998
0
1000000
2000000
3000000
4000000
5000000
6000000
0 0.1 0.2 0.3 0.4

p(NIPAM-co-5% VC) Chapter Two
40
Element Element % Fe 72.0
Stainless Cr Ni 18.57.7 steel
Mn 1.7
Element Element %
Si 46.7 O 53.3

p(NIPAM-co-5% VC) Chapter Two
41
Quartz
Element Element
% Na 10.1 Mg 2.7 Al 0.8
Glass SiS 33.80.1
K 0.5 Ca 5.1
Teflon
Element Element %
C 20.3 F 79.7
Figure 2.6 Energy-dispersive x-ray analysis (EDX) of
stainless steel, quartz, glass and Teflon
2.3.3 Factors affecting the mass of p(NIPAM-co-5% VC) deposited on different
surfaces
Table 2.1 shows the mass of microgel particles adsorbed on each surface based on
fluorescence spectroscopy measurements. At 25°C (lower than the VPTT of p(NIPAM-
co5% VC), Figure 2.2). Stainless steel adsorbed the highest mass of microgel followed by
glass pre-treated with base, glass pre-treated with acid, quartz, gold then teflon. The mass of
particles deposited on steel was about five times that deposited on glass, ten times that
deposited on quartz, fifty of gold and three hundred and sixty that on Teflon. Not only did
steel have a large mass of microgel particles deposited on its surface but also a low
desorption percentage and therefore the highest affinity towards the microgel particles.
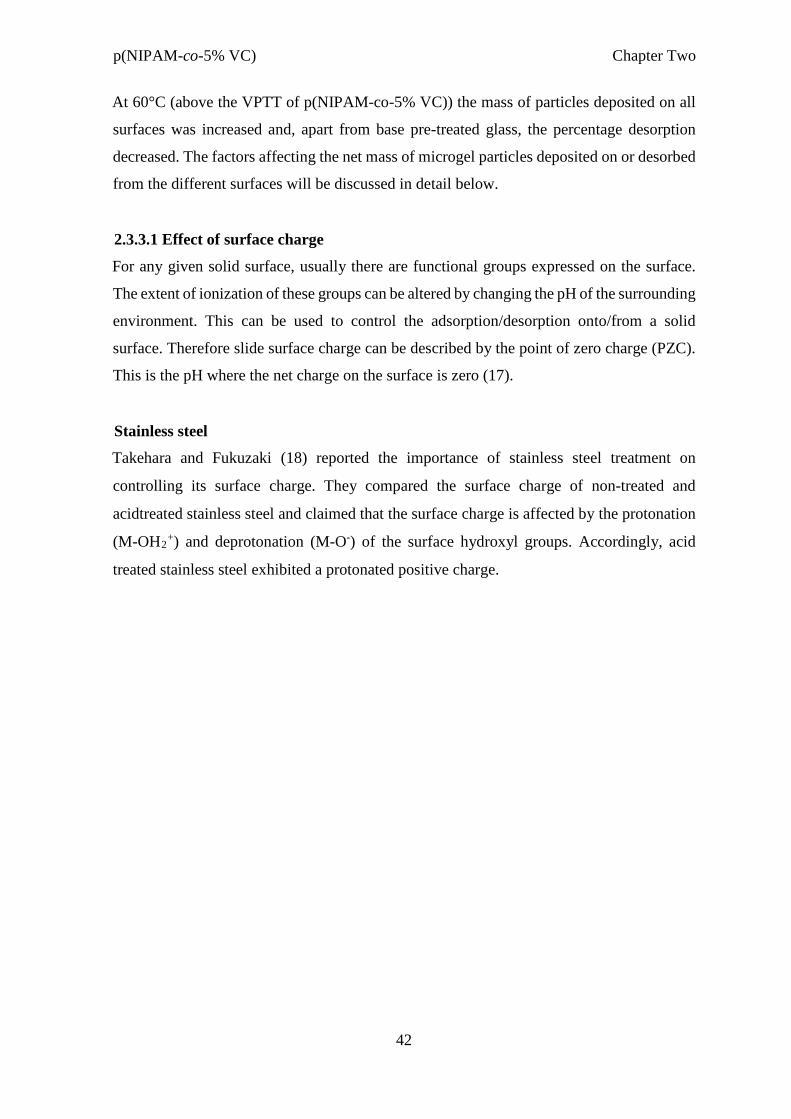
p(NIPAM-co-5% VC) Chapter Two
42
At 60°C (above the VPTT of p(NIPAM-co-5% VC)) the mass of particles deposited on all
surfaces was increased and, apart from base pre-treated glass, the percentage desorption
decreased. The factors affecting the net mass of microgel particles deposited on or desorbed
from the different surfaces will be discussed in detail below.
2.3.3.1 Effect of surface charge
For any given solid surface, usually there are functional groups expressed on the surface.
The extent of ionization of these groups can be altered by changing the pH of the surrounding
environment. This can be used to control the adsorption/desorption onto/from a solid
surface. Therefore slide surface charge can be described by the point of zero charge (PZC).
This is the pH where the net charge on the surface is zero (17).
Stainless steel
Takehara and Fukuzaki (18) reported the importance of stainless steel treatment on
controlling its surface charge. They compared the surface charge of non-treated and
acidtreated stainless steel and claimed that the surface charge is affected by the protonation
(M-OH2+) and deprotonation (M-O-) of the surface hydroxyl groups. Accordingly, acid
treated stainless steel exhibited a protonated positive charge.

p(NIPAM-co-5% VC) Chapter Two
Table 2.1 Expected and measured characteristics of solid surfaces before deposition of microgel particles (surface charge, relative hydrophobicity and surface
roughness), and microgel particle mass deposited and % desorbed from slide surfaces at 25°C and 60°C Slide surface Expected
slide surface charge1
Contact angle with
water and
hydrophobicity/ hydrophilicity
Measured
average
surface
roughness
Sa (nm)
25˚C 60˚C
Net mass microgel particles deposited (mg/m2)
%
Desorption
Net mass microgel particles deposited (mg/m2)
%
Desorption
Stainless steel Negative 70-75° (21)
Hydrophobic
89.60 21.64 (3.87) 6.30 25.84 (1.10) 4.20
Gold Negative 56-66° (21, 22) Hydrophobic
7.07 0.43 (0.02) 41.00 5.32 (2.88) 6.60
Quartz Slightly negative
22° (23)
Hydrophilic
0.37 1.99 (1.60) 55.70 2.91 (2.22) 39.00
Base pre-treated glass
Negative <10° (23)
Hydrophilic
0.02 4.83 (1.38) 0.06 8.94 (0.80) 19.00
1 Expected slide surface charge at pH of deposition microgel dispersion (pH 6.7) 2
Standard deviations presented in brackets
42

p(NIPAM-co-5% VC) Chapter Two
Acid pre-treated glass
Slightly negative
0.02 3.71 (0.85) 2.87 4.55 (1.89) 0.20
102° (23) Telfon Neutral 103.7 0.06 (0.03) 90.00 2.13 (1.15) 34.00
Hydrophobic

p(NIPAM-co-5% VC) Chapter Two
45
Tanaka et al. (15) studied the concentration of hydroxyl groups on stainless steel surfaces
and determined the PZC. The EDX data (Table 2.1) show a similarity between the
composition of stainless steel used in this work and that used by Tanaka, who found
untreated stainless steel to have a PZC of 5.6. Accordingly, it was claimed that the surface
charge of stainless steel in a solution of pH 11 (far above the PZC) is negative.
In this work, stainless steel samples were sonicated in NaOH (pH 11) to expose the surfaces
to a pH far above the PZC to ensure that the surface charge of the slides was negative prior
to immersion in the microgel dispersion. Also, knowing that the pH of the microgel
dispersion used for adsorption experiments carried out in this work is 6.7 (still above the
PZC of stainless steel), it can be concluded that the surface charge of stainless steel
immersed in the microgel dispersion remains negative. The negatively charged stainless
steel surface electrostatically attracts the positively charged microgel particles (which are
cationic due to the initiator used during the particle synthesis). This increases the mass of
microgel particles deposited on the surface as well as decreases the percentage desorption
and hence stainless steel showed a high net deposited mass of microgel particles (Table 2.1).
Glass and quartz
When immersed in a liquid, the surface charge of glass depends on its chemical composition
and the pH of the solution. This can either cause the association or dissociation of protons
to/from the oxide surface leading to positive or negative surface charge, respectively
(Equations 2.1a and b) (19, 20).
𝑆𝑆𝑆𝑆𝑆𝑆𝑆𝑆 + 𝑆𝑆+ ⇌ 𝑆𝑆𝑆𝑆𝑆𝑆𝑆𝑆2+ (a) Equation 2.1
𝑆𝑆𝑆𝑆𝑆𝑆𝑆𝑆 ⇌ 𝑆𝑆𝑆𝑆𝑆𝑆− + 𝑆𝑆+ (b)
The point of zero charge of glass is pH 3.5, while that of silica is pH 2.8 (24). In this work,
glass slides pre-treated with acid and base were used, whilst quartz samples were treated
with acid.
For the base pre-treated glass samples, the pH of the solution used for sonication was much
higher than the PZC of glass. So, the glass slide surface charge at this point was considered

p(NIPAM-co-5% VC) Chapter Two
46
to be strongly negative. When immersed in the microgel dispersion with a pH above the
PZC, the glass surface charge is still expected to be strongly negative.
For the acid pre-treated samples (glass and quartz), the pH of the solutions used for treatment
was much lower than the PZC of both glass and quartz, so the surface charge of the treated
sample surfaces was considered to be positive, with SiOH2+ groups dominant on the surface
prior to immersion in the microgel dispersion. When immersed in the microgel dispersion
with pH (6.7) above the PZC of both glass and quartz, surfaces are expected acquire a low
magnitude of negative charge. In comparison to the base pretreated glass samples, both glass
and quartz pre-treated with acid are expected to have relatively fewer negative charges on
their surface.
Table 2.1 shows that the mass of microgel particles deposited on glass samples pre-treated
with a base (highly negatively charged) was more than that deposited on those pre-treated
with acid (with relatively less negative surface charge than the base treated slides). Also, the
percentage of desorption of particles from base-treated glass samples was much less than
that of the acid-treated ones at 25°C. This is attributed to the strong electrostatic attraction
between the highly negatively charged surface (base pre-treated samples) and the positively
charged particles; these forces are much less for the acid pre-treated slides and hence the
much higher percentage desorption. This indicates that the effect of substrate surface charge
on the mass of deposited particles is pronounced.
At 60°C, the same pattern of results is observed except that the percentage desorption of
particles from the base treated glass is higher than that desorbed from the acid treated one
(Table 2.1). This could be due to increased repulsion forces between the positively charged
particles (which have an increase in surface charge density when the temperature exceeds
the VPTT) (25).
Gold
Barten et al. (26) studied the deposition of linear positively charged poly(2-vinyl pyridine)
(PVP+) on a gold electrode. Knowing that the PZC of gold is 4.9 (26), they studied the effect
of changing the pH in the range of 3.5 to 6 (it is claimed that the surface charge of gold is
constant above pH 6) (26). A slight increase in the adsorbed amount of PVP+ upon increasing
the pH of the solution was reported. This can be attributed to the increase of the electrostatic

p(NIPAM-co-5% VC) Chapter Two
47
attraction forces between the negatively charged surface (gold in pH above 4.9) and the
positively charged PVP+.
In this work, gold-coated glass was immersed in a microgel dispersion of pH 6.7. Being
above the PZC of gold (4.9) (26), the surface was then expected to be negatively charged.
This suggests the presence of electrostatic attraction forces between the negatively charged
substrate surface and the positively charged particles which is expected to result in a high
net deposition mass of microgel particles. However, Table 2.1 shows that the mass of
microgel particles deposited on gold substrate surfaces is the second lowest deposited mass
when compared to the other surfaces. This can be attributed to the magnitude of negative
charge on each substrate surface.
Teflon
The molecular structure of Teflon is a polymer of tetrafluoroethene. The absence of ionisable
groups in the polymer suggests that the surface is neutral. Also, the CF3 backbone minimizes
the Van der Waals interaction forces between Teflon surfaces and anything that comes in
contact with them. For these reasons, Teflon surfaces are said to have low surface energy
and hence used as non-stick materials. So, the effect of the substrate surface charge is
expected to be eliminated in this case. This is reflected by the fact that the mass of microgel
particles deposited on Teflon was observed to be the least compared to the other substrates.
The expected surface charge of each surface and their relative hydrophobicities are
summarized in Table 2.1. An electrostatic attraction force is generated between the
negatively charged surfaces (stainless steel, base pre-treated glass, acid pre-treated glass,
quartz and gold) and the positively charged microgel particles. For the acid pre-treated glass
and quartz samples, the electrostatic attraction force between the surface and the particle is
expected to be less than that between the base pre-treated glass sample and the particle. On
the other hand, Teflon is neutral and thus there is no electrostatic force in this case.
Table 2.1 shows that the highest mass of deposited particles and the lowest desorption
percentages were observed for stainless steel, base pre-treated glass, acid pre-treated glass,
quartz and gold (negatively charged surfaces), while the neutral surface (Teflon) had the
lowest deposition mass and the highest desorption percentage. Accordingly, the data suggest
that the surface charge affects the mass of microgel particles adsorbed on/desorbed from

p(NIPAM-co-5% VC) Chapter Two
48
surfaces. The magnitude of the slide surface charge is also thought to be a significant factor
affecting the adsorption/desorption of microgel particles on/from different negative
surfaces. It was not possible to measure this within the scope of this study, however, as per
discussed, an estimate of the relative surface charge could be inferred (e.g. acid pre-treated
glass was less negatively charged than the base pre-treated one).
For the same surface (glass), increasing the negative surface charge on the glass slide by
treating it with a base rather an acid increases the electrostatic attraction force between the
negative glass surface and the positive microgel particle which increases the mass of
deposited microgel particles (Table 2.1).
At 60°C, the ranking of different solid surfaces considering the adsorption/desorption of
microgel particles on/from the surface is similar to that at 25°C. The minor changes observed
(for example, at 25°C the mass of microgel particles adsorbed on acid pre-treated glass is
more than that adsorbed on quartz while at 60°C, the opposite is observed) are thought to be
due to the increased particle surface charge at 60°C (above the VPTT) which increases the
electrostatic repulsion between particles. Also, the difference between the magnitude of
surface charge of the different solid slide substrates will be an important factor.
2.3.3.2 Effect of surface roughness
Surface roughness (Sa) is a description of the “irregularity” of a surface (27). Figure 2.7 and
Table 2.1 provide AFM topography images of each surface and the roughness average (Sa)
of different surfaces before the deposition of microgel particles. These can be determined
from line profiles across a section of surface (Equation 2.2).
𝑆𝑆𝑎𝑎 𝐿𝐿 0|𝑑𝑑𝑥𝑥 Equation 2.2
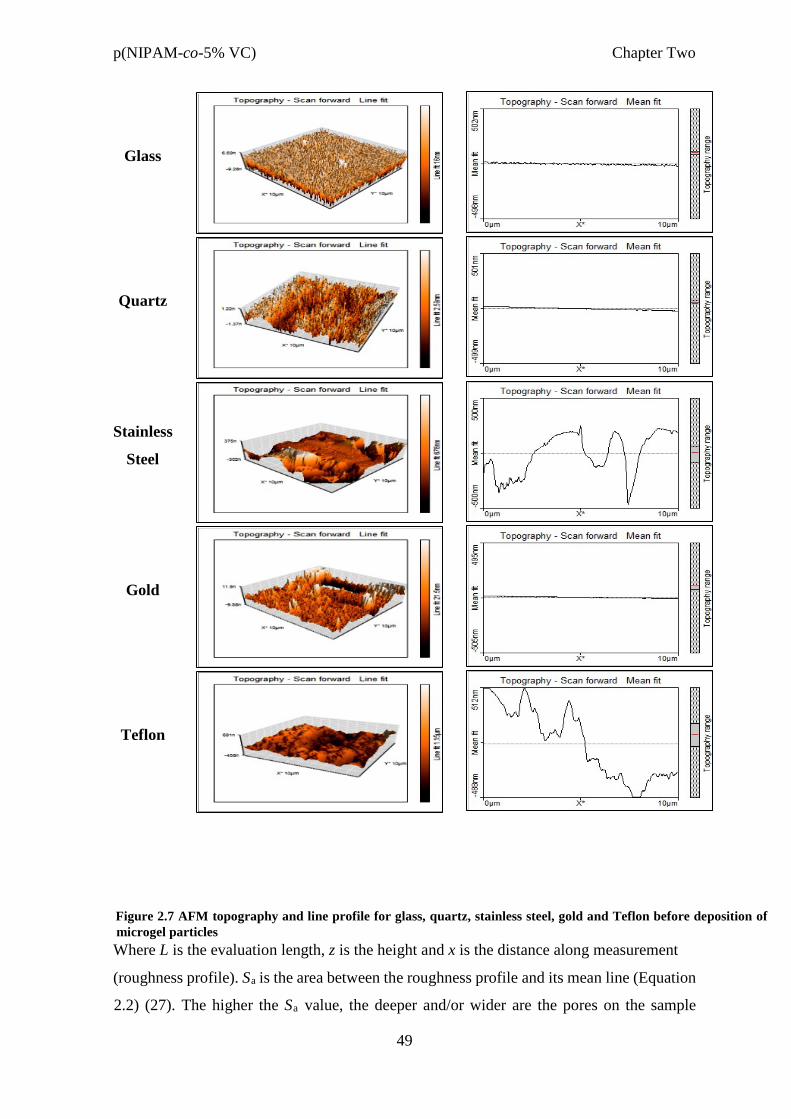
p(NIPAM-co-5% VC) Chapter Two
49
Figure 2.7 AFM topography and line profile for glass, quartz, stainless steel, gold and Teflon before deposition of microgel particles Where L is the evaluation length, z is the height and x is the distance along measurement
(roughness profile). Sa is the area between the roughness profile and its mean line (Equation
2.2) (27). The higher the Sa value, the deeper and/or wider are the pores on the sample
Glass
Quartz
Stainless
Steel
Gold
Teflon

p(NIPAM-co-5% VC) Chapter Two
50
surface. These pores can trap microgel particles inside and increase the surface area where
the particles can be adsorbed. The Sa values of the solid surfaces before the deposition of
microgel particles (Table 2.1) show that Teflon has the highest surface roughness used in
this work, followed by stainless steel, gold, quartz and glass, respectively. Comparing the
surface roughness data (Table 2.1 and Figure 2.7) to that of deposition (Table 2.1), one can
conclude that the degree of irregularity of the surface does not affect the mass of microgel
particles deposited on/desorbed from it. For example, at 25°C, Teflon had the highest Sa and
yet it had the lowest adsorption and the highest desorption percentage, whilst stainless steel
had the second highest Sa, the highest deposition but one of the lowest desorption values.
On the other hand, correlating the effect of surface roughness with that of surface charge, it
is clear that for negatively charged surfaces (stainless steel gold, quartz and base-treated
glass), the one that the possess a significantly higher Sa (stainless steel) showed higher
adsorption and lower desorption than the rest. For the latter three negatively charged
surfaces where there was not much difference in Sa, the magnitude of surface charge is
thought to be the main reason why the mass of microgel particles adsorbed on/desorbed
from the surface varied. Hence, it can be concluded that the surface roughness can be
considered as a secondary effect that boosts that of surface charge. The combination of both
(surface charge and roughness) strongly influences the extent of adsorption and desorption
on/from the surface. Comparing the mass of the net adsorbed particles on the stainless steel
and base-treated glass samples (Table 2.1) supports this explanation. Both samples acquire
a negative surface charge, yet the adsorption of the positive microgel particles on the
stainless steel surface is 4.5 times more than that on glass. This is thought to be due to the
fact that the average surface roughness of stainless steel is significantly higher than that of
glass (Table 2.1 and Figure 2.7).
2.3.3.3 Effect of hydrophilicity/hydrophobicity
A comparison of the hydrophilicity/hydrophobicity of all surfaces (Table 2.1) suggests that
this factor has a minimal effect on the amount of particles deposited on/desorbed from
different surfaces. The surface with the highest adsorption and lowest desorption percentage
(stainless steel) and that with the lowest adsorption and highest desorption (Teflon) are both
thought to be hydrophobic (21, 23). Also, the difference between the mass of particles
deposited on hydrophilic surfaces is significant. This suggests that the effect of
hydrophilicity/hydrophobicity is of less importance than that of substrate surface charge and

p(NIPAM-co-5% VC) Chapter Two
51
surface roughness. However, further studies with more systematic comparison characters
may help elucidate influence of relative hydrophilicity in more details.
2.3.3.4 Effect of temperature
The deposition/desorption data provided in Table 2.1 shows that the mass of microgel
particles deposited on all surfaces at 60°C was higher than that at 25°C. Also, the percentage
desorption decreased with temperature (except for base pre-treated glass), leading to an
increased net mass of deposition. When the temperature increases above the VPTT (32°C),
the particles deswell (Figure 2.5). This means that the surface charge density on the particle
increases which increases the electrostatic attraction between the positively charged
microgel particles and the negatively charged surfaces. Also, the number of de-swollen
particles that fit in the pores of solid surfaces will be more than that of the swollen ones.
AFM images (Figure 2.8) show that increasing the temperature above the VPTT affects the
packing of the particles. In case of base pre-treated glass, the percentage of desorbed
microgel particles is more than that at 25°C. The suggested reason for this is the increased
electrostatic repulsion between the positive microgel particles when the temperature exceeds
the VPTT (32°C).
Table 2.2 shows the Sa of adsorbed particles on different surfaces at 25 and 60°C. Despite
the fact that the mass of microgel particles deposited at 60°C is higher than that deposited at
25°C (Table 2.2), the Sa (representing the roughness of the deposited layer) is generally
(except for stainless steel and Teflon) smaller at 60°C than at 25°C. This is due to the regular
dense packing of particles at 60°C while at 25°C this is not always the case (Figure 2.8). In
case of stainless steel and Teflon, the Sa at 60°C is bigger than that at 25°C. This is thought
to be caused by the increased electrostatic repulsion force between the positive microgel
particles (due to increased surface charge density above the VPTT).

p(NIPAM-co-5% VC) Chapter Two
52
(a) (b)
Figure 2. 8 AFM images of p(NIPAM-co-5% VC) particles deposited on glass (a) at 25°C and (b) at 60°C
Table 2.2 Comparison between the surface roughness averages of stainless steel, gold, quartz, glass and Teflon coated with p(NIPAM-co-5% VC) microgel particles at 25°C and 60°C
Sa at
25°C
(nm)
Sa at
60°C
(nm)
Stainless steel 65 77
Gold 10 9
Quartz 25 10
Glass pre-treated with base
17 9
Glass pre-treated with acid
18 10
Teflon 19 43

p(NIPAM-co-5% VC) Chapter Two
53
2.4 Conclusions
A novel fluorescent temperature sensitive microgel particle (p(NIPAM-co-5% VC)) was
synthesized and characterized. It was then used to develop a novel sensitive method (using
fluorescence spectroscopy) to quantify the mass of microgel particles deposited on different
solid surfaces per unit area and the factors affecting it. The mass of microgel particles
deposited on/desorbed from different surfaces is affected by different factors, the most
important of which is the surface charge followed by the surface roughness of the solid
surface. The effect of temperature has also proved to be significant since it alters the
physico-chemical properties of the microgel particles and hence alters its interaction with
the solid surface. On the other hand, the effect of hydrophilicity/hydrophobicity of the solid
surface was shown to be of less importance than the previously tested factors.
2.5 References
1. Alarco C. D., Farhan T., Osborne V. L., Huck W. T., Alexander C. Bioadhesion at micro-patterned stimuli-responsive polymer brushes. Journal of Materials Chemistry. 2005:15:2089–94.
2. Burkert S., Bittrich E., Kuntzsch M., Muller M., Eichhorn K. J., Bellmann C.,
Uhlmann P., Stamm M. Protein Resistance of PNIPAAm Brushes: Application to Switchable Protein Adsorption. Langmuir. 2010:26:1786–95.
3. Qin L., He X. W., Zhang W., Li W. Y., Zhang Y. K. Macroporous thermosensitive
imprinted hydrogel for recognition of protein by metal coordinate interaction. Analytical Chemistry. 2009:81:7206–16.
4. Nagase K., Kobayashi J., Okano T. Temperature-responsive intelligent interfaces for
biomolecular separation and cell sheet engineering. Journal of the Royal Society Interface. 2009:6:S293–S309.
5. Kanazawa H., Nishikawa M., Mizutani A., Sakamoto C., Morita-Murase Y., Nagata
Y., Kikuchi A., Okano T. Aqueous chromatographic system for separation of biomolecules using thermoresponsive polymer modified stationary phase. Journal of Chromatography A. 2008;1191:157-61.
6. Ayano E., Nambu K., Sakamoto C., Kanazawa H., Kikuchi A., Okano T. Aqueous
chromatography system using pH- and temperature-responsive stationary phase with ionexchange groups. Journal of Chromatography A. 2006:1119:58-65.
7. Wischerhoff E., Badi N., Laschewsky A., Lutz J. F. Smart polymer surfaces: concepts and applications in biosciences. Advanced Polymer Science. 2011:240:1-33.

p(NIPAM-co-5% VC) Chapter Two
54
8. Edahiro J., Sumaru K., Tada Y., Ohi K., Takagi T., Kameda M., Shinbo T., Kanamori T., Yoshimi Y. In situ control of cell adhesion using photoresponsive culture surface. Biomacromolecules. 2005: 6:970-4.
9. Kong J. O., Lee S. M., Moon Y. S., Lee S. G., Ahn Y. J. Nematicidal Activity of Cassia and Cinnamon Oil Compounds and Related Compounds toward Bursaphelenchus xylophilus (Nematoda: Parasitaphelenchidae). Journal of Nematology. 2007;39:31–6.
10. Assaid I., Bosc D., Hardy I. Improvements of the Poly(vinyl cinnamate)
Photoresponse in Order to Induce High Refractive Index Variations. The Journal of Physical Chemistry. 2004;108:2801–6.
11. Singh T. S., Mitra S. Interaction of cinnamic acid derivatives with serum albumins:
A fluorescence spectroscopic study. Spectrochimica Acta Part A: Molecular and Biomolecular Spectroscopy. 2011:78:942–8.
12. Min J., Meng-Xia X., Dong Z., Yuan L., Xiao-Yu L., Xing C. Spectroscopic studies
on the interaction of cinnamic acid and its hydroxyl derivatives with human serum albumin. Journal of Molecular Structure. 2004:692:71–80.
13. Mohsen R., Vine G. J., Majcen N., Alexander B. D., Snowden M. J. Characterization
of thermo and pH responsive NIPAM based microgels and their membrane blocking potential. Colloids and Surfaces A: Physicochemical and Engineering Aspects. 2013:428:53-9.
14. Torres J. M. Designing dual thermoresponsive & photoresponsive materials for
biomedical applications. MSc. thesis, McMaster University; 2011.
15. Tanaka Y., Saito H., Tsutsumi Y., Doi H., Imai H., Hanawa T. Active Hydroxyl Groups on Surface Oxide Film of Titanium, 316L Stainless Steel, and Cobalt-ChromiumMolybdenum Alloy and Its Effect on the Immobilization of Poly(Ethylene Glycol). Materials Transactions. 2008:49:805-11.
16. Teng H. Overview of the Development of the Fluoropolymer Industry. Applied
Sciences. 2012:2:496-512.
17. Appel C., Ma L. Q., Rhue R. D., Kennelley E. Point of zero charge determination in soils and minerals via traditional methods and detection of electroacoustic mobility. Geoderma. 2003:113:77– 93.
18. Takehara A., Fukuzaki S. Effect of the Surface Charge of Stainless Steel on
Adsorption Behavior of Pectin. Biocontrol Science. 2002:7:9-15.
19. Sabia R., Ukrainczyk L. Surface chemistry of SiO2 and TiO2±SiO2 glasses as determined by titration of soot particles. Journal of Non-Crystalline Solids. 2000:277:1-9.

p(NIPAM-co-5% VC) Chapter Two
55
20. Behrens S. H., Grier D. G. The Charge of Glass and Silica Surfaces. Online report, Department of Physics, James Franck Institute, and Institute for Biophysical Dynamics, The University of Chicago. 2008. http://physics.nyu.edu/grierlab/charge6c/charge6c.pdf. Accessed on 15th of February, 2012.
21. Arkles B. Hydrophobicity, Hydrophilicity and Silanes. Online report, Paint &
Coatings Industry magazine. 2006. http://www.gelest.com/goods/pdf/Library/advances/HydrophobicityHydrophilicityandSila nes.pdf. Accessed on 10th of March, 2012.
22. Osborne K. L. Temperature-Dependence of the Contact Angle of Water on Graphite, Silicon, and Gold. MSc. thesis, Worcester Polytechnic Institute; 2009.
23. Sumner A. L., Menke E. J., Dubowski Y., Newberg J. T., Penner R. M., Hemminger
J. C., Wingen L. M., Brauners T., Finlayson-Pitts B. J. The nature of water on surfaces of laboratory systems and implications for heterogeneous chemistry in the troposphere. Physical Chemistry Chemical Physics. 2004:6:604–613.
24. Churchill H., Teng H., Hazen R. M. Correlation of pH-dependent surface interaction
forces to amino acid adsorption: implications for the origin of life. American Mineralogist. 2004:89:1048–55.
25. Thorne J. B., Vine G. J., Snowden M. J. Microgel applications and commercial
considerations. Colloid and Polymer Science. 2011: 289:629-646.
26. Barten D., Kleijn J. M., Stuart M. A. Adsorption of a linear polyelectrolyte on a gold electrode. Physical Chemistry Chemical Physics. 2003:5:4258–64.
27. Amaral R., Chong L. H. Surface Roughness. Online report, 2002.
http://citeseerx.ist.psu.edu/viewdoc/download?doi=10.1.1.198.163&rep=rep1&type=pdf. Accessed on the 7th of November 2013.
p(NIPAM-co-5% AA)-EDA-RhB Chapter Three
56
Chapter Three Design, synthesis and characterization of fluorescent poly(N-
isopropylacrylamide-coacrylic acid)-ethylene diamine-rhodamine B particles
3.1 Introduction
Microgels can be functionalized with markers or labeling agents to aid targeted delivery and
diagnosis (1-5). In previous research, microgels have been coupled to inorganic particles
and dyes to synthesize magnetic-responsive and photosensitive drug delivery systems
respectively (7). They have also been designed to respond to various external stimuli such
as pH, ionic strength and electric current (8). Owing to their water-swollen polymeric
structure and their controllable rheology, microgels have been employed as tissue-
engineering scaffolds (9), as artificial muscle materials (10), as mechanical supporting gels
in degenerated invertebral discs (11) and for vocal fold regeneration (12).
In this work, p(NIPAM-co-5% acrylic acid) (p(NIPAM-co-5% AA)) particles were coupled
to rhodamine B (RhB) using ethylene diamine (EDA) as a linker molecule between them.
The objective of this work was to produce a fluorescent temperature and pH responsive
particle that can be useful in different applications such as diagnostics. Also, the ability to
incorporate fluorescent molecules with different molecular structures and to produce mono-
dispersed particles was tested.
3.1.1 Rhodamine B (RhB)
Rhodamine B is a fluorescent molecule used as a labelling agent. Its IUPAC name is [9-
(2carboxyphenyl)-6-diethylamino-3-xanthenylidene]-diethylammonium chloride. It has the
advantages of a long wavelength of the spectroscopic signal of absorption and emission
(which makes it easy to separate from biomolecules which mostly have short excitation and
emission wavelengths (13)), high fluorescence quantum yield (that increases by increasing
the hydrophobicity of its environment) and high photo-stability (14). Rhodamine B (RhB)
is also used as a fluorescence standard (in the Parker and Rees method) to determine the
absolute fluorescence quantum yield of other molecules (15). The quantum yield of
rhodamine B is in the range of 0.45 to 0.5 (15).

p(NIPAM-co-5% AA)-EDA-RhB Chapter Three
57
The molecular structure of rhodamine B is shown in Figure 3.1. The molecular structure is
characterized by three ionizable groups, two of which are cationic (dimethyl amino groups)
and one is anionic (carboxylic acid group).
The acid dissociation constant (pKa) of RhB was calculated using ACD labs (6). RhB was
found to have two close pKa values, these are: pH 3 ± 0.9 and pH 3.8 ± 0.8 (6). The
concentration of each protonation state of the RhB molecule versus pH as well as its two
pKa values are represented in Figure 3.2 (6). At pH 2, the three ionizable groups are
protonated (6). When the pH increases above the pKa, the COOH group (group 3) is
deprotonated into COO- as well as one of the cationic groups (group 1). Group 2 (N+) carries
a positive charge at all pH values (6). The positive charges on the cationic dimethyl amino
groups (groups 1 and 2) are stabilized by the resonance effect of the aromatic rings attached
to it (16).
This work aims at coupling the COOH group (group 3) of RhB to the NH2 group of EDA
and thus groups 1 and 2 are the only ionizable groups remaining after conjugation.
3.2 Materials and methods
3.2.1 Materials
N-isopropylacrylamide (NIPAM) (Wako), acrylic acid, N,N’-methylenebisacrylamide
99%, potassium persulfate, ethylenediamine (EDA), N-hydroxysuccinimide 98%, N-
(3dimethylaminopropyl)-N’-ethylcarbodiimide hydrochloride, rhodamine B,
Group 1 Group 2
Group 3
Cl -
Figure 3.1 The molecular structure of r hodamine B

p(NIPAM-co-5% AA)-EDA-RhB Chapter Three
58
(4morpholineethanesulfonic acid monohydrate) 99.5% (MES) and sodium chloride were
purchased from Sigma Aldrich UK and used without further purification.
3.2.2 Methods
3.2.2.1 Synthesis
For preparation of fluorescent microgels, three synthetic steps where performed: (i)
synthesis of p(NIPAM-co-5% AA) microgels (ii) coupling of COOH groups in (NIPAMco-
5% AA) to EDA and (iii) coupling of microgels-EDA to rhodamine B fluorescent dye.
3.2.2.2 Synthesis of p(NIPAM-co-5% AA) (w/v)
p(NIPAM-co-5% AA) microgel particles were prepared using surfactant-free emulsion
polymerization technique. In a 1 L reaction vessel, 0.5 g of potassium persulfate (initiator)
was dissolved in 800 mL of deionized water. A three-necked lid was clamped to the reaction
vessel, which was then heated to 70°C with continuous stirring. The monomer (4.75 g
NIPAM), co-monomer (0.25 g acrylic acid) and cross linker (0.5g of N,N’-
methylenebisacrylamide) were dissolved in 200 mL of deionized water then transferred in
the reaction vessel containing the initiator. The reaction was then left to proceed for six
hours under and inert atmosphere of nitrogen. After the reaction was terminated, the
microgel particles were dialyzed in deionized water to remove unreacted species from the
dispersion. The dialysis was undertaken in 7 cycles, changing the water every 24 hours.
3.2.2.3 Microgel-EDA coupling
Coupling of p(NIPAM-co-5% AA) to EDA was achieved via carbodiimide chemistry. The
microgel particles (0.80 gp(NIPAM-co-5% AA)) was dispersed in 100 mL MES (0.1 M, pH
5.5). In another beaker, 0.24 g of EDA was dissolved in 5 mL MES (0.1 M, pH 5.5). EDA
was then added drop-wise to the p(NIPAM-co-5% AA) dispersion and stirred.
Nhydroxysuccinimide (0.86 g) and N-(3-dimethylaminopropyl)-N’-ethylcarbodiimide
hydrochloride (0.76 g) were added into the reaction beaker and the reaction was left stirring
at 300 rpm for 4 hours. Following the synthesis, p(NIPAM-co-AA)-EDA was dialyzed in
deionized water for 7 cycles and then lyophilized.
3.2.2.4 Microgel-EDA-rhodamine B coupling
The EDA-containing microgels were further coupled to rhodamine B (RhB). Rhodamine B
contains carboxylic acid groups which facilitate conjugation to the amine groups of EDA

p(NIPAM-co-5% AA)-EDA-RhB Chapter Three
59
via carbodiimide chemistry. Microgel-EDA particles (0.5 g) were dispersed in 80 mL MES
(0.1 M, pH 5.5) in a beaker. In a separate beaker, a solution of RhB (0.3698 g) was dissolved
in 5 mL MES. The RhB was added drop-wise to the microgel dispersion before N-
hydroxysuccinimide (0.5424 g) and N-(3-dimethylaminopropyl)-N’-ethylcarbodiimide
hydrochloride (0.4789 g) solid powders were added. The reaction proceeded for 4 hours at
room temperature, stirring at 300 rpm. The new particles were dialyzed in fresh deionized
water which was changed daily for 7 days.
3.2.2.5 Characterization of microgel particles
Microgel particles were characterized using several techniques to study the physicochemical
properties of the novel particles. Dynamic light scattering was used to determine the particle
size and the electrophoretic mobility of microgel particles. The turbidity of the particles was
analyzed by UV spectroscopy. Infrared spectroscopy was used to determine the functional
groups in each of the steps during the particle synthesis. Fluorescence spectroscopy and
fluorescence microscopy were used to confirm the fluorescence of the novel RhB containing
particles as well as visualize them and confirm the ability to trace them. Scanning electron
microscope (SEM) was used to generate high-resolution images of the morphology of the
particles.
3.2.2.5.1 Dynamic light scattering
Dynamic light scattering (DLS) measurements were carried out using a Malvern Zetasizer
Nano ZS. All experiments were repeated 3 times, the figures shown were plot using the
average of the experiments while the error bars represent the calculated the standard
deviations.
The hydrodynamic diameter of the particles was measured in response to temperature in the
15 to 60°C range. All samples were diluted with deionized water (1 mL of dialyzed microgel
dispersion was diluted with 2 mL of water) before measurements. A quartz cuvette with two
polished windows (Starna Type 1) was used for all the measurements and the temperature
of the dispersion was controlled by a Peltier thermocouple. Data were collected every 1°C
and the samples were equilibrated for 2 min before each data collection point. Three
measurements, each consisting of 13 subruns, were taken at each temperature to obtain an
average hydrodynamic diameter. Experiments were also conducted where the pH of the
p(NIPAM-co-5% AA)-EDA-RhB Chapter Three
60
samples was adjusted to different pH values using HCl and NaOH to test for the effect of
changing pH upon the size of the particles.
To measure the electrophoretic mobility ofp(NIPAM-co-5% AA)-EDA andp(NIPAM-co5%
AA)-EDA-RhB, samples were diluted (1 mL of dialyzed microgel dispersion was diluted
with 2 mL of NaCl solution) to reach a salt concentration of 1 x 10⁻⁴ M NaCl. The
electrophoretic mobility was measured in response to temperature change (heating) across
the range of 15-60°C every 1°C with 2 minutes equilibration time using a disposable folded
capillary cell.
3.2.2.5.2 Fluorescence spectroscopy
The fluorescence emission spectra of microgels and RhB were determined using a
FluoroMax-4 Spectrofluorometer from Horiba Jobin Yvon. All samples were excited at 430
nm and the full emission spectra (450–1050 nm) were recorded with bandwidth of 5 nm at
25°C. A 10 mm path length quartz cuvette with four polished windows (Starna Type 3) was
used for all the measurements.
3.2.2.5.3 Infrared spectroscopy
A Shimadzu IR-Prestige 21 Fourier-transform infrared spectrophotometer FT-IR was used
to carry out the IR experiment in this work. Microgel dispersions were dialyzed and freeze-
dried then the solid samples were used for IR experiments using attenuated total reflection
(ATR) with a diamond crystal.
3.2.2.5.4 Microscopy
3.2.2.5.4.1 Scanning electron microscopy
A Hitachi SU8030 cold cathode field-emission gun scanning electron microscope operating
with an accelerating voltage of 30 kV was used to obtain images of the novel particles using
a transmission detector. To prepare the samples, 1 µL of each of p(NIPAM-
co-5% AA), p(NIPAM-co-5% AA)-EDA, p(NIPAM-co-5% AA)-EDA-RhB was tipped
onto a separate carbon coated copper TEM grid. Samples (on the grid) were then left to dry
in air, placed on the sample holder, then introduced in the vacuum chamber of the SEM.
3.2.2.5.4.2 Fluorescence microscopy
A Nikon Eclipse 90i microscope, fitted with a fluorescein isothiocyanate filter (FITC) and a
Nikon Digital Sight DS-U3 camera were used to take fluorescent images of the particles.

p(NIPAM-co-5% AA)-EDA-RhB Chapter Three
61
Plan Fluor x100 oil Ph3 DLL lens was used with working distance of 0.16 mm. The
numerical aperture of the objective was 1.3, refractive index 1.5 and exposure time 3 s. The
sample was placed on a microscopic slide, left to dry in air and then immersion oil was
added on it.
3.3 Results and discussion
The advantages of environmental-responsive microgels include the flexibility of the
synthesis strategies used to produce them and the ability to incorporate co-monomers with
different structures and of different chemical classes. Different synthesis strategies have
been used by different researchers to synthesize NIPAM based particles with different
comonomers. An important factor that affects the synthesis protocol is the molecular
structure of the co-monomer. Most of the co-monomers that incorporate a pendant vinyl
group can undergo direct polymerization synthesis where the co-monomer can be directly
added to the synthesis reaction vessel. For co-monomers with no vinyl group but their
structure possesses amino (NH2) or carboxylic (COOH) groups, coupling chemistry can be
used to attach these groups to relevant groups in the particle (acidic or basic groups,
respectively). For example, to attach a co-monomer with a NH2 group, a p(NIPAM-
coacrylic acid) particle can be synthesized and then the COOH of acrylic acid can be coupled
to the NH2 of the pendant molecule (attachment). In this work, the pendant molecule used
(rhodamine B) includes a COOH group in its molecular structure (Figure 3.1). Accordingly,
a three-steps-synthesis method was designed as previously discussed in the methods section.
Figure 3.2 represents the suggested molecular structure of p(NIPAM-co-5% AA)-EDARhB.
The surface of the particle carries SO4- from the anionic initiator (potassium persulfate) used
during the synthesis of p(NIPAM-co-5%AA) in step 1. Some of the COOH acid groups
(from the co-monomer acrylic acid) are expected to be conjugated to NH2 of EDA (in step
2) while some are expected to be free.
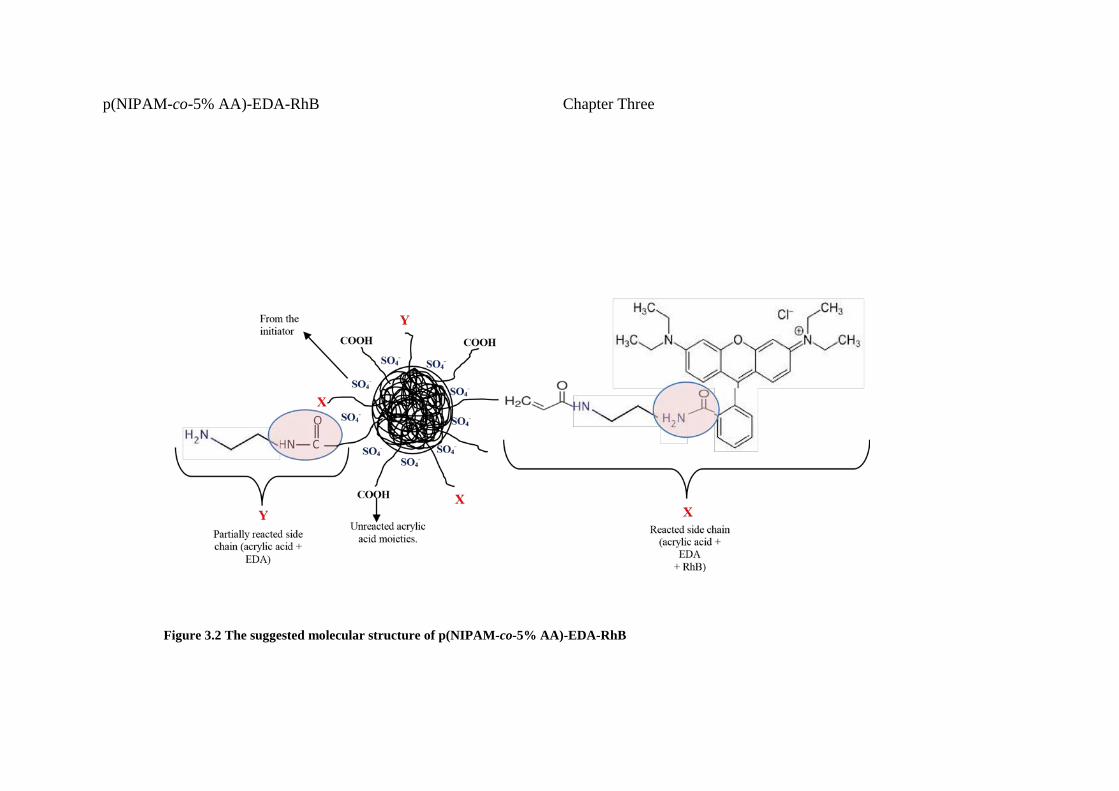
p(NIPAM-co-5% AA)-EDA-RhB Chapter Three
Figure 3.2 The suggested molecular structure of p(NIPAM-co-5% AA)-EDA-RhB

60

p(NIPAM-co-5% AA)-EDA-RhB Chapter Three
64
Similarly, some of the NH2 of the EDA are expected to be conjugated with the COOH
of RhB while some others are expected to be unattached. Accordingly, two chains are
expected to be conjugated to the particle; these are COOH-EDA-RhB and COOH-EDA.
Charged species on the particle surface are expected to be: SO4-, COOH of AA, NH2
of EDA and N+ of RhB.
3.3.1. Particle size analysis
3.3.1.1 Effect of temperature
Figure 3.3 shows the change in particle size of p(NIPAM-co-5% AA), p(NIPAM-co5%
AA)-EDA and p(NIPAM-co-5% AA)-EDA-RhB. The figure shows that the three
different particles mentioned above maintain the thermo-sensitivity where the particle
size changes when the temperature exceeds the VPTT (35°C). The initial particle size
of p(NIPAM-co-5% AA) at 15°C is around 500 nm which is similar to the previously
reported particle size previously mentioned in literature (17). Increasing the
temperature above the volume phase transition temperature (VPTT) (35°C), the
particles deswell and the particle size decreases to be 250 nm. Table 3.1 shows that the
PdI value (polydispersity index = standard deviation/mean size) of p(NIPAM-co5%
AA) at both 15°C and 60°C is 0.04. Having a PdI value very close to zero indicates the
mono-dispersity of the particles. This means that all the particles are of the same size.
This is because the AA molecule incorporates a vinyl group and is directly co-
polymerized with the p(NIPAM) particles during the synthesis.
Conjugating the COOH groups of p(NIPAM-co-5% AA) with the amino group of
hydrophilic ethylenediamine (EDA) causes the particle size to increase. At 15°C, the
particle size of p(NIPAM-co-5% AA)-EDA is 1150 nm which is almost double that of
p(NIPAM-co-5% AA) at the same temperature. p(NIPAM) particles are characterized
by a hydrophobic core and a hydrophilic shell (18), accordingly, when conjugated with
a hydrophilic co-monomer, it tends to be located in the particle shell (surface).
Hydrogen bonding between the hydrophilic EDA on the particle surface and the water
molecules in the dispersion is created. This leads to an increase in the particle size as
shown in Figure 3.3.

p(NIPAM-co-5% AA)-EDA-RhB Chapter Three
65
A change in the behavior of p(NIPAM-co-5% AA)-EDA particles is observed at 38°C
which is slightly higher than the equivalent temperate (VPTT) of p(NIPAM-co-5% AA)
(35°C). This is due to the increased hydrogen bonding between the particles and the
water molecules (18) (due to incorporating a hydrophilic co-monomer). At 15°C,
p(NIPAM-co-5% AA)-EDA particles show a PdI of 0.02 which means that they are all
of the same size (all swollen due to the EDA).
15 20 25 30 35 40 45 50 55 60
Temperature (°C)
5Figure 3.3 The effect of temperature on the particle size of% AA)-EDA and p(NIPAM-co-5% AA)-EDA-RhB at
pH 11.5 p(NIPAM-co-5% AA), p(NIPAM-co-
Table AA)-EDA and p(NIPAM3.1 Particle size and polydispersity index values of -co-5% AA)-EDA-RhB (standard deviations are presented between p(NIPAM-co-5% AA), p(NIPAM-co-5% brackets)
15°C 60°C
Dh (nm) PDI Dh (nm) PDI
p(NIPAM-co-5% AA) 510 (±19) 0.04 230 (±4) 0.04
p(NIPAM-co-5% AA)-EDA 1150 (±77) 0.02 420 (±3) 0.6
p(NIPAM-co-5% AA)-EDARhB
507 (±44) 0.65 250 (±20) 0.8
When the temperature is above the VPTT, the particles show a higher PdI value (0.16)
indicating some variance between the sizes of different particles. Flocculation of some
of the particles can also be a possible cause of higher PdI values at temperatures higher
than the VPTT.

p(NIPAM-co-5% AA)-EDA-RhB Chapter Three
66
Further conjugating the NH2 group of EDA with the COOH group of RhB results in a
smaller particle size than that of p(NIPAM-co-5% AA)-EDA (Figure 3.3). A
hydrophobic co-monomer tends to be located in the hydrophobic core of the particle;
accordingly, the conjugated hairs tend to be directed towards the core of the particle
rather than the surface, leading to a smaller particle size. It may also be possible that
the attachment of the bulky RhB molecules in the particle causes steric hindrance
between the COO- from the AA and accordingly decreases the electrostatic repulsion
forces on the particle and decreases its size.
In case of p(NIPAM-co-5% AA)-EDA-RhB, the change in the behavior of the particles
is observed at a temperature around 33°C (Figure 3.3). The incorporation of a
hydrophobic co-monomer, limits the hydrogen bonding between the particle and the
water molecules and hence lower the temperature where the change in behavior is
observed (18). Table 3.1 shows that the PdI of p(NIPAM-co-5% AA)-EDA-RhB at
15°C (below the VPTT) is 0.65. This shows that the particles of the same dispersion
acquire different sizes. This can be attributed to an uneven conjugation of RhB with the
NH2 of the different particles in the dispersion. At 60°C (above the VPTT), the PdI
decreases to 0.25 showing more mono-dispersity between the particles. It is thought
that lower PdI values can be obtained by adjusting the conjugation reaction conditions
such as the concentrations of the reactants (p(NIPAM-co-5% AA)-EDA and the RhB).
Despite repeating the size measurements for the three particles several times, the overall
dataset remain the same. It would appear to be unreliable (for p(NIPAM-co-5% AA)-
EDA and p(NIPAM-co-5% AA)-EDA-RhB) and therefor these particles were not used
for further study (use in an application).
3.3.1.2 Effect of pH
The data shown in Figure 3.3 and Table 3.1 were measured at pH 11.5. Lowering the
pH of p(NIPAM-co-5% AA)-EDA-RhB dispersions to pH values of 6 and 2, results in
particle aggregation. EDA has two dissociation constant values (pH 7.56 and pH 10.71)
(19) due to the presence of two amino groups in its molecular structure. In this work,
one of the amino groups of EDA is coupled to the COO- of AA while the other one is
pendant (in case of p(NIPAM-co-5% AA)-EDA-RhB, some of the second amino
groups is coupled to the COO- of RhB while some others are pendant).

p(NIPAM-co-5% AA)-EDA-RhB Chapter Three
67
Accordingly, the pKa of the pendant EDA molecules is expected to be 10.7. At lower
pH values (below the pKa of EDA, the amino groups of NH2 are protonated to (NH3+).
On the other hand, the surface of the particles is negative due to the anionic initiator
(potassium persulfate) and the COO- of acrylic acid (in case of pH 6) with pKa of 4.2
(17). This creates intra and inter-particle electrostatic attraction forces that result in
particle aggregation. At higher pH values (pH 11.5), the NH2 groups of EDA are
deprotonated, the RhB molecule (with pKa values of 3 ± 0.9 and pH 3.8 ± 0.8) carries
a weak positive charge (due to the distribution effect caused by the resonance in the
aromatic rings (Figure 3.1)) on one of the dimethyl amino groups and the COOH of AA
is deprotonated into COO-. Accordingly, the dominating charge is negative which
initiates inter and intra-particle electrostatic repulsion forces and hence maintains the
stability of the dispersion.
3.3.2 Electrophoretic mobility
Both particles (p(NIPAM-co-5% AA)-EDA and p(NIPAM-co-5% AA)-EDA-RhB)
carry negative charges due to SO4- from the initiator and the free COOH from the
acrylic acid. The free NH2 from the EDA is expected to remain deprotonated at pH 11.5
(above the pKa of EDA). In case of p(NIPAM-co-5% AA)-EDA-RhB particles, the
positive charge of the RhB molecule due to the dimethyl amino group is stabilized by
the resonance of the aromatic rings attached as well as the alkaline pH in the media.
This suggests that the effect of the positive charge on the RhB will be minimal (16).
Figure 3.4 shows the effect of temperature on the electrophoretic mobility of p(NIPAM-
co-5% AA)-EDA and p(NIPAM-co-5% AA)-EDA-RhB. The figure shows that both
particles are negatively charged. At 15°C, the electrophoretic mobility of p(NIPAM-
co-5% AA)-EDA-RhB (-2 µmcm/Vs) is higher than that of p(NIPAM-co5% AA)-EDA
(-1 µmcm/Vs) indicating less positive charges and hence more net negative charges on
the particles. This agrees with the particle size data in Figure 3.3. At 15°C, the particle
size of p(NIPAM-co-5% AA)-EDA is 1150 nm, while that of p(NIPAM-co-5% AA)-
EDA-RhB at the same temperature is around 500 nm. This means that the size of
p(NIPAM-co-5% AA)-EDA particle is more than twice that of p(NIPAM-co-5% AA)-
EDA-RhB. This leads to a lower surface charge density on the bigger particle
(p(NIPAM-co-5% AA)-EDA) than that on the smaller one (p(NIPAMco-5% AA)-

p(NIPAM-co-5% AA)-EDA-RhB Chapter Three
68
EDA-RhB) and hence lower electrophoretic mobility. Another possible reason, is the
fact that the larger particles move slower than the smaller ones. So, the movement of
p(NIPAM-co-5% AA)-EDA towards the electrode is slower than that of p(NIPAM-co-
5% AA)-EDA-RhB and accordingly shows lower electrophoretic mobility. A
combination of both reasons is suggested to cause p(NIPAM-co-5% AA)EDA-RhB to
be higher than p(NIPAM-co-5% AA)-EDA.
For p(NIPAM-co-5% AA)-EDA, increasing the temperature to above 35°C, the
particles deswell leading to increased surface charge density. Accordingly, an increase
in the electrophoretic mobility is observed (Figure 3.4). In case of p(NIPAM-co-5%
AA)-EDA-RhB, a different behavior is observed. Increasing the temperature to above
33°C (the temperature where the behavior of the particles starts to change according to
the particle size data (Figure 3.3), little effect on the electrophoretic mobility was
observed (Figure 3.4). A suggested explanation to this behavior is the steric hindrance
effect of the long hairy chain (AA-EDA-RhB). When the particle deswells, the hairy
chains collapse masking some of the charges on the particle surface which leads to a
lower electrophoretic mobility.
Figure 3.4 The effect of temperature on the electrophoretic mobility of p(NIPAM-co-5% AA)-EDA and p(NIPAM-co-5% AA)-EDA-RhB at pH 11.5

p(NIPAM-co-5% AA)-EDA-RhB Chapter Three
69
3.3.3 Fluorescence spectroscopy
3.3.3.1 Effect of addition of rhodamine B
Figure 3.5 compares the fluorescence spectra of p(NIPAM-co-5% AA)-EDA,
p(NIPAM-co-5% AA)-EDA-RhB and RhB excited at 540 nm at 25ºC at pH 6.5 (above
the pKa of RhB). At this diluted concentration (0.2 µg/mL), the particles do not
aggregate at pH 6.5 as in the higher concentration (0.16 mg/mL) used for the dynamic
light scattering measurements. The figure shows that p(NIPAM-co-5% AA)EDA does
not show any fluorescence. It also shows that the maximum emission wavelength of
p(NIPAM-co-5% AA)-EDA-RhB is the same as that of RhB (630 nm). The
fluorescence intensity of RhB is a lot higher than that of p(NIPAM-co-5% AA)EDA-
RhB (although both are prepared to be of the same theoretical concentration of the
particles). This is because the added amount of rhodamine B during the conjugation to
p(NIPAM-co-5% AA)-EDA particles is not all actually conjugated to the particles.
Accordingly, the theoretical concentration of the fluorophore (RhB) attached to the
p(NIPAM-co-5% AA)-EDA does not equal its actual concentration in dispersion.
Table 3.2 The fluorescence intensity of 0.2 µg/mL p(NIPAM-co-5% AA)-EDA, p(NIPAM-co-5% AA)-EDA-RhB and RhB excited at 540 nm at 25ºC at pH 6.5
Emission fluorescence intensity at 630 nm (CPS)
p(NIPAM-co-5% AA)-EDA 13950
p(NIPAM-co-5% AA)-EDA-RhB 1159290
RhB 16272240
Table 3.2 shows the emission fluorescence intensity of 0.2 µg/mL p(NIPAM-co-5%
AA)-EDA, p(NIPAM-co-5% AA)-EDA-RhB and RhB excited at 540 nm. The
fluorescence intensity of p(NIPAM-co-5% AA)-EDA is mainly attributed to the light
scattering of the particles (20). The fluorescence of p(NIPAM-co-5% AA)-EDA-RhB
is attributed to both the light scattering of the particles plus the fluorescence of the RhB
molecules. Accordingly, subtracting the value of the fluorescence intensity of
p(NIPAM-co-5% AA)-EDA from that of p(NIPAM-co-5% AA)-EDA-RhB will yield
the actual fluorescence of p(NIPAM-co-5% AA)-EDA-RhB without turbidity effect
(1145340 CPS). Comparing this value to that of RhB alone (of the same concentration)

p(NIPAM-co-5% AA)-EDA-RhB Chapter Three
70
suggests that the fluorescence intensity of p(NIPAM-co-5% AA)EDA-RhB is
equivalent to approximately 7% of that of RhB solution at the same concentration (in
other words equivalent to 0.014 µg/mL of RhB). Knowing that during the coupling
reaction of RhB to the p(NIPAM-co-5% AA)-EDA particles, the concentration of RhB
added was 4.35 µg/mL, it can be concluded that 0.32 % of the added RhB was actually
coupled to the particles. This calculation is only an estimate of the percentage
incorporation of RhB in the particles. Other factors might affect the fluorescence of
RhB when incorporated in a different environment (the particles) such as fluorescence
quenching from hydrochloric acid and sodium hydroxide for pH adjustments or any
unreacted species in the dispersionused.
p(NIPAM) 5%AA-EDA p(NIPAM)5%AA-EDA-RhB RhB
Figure 3.5 The fluorescence spectra of 0.2 µg/mL p(NIPAM-co-5% AA-EDA), p(NIPAM-co-5% AA)-EDA-RhB and RhB excited at 540 nm at 25°C at pH 6.5
3.3.3.2 Effect of temperature
The effect of temperature on the fluorescence intensity of p(NIPAM-co-5% AA)EDA-
RhB and RhB at pH 2, 6.5 and 11.5 is shown in Figure 3.6. The figure shows that for
both p(NIPAM-co-5% AA)-EDA-RhB and RhB (at different pH values), increasing the
temperature did not cause a change in the emission wavelength (630 nm) of the
0
2000000
4000000
6000000
8000000
10000000
12000000
14000000
16000000
18000000
600 620 640 660 680 700
λ (nm)

p(NIPAM-co-5% AA)-EDA-RhB Chapter Three
71
dispersion/solution, respectively. On the other hand, a consistent decrease in the
fluorescence intensity was observed by increasing the temperature. A possible
explanation to this is that when the temperature increases, it causes the particles to
deswell and the hairs to collapse on the particle surface; this might have a quenching
effect on the fluorescence of RhB. An exception for the noticed temperature effect is
the fluorescence intensity of p(NIPAM-co-5% AA)-EDA-RhB at pH 11.5 where the
fluorescence intensity at 45˚C is higher than that at 35˚C.

p(NIPAM-co-5% AA)-EDA-RhB Chapter Three
72
λ (nm) λ (nm)
(2a)
(3a)
(1a) (1b)
0
20000
40000
60000
80000
100000
600 620 640 660 680 700 0
4000000
8000000
12000000
16000000
600 620 640 660 680 700
) (2 b
0
4000000
8000000
12000000
16000000
20000000
600 620 640 660 680 700 λ (nm)
0
400000
800000
1200000
600 620 640 660 680 700
λ (nm)
) (3 b
0
4000000
8000000
12000000
16000000
20000000
600 620 640 660 680 700
λ (nm)
0
100000
200000
300000
400000
600 620 640 660 680 700 λ (nm)

p(NIPAM-co-5% AA)-EDA-RhB Chapter Three
73
Figure 3.6 Fluorescence emission spectra of 0.2 µg/mL p(NIPAM-co-5% AA)-EDA-RhB at (1a) pH 2 (2a) pH 6.5 and (3a) pH 11.5 and 0.2 µg/mL RhB excited at 540 nm at (1b) pH 2 (2b) pH 6.5 and (3b) 11.5 at 25°C (blue), 35°C (green) and 45°C (red) 3.3.3.3 Effect of pH
The acid dissociation constant (pKa) and the different protonation states of RhB was
calculated using ACD/I-Lab (6). The effect of pH on the fluorescence of RhB and
p(NIPAM)5% AA-EDA-RhB is shown in Figures 3.7 and 3.8, respectively.
RhB pH 2 RhB pH 6.5 RhB pH 11.5
Figure 3.7 Fluorescence of 0.2 µg/mL RhB excited at 540 nm at 25°C at pH 2.5, 6.5 and 11.5
0
4000000
8000000
12000000
16000000
600 610 620 630 640 650 660 670 680 690 700
λ (nm)
0
200000
400000
600000
800000
1000000
1200000
1400000
600 610 620 630 640 650 660 670 680 690 700 λ (nm)

p(NIPAM-co-5% AA)-EDA-RhB Chapter Three
74
p(NIPAM)5%AA-EDA-RhB pH 2.5 p(NIPAM)5%AA-EDA-RhB pH 6.8 p(NIPAM)5%AA-EDA-RhB pH 11.5
Figure 3.8 Fluorescence of 0.2 µg/mL p(NIPAM-co-5% AA)-EDA-RhB excited at 540 nm at 25°C at pH 2.5, 6.5 and 11.5
For RhB (Figure 3.7), at pH 2, a maximum emission band (λem) is shown at 632 nm
(21). When the pH increases to 6.5 and 11.5, a blue shift was observed where the λem
is around 625 nm. This agrees with the findings of Jorge et al. (21) who observed a
shift in the emission band of RhB impregnated into silica when the pH is increased
from 2 to 7. They suggest that RhB is stable in acidic media while increasing the pH
causes a change in the physical and spectroscopic properties of rhodamine B. The pKa
of RhB is 3.7, at pH between pH 4 and 8, it is said to be zwitterionic (22). When the
pH exceeds 3.8, the carboxylic groups are deprotonated which creates electrostatic
attraction forces between the COO- and the N+ on the xanthene groups leading to
aggregation of RhB monomers forming dimers (22). It is also observed that the
fluorescence intensity decreases by decresing the pH. This agrees with the findings of
Fikry et al. (23) who reported that decreasing the pH of RhB dissolved in polar solvents
causes a decrease in its fluorescence intensity. The suggested explanation to this is that
the RhB molecule exists in different molecular structures (cationic, zwitterionic,
quinonic and lactonic) which can change by the change in pH and hence affect the
fluorescence intensity. Another possible explanation for the decrease in fluorescence
intensity by lowering the pH can be the use of hydrochloric acid to adjust the pH of the
samples. Chloride ions are known to have quenching effects on many fluorescent
molecules, one of which is rhodamine B (24, 25).
For p(NIPAM-co-5% AA)-EDA-RhB, similar results were obtained. At pH 2, the λem
is 632 nm and by increasing the pH to 6.5 and 11.5, a blue shift is observed where the
λem becomes 627 nm. This can be mainly attributed to the RhB properties as discussed
above. Also, the change in the particle size and charge by changing the pH of the
surrounding environment can affect the fluorescence intensity.

p(NIPAM-co-5% AA)-EDA-RhB Chapter Three
75
3.3.4 Infrared spectroscopy
Table 3.3 list the infrared (IR) bands of p(NIPAM-co-5% AA), p(NIPAM-co-5%
AA)-EDA and p(NIPAM-co-5% AA)-EDA-RhB while Table 3.4 list the IR bands of
RhB. The spectra of p(NIPAM-co-5% AA), p(NIPAM-co-5% AA)-EDA,
p(NIPAMco-5% AA)-EDA-RhB and RhB. The spectra of the three particles compare
to those previously reported for p(NIPAM-co-5% AA) (26-29). Figure 3.9 shows that
the spectra of the three particles (mentioned above) are very similar. Areas where
possible difference can be detected, (e.g. shift in some peaks) are highlighted. The
amount of EDA and RhB attached to the particles is too small to be detected by IR,
hence the resemblance of the spectra. The IR bands and spectrum of RhB shown in
Table 3.4 and Figure 3.9 agree with reported literature (30-32).
Table 3.3 FT-IR bands of p(NIPAM-co-5% AA) and p(NIPAM-co-5% AA)-EDA-RhB -1
Band number Wavenumber (cm ) Assignment
1 3250 N-H stretching (26, 29, 33)
2 2964 -CH3 asymmetric stretching
(26, 33)
3 1620 C=O (amide I bond stretching) (26-29, 33)
4 1523 N-H (amide II bond stretching)
(28, 29, 33)
5 1448 -CH3 asymmetric deformation
(33)
6 1363 -CH2 symmetric deformation
(29, 33)
7 1166 C-N bending (26)

p(NIPAM-co-5% AA)-EDA-RhB Chapter Three
76
Table 3.4 FT-IR bands of RhB
-1
Peak number Wavenumber (cm ) Assignment
1 3354 -OH stretching (33)
2 2978 CH2 and CH3 antisymmeteric and symmetric stretching (30, 33)
3 1996 Substituted benzene rings (overtone and combination bands) (33)
4 1703 C=O stretching (30, 33)
5 1643 C-N stretching (30)
6 1581 Aromatic ring vibrations (stretching) (30,
34) 7 1548
8 1463
9 1408 OH in carboxylic acids in plane OH bending
(33)
10 1332 Aryl bond vibrations (in-plane deformation)
(30, 34)
11 1273 C-N stretching in aromatic amines (33)
12 1247 C-C-N bending in amines (33)
13 754 CH2 in hydrocarbons (rocking)
14 709 CH (out of plane deformation) in osubstituted benzenes (33)
15 680 O-C=O in carboxylic acids (bending) (33)

p(NIPAM-co-5% AA)-EDA-RhB Chapter Three
77

p(NIPAM-co-5% AA)-EDA-RhB Chapter Three
λ (nm)
Figure 3.9 FT-IR spectra of p(NIPAM-co-5% AA)-EDA-RhB, p(NIPAM-co-5% AA)-EDA, p(NIPAM-co-5% AA) and RhB
74

p(NIPAM-co-5% AA)-EDA-RhB Chapter Three
80
3.3.5 Fluorescence microscopy
Figure 3.10 shows the fluorescence microscopy images of p(NIPAM-co-5% AA)EDA-
RhB. The figure shows that the particles are spherical in shape and fluorescent. The
figure also shows that some particles are more fluorescent than the others. This
indicates the uneven distribution of the fluorophore (RhB) among the particles. This
agrees with the high PdI value obtained by the DLS experiments (Table 3.1). The figure
suggests that the fluorophore is located in the core of the particles. This agrees with the
theory that suggests that the NIPAM based particles acquire a core/shell structure where
the core is hydrophobic and the shell is hydrophilic (7).
Figure 3.10 Fluorescence microscopy images of p(NIPAM-co-5% AA)-EDA-RhB at 25°C
3.3.6 Scanning electron microscopy
Figure 3.11 a, b and c shows the Scanning electron microscopy (SEM) images of p(NIPAM-
co-5% AA), p(NIPAM-co-5% AA)-EDA and p(NIPAM-co-5% AA)-
EDA-RhB, respectively at 25°C. The figure (3.12 a) shows that the p(NIPAM-co-5%
AA) particles are spherical and the average particle size is 300 nm. The conjugation of
EDA chains to the particles caused the hairy layer to be extended. Figure 3.11 b shows
that p(NIPAM-co-5% AA)-EDA particles exhibit longer hairy chains which are not
shown in p(NIPAM-co-5% AA) (Figure 3.11 a). After further conjugation of RhB to
the particles, the particles still exhibit a spherical shape with a diameter of 270 nm.
1 0 µm 1 0 µm

p(NIPAM-co-5% AA)-EDA-RhB Chapter Three
81
Figure 3.11 SEM images of (a) p(NIPAM-co-5% AA), (b) p(NIPAM-co-5% AA)-EDA and (c) p(NIPAMco-5% AA)-EDA-RhB at 25°C
( a )
( b )
( c )

p(NIPAM-co-5% AA)-EDA-RhB Chapter Three
82
The particle sizes shown in Figure 3.11 for the three different particles all compare to
those shown by the DLS (Figure 3.3) considering that the particles are deswollen
(STEM sample was dry). Figure 3.11 c shows that the p(NIPAM-co-5% AA)-EDARhB
particles have longer hairs than those of p(NIPAM-co-5% AA)-EDA. This can be
attributed to the attachment of two conjugates (EDA and RhB). In some cases, the hairs
of the particles are long enough to form bridges between the particles.
3.4 Conclusions and future work
3.4.1 Conclusions
A fluorescent temperature-sensitive NIPAM based was synthesized using a three-step
procedure. Step one was the synthesis of p(NIPAM-co-5% AA) particles while steps
two and three were the conjugation of EDA and RhB, respectively. The new particle
has more than one ionized chemical group on its surface, some of which are anionic
(such as COOH from the AA and SO4- from the initiator) and others are cationic such
as NH23+ from the EDA. The initial particle size of p(NIPAM-co-5% AA)-EDA-RhB
at 15°C at pH 11.5 is 500 nm and decreases to about 250 nm when the temperature
exceeds the VPTT (33°C). The particles are most stable at pH 11.5, at lower pH values;
the particles show a high poly dispersity index indicating that the particles do not
acquire the same size. The particles are negatively charged with an initial
electrophoretic mobility at 15°C equal to -2 µmcm/Vs. Calculations of the fluorescence
intensity of p(NIPAM-co-5% AA)-EDA-RhB and RhB at the same concentration
estimates that about 7% of the RhB added to the conjugation reaction is actually
conjugated. Temperature and pH showed an effect on the fluorescence of the particles.
Increasing the temperature caused a decrease in the fluorescence intensity. The increase
in pH has been shown to cause a blue shift of the emission spectra. At pH 2 (below the
pKa of RhB), the emission wavelength (λem) was 632 nm. When the pH increases to
above the pKa, the λem shifts to 627 nm. Fluorescence microscopy pictures show that
the particles are spherical and suggest that the fluorophore (RhB) is located in the core
of the particle. The pictures obtained by TEM also show that the particles are spherical.
The pictures also show some bridging between the particles which can be attributed to
the long hairy chains conjugated to the particles.

p(NIPAM-co-5% AA)-EDA-RhB Chapter Three
83
3.4.2 Future work
Future work will include trials to obtain lower PdI values which contribute to more
mono-dispersed particles. This can be achieved by changing and optimizing the
percentages of conjugates used (EDA and RhB). Also suggested applications for the
new particle will be tested. These will include the use of an emulsifier (considering the
bridges between the particles shown by TEM images).
3.5 References
1. Pinkrah V. T., Beezer A. E., Chowdhry B. Z., Gracia L. H., Cornelius V. J., Mitchell J. C., Castro-Lopez V., Snowden M. J. Swelling of cationic polyelectrolyte colloidal microgels: Thermodynamic considerations. Colloids and Surfaces APhysicochemical and Engineering Aspects. 2005;262:76-80. 2. Ramkissoon-Ganorkar C., Liu F., Baudys M., Kim S. W. Modulating insulinrelease profile from pH thermosensitive polymeric beads through polymer molecular weight. Journal of Controlled Release. 1999;59:287-98. 3. Castro Lopez V., Hadgraft J., Snowden M. J. The use of colloidal microgels as a (trans)dermal drug delivery system. International Journal of Pharmaceutics. 2005;292:137–47. 4. Wu W., Chen S., Hu Y., Zhou S. A Fluorescent Responsive Hybrid Nanogel for Closed-Loop Control of Glucose. Journal of Diabetes Science and Technology. 2012;6:892-901. 5. Ravaine V., Ancla C., Catargi B. Chemically controlled closed-loop insulin delivery. Journal of Controlled Release. 2008;132:2-11. 6. https://ilab.acdlabs.com/iLab2/.1994 - accessed on the 26th of September, 2014. 7. Wong J. E., Gaharwar A. K., Müller-Schulte D., Bahadur D., Richtering W. Dual-stimuli responsive PNiPAM microgel achieved via layer-by-layer assembly: Magnetic and thermoresponsive. Journal of Colloid and Interface Science. 2008;324:47–54. 8. Schmaljohann D. Thermo- and pH-responsive polymers in drug delivery. Advanced Drug Delivery Reviews. 2006;58:1655–70. 9. Zhu J., Marchant R. E. Design properties of hydrogel tissue-engineering scaffolds. NIH Public Access. 2011;8:607–26. 10. Moschou E. A., Madou M. J., Bachas L. G., Daunert S. Voltage-switchable artificial muscles actuating at near neutral pH. Sensors and Actuators B. 2006;115:379–83.

p(NIPAM-co-5% AA)-EDA-RhB Chapter Three
84
11. Lally S., Mackenzie P., LeMaitre C. L., Freemont T. J., Saunders B. R. Microgel particles containing methacrylic acid: pH-triggered swelling behaviour and potential for biomaterial application. Journal of Colloid and Interface Science. 2007;316:367–75. 12. Jia X., Yeo Y., Clifton R. J., Jiao T., Kohane D. S., Kobler J. B., Zeitels S. M., Langer R. Hyaluronic Acid-Based Microgels and Microgel Networks for Vocal Fold Regeneration. Biomacromolecules. 2006;7:3336–44. 13. Maeda H., Maeda T., Mizuno K., Fujimoto K., Shimizu H., Inouye M. Alkynylpyrenes as Improved Pyrene-Based Biomolecular Probes with the Advantages of High Fluorescence Quantum Yields and Long Absorption/Emission Wavelengths. Chem. Eur. J., 2006; 12: 824 – 31. 14. Shiraishi Y., Miyamoto R., Zhang X., Hirai T. Rhodamine-Based Fluorescent Thermometer Exhibiting Selective Emission Enhancement at a Specific Temperature Range. Organic Letters. 2007;9:3921-4. 15. Karstens T., Kobs K. Rhodamine B and Rhodamine 101 as Reference Subtances for Fluorescence Quantum Yield Measurements. The Journal of Physical Chemistry. 1980;84:1871-2. 16. Carey F. A., Sundberg R. J. Advanced Organic Chemistry. Part A: Structure and Mechanisms. Fifth edition. 2008, New York: Springer. 17. Mohsen R. Vine G. J., Majcen N., Alexander B. D., Snowden M. J. Characterization of thermo and pH responsive NIPAM based microgels and their membrane blocking potential. Colloids and Surfaces A: Physicochemical and Engineering Aspects. 2013;428:53-9. 18. Thorne J. B. Controlling the interfacial behaviour of colloidal microgel systems. PhD thesis , University of Greenwich; 2012. 19. UNEP publications. Ethylenediamine. SIDS initial assessment report. Washington, DC: United States Environmental Protection Agency; 2001. 20. Tsuji S., Kawaguchi H. Colored Thin Films Prepared from Hydrogel Microspheres. Langmuir, 2005; 21: 8439-42. 21. Jorge J., Castro G. R., Martines M. A. Comparison among Different pH Values of Rhodamine B Solution Impregnated into Mesoporous Silica. The Electronic Journal of Chemistry. 2013;5. 22. Zamouche M., Hamdaoui O. Sorption of Rhodamine B by cedar cone: effect of pH and ionic strength. Energy Procedia. 2012;18:1228 – 39.

p(NIPAM-co-5% AA)-EDA-RhB Chapter Three
85
23. Fikry M., Omar M. M., Ismail L. Z., Effect of Host Medium on the Fluorescence Emission Intensity of Rhodamine B in Liquid and Solid Phase. J Fluoresc, 2009; 19: 741–46. 24. Jiang Z. L., Zhang B. M., Liang A. H. A new sensitive and selective fluorescence method for determination of chlorine dioxide in water using rhodamine S. Talanta, 2005; 66: 783–88. 25. Geddes C. D. Optical thin film polymeric sensors for the determination of aqueous chloride, bromide and iodide ions at high pH, based on the quenching of fluorescence of two acridinium dyes. Dyes and Pigments, 2000. 45: 243-251. 26. Farooqi Z. H., Khan H. U., Shah S. M., Siddiq M. Stability of poly(Nisopropylacrylamide-co-acrylic acid) polymer microgels under various conditions of temperature, pH and salt concentration. Arabian Journal of Chemistry. 2013, In press. 27. Chen H., Fang Y. Synthesis and characterization of temperature and pH responsive Poly(N-isopropylacrylamide) copolymer. China: MOE Key Laboratory of Food Colloids and Biotechnology, School of Chemical & Material Engineering, Jiangnan University. 28. Luo Q., Guan Y., Zhang Y., Siddiq M. Lead-Sensitive PNIPAM Microgels Modified with Crown Ether Groups. Journal of Polymer Science: Part A: Polymer Chemistry. 2010;48:4120–7. 29. Hu X., Hao X., Wu Y., Zhang J., Zhang X., Wang P. C., Zou G. and Liang X. J. Multifunctional hybrid silica nanoparticles for controlled doxorubicin loading and release with thermal and pH dual response. Journal of Materials Chemistry B. 2013;1:1109. 30. Jing-yi L., Wan-hong M., Peng-xiang L., Jin-cai Z. Detection of intermediates in the TiO2-assisted photodegradation of Rhodamine B under visible light irradiation. Journal of Environmental Sciences. 2007;19:892–6. 31. Ma Y., Jin X., Zhou M., Zhang Z., Teng X., Chen H. Chemiluminescence behavior based on oxidation reaction of rhodamine B with cerium(IV) in sulfuric acid medium. Analytica Chimica Acta. 2003;489:173–81. 32. Zhang R., Hummelgard M., Lv G., Olin H. Real time monitoring of the drug release of rhodamine B on graphene oxide. Carbon. 2011;49:1126-32. 33. Lambert J. B., Shurvell H. F., Lightner D., Cooks R. G. Introduction to organic spectroscopy. Verbit L. New York/London: Macmillan Publishing Company/Collier Macmillan publishers; 1987.

p(NIPAM-co-5% AA)-EDA-RhB Chapter Three
86
34. Renjith R., Mary Y., Panicker C. Y., Varghese H. T., Pakosińska-Parys M., Alsenoy C. V., Al-Saadi A. A. Spectroscopic (FT-IR, FT-Raman) investigations and quantum chemical calculations of 1,7,8,9-tetrachloro-10,10-dimethoxy-4-{3-(4-(3methoxyphenyl)piperazin-1-yl)propyl}-4-azatricyclo (5.2.1.02,6)dec-8-ene-3,5-dione. Spectrochimica Acta Part A: Molecular and Biomolecular Spectroscopy, 2014; 129: 438–50.

p(NIPAM-co-5% LY) Chapter Four
87
Chapter Four
Design, synthesis, characterization and toxicity studies of poly(Nisopropylacrylamide-
co-lucifer yellow) for drug delivery applications
4.1 Introduction
Poly(N-isopropylacrylamide) (p(NIPAM)) particles are characterized by their ability to
change their conformation and physico-chemical properties (such as particle size and surface
charge density) according to the change in the surrounding environment such as temperature,
pH and ionic strength (1-3). This is thought to be a property that can be used in different
applications such as drug delivery (5). The fact that the volume phase transition temperature
(VPTT) of NIPAM based microgel particles (35°C) (1) is very close to the human body
temperature (37°C) makes them a good choice for biomedical applications. As an example
of suggested drug delivery applications based on temperature trigger, the particles are
swollen at room temperature (around 25˚C which is below the VPTT), so, if they incorporate
a drug in its matrix, when administered in the human body
VPTT, it will deswell and release the drug. Many researchers suggested drug delivery (68),
diagnostics (9) and protein binding (10-12) applications of NIPAM-based microgel particles.
The incorporation of a fluorescent dye such as lucifer yellow (LY) to p(NIPAM) particles
adds a new function (colour and fluorescence) that makes it traceable. This can suggest new
applications especially in the field of diagnosis of different diseases either in vivo or in vitro.
Combining the previously suggested drug delivery applications of microgels (6-8) to its
ability to being traced in the human body can be a promising system for combined diagnosis
and delivery of drugs to suitable environments (13, 14).
In this chapter, a novel microgel particle, p(NIPAM-co-5% LY), is synthesized and
characterized using DLS (particle size and electrophoretic mobility), infrared spectroscopy,
scanning electron microscopy and fluorescence microscopy. Being a candidate for
biomedical applications, the toxicity was tested using two cell lines: kidney cells (Vero) and
breast cancer cells (HeLa).

p(NIPAM-co-5% LY) Chapter Four
88
4.1.1 Lucifer yellow VS
Figure 4.1 Molecular structure of lucifer yellow VS dilithium salt (4)
Lucifer yellow VS dilithium is a water soluble fluorescent dye of molecular weight 550.39
g/mol (15). The presence of 3 benzene rings, gives it a hydrophobic character. It has two
excitation wavelengths (280 and 430 nm) and an emission wavelength of 540 nm (16).
Lucifer yellow is used for different biomedical applications including marking cells,
neurons, albumin, cholesterol, phospholipids, collagenase, polynucleotides, progesterone
derivatives, testosterone, estriol (15), and tracers of cell-cell fusion (17). It also selectively
binds to copper (18) which can be used in industrial and environmental applications.
The logarithm of acid dissociation constant (pKa) of LY was calculated using the online
database ACD/labs (19). The presence of more than one ionisable group in the molecular
structure of LY (Figure 4.1) results in more than one pKa, these are; -2.2 (±0.6), -0.7 (±0.5),
1.4 (±0.8) and 5.7 (±0.8)
From polymerization point of view, lucifer yellow VS dilithium salt is a perfect choice. This
is due to the presence of a pendant vinyl group (coloured in grey) (Figure 4.1) which makes
it readily polymerizable with other monomers under suitable conditions. This is important
for synthesizing monodispersed particles with the similar electrophoretic mobilities. On the
other hand, a disadvantage of using lucifer yellow is its relatively low molar extinction
coefficient (ɛ) of 12000 M-1 cm-1 (16, 21, 22) when compared to other fluorophores such as
fluorescein isothiocyanate (FITC) with a molar extinction co-efficient of 75000 M-1 cm-
Polymerization site
group 1 group 2
group 4
group 3

p(NIPAM-co-5% LY) Chapter Four
89
1 (23), Texas red (ɛ = 85000 M-1 cm-1 (24) and tetramethyl rhodamine isothiocyanate
(TRITC) with an ɛ of 100000 M-1 cm-1 (23). It is also characterized by a relatively low
quantum yield (21%) (25) compared to other fluorophores such as rhodamine 6G (95%),
fluorescein (95%) and quinine sulphate (58%) (26).
4.2 Materials and methods
4.2.1 Materials
N-isopropylacrylamide (NIPAM) 97% (Aldrich), lucifer yellow (LY) (Aldrich),
N,N'methylenebisacrylamide 99% (Aldrich), potassium persulphate 98% (BDH Laboratory
Suppliers), branched poly(ethylenimine) (PEI) of molecular weight 25 kD (Cat. 18197-8)
(Aldrich) were obtained from commercial suppliers and used without further purification.
Vero CCL-81 (normal kidney of Cercopithecus aethiops) and HeLa CCL2 (human cervical
epithelial cells) from ATCC company. Media were purchased from Gibco life technologies.
For Vero cells, Dulbecco’s Modified Eagle Medium (DMEM) was used while for HeLa
cells, Minimum Essential Medium (MEM) was used. PenicillinStreptomycin-Glutamine
(PSG) (100x) and fetal Bovine Serum (FBS) were purchased from Gibco Life Technologies.
(3-(4,5-Dimethylthiazol-2-yl)-2,5-diphenyltetrazolium bromide (MTT) was purchased from
Sigma Aldrich UK.
4.2.2 Methods
4.2.2.1 Synthesis of p(NIPAM-co-5% LY) (w/v)
In a 1 L reaction vessel, 0.5 g of the initiator (potassium per sulphate) was dissolved in 800
mL of distilled water. A three-necked lid was clamped to the reaction vessel, which was then
heated to 70°C with continuous stirring. Monomer (4.75 g NIPAM), co-monomer (0.25 g
lucifer yellow (LY)) and cross linker (0.5 g N,N’-methylenebisacrylamide) were stirred in
distilled water (200 mL) and transferred into the reaction vessel containing the initiator and
continuously stirred at 70°C for six hours under an inert atmosphere of nitrogen. When the
reaction was complete, the microgel dispersion was allowed to cool to room temperature.
The microgel was dialyzed in fresh de-ionised water for a week (changed daily), centrifuged
and the pellet was freeze dried.

p(NIPAM-co-5% LY) Chapter Four
90
4.2.2.2 Dynamic light scattering
Dynamic light scattering (DLS) measurements were carried out using a Malvern Zetasizer
Nano ZS. The hydrodynamic diameter of the particles was measured in response to
temperature in the 15 to 60°C range. All samples were diluted with deionized water (1 mL of
dialysed microgel dispersion was diluted with 2 mL of water) before measurements. A quartz
cuvette with two polished windows (Starna Type 1) was used for all the measurements and
the temperature of the dispersion was controlled by a Peltier thermocouple. Data for
p(NIPAM-co-5% LY) measurements were collected every 1°C and the samples were
equilibrated for 2 min before each data collection point. Three measurements, each consisting
of 13 subruns, were taken at each temperature to obtain an average hydrodynamic diameter.
Experiments were also conducted where the pH of the samples was adjusted to different pH
values using HCl and NaOH to test for the effect of changing pH upon the size of the particles.
The electrophoretic mobility of p(NIPAM-co-5% LY) in a salt concentration of 1 x10⁻⁴ M
NaCl was measured in response to temperature change across the range of 15-60˚C using a
disposable folded capillary cell.
4.2.2.3 Fluorescence spectroscopy
A Horiba Jobin Yvon Fluoromax 4 spectrofluorometer was used for fluorescence
experiments. All samples were excited at 430 nm and the full emission spectra (450–1050
nm) were recorded with bandwidth of 5 nm at 25°C. A 10 mm path length quartz cuvette
with four polished windows (Starna Type 3) was used for all the measurements.
4.2.2.4 Infrared spectroscopy
A Thermo Nicolet Nexus Fourier transform infrared spectrophotometer (FT-IR) was used to
carry out the IR experiment in this work. Microgel dispersions were dialysed and freezedried
then the solid samples (powder) were used for IR experiments using attenuated total
reflection (ATR) ZnSe crystal.
4.2.2.5 Microscopy
4.2.2.5.1 Scanning electron microscopy
A Hitachi SU8030 cold cathode filled emission gun scanning electron microscope was used
with an accelerating voltage of 5.0 kV to obtain images of the novel particles.

p(NIPAM-co-5% LY) Chapter Four
91
4.2.2.5.2 Fluorescence microscopy
A Nikon Eclipse 90i microscope, fitted with a fluorescein isothiocyanate filter (FITC) and a
Nikon digital sight DS-U3 camera were used to take fluorescent images of the particles.
Plan Fluor 100x oil Ph3 DLL lens was used with working distance of 0.16 mm. The
numerical aperture of the images was 1.3, refractive index 1.5 and the exposure time was 3
seconds. The sample was placed on a microscopic slide, left to dry in air and then immersion
oil was added on it.
4.2.2.6 Toxicity studies
4.2.2.6.1 Sterilization:
All the pipetting tips, phosphate buffered saline (PBS), glassware, magnetic stirrers, spatulas
used in this experiment were sterilized used an Astell autoclave at 121°C for 85 minutes.
4.2.2.6.2 Preparation of media
To prepare a complete media, 50 mL PSG (100x) and 5 mL Fetal Bovine Serum (FBS) were
added (without any dilution) to a 500 mL media bottle (either DMEM or MEM).
Media were kept in the fridge at 4˚C.
4.2.2.6.3 Cell sub-culturing
In a clean and sterile class II laminar flow hood, the media in the flask were removed using
a disposable sterile 10 mL serological pipette (Fisher brand). The flask was then washed
with 10 mL of sterilized phosphate buffered saline (PBS) 3 times (using a new serological
pipette each time). Trypsin EDTA (0.5 mL) was added and spread among the flask which is
then placed in an incubator (Thermo Scientific HERACELL 150i CO2 incubator) at 37°C
and 5% CO2 v/v for 5-7 minutes after which the viability of cells was checked under a
microscope (Nikon Japan with a х10 ELWD lens with working distance 2.62–1.8 mm). After
that, 10 mL of fresh media (MEM for HeLa and DMEM for Vero cells) were added to the
flask and well mixed with the cells, and then 9 mL of the media (now mixed with wells)
were removed and put in an Eppendorf tube to be used for the seeding step. Fresh media (9
mL) were then added to the flask, mixed then put in the incubator. Cells were split twice
weekly.

p(NIPAM-co-5% LY) Chapter Four
92
4.2.2.6.4 Cell seeding
Cell count (using a haemocytometer) of the cell suspension from the splitting step (9 mL
removed after using trypsin) was carried out. Accordingly, a cell suspension of a
concentration (1 x 10⁴ cell/mL) was prepared. In a 96-well plate (excluding the peripheral
cells, these are columns 1 and 12 and rows A and H (Figure 4.2)), 100 µL of the freshly
prepared cell suspension were placed in each well. The plate was then put in the incubator
for 24 hours.
4.2.2.6.5 Sample preparation
In an autoclaved beaker, the sample (either dextran, NIPAM monomer, p(NIPAM),
p(NIPAM-co-5% LY) or PEI) is weighed. Sterile fresh media (MEM for HeLa and DMEM
for Vero cells) was added and left stirring for an hour. In a sterile class II laminar flow hood,
the sample dispersion/solution was filtered using a single use filter unit with a pore size of
2 µm (Minisart® Sartorius stedium biotech). A serial dilution was then prepared and used
for cell dosing.
4.2.2.6.6 Cell dosing
The previously seeded 96-well plates are placed in a clean and sterile fume cupboard, the
100 µL of media (in each well) are removed using sterile pipette tips. The first two columns
are used as control wells (100 µL of fresh media is put in each well) while the rest of the
columns is used for the different concentrations of the sample. In each well, 100 µL of the
pre-prepared sample-media suspension is accurately put using a sterile pipette tip. For each
sample, two plates are set up; Figure 4.2 shows the design of each plate while Table 4.1
shows the concentrations used in each one. For each cell line (HeLa and Vero), a whole plate
was set up to be a control one. Plates are placed in the incubator for 72 hours after which the
MTT assay is carried out.

p(NIPAM-co-5% LY) Chapter Four
93
Figure 4.2 Structure and organisation of the 96-well plates used for toxicity studies. Blue cells were kept empty. The concentrations of the columns are shown in Table 4.1
4.2.2.6.7 MTT assay
For the preparation of MTT solution, 250 mg of MTT reagent were dissolved in PBS and
sterilized at 121ºC for 85 minutes. In each well, 10 µL of pre-prepared of MTT solution was
added. Plates were then placed in the incubator and left for 4 hours.
Table 4.1 The design of plates A and B and the concentrations used for the toxicity testing of dextran,
NIPAM monomer, p(NIPAM), p(NIPAM-co-5% LY) and poly(ethylenimine) (PEI)
Conc. C C A1 A2 A3 A4 A5 A6 A7 A8 Plate A
mg/mL Control Control 3 1 0.7 0.3 0.1 0.07 0.03 0.01 Plate B
µg/mL Control Control 7 3 1 0.7 0.3 0.1 0.07 0.03
The media was then removed (this includes 100 µL sample in media and 10 µL MTT) and
100 µL of dimethyl sulphoxide (DMSO) are added in each well and plates are left in the
incubator for 30 minutes. The absorbance at 540 nm of the DMSO in each well is then
determined using a Thermo Electron Corporation Multiskan Ascent plate reader.
C C A1 A3 A2 A6 A5 A4 A7 A8

p(NIPAM-co-5% LY) Chapter Four
94
4.2.2.6.8 Growth curves
Cells were seeded at a concentration of 1 x 10⁴ cell/mL (as explained above) in a 96 well
plate. Every day (for 10 days), MTT assay was carried out (as explained above) on one
column of the plate.
4.3. Results and discussion
4.3.1 Particle size
4.3.1.1 Effect of temperature
Figure 4.3 shows the response of p(NIPAM-co-5% LY) to the change in temperature across
a temperature range of 15-60˚C both during heating and cooling. The initial particle size at
15°C at pH 7 is 250 nm which is considerably smaller than that of 100% p(NIPAM) with an
initial particle size of 550 nm (1, 27). The incorporation of a hydrophobic comonomer such
as lucifer yellow (28) decreases the critical chain length for micellisation of the growing
oligomeric chains. This gives rise to a greater number of particle nuclei, so, smaller particle.
The incorporation of LY also decreases the extent of hydrogen bonding between the particle
and water (solvent) compared to 100% p(NIPAM), so, less water will be incorporated in the
particle leading to a smaller particle size (29). It also changes the reaction conditions such
as the rate of the reaction, solubility of the monomer and comonomer and the extent of
reaction before termination (30). The DLS data suggest that LY was successfully
incorporated in the new particle. The figure also shows that the novel fluorescent microgel
particle maintains the reversible temperature responsive behaviour of p(NIPAM) with a
VPTT of 32ºC wich is slightly less than that of 100% p(NIPAM) (35ºC) (1). The
polydispersity index (PdI) value (Figure 4.3), which is close to zero (0.04), suggests that the
majority of the particles in the dispersion acquire an even size.

p(NIPAM-co-5% LY) Chapter Four
95
Figure 4.3 The effect of temperature on the particle size of p(NIPAM-co-5% LY) at pH 7 across
temperature range (15-60°C) 4.3.1.2 Effect of pH
The effect of pH on the hydrodynamic diameter of p(NIPAM-co-5% LY) is shown in Figure
4.4. The figure shows an increase in the particle size by increasing the pH at the same
temperature (25˚C). At pH (0.5-3), the particle diameter was 190 nm and increased by 20%
to reach 230 nm at pH (5-10). At pH 11, the particle further swells by 9% to reach 248 nm.
The change in particle size is thought to be mainly attributed to the change of the protonation
state of the co-monomer lucifer yellow by the change in pH (Figure 4.2). Several pH
sensitive NIPAM based particles (with different co-monomers such as acrylic acid) have
been studied (1). At pH lower than the pKa of the co-monomer, the anionic groups are
protonated, accordingly, they are not charged and hence the electrostatic repulsion force is
minimal. When the pH increases above the pKa of the co-monomer, the anionic co-monomer
groups are deprotonated, creating more surface charge on the particle, leading to more
electrostatic repulsion forces and hence the increase in the particle size.

p(NIPAM-co-5% LY) Chapter Four
96
pH
Figure 4.4 The effect of pH on the hydrodynamic diameter of p(NIPAM-co-5% LY) at 25°C
Lucifer yellow VS shows two positive pKa values (1.4 (0.8) and 5.7 (0.9)) (20). Figure 4.4
shows the change in the hydrodynamic diameter of p(NIPAM-co-5% LY) according to the
change of pH. The first positive pKa of LY (1.4) (caused by the deprotonation of the nitrogen
of the piperidine ring) (20) shows a minimal effect on the particle size (Figure 4.4).
Comparing the particle size at pH 0.5 to that at pH 3 shows minimal change in the particle
size at the two cases. An increase in the particle size around the pH of 5 which is in the range
of the second positive pKa of LY (caused by the deprotonation of the amino group (Figures
4.1 and 4.2) (20) is observed. The figure shows 23 % increase in particle size by increasing
the pH from 3 to 5.
At pH below 5.7 (± 0.9), p(NIPAM-co-5% LY) can be considered as a zwitterionic particle.
The negative surface charge on p(NIPAM-co-5% LY) particles is caused by the SO4- groups
from the anionic initiator used during the particle synthesis (K2S2O8) and the fluorescent
dye (lucifer yellow) with sulphonate groups (Figure 4.1). Having two negative pKa values,
the sulphonate groups of lucifer yellow are deprotonated when the pH is above zero (Figure
4.2) (20). At pH below 1.4, the nitrogen group of the piperidine ring and the amino group of
the aniline are both protonated creating positive charge that masks some of the negative
charge created by the initiator and the sulphonate groups of LY. At 1.4 < pH > 5.7, the
nitrogen of the piperidine is deprotonated, but the tertiary amine group of the aniline is
protonated and thus charged, so, positive charge caused by the protonated amino group can
still mask some of the negative charges. When the pH exceeds 5.7 (± 0.9), both groups
150
170
190
210
230
250
270
290
0 2 4 6 8 10 12

p(NIPAM-co-5% LY) Chapter Four
97
(nitrogen of piperidine and amino of aniline) are deprotonated and thus no positive charges
are created. At this point, the negative surface charge on p(NIPAM-co-5% LY) is maximal
and not masked by positive charges (the particle is not zwitterionic anymore and tends to
only carry negative charges on its surface. This increases the electrostatic repulsion within
the particle and hence increases the particle size (Figure 4.4).
It is worth mentioning that the magnitude of change in the particle diameter of p(NIPAMco-
5% LY) at different pH values is less than that of previously known temperature/pH
responsive particles such as p(NIPAM-co-5% AA) (1). The initial particle diameter of
p(NIPAM-co-5% AA) at 15˚C at pH 3 is 290 nm while at pH 6 (at the same temperature) is
550 nm (1). This shows a 90% increase in the particle size by changing the pH of the particle
dispersion. In the case of p(NIPAM-co-5% LY), the particles only show a 32% increase in
diameter when the pH is changed from 0.5 to 11.
The magnitude of particle size change in response to pH change can be increased by
incorporating another co-monomer. This has been carried out by many researchers such as
the incorporation of AA (1), N-t-butylacrylamide (31). The suggested result then is the
synthesis of a fluorescent temperature/pH sensitive particle with a higher magnitude of pH
sensitivity.
4.3.2 Electrophoretic mobility
4.3.2.1 Effect of temperature
Figure 4.5 compares between the electrophoretic mobility of p(NIPAM) and p(NIPAM-
co5% LY). p(NIPAM) has a negative surface charge due to the anionic initiator used during
synthesis while p(NIPAM-co-5% LY) has a negative surface charge due to both the initiator
and the anionic co-monomer (LY) (32). The figure shows that at 15ºC the electrophoretic
mobility of p(NIPAM-co-5% LY) (-0.32 µmcm/Vs) is higher than that of p(NIPAM) (-0.17
µmcm/Vs). This can be attributed to two main reasons; first, the presence of a higher surface
charge density on p(NIPAM-co-5% LY) particles due to the addition of an anionic co-
monomer (lucifer yellow) (32) beside the anionic initiator used during the synthesis.
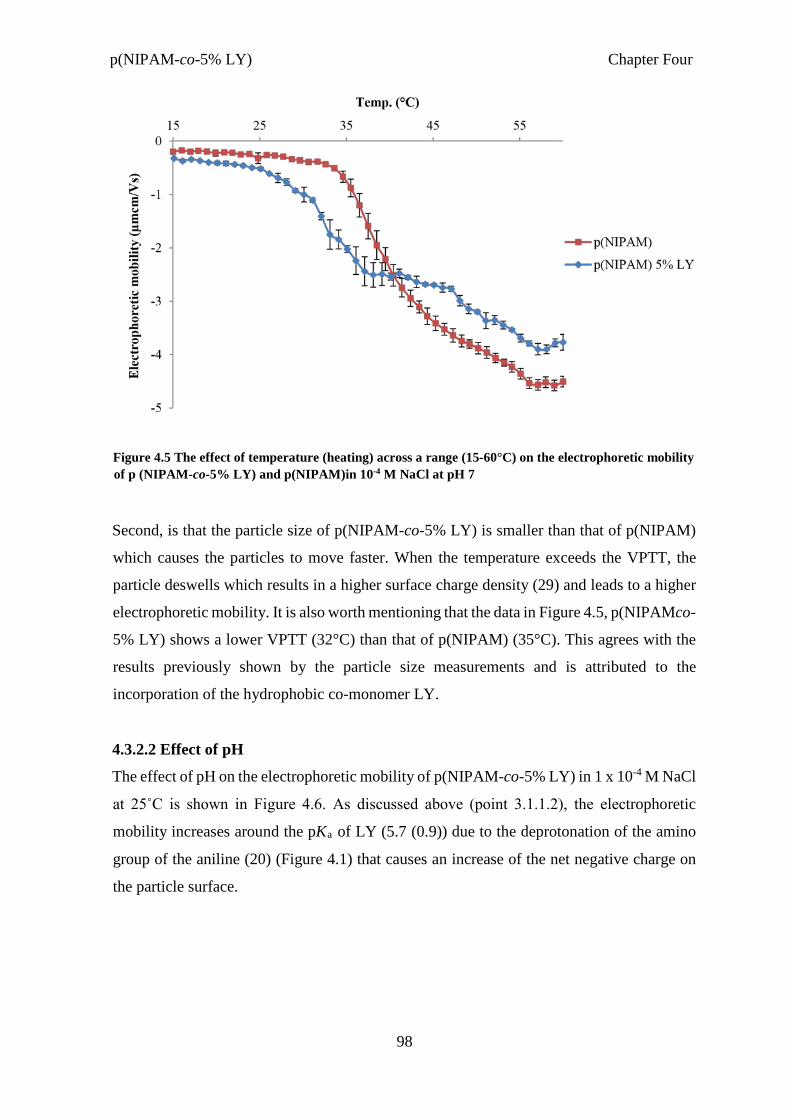
p(NIPAM-co-5% LY) Chapter Four
98
Figure 4.5 The effect of temperature (heating) across a range (15-60°C) on the electrophoretic mobility of p (NIPAM-co-5% LY) and p(NIPAM)in 10-4 M NaCl at pH 7
Second, is that the particle size of p(NIPAM-co-5% LY) is smaller than that of p(NIPAM)
which causes the particles to move faster. When the temperature exceeds the VPTT, the
particle deswells which results in a higher surface charge density (29) and leads to a higher
electrophoretic mobility. It is also worth mentioning that the data in Figure 4.5, p(NIPAMco-
5% LY) shows a lower VPTT (32°C) than that of p(NIPAM) (35°C). This agrees with the
results previously shown by the particle size measurements and is attributed to the
incorporation of the hydrophobic co-monomer LY.
4.3.2.2 Effect of pH
The effect of pH on the electrophoretic mobility of p(NIPAM-co-5% LY) in 1 x 10⁻⁴ M NaCl
at 25˚C is shown in Figure 4.6. As discussed above (point 3.1.1.2), the electrophoretic
mobility increases around the pKa of LY (5.7 (0.9)) due to the deprotonation of the amino
group of the aniline (20) (Figure 4.1) that causes an increase of the net negative charge on
the particle surface.

p(NIPAM-co-5% LY) Chapter Four
99
Figure 4.6 The effect of pH on the electrophoretic mobility of p(NIPAM -co-5% LY) in 1 x 10⁻⁴ M NaCl at 25°C
4.3.3 Fluorescence spectroscopy
The fluorescence spectra of 0.01 µg/mL LY, 0.2 µg/mL p(NIPAM) and 0.2 µg/mL
p(NIPAM-co-5% LY) excited at 430 nm at 25˚C and 45°C at pH 3 and 7 are shown in
Figures 4.8 and 4.9.
4.3.3.1 Effect of addition of lucifer yellow
The concentration of LY used for the fluorescence spectra in Figures 4.8 and 4.9 (0.01
µg/mL) is the theoretical concentration of LY incorporated in 0.2 µg/mL p(NIPAM-co-5%
LY) (5%), in other words, it is the concentration of LY added during the synthesis of
p(NIPAM-co-5% LY), and was selected to give a qualitative comparison of the emission
spectrum intensity. However, the fluorescence intensity of LY is significantly higher than
that of p(NIPAM-co-5% LY) which suggests that either not all the LY added during the
synthesis reaction is incorporated in the new particle, or the quantum yield of LY was
quenched by the p(NIPAM) particles, or other environmental conditions such as solvent
polarity (17).
The second suggestion is supported by Furstenberg et al. (17) who studied the excited state
dynamics of lucifer yellow and concluded that LY is an environment sensitive probe whose
-0.3
-0.25
-0.2
-0.15
-0.1
-0.05
0 0 2 6 8 10 12 4
pH
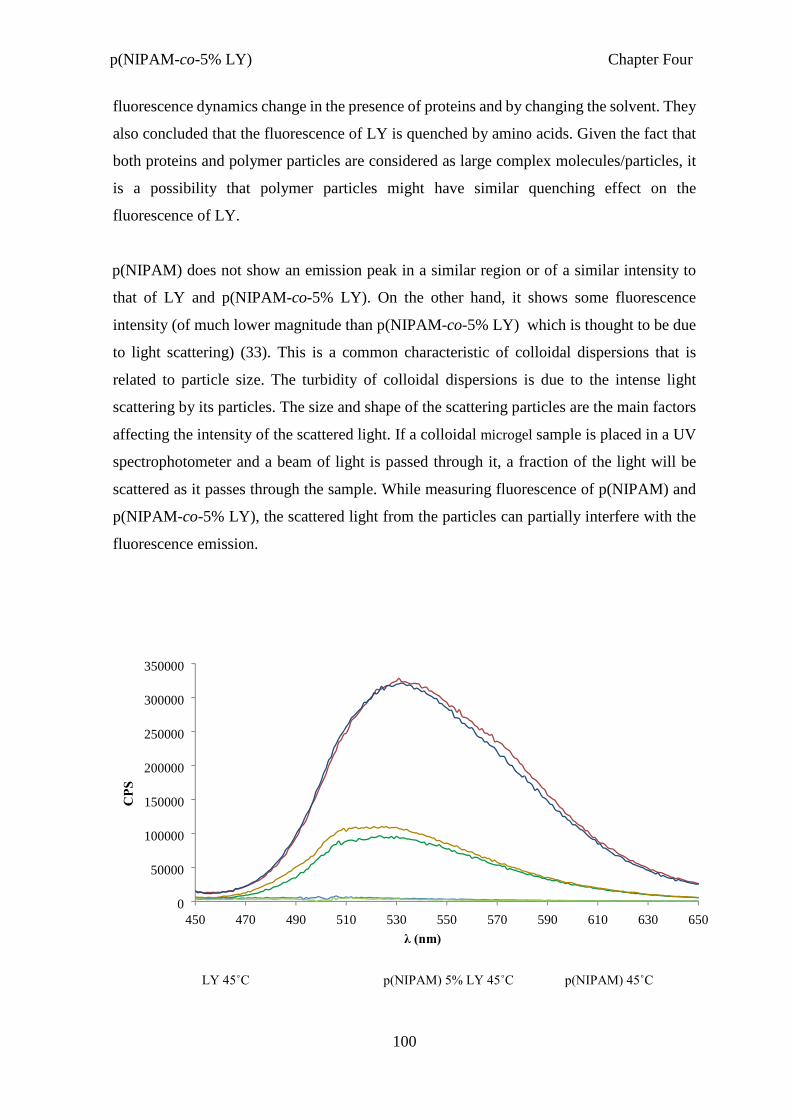
p(NIPAM-co-5% LY) Chapter Four
100
fluorescence dynamics change in the presence of proteins and by changing the solvent. They
also concluded that the fluorescence of LY is quenched by amino acids. Given the fact that
both proteins and polymer particles are considered as large complex molecules/particles, it
is a possibility that polymer particles might have similar quenching effect on the
fluorescence of LY.
p(NIPAM) does not show an emission peak in a similar region or of a similar intensity to
that of LY and p(NIPAM-co-5% LY). On the other hand, it shows some fluorescence
intensity (of much lower magnitude than p(NIPAM-co-5% LY) which is thought to be due
to light scattering) (33). This is a common characteristic of colloidal dispersions that is
related to particle size. The turbidity of colloidal dispersions is due to the intense light
scattering by its particles. The size and shape of the scattering particles are the main factors
affecting the intensity of the scattered light. If a colloidal microgel sample is placed in a UV
spectrophotometer and a beam of light is passed through it, a fraction of the light will be
scattered as it passes through the sample. While measuring fluorescence of p(NIPAM) and
p(NIPAM-co-5% LY), the scattered light from the particles can partially interfere with the
fluorescence emission.
λ (nm)
LY 45˚C p(NIPAM) 5% LY 45˚C p(NIPAM) 45˚C
0
50000
100000
150000
200000
250000
300000
350000
450 470 490 510 530 550 570 590 610 630 650

p(NIPAM-co-5% LY) Chapter Four
101
LY 25˚Cp(NIPAM) 5% LY 25˚Cp(NIPAM) 25˚C
Figure 4.7 Fluorescence spectra of 0.01 µg/mL LY, 0.2 µg/mL p(NIPAM-co-5% LY) and 0.2 µg/mL p(NIPAM) excited at 430 nm at pH 7 at temperatures 25°C and 45°C
λ (nm)
LY pH 3p(NIPAM) 5% LY pH 3p(NIPAM) pH 3
LY pH 7p(NIPAM) 5% LY pH 7p(NIPAM) pH 7
Figure 4.8 Fluorescence spectra of 0.01 µg/mL LY, 0.2 µg/mL p(NIPAM-co-5% LY) and 0.2 µg/mL p(NIPAM) excited at 430 nm at 25°C at pH 3 and 7 4.3.3.2 Effect of temperature
The effect of temperature on the fluorescence of LY, p(NIPAM-co-5% LY) and p(NIPAM)
can be compared using Figure 4.7. In 1852, Sir G. G. Stokes observed that fluorescence
emission generally occurs at lower energies and longer wavelengths than that of absorption
(34). In the case of LY, the emission peak at the same pH (pH 7) and different temperatures
(25°C and 45°C) show similar λmax, peak shape and intensity. This indicates that the effect
of internal conversion (due to temperature change) on Stokes shift is minimal. In terms of
fluorescence intensity, no significant difference between the fluorescence at temperatures of
25°C and 45°C is shown (Figure 4.7). The percentage change between both temperatures is
4% at pH 3 and 1.6% at pH 7.
0
50000
100000
150000
200000
250000
300000
350000
450 470 490 510 530 650 630 610 590 570 550

p(NIPAM-co-5% LY) Chapter Four
102
In the case of p(NIPAM-co-5% LY), the emission peaks at 25°C and 45°C (both at pH 7)
show similar λmax and peak shape. On the other hand, a change in the fluorescence intensity
is observed by changing the temperature (Figure 4.7). The percentage change in the
fluorescence intensity was 11.7% at pH 3 (3 times higher than that of LY) (data not shown)
and 14.6% at pH 7 (9 times higher than that of LY). This can be attributed to different factors
such as the change in particle size by changing the temperature from below to above the
VPTT (Figure 4.3) which changes the fluorophore density and accordingly the fluorescence
intensity. It is worth mentioning that the particle size of p(NIPAM-co-5% LY) decrease by
43% when the temperature increases from 25˚C to 45˚C at pH 3 and 7. The change in
temperature can also cause a change in the quantum yield of fluorescence due to change in
solvent properties such as solvent polarity (17, 35). For p(NIPAM), the particles deswell
when the temperature exceeds the VPTT (35°C), thus at 45°C, they acquire a de-swollen
configuration and the dispersion is more turbid. This boosts the light scattering effect which
is shown here as higher fluorescence intensity.
4.3.3.3 Effect of pH
Lucifer yellow is a pH insensitive fluorescent probe (36). This agrees with the results shown
in Figure 4.8 where the emission peaks of LY at same temperature (25°C) and different pH
values (3 and 7) are similar (same λem). The same result is also shown for p(NIPAM-co-5%
LY).
The fluorescence intensity of LY is affected by the change in pH (Figure 4.8). This can be
due to different factors that affect the quantum yield of the fluorophore Lucifer yellow.
These include the change of the polarity of the surrounding polymer (p(NIPAM)) and its
electrophoretic mobility which affects the polarity of the solvent (17). Changing the solvent
polarity highly affects the fluorescence lifetime which in return affects the quantum yield
(17, 37, 38). In the case of p(NIPAM-co-5% LY), no change in the fluorescence intensity is
observed. This is can be attributed to the incorporation of a small percentage of LY in the
particles. Accordingly, the effect of pH on the fluorescence of the particles is not
pronounced.
4.3.4 Infrared spectroscopy
Figure 4.9 shows the FT-IR spectra of p(NIPAM), p(NIPAM-co-5% LY) and LY in the mid
IR region (3800-1200 cm-1) while Figure 4.10 shows the spectra in the range 1300750 cm-1.

p(NIPAM-co-5% LY) Chapter Four
103
The spectrum of p(NIPAM) is comparable to those in the literature (39, 40). Table 4.2 lists
the main bands of p(NIPAM) and p(NIPAM-co-5% LY) and their assignments while Table
4.3 list the bands of LY and their assignments.
Table 4.2 FT-IR bands values of p(NIPAM) and p(NIPAM-co-5% LY)
Wavenumber (cm-1) Assignment (41) a 3292 secondary amide N-H stretching b 3065 Amide B stretching c 2970 -CH3 asymmetric stretching d 2929 -CH2 asymmetric stretching e 2874 -CH3 symmetric stretching f 1650 amide I band stretching g 1550 amide II band stretching h 1469 -CH3 asymmetric deformation i 1387 -CH3 symmetric deformation j 1368 -CH2 symmetric k 1173 -CH3 skeletal l 1132 -CH3 rocking
Table 4.3 FT-IR bands values of LY
Wavenumber (cm-1) Assignment (41) 1 3450 -NH2 primary amide stretching 2 3065 C-H stretching 3 1700 overtone and combination bands 4 1650 NH2 primary amide deformation 5 1585
Aromatic ring (stretching) 6 1519 7 1477 8 1430 9 1190 S=O stretching 10 1140 SO2 symmetrical in sulfones stretching 11 1050
SO3H in sulfonic acids stretching 12 1026 13 1000 CH=CH2 in vinyl compounds out of plane

p(NIPAM-co-5% LY) Chapter Four
104
14 976 15 890 aromatic C-C (stretching) 16 802 R-NH2 in primary amines NH2 wag 17 770 m-disubstituted benzene (CH out of plane)
The IR spectrum of p(NIPAM-co-5% LY) is comparable to that of p(NIPAM) (Figures 4.10
and 4.11). On the other hand, the incorporation of lucifer yellow is indicated by the band at
1054 cm-1 for LY and 1046 for p(NIPAM-co-5% LY) (indicating the sulphoxides in lucifer
yellow). At 994 cm-1, p(NIPAM) show a small band indicating vinyl group (41) (also present
in LY at 1000 cm-1), the absence of this group in the p(NIPAM-co-5% LY) spectrum suggest
the absence of free vinyl groups since they were polymerized during the synthesis of the
microgel. It is also worth mentioning that none of the spectra of p(NIPAM), p(NIPAM-co-
5% LY) and LY show the C=C (of the vinyl group) stretch band in the range of 1690 - 1670
cm-1 (Tables 4.2 and 4.3 and Figure 4.9) (41). This can be attributed to the presence of the
strong amide band at 1650 cm-1 and in case of LY the overtone and combination bands at
1700 (Table 4.3 and Figure 4.9). The presence of these bands in a close range to that of C=C
stretch band might have shifted or masked it.

p(NIPAM - co - Chapter Four % LY) 5
a
b
d c
e
f
g
i
h
j
1
2
3 4
5
6 7
8

Figure 4.9 FT-IR spectra of p(NIPAM) (red), p(NIPAM-co-5% LY) (black) and LY (green) in the region (3800-1400 cm-1)
98 p(NIPAM-co-5% LY) Chapter Four

Figure 4.10 FT-IR spectra of p(NIPAM) (red), p(NIPAM-co-5% LY) (black) and LY (green) in the region (1300-750 cm-1)
99
k
l
9 10 11
12
13 14 15
17
16


p(NIPAM-co-5% LY) Chapter Four
109
4.3.5 Microscopy
The novel microgel particles were examined using SEM (Figure 4.11) and fluorescence
microscopy (Figure 4.12). Figure 4.11 show that the particles are spherical, monodispersed
and their average size is 120 nm which is comparable to that shown by DLS at deswollen
state (Figure 4.3). In few occasions, the dehydration of the sample causes some of the
particles to be associated (Figure 4.11). The fluorescence microscopy (Figure 4.12) also
confirms the results of SEM where the particles are shown to be spherical, roughly of the
same size and fluorescent. Figure 4.12 supports the suggestion that LY is incorporated in
the novel p(NIPAM-co-5% LY) microgel particles and that they are fluorescent.
Accordingly, it can be suggested that these particles can be traced in the human body (given
their fluorescence) which can serve as a diagnostic tool. Researches have tried incorporating
fluorescent dyes into microgels (42, 43), on the other hand, there are no upto-date data
showing fluorescence microscopy images of fluorescent microgels.
4.3.5.1 Scanning electron microscopy
Figure 4.11 SEM pictures of p(NIPAM-co-5% LY) at pH 3 (х 45,000)
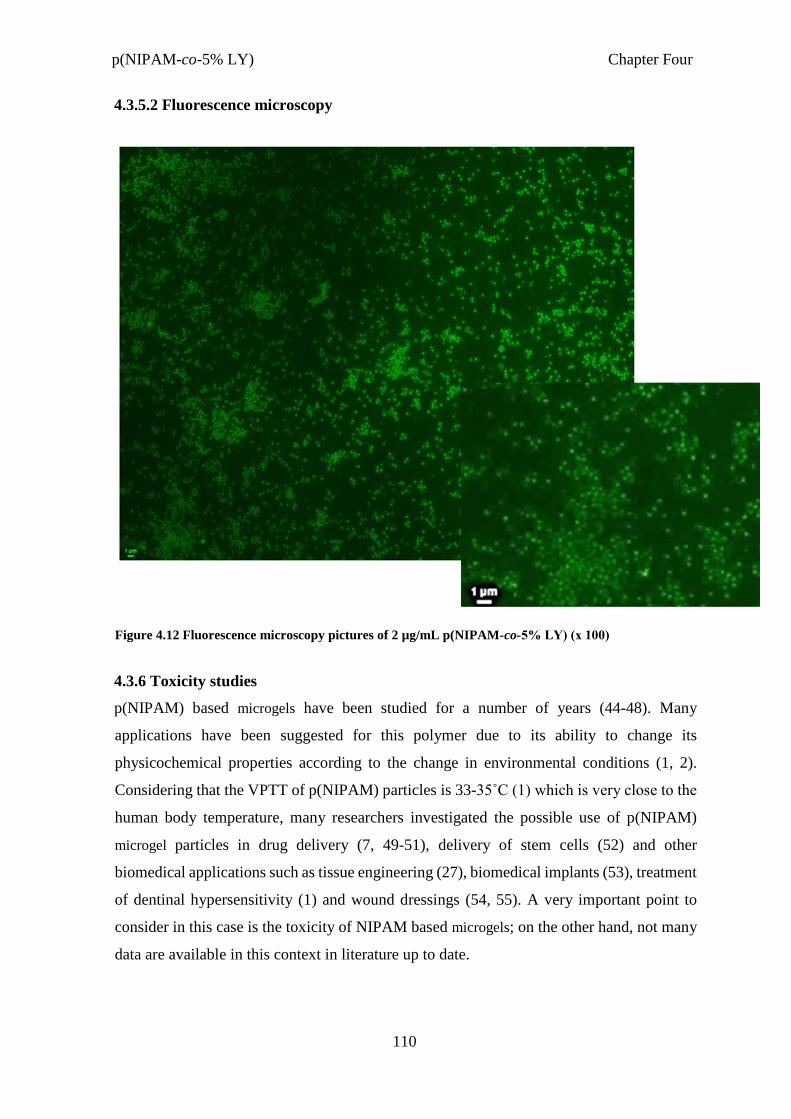
p(NIPAM-co-5% LY) Chapter Four
110
4.3.5.2 Fluorescence microscopy
Figure 4.12 Fluorescence microscopy pictures of 2 µg/mL p(NIPAM-co-5% LY) (х 100)
4.3.6 Toxicity studies
p(NIPAM) based microgels have been studied for a number of years (44-48). Many
applications have been suggested for this polymer due to its ability to change its
physicochemical properties according to the change in environmental conditions (1, 2).
Considering that the VPTT of p(NIPAM) particles is 33-35˚C (1) which is very close to the
human body temperature, many researchers investigated the possible use of p(NIPAM)
microgel particles in drug delivery (7, 49-51), delivery of stem cells (52) and other
biomedical applications such as tissue engineering (27), biomedical implants (53), treatment
of dentinal hypersensitivity (1) and wound dressings (54, 55). A very important point to
consider in this case is the toxicity of NIPAM based microgels; on the other hand, not many
data are available in this context in literature up to date.

p(NIPAM-co-5% LY) Chapter Four
111
(a) 1 3 5 7 1 3 5 7
Days Days
Figure 4.13 Growth curves of (a) HeLa cells and (b) Vero cells
The growth curve of both HeLa and Vero cells are shown in Figure 4.13. Both curves are
comparable to those reported in literature (56, 57). The growth of both cells passes though
different phases. Phase 1 is the lag phase when the cells do not divide but adapt to the culture
conditions. The seeding density and the kind of cell line define the length of this phase.
Phase 2 is the lag phase when the cells proliferate actively and the cell density exponentially
increases. The cell proliferation kinetics varies from one cell line to another. Phase 3 is the
plateau or stationary phase when the cell proliferation slows down and the cells are
susceptible to injury. Phase 4 and the last is the decline phase when cell death dominates
and the number of viable cells decreases dramatically (58).
Log conc.
0.08
0.1
0.12
0.14
0.16
0.18
0
0.1
0.2
0.3
0.4
0.5
0.6 ( b)

p(NIPAM-co-5% LY) Chapter Four
112
Figure 4.14 Percentage cell viability (after 72 hours) versus log
concentration (across conc. range of 0.03 µg/mL to 3000 µg/mL) of dextran, NIPAM monomer, p(NIPAM), p(NIPAM-co-5% LY) and PEI on 1 x 10⁴ HeLa cell/mL
Dextran NIPAM monomer
p(NIPAM)
p(NIPAM) 5% LY
-2 -1 0 1 2 3 4 Log conc. (µg/mL)
Figure 4.15 percentage cell viability (after 72 hours) versus log concentration (across conc. range of 0.03 µg/mL to 3000 µg/mL) of dextran, NIPAM monomer, p(NIPAM), p(NIPAM-co-5% LY) and PEI on 1 x 10⁴ Vero cell/mL
Table 4.4 LC50 of dextran, NIPAM monomer, p(NIPAM), p(NIPAM-co-5% LY) and PEI on HeLa
and Vero cells (std error values are presented in brackets)
LC50 on HeLa cells
(µg/mL)
LC50 on Vero cells
(µg/mL)
Dextran ≥ 3000
NIPAM monomer 700 (6) 700 (6)

p(NIPAM-co-5% LY) Chapter Four
113
p(NIPAM) ≥ 3000
p(NIPAM) 5% LY ≥ 3000
PEI 0.7 (0.2) 3 (0.9)
In 2010, Naha et al., (59) studied the cyto- and geno-toxicity of p(NIPAM) particles (within
a concentration range of 25-1000 mg/L) on two different mammalian cell lines, SW480
(colon) and HaCaT (dermal cell line). The viability of cells (both cell lines) after 24, 48, 72
and 96 hours were shown to be 100%. Also, the geno- and eco-toxicity (60) data confirmed
the results of the cytotoxicity suggesting that p(NIPAM) particles have an excellent
bioavailability profile in vitro. Naha et al. (59) have further studied p(NIPAM) based
microgel particles inside cells and concluded that the particles enter the cells and are localized
in the lysosomes.
The cytotoxicity and uptake of p(NIPAM) based microgel particles with incorporated
hyperbranched polyglycerol (HPG) was investigated by Cuggino et al., (61). The cytotoxic
effect of p(NIPAM-co-HPG) particles on epithelial human lung cancer cell line A549,
human hematopoietic cells U-937, and human epidermoid carcinoma cells A431. Results
suggest that doses above 0.5 mg/mL are required to cause adverse effects on the cells. It is
also worth mentioning that the particles could penetrate the cell membrane of lung cancer
cells A549 incubated at 37°C and were distributed in the perinuclear region (61).
Herein, the effect of dextran, NIPAM monomer, p(NIPAM), p(NIPAM-co-5% LY) and PEI
on the cell viability of both HeLa and Vero cell lines is reported. HeLa cells are human
epithelial cells of a strain maintained in tissue culture since 1951 and used in research,
especially in virology. The original cells were provided by cervical carcinoma of Henrietta
Lacks (62). Vero cells are taken from the kidneys of the African green monkey,
Cercopithecus aethiops sabaeus, and used to grow certain viruses for vaccine production
(63).
Figure 4.14 shows the effect of different concentrations (concentration range between 0.03
µg/mL to 3 mg/mL) of dextran, NIPAM monomer, p(NIPAM), p(NIPAM) 5% LY and
PEI on the cell viability of HeLa cells. The figure shows that the effect of dextran (used as
a negative control) on the cell viability was minimal as the cells showed over 90% viability

p(NIPAM-co-5% LY) Chapter Four
114
across the whole range of concentrations. On the other hand, PEI (used a positive control)
shows cell viability above 80 % at concentrations less than 0.003 mg/mL. When the
concentration further increases, the cell viability significantly decreases till it reaches 20%
at a concentration of 0.03 mg/mL. In spite of its reported toxicity (64, 65), PEI is widely
researched as one of the main non-viral vectors for gene therapy (66). These results are
comparable to those of Zhizhong et al. (67) who studied the cytotoxicity of linear 25 kD PEI
(known to be less toxic than branched PEI (64, 66, 68)) on OS-RC-2 cell line and reported
that cell viability under 30 μg/mL of 25 kD PEI was 50%. For 2 kD PEI, half of the cells
were viable when the concentration was 200-300 μg/mL. Similar results were also shown
by Thomas et al. (69) who reported that less than 50 % of COS-7 cells were viable when the
concentration of 25 kD PEI was more than 20 μg/mL while less than 5 % of the cells were
viable when its concentration was above 35 μg/mL.
Despite its reported cytotoxicity (64, 66-70), the use of PEI has been studied for biological
applications such as gene delivery (65, 67, 71, 72), nucleic acid delivery (68, 69, 73-75),
drug delivery (70), cosmetics (76) and tissue engineering (77). In 2012, Wegmann et al.
(78) claimed that PEI is a potent mucosal adjuvant for human use and suggested that further
investigation for improvement of potency and safety of PEI as an adjuvant suggests
promising results. Many attempts to decrease the cytotoxicity of PEI by conjugation with
other molecules have been varied out. These aim at turning PEI into a bioequivalent delivery
system (67-69, 74, 75). Similarly, it can be suggested that the conjugation of acrylamide and
its derivative NIPAM into p(NIPAM) based particles can yield particles with significantly
lower toxicity. It is also worth mentioning that PEI is currently commercially available (in
the form of PEI-HCl) in a drug in the German market known as ‘Epipak’ used for mouth
disorders (79).
The main challenge for the use of NIPAM based particles as drug delivery systems is its
toxicity. The fact that the main monomer NIPAM includes acrylamide group which is
known for its toxicity (80), suggests that the polymerized particle and/or its metabolic
products (such as NIPAM monomer and/or acrylamide) might acquire the same properties.
Accordingly, the toxicity of the novel particle p(NIPAM-co-5% LY), p(NIPAM) and the
monomer was tested. In Figure 4.14 p(NIPAM) shows cell viability over 80 % up to a
concentration 3 mg/mL while NIPAM monomer showed a high cell viability (over 80 %)
for concentration equal to, or less than, 0.3 mg/mL. Above this concentration, NIPAM

p(NIPAM-co-5% LY) Chapter Four
115
monomer shows considerably less viability untill it reaches 10 % at a dosing concentration
of 3 mg/mL.
For the novel p(NIPAM-co-5% LY) particles, the results show that the cell viability is
around 80% or higher up to 3 mg/mL. This suggests that p(NIPAM-co-5% LY) is suitable
for medical and/or pharmaceutical use when used within the specified concentrations.
Similar results for the effect of the same concentrations of dextran, NIPAM monomer,
p(NIPAM), p(NIPAM-co-5% LY) and PEI on the cell viability of Vero cells. Figure 4.15
shows that dextran showed cell viability over 80% across all the dosing concentrations.
PEI showed cell viability over 80% at concentrations equal to, or less than, 0.001 mg/mL.
Increasing the dosing concentration decreased the cell viability till it reached 15 % at 0.01
mg/mL. NIPAM monomer showed high cell viability (between 80 and 100%) at
concentrations equal to, or less than, 0.3 mg/mL. Both p(NIPAM) and p(NIPAM) 5% LY
showed cell viability around 80% or more for all the dosing concentrations used.
Comparing the cytotoxicity (for both HeLa and Vero cells) of p(NIPAM) 5% LY and
p(NIPAM) to that of PEI shows that the former particles show a safer toxicity profile. While
a concentration of (0.7 µg/mL for HeLa and 3 µg/mL for Vero) of PEI killed half of the cells
(Table 4.4), 3 mg/mL of the NIPAM based particles kept more than 80 % of the cells alive
(Figures 4.15 and 4.16). Furthermore, NIPAM monomer which is expected to be one of the
metabolic products of p(NIPAM) based particles has an LC50 of 700 µg/mL (for both HeLa
and Vero cells) which is considerably higher than that of PEI. Thus, the results show that
p(NIPAM) based particles as well as NIPAM monomer (at the specified concentrations)
have a safer toxicity profile when compared to PEI. Considering the ongoing research and
use of PEI in biological and pharmaceutical applications (previously discussed) and the
properties of p(NIPAM) based particles such as temperature, pH, ionic strength
responsiveness, it is suggested that further research of the toxicity of p(NIPAM) based
particles as well as modification of the particles can yield very useful and promising systems
for biological and pharmaceutical applications such as drug delivery, gene therapy and
treatment of dentinal hypersensitivity.
The biocompatibility of p(NIPAM), p(NIPAM-co-AA) and p(NIPAM-co-BA) with skin has
been studied by Abu Samah et al. (81). The effects of the three particles on the expression
of cyclooxygenase-2 (COX-2) was determined using western blotting which showed that
the particles have penetrated the skin and the keratinocytes of the vital epidermis. p(NIPAM-

p(NIPAM-co-5% LY) Chapter Four
116
co-BA) showed 67% higher COX-2 expression than the control group which indicates a pro-
inflammatory response. For p(NIPAM-co-AA), no significant modulation in the expression
of COX-2 was shown, indicating the compatibility of the particles with skin. Comparable
results were obtained for microgel particles loaded with citric acid solution. Accordingly, the
authors support the use of the multiresponsive p(NIPAM-co-AA) as a triggered or controlled
topical drug delivery system.
For in vivo testing, Aslam et al. (82) tested the effect of different concentrations (0, 0.2, 0.4,
0.6, 0.8 and 1 mg/mL) of 150 nm p(NIPAM) on Swiss Albino mice (Mus musculus). Oral
p(NIPAM) dispersions (with the previously mentioned concentrations) were given to the
mice daily for 30 days. The results suggest that lower doses (0.2 mg/mL) had no lethal effect
on the mice. Increasing the dose of p(NIPAM) (0.4, 0.6 and 0.8 mg/mL), half the mice died
in 20-25 days. For 1 mg/mL p(NIPAM) dispersions, half the mice died in 28 days. The
authors suggest that p(NIPAM) is tolerable at low doses, on the other hand, the accumulation
of high doses of the particles (by daily administration of 1 mg/mL/kg) has a lethal effect in
an average of 18 days.
In 1981, Tanii et al. claimed that the metabolic product of NIPAM is acrylamide (83),
accordingly, it is very important to consider its toxicity while studying the toxicity of
NIPAM based particles. Many researchers have claimed that acrylamide is toxic (84), some
mention its neurotoxicity (84), others mention its genotoxicity (84) as well as other serious
effects such as testicular degeneration, necrosis of the liver, congestion of the lungs.
Acrylamides are formed when some foods including certain nutrients are cooked at certain
temperatures during grilling, frying and baking (79, 85). A review studying the dose-
response relationship of acrylamide was carried out by Shipp et al. (85), the study states that
the reference dose (RfD) (safe dose) of acrylamide is 0.83 µg/kg/day (considering
reproductive effects and genotoxicity) and 1.2 µg/kg/day (considering neurotoxicity). The
review also claims that most of the reports of acrylamide toxicity did not consider very
important factors such as the smoking state of the patients which is extremely important
(85). Considering the RfD mentioned by Shipp et al. (85), an adult of average weight 70 kg
can safely have 58 µg/day of acrylamide.
In 1992, an occupational safety and health guideline for acrylamide was produced by the US
Department of health and human services and the US Department of Labor (84). The

p(NIPAM-co-5% LY) Chapter Four
117
toxicology results in this report states that the lethal dose 50 (LD50) (the dose that kills half
of the animals) of orally administered acrylamide in rabbits is 150 - 180 mg/kg while for
dermally applied acrylamide it is 2250 mg/kg. In rats, the report states that the LD50 was
565 mg/kg and 490 mg/kg for males and females, respectively (84). Only when continuously
exposed to an acrylamide dose of 1 mg/kg/day did cats, rats and monkeys develop
neuropathies (84). In theory, if we apply this to humans, an adult human being of average
weight 70 kg needs to orally administer 70 mg/day to develop neuropathy.
An example of polyacrylamide containing drug that have been available in the German
market for years is a drug commercially known as ‘Geliperm’ gel and wound dressing (86)
for the treatment of wounds. The active ingredient of this drug is poly(acrylamide-
N,N´methylenediacrylamide) (79). The drug is produced by two companies; Geistlich
Pharma and Yamanouchi Pharma GmbH (86). In spite of being an acrylamide polymer, the
drug has been used in the European market for years which suggests no major problems
were reported concerning its toxicity. In 1988, the U.S. Naval research office in London
mentioned Geliperm as one of the drugs commonly used in treatment of wounds (87). In
2006, the medical uses of Geliperm were further extended to be used as a hydrogel wound
dressing for protecting the eyes of anaesthetized patients during surgery and in the intensive
care unit (88). It was also used as a sterile, solid gel interface between ultrasound probe and
skin for producing ultrasound images (88). Such an example, suggests that the medical and
pharmaceutical use of p(NIPAM) particles can be applicable if well studied and applied.
Very important questions arise on this occasion. If used as a drug delivery system, how much
acrylamide would the metabolism of p(NIPAM) based particles yield? How much
p(NIPAM) based particles would be required for drug delivery? Does p(NIPAM)
metabolism yield any other metabolites? Can the metabolic pathways of p(NIPAM) be
altered? Would the route of administration of p(NIPAM) particles highly affect the toxicity
profile? Would the synthesis method of p(NIPAM) particles make much difference in its
toxicity? Does anionic p(NIPAM) have a different toxicity than cationic one? Considering
late cases of cancer or other serious diseases, is there a study that compares the advantages
and the disadvantages of using p(NIPAM) particles as a delivery system (in case of late
stages of fatal diseases such as cancer)? Some of these questions are being addressed (59,
81, 89). Yet, a lot more research is needed to find out if p(NIPAM) based particles can be a
promising non-toxic drug delivery system, some of which will be targeted in the future

p(NIPAM-co-5% LY) Chapter Four
118
research plan. This will include more in vitro toxicity studies with different environmental
conditions, more animal testing with different doses to define a dose response curve of
p(NIPAM) and its metabolites. According to the results obtained, the decision will be made
whether or not proceed to human testing.
Most of the drugs currently available in the market can cause different kind of toxicities and
can even be lethal if administered at the wrong dose. It is worth mentioning at this point,
that p(NIPAM) based particles (if pharmaceutically used) are intended to be used as a drug
delivery system and not a drug, this might be important while calculating the required dose.
4.4 Conclusions and future work
4.4.1 Conclusions
A novel fluorescent negatively charged temperature/pH-sensitive particle (p(NIPAM-co5%
LY)) was successfully synthesized and characterized using different techniques. At pH 7
and 15ºC (the particle is swollen), the particle size is 250 nm. When the temperature exceeds
the VPTT (35ºC) the particle de-swells to reach 130 nm. These particle sizes are
approximately half that of p(NIPAM) at similar conditions. The PdI and the intensity peaks
of the novel microgel dispersion indicate a uniform particle size across the dispersion. The
particle shows pH sensitivity where the particle size increases around pH 5 which is the
calculated pKa of LY. The fluorescence emission intensity is affected by the change in
temperature. Increasing the temperature causes an increase in the fluorescence emission
intensity. The microscopy experiments show that the particles are spherical, monodispersed
and fluorescent.
This study only provides initial evidence of the biocompatibility of NIPAM based particles
and its metabolite at the specified concentrations. However, it can be concluded that NIPAM
monomer is more toxic than both p(NIPAM) and p(NIPAM-co-5% LY). The two microgel
particles show cell viability over 80% (for both cell lines HeLa and Vero) up to a
concentration of 3 mg/mL while NIPAM monomer show cell viability over 80% equal to or
less than 0.3 mg/mL. At concentration of 3 mg/mL, NIPAM monomer shows 10% cell
viability. These data add to the few existing reports on the toxicity of NIPAM based particles
and provide some encouragement around their biocompatibility and possible use for drug
delivery applications.

p(NIPAM-co-5% LY) Chapter Four
119
4.4.2 Future work
Further improvement of p(NIPAM-co-5% LY) particle will be carried out to support its
suggested use as a combined diagnostic and drug delivery system that specifically targets
cancer cells. This will include the incorporation of other co-monomers to improve the pH
sensitivity of the particle. To further improve the tracing and diagnostic abilities of the
particle, the incorporation of other fluorescent molecules that can change the colour of their
fluorescence by the change in pH can be investigated. Also, the incorporation of
comonomers with specific groups that bind with specific receptors of the cell membrane of
cancer cells will be carried out.
To determine if p(NIPAM) based particles are biocompatible, more studies considering all
the factors that can affect toxicity should be conducted. These studies will investigate the
pharmacology and pharmaco-kinteics of p(NIPAM) based particles. These studies are not
only required to further investigate the in vitro toxicity on different cell lines but also test
the in vivo toxicity (animal and human testing), determine the metabolic products of NIPAM
based microgel particles and study their effect on the human body. Based upon these studies,
it is to be decided whether or not these particles shall be used in medical and pharmaceutical
applications such as drug, gene and nucleic acid delivery. Future experiments will also
include the localization of p(NIPAM-co-5% LY) inside cells to understand its behaviour in
vivo. The uptake and release of different drugs from p(NIPAM-co-5% LY) and the factors
affecting them will also be investigated.
4.5 References
1. Mohsen R., Vine G. J., Majcen N., Alexander B. D., Snowden M. J. Characterization of thermo and pH responsive NIPAM based microgels and their membrane blocking potential. Colloids and Surfaces A: Physicochemical and Engineering Aspects. 2013;428:53-9.
2. Saunders B. R., Laajam N., Daly E., Teow S., Hu X., Stepto R. Microgels: From
responsive polymer colloids to biomaterials. Advances in Colloid and Interface Science. 2009;147-48:251-62.
3. Ma X., Tang X. Flocculation behavior of temperature-sensitive poly(N- isopropylacrylamide) microgels containing polar side chains with -OH groups. Journal of Colloid and Interface Science. 2006;299:217-24. 4. ACD/Labs Lucifer yellow VS. 2010
file:///C:/Users/user/Downloads/pka%20(2).pdf. Accessed on the 14th of November, 2014.

p(NIPAM-co-5% LY) Chapter Four
120
5. Sigma. Lucifer yellow vs. http://www.sigmaaldrich.com/catalog/product/aldrich/862053?lang=en®ion=GB. Accessed on the 16th of April, 2013. 6. Thorne J. B., Vine G. J., Snowden M. J. Microgel applications and commercial
considerations. Colloid Polym Sci. 2011;289:625-46. 7. Pinkrah V. T., Beezer A. E., Chowdhry B. Z., Gracia L. H., Cornelius V. J., Mitchell
J. C., Castro-Lopez V., Snowden M. J. Swelling of cationic polyelectrolyte colloidal microgels: Thermodynamic considerations. Colloids and Surfaces APhysicochemical and Engineering Aspects. 2005;262:76-80.
8. Ramkissoon-Ganorkar C., Liu F., Baudys M., Kim S. W. Modulating insulinrelease
profile from pH thermosensitive polymeric beads through polymer molecular weight. Journal of Controlled Release. 1999;59:287-98.
9. Castro Lopez V., Hadgraft J., Snowden M. J. The use of colloidal microgels as a
(trans)dermal drug delivery system. International Journal of Pharmaceutics. 2005;292:137–47. 10. Pelton R. Temperature-sensitive aqueous microgels. Advances in Colloid and
Interface Science. 2000;85:1-33. 11. Yasui M., Shiroya T., Fujimoto K., Kawaguchi H. Activity of enzymes immobilized
on microspheres with thermosensitive hairs. Colloids and Surfaces BBiointerfaces. 1997;8:311-9.
12. Kondo A., Oku S., Higashitani K. Adsorption of gamma-globulin, a model protien
for antibody on colloidal particles. Biotechnology and Bioengineering. 1991;37:537-43.
13. Kitano H., Nakamura K., Hirai Y., Kaku T., Ise N. Restricted diffusion effect on the
binding of protiens to porous polymer resins as studied by repetitive injection method. Biotechnology and Bioengineering. 1988;31:547-52.
14. Weitai Wu, Shoumin Chen, Yumei Hu, Shuiqin Zhou. A Fluorescent Responsive
Hybrid Nanogel for Closed-Loop Control of Glucose. Journal of Diabetes Science and Technology. 2012;6:892-901.
15. Ravaine V., Ancla C., Catargi B. Chemically controlled closed-loop insulin
delivery. Journal of Controlled Release. 2008;132:2-11. 16. Sabnis R. W. Handbook of biological dyes and stains. Synthesis and industrial
applications. New-Jersey: Wiley; 2010.

p(NIPAM-co-5% LY) Chapter Four
121
17. Sigma. Product information. Saint Lois - USA: https://www.sigmaaldrich.com/content/dam/sigmaaldrich/docs/Sigma/Product_Information_Sheet/2/l0259pis.pdf. Accessed on 10th of April, 2013.
18. Urstenberg A., Vauthey E. Excited-state dynamics of the fluorescent probe Lucifer
Yellow in liquid solutions and in heterogeneous media. Photochemical & Photobiological Sciences. 2005;4:260-67.
19. Mayr T. Optical sensors for determination of heavy metal ions: Universitat
Regensburg; 2002. 20. ACD/Labs. 2010 https://ilab.acdlabs.com/iLab2/. Accessed on the 14th of
November, 2014. 21. Heller M. J., Jablonski E. J. Fluorescent stokes shift probes for polynucleotide
hybridization assays. Patent. 1990, application number CA 523997. 22. Buetow D. E., Cameron I. T., Padilla G. M., Zimmerman A. M., Stevens J. K., Mills
L. R., Trogadis J. E. Three-Dimensional Confocal Microscopy: Volume Investigation of Biological Specimens. Editors: Stevens J., Mills L. and Trugadis J. California: Academic Press; 1994.
23. Thermo Scientific. FITC and TRITC. Rockford: Thermo Scientific. Report No.:
46424 46425 46112. http://tools.lifetechnologies.com/content/sfs/manuals/MAN0011646_FITC_TRITC_UG.p df 24. Thermo Scientific. Texas Red Sulfonyl Chloride. Rockford: Thermo Scientific
Report No.: 46115. http://www.funakoshi.co.jp/data/datasheet/PCC/46115.pdf. 25. Lucifer Yellow CH Dilitium salt. http://www.fluorophores.tugraz.at/substance/30.
Accessed on 12th of February, 2015. 26. Fluorescence Quantum Yield Standards. 1984
http://www.iss.com/resources/reference/data_tables/FL_QuantumYieldStandards.html. Accessed on 5th of June, 2014.
27. Stephan D., Sbai O., Wen J., Couraud P. O., Putterman C., Khrestchatisky M.,
Desplat-Jégo S. TWEAK/Fn14 pathway modulates properties of a human microvascular endothelial cell model of blood brain barrier. Journal of Neuroinflammation 2013;10.
28. Thorne J. B. Controlling the interfacial behaviour of colloidal microgel systems. PhD
thesis, University of Greenwich; 2012. 29. Elaissari A. Colloidal Biomolecules, Biomaterials, and Biomedical Applications.
Surfactant Science. Lyon - France: CRC Press; 2003.

p(NIPAM-co-5% LY) Chapter Four
122
30. Alarcon C. D., Twaites B., Cunliffe D., Smith J. R., Alexander C. Grafted thermo- and pH responsive co-polymers: Surface-properties and bacterial adsorption. International Journal of Pharmaceutics. 2005;295:77-91.
31. Ballatori N., Hager D. N., Nundy S., Miller D. S., Boyer J. L. Carrier-mediated
uptake of lucifer yellow in skate and rat hepatocytes: a fluid-phase marker revisited. Gastrointest Liver Physiol. 1999;40:G896–G904.
32. Tsuji S., Kawaguchi K. Colored Thin Films Prepared from Hydrogel Microspheres.
Langmuir. 2005;21:8439-42. 33. Lakowicz J. R. Principles of Fluorescence Spectroscopy. Baltimore - USA: Springer;
2007. 34. Herron J. N., Jiskoot W., Crommelin D. J. Physical methods to characterize
pharmaceutical proteins. New York and London: Plenum Press; 1995. 35. Steinberg T. H., Newman A. S., Swanson J. A., Silverstein S. C. Macrophages
Possess Probenecid-inhibitable Organic Anion Transporters that Remove Fluorescent Dyes from the Cytoplasmic Matrix. The Journal of Cell Biology. 1987;105:2695-702.
36. Pant S., Tripathi H. B. , Pant D. D. Solvent polarity and viscosity effect on the
fluorescence spectrum and excited state lifetime of quinine dication. Journal of Photochemistry and Photobiology A: Chemistry. 1995;85:33–8.
37. Baruah M., Qin W., Flors C., Hofkens J., Valle R. A., Beljonne D., Van der
Auweraer M., Borggraeve W. M., Boens N. Solvent and pH Dependent Fluorescent Properties of a Dimethylaminostyryl Borondipyrromethene Dye in Solution. J Phys Chem A. 2006;110:5998-6009.
38. Sun B., Lin Y., Wu P. Structure Analysis of Poly(N-isopropylacrylamide) Using
Near-Infrared Spectroscopy and Generalized Two-Dimensional Correlation Infrared Spectroscopy. Applied Spectroscopy. 2007;61:765-71.
39. Li D., Zhang X., Yao J., Simon G. P., Wang H. Stimuli-Responsive Polymer
Hydrogels as a New Class of Draw Agent for Forward Osmosis Desalination. Chemical Communications. 2011.
40. Lambert J. B., Shurvell H. F., Lightner D. and Cooks R. G. Introduction to organic
spectroscopy. Editor: Verbit L. New York/London: Collier Macmillan publishers; 1987.
41. Zenkl G., Klimant I. Fluorescent acrylamide nanoaprticles for boronic acid sugar
sensing - from probes to sensors. Microchim Acta. 2009;166:123-31.

p(NIPAM-co-5% LY) Chapter Four
123
42. Yin J., Guan X., Wang D., Liu S. Metal-Chelating and Dansyl-Labeled Poly(Nisopropylacrylamide) Microgels as Fluorescent Cu2+ Sensors with Thermo-Enhanced Detection Sensitivity. Langmuir. 2009;25:11367–74.
43. Saunders B. R., Crowther H. M., Morris G. E., Mears S. J., Cosgrove T., Vincent B.
Factors affecting the swelling of poly(N-isopropylacrylamide) microgel particles: fundamental and commercial implications. Colloids and Surfaces A-Physicochemical and Engineering Aspects. 1999;149:57-64.
44. Gracia L. H., Snowden M. J. Handbook of Industrial water soluble polymers. editor: Williams P.. Blackwell publishing; 2007. 45. Crowther H. M., Saunders B. R., Mears S. J., Cosgrove T., Vincent B., King S. M.,
Yu G. E. Poly(NIPAM) microgel particle deswelling: a light scattering and small-angle neutron scattering study. Colloids and Surfaces A: Physicochemical and Engineering Aspects. 1999;152:327-33.
46. Ali M. M., Aguirre S. D., Yaqin X., Filipe C. D., Pelton R., Li Y. Detection of DNA
using bioactive paper strips. Chemical Communications. 2009;43:6640-2. 47. Pelton R. H., Chibante P. Preparation of aqueous lattices with Nisopropylacrylamide.
Colloids and Surfaces. 1986;20:247-56. 48. Hazot P., Delair T., Pichot C., Chapel J. P., Elaissari A. Poly(N- ethylmethacrylamide) thermally-sensitive microgel latexes: Effect of the nature of the crosslinker on the polymerization kinetics and physicochemical properties. Comptes Rendus Chimie. 2003;6:1417-24. 49. Oh J. K., Drumright R., Siegwart D. J., Matyjaszewski K. The development of
microgels/nanogels for drug delivery applications. Prog Polym Sci. 2008;33:448–77.
50. Kurdi M., Chidiac R., Hoemann C., Zouein F., Zgheib C., Booz G. W. Hydrogels
as a Platform for Stem Cell Delivery to the Heart. Wiley Periodicals. 2010;16:132-5.
51. Bridges A. W., Singh N., Burns K. L., Babensee J. E., Lyon L.A., Garcia A. J.
Reduced acute inflammatory responses to microgel conformal coatings. Biomaterials. 2008;29:4605–15.
52. Lin S. Y., Chen K. S., Liang R. C. Design and evaluation of drug-loaded wound
dressing having thermo responsive, adhesive, absorptive and easy peeling properties. Biomaterials. 2001;22:2999-3004.
53. Lin F. H., Tsai J. C., Chen T. M., Chen K. S., Yang J. M., Kang P. L., Wu T. H.
Fabrication and evaluation of auto-stripped tri-layer wound dressing for extensive burn injury. Materials Chemistry and Physics. 2007;102:152-8.
p(NIPAM-co-5% LY) Chapter Four
124
54. Percell Biolytica. Growth of HeLa Cells. Online report. Åstorp, Sweden. Application Note 116.
55. Percell Biolytica. Growth of Vero and GMK Cells. Online report. Åstorp, Sweden.
Application Note 115. 56. Sigma Aldrich (Cook Book Sept 2010 Volume 12 FTiCCLH-nE. Cell Types and
Culture Characteristics. 2010; Available from: http://www.sigmaaldrich.com/technicaldocuments/protocols/biology/cell-types-culture.html. Accessed on the 11th of June, 2014.
57. Naha P. C., Bhattacharya K., Tenuta T., Dawson K. A., Lynch I., Gracia A, Lyng F.
M., Byrne H. J. Intracellular localisation, geno- and cytotoxic response of polyNisopropylacrylamide (PNIPAM) nanoparticles to human keratinocyte (HaCaT) and colon cells (SW 480). Toxicology Letters. 2010;198:134-43.
58. Naha P., Casey A., Tenuta T., Lynch I., Dawson K. A., Byrne H. J., Davoren M.
Preparation, characterization and ecotoxicological evaluation of four environmentally relevant species of N-isopropylacrylamide and N-isopropylacrylamide-co-N-tertbutylacrylamide copolymer nanoparticles. Dublin Institute of Technology, Articles Radiation and Environmental Science Centre. 2009; 92:146-54.
59. Cuggino J. C., Alvarez C. I., Strumia M. C., Welker P., Licha K., Steinhilber D.,
Mutihac R. C., Calderón M. Thermosensitive nanogels based in dendritic polyglycerol and N-isopropylacrylamide. Soft Matter. 2011;7:11259-66.
60. Gold M. A Conspiracy of Cells: One woman's Immortal Legacy-And the Medical
Scandal It Caused. New York - United Statesof America: SUNY Press; 1986. 61. Voevodin A. F., Marx P. A. Simian Virology. New Delhi - India: John Wiley &
Sons; 2009. 62. Kafil V., Omidi Y. Cytotoxic Impacts of Linear and Branched Polyethylenimine
Nanostructures in A431 Cells. BioImpacts. 2011;1:23-30. 63. Florea B. I, Meaney C., Junginger H. E., Borchard G. Transfection Efficiency and
Toxicity of Polyethylenimine in Differentiated Calu-3 and Nondifferentiated COS-1 Cell Cultures. AAPS PharmSci. 2002;4:1-11.
64. Okon E. U., Hammed G., Abu El Wafa P., Abraham O., Case N., Henry E. In-vitro
cytotoxicity of Polyethyleneimine on HeLa and Vero Cells. International Journal of Innovation and Applied Studies. 2014;5:192-9.
65. Xu Z., Shen G., Xia X., Zhao X., Zhang P., Wu H., Guo Q., Qian Z., Wei Y., Liang
S. Comparisons of three polyethyleneimine-derived nanoparticles as a gene therapy delivery system for renal cell carcinoma. Journal of Translational Medicine. 2011;9(46).

p(NIPAM-co-5% LY) Chapter Four
125
66. Dahai J. Application of polymers in nucleic acid delivery. PhD thesis, University of
Iowa; 2011. 67. Thomas M., Ge Q., Lu J. J., Chen J., Klibanov A. M. Cross-linked Small
Polyethylenimines: While Still Nontoxic, Deliver DNA Efficiently to Mammalian Cells in Vitro and in Vivo. Pharmaceutical Research. 2005;22:373 - 80.
68. Bauer J. A., Rao W., Smith D. J. Evaluation of linear polyethyleneimine/nitric oxide
adduct on wound repair: therapy versus toxicity. Wound Repair and Regeneration. 1998;6:569-77.
69. Wang X., Zhou L., Ma Y., Li X., Gu H. Control of Aggregate Size of
Polyethyleneimine-Coated Magnetic Nanoparticles for Magnetofection. Nano Res. 2009;2:365-72.
70. Sharma A., Tandon A., Tovey J. C., Gupta R., Robertson J. D., Fortune J. A.,
Klibanov A. M., Cowden J. W., Rieger F. G., Mohan R. R. Polyethylenimine-conjugated gold nanoparticles: Gene transfer potential and low toxicity in the cornea. Nanomedicine. 2011;7:505–13.
71. Lee M. Apoptosis Induced by Polyethylenimine/DNA Complex in Polymer
Mediated Gene Delivery. Bull Korean Chem Soc. 2007;28:95-8. 72. Han S. E., Kang H., Shim G. Y., Kim S. J., Choi H. G., Kim J., Hahn S. K., Oh Y.
K. Cationic derivatives of biocompatible hyaluronic acids for delivery of siRNA and antisense oligonucleotides. Journal of Drug Targeting. 2009;17:123–32.
73. Huang Y. P., Lin I. J., Chen C. C., Hsu Y. C., Chang C. C., Lee M. J. Delivery of
small interfering RNAs in human cervical cancer cells by polyethylenimine-functionalized carbon nanotubes. Nanoscale Research Letters. 2013;8:267-78.
74. Inventor: Gordon Trent Hewitt, Upper Montclair, N.J., assignor to ColgatePalmolive
Company, New York, NY., Polyethylenimine Shampoo Compositions. United States of America. 1973.
75. Khanam N., Mikoryak C., Draper R. K., Balkus K. J. Electrospun linear
polyethyleneimine scaffolds for cell growth. Acta Biomaterialia. 2007;3:1050-59. 76. Wegmann F., Gartlan K. H., Harandi A. M., Brinckmann S. A., Coccia M., Hillson
W. R., Kok W. L., Cole S., Ho L. P., Lambe T., Puthia M., Svanborg C., Scherer E. M., Krashias G., Williams A., Blattman J. N., Greenberg P. D., Flavell R., Moghaddam A. E., Sheppard N. C., Sattentau Q. J. Polyethyleneimine is a potent mucosal adjuvant for glycoproteins with innate and adaptive immune activating properties. Nat Biotechnol. 2012;30:883–8. 77. Martindale: The Complete Drug Reference London:
Sweetman SC

p(NIPAM-co-5% LY) Chapter Four
126
(Ed),Pharmaceutical Press; 1933-2005. 78. U.S. Department of Health and Human Services. Toxicological profile for
acrylamide. Atlanta, Georgia: U.S. Department of Health and Human Services - Public Health Service - Agency for Toxic Substances and Disease Registry; 2012.
79. Abu Samah N. H., Heard C. M. The effects of topically applied polyNIPAM-based
nanogels and their monomers on skin cyclooxygenase expression, ex vivo. Nanotoxicology. 2014;8:100-6.
80. Aslam I., Verma R. K., Roy R., Roy S. P. Synthesis of polymeric nanoparticle
“pnipam” poly (N-isopropylacrylamide) and their toxicity assay on Swiss albino mice Mus musculus. Indian Journal of Fundamental and Applied Life Sciences. 2013;3:116-9.
81. Tanii H., Hashimoto K. Studies on in vitro metabolism of acrylamide and related
compounds. Archives of Toxicology 1981;48:157-66. 82. US Department of health and human services, US Department of Labor.
Occupational safety and health guideline for acrylamide: US Department of health and human services - National institute for occupational safety and health - Devision of standards development and technology transfer, US Department of Labor - Occupational Safety and health administration.1992.
83. Shipp A., Lawrence G., Gentry R., McDonald T., Bartow H., Bounds J., Macdonald
N., Clewell H., Allen B., Landingham C. V. Acrylamide: Review of Toxicity Data and Dose-Response Analyses for Cancer and Noncancer Effects. Critical Reviews in Toxicology. 2006;36:481–608.
84. European Society of Clinical Pharmacy. Euroepan Drug Index. Fourth ed. Editors:
Muller N., Dessing R. Parallelboulevard - The Netherlands: Amsterdam Medical Press B.V.; 1997.
85. Zomzely-Neurath C. E. Biotechnology Conference: Drug Delivery and Drug
Targeting Systems. London: U.S. Office of Naval Research Branch Office, London; 1988. Report No.: 8-007-C.
86. Lynch M. Ultrasound guided central venous catheter placement using Geliperm.
Anaesthesia 2006;61:505-17. 87. Al-Haydari M. D. Immune Response to Synthesized Pnipam-Based Graft Hydrogels
Containing Chitosan and Hyaluronic Acid. MSc. thesis, McMaster University; 2010.

p(NIPAM-co-5% AA-hexenol) Chapter Five
127
Chapter Five Synthesis, characterization and emulsification properties of poly(N-
isopropylacrylamide-co-acrylic acid)-hexenol
5.1 Introduction
Emulsions can be defined as “an opaque, heterogeneous system of two immiscible liquid
phases, where one of the phases is dispersed in the other as drops of microscopic or colloidal
size” (1). A surfactant is a substance which lowers the surface tension of the medium in which
it is dissolved and/or the interfacial tension with other phases and accordingly is positively
adsorbed at the interface between two phases (2). Colloidal particles are able to act similar
to surfactants by being held at liquid-liquid interfaces without aggregating. Emulsions that
are stabilized by particles are called “Pickering emulsions”. The surfactant effect of colloidal
particles is achieved by one of two mechanisms; first is that the colloidal particles (acting as
a surfactant) provide steric hindrance to droplet-droplet coalescence (of the liquid) and the
second is that the particles change the rheological properties of the emulsion at the interface
(3). In Pickering emulsions, the particles irreversibly adsorb at the oil-water interface.
Accordingly, the desorption of these particles requires high energy (much higher than that
required for the desorption of conventional emulsifiers). Different studies have investigated
the emulsion stabilizing effects of microgel particles (3-9) where some of them were water-
in-oil emulsions (9) and others were oil-in-water (8). Using environmentally responsive
particles can make it possible to control the stability of Pickering emulsions (6, 10, 11).
Different factors are thought to affect the ability of microgel particles to act as a surfactant.
For example, when the particles are more hydrophobic they can spread more into the oil
phase and thus lower the interfacial tension between the two phases. Also, the wettability of
the particles that enable them to hold the aqueous phase (5, 7) is an important factor. Other
factors include the surface charge of the particles and the interaction between them (5).
The advantages of Pickering emulsions over conventional ones include their ability to reduce
tissue irritation and that their viscosity can be easily changed by changing the nature and
content of the solid material (6) as well as the environmental conditions around them (12).
In their review about microgel particles at the liquid-liquid interface, Li et al.
(5) suggested that microgel stabilized systems are more stable than surfactant stabilized ones.
On the other hand, some challenges still face the use of microgel particles as emulsion
stabilizers (5). These include the synthetic approach where most of the particles prepared by

p(NIPAM-co-5% AA-hexenol) Chapter Five
128
precipitation polymerization are inhomogeneous. This affects the physical properties of the
particles such as the particle surface charge, elasticity and swelling which highly affects the
behaviour of the particle at the interface. Also, the protrusion of the particles in the oil phase
is limited and the mechanism of adsorption of the microgel particles and their molecular
arrangement at the oil-water interface is poorly understood.
The novel particles synthesized in this work address the challenges pointed out by Ngai et al.
(5) who suggest that the synthetic approach to microgels has a big influence on their physical
properties. Microgels prepared using precipitation polymerization are often characterized by
inhomogeneous spatial distribution of the different functional groups used during synthesis.
This causes a lack of control of the behaviour of the particles in terms of the swelling time,
charge distribution and particle elasticity (5). The synthetic approach used in this work
(surfactant free emulsion polymerization (SFEP) technique followed by carbodiimide
coupling) yielded mono-dispersed particles as proven by the DLS and SEM data (Figures 5.2
and 5.7 respectively). The advantages of SFEP are its high product yield (around 95%) of
monodispersed particles and the regularity in both size and composition of the resultant
particles. This is achieved without the need to use surfactants which are not easily removed
after the synthesis.
The NIPAM monomer has a hydrophobic group (isopropyl) and a hydrophilic one (amide).
During the microgel synthesis, the monomer molecules are arranged so that the hydrophobic
groups are at the centre and the hydrophilic ones are at the periphery. Accordingly,
p(NIPAM) particles are characterized by having a hydrophobic core and a hydrophilic shell
(13). Increasing the number of hydrophobic groups used in a microgel would allow the
particles to penetrate more in the hydrophobic phase while increasing the number of
hydrophilic groups would allow the particles to penetrate into the aqueous one. This is
supposed to play an important role in lowering the interfacial tension between the two phases
and thus allow them to act as an emulsifying agent. In this work, hexenol which has a
hydrophobic hydrocarbon chain, is attached to p(NIPAM-co-5% acrylic acid).
This approach suggests an improvement in the second challenge mentioned by Ngai et al. (5) who claim that the microgel particles appear to be flattened at the interface and
protruded only a little into the oil phase. Moreover, the presence of a pendant vinyl group at
the end of the hexenol chain makes it possible to further polymerize the particles to form

p(NIPAM-co-5% AA-hexenol) Chapter Five
129
bigger structures referred to in this work as “microgellosomes”. These are new structures
that are suggested to act as emulsifying agents as well as delivery vehicles.
5.2 Materials and methods:
5.2.1 Materials
For the particle synthesis: N-isopropylacrylamide (NIPAM) 97% (Aldrich), N, N'methylenebisacrylamide 99% (Aldrich), potassium persulphate 98% (BDH Laboratory
Suppliers), 5-hexen-1-ol (Aldrich), N-(3-dimethylaminopropyl)-N′-ethylcarbodiimide
hydrochloride (EDC) and N-hydroxysuccinimide (NHS) were obtained from commercial suppliers and used without further purification. For the emulsification: glyceryl trioctanoate (tricaprylin), hexadecane and rhodamine 6G were all purchased from SigmaAldrich, UK. A solution of rhodamine 6G was prepared by dissolving the dye at a concentration of 1x10⁻³ mol/L in an ultra-pure Milli-Q water.
5.2.2 Methods
5.2.2.1 Synthesis of p(NIPAM-co-5% AA)-hexenol
Step 1: Synthesis of p(NIPAM-co-5% AA) (w/v)
In a 1 L reaction vessel, 0.5 g of potassium persulphate was dissolved in 800 mL of distilled
water. A three-necked lid was clamped to the reaction vessel, which was then heated to 70°C
with continuous stirring. 4.75 g NIPAM, 0.25 g acrylic acid (AA) and 0.5 g N,N’-
methylenebisacrylamide were stirred in distilled water (200 ml) and transferred into the
reaction vessel containing the initiator (potassium persulphate) and continuously stirred at
70°C for six hours under an inert atmosphere of nitrogen. When the reaction was complete,
the microgel dispersion was allowed to cool to room temperature. The microgel was dialyzed
in fresh de-ionized water for a week (changed daily), centrifuged to decrease the water
content then freeze dried.
Step 2: Esterification of p(NIPAM-co-5% AA) with 5-hexen-1-ol
The carboxylic acid of AA is coupled with the hydroxyl of 5-hexen-1-ol using N-
(3dimethylaminopropyl)-N′-ethylcarbodiimide hydrochloride (EDC) and
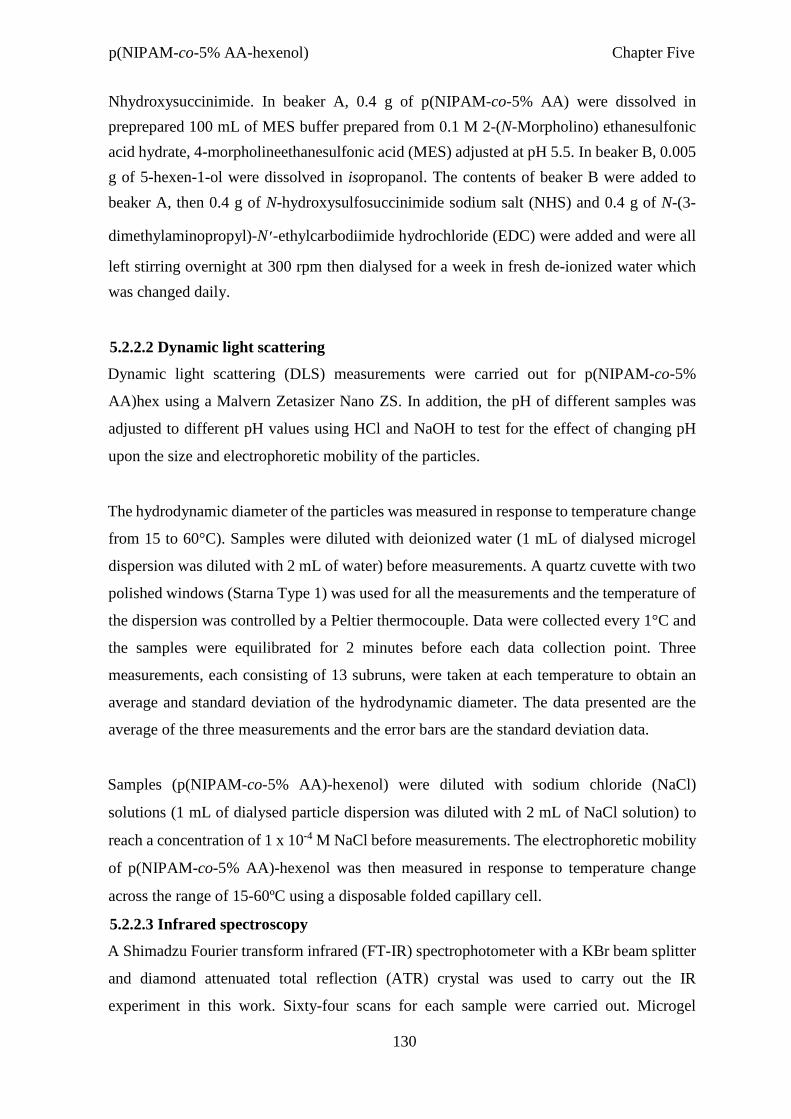
p(NIPAM-co-5% AA-hexenol) Chapter Five
130
Nhydroxysuccinimide. In beaker A, 0.4 g of p(NIPAM-co-5% AA) were dissolved in preprepared 100 mL of MES buffer prepared from 0.1 M 2-(N-Morpholino) ethanesulfonic acid hydrate, 4-morpholineethanesulfonic acid (MES) adjusted at pH 5.5. In beaker B, 0.005 g of 5-hexen-1-ol were dissolved in isopropanol. The contents of beaker B were added to beaker A, then 0.4 g of N-hydroxysulfosuccinimide sodium salt (NHS) and 0.4 g of N-(3-
dimethylaminopropyl)-N′-ethylcarbodiimide hydrochloride (EDC) were added and were all
left stirring overnight at 300 rpm then dialysed for a week in fresh de-ionized water which was changed daily.
5.2.2.2 Dynamic light scattering
Dynamic light scattering (DLS) measurements were carried out for p(NIPAM-co-5%
AA)hex using a Malvern Zetasizer Nano ZS. In addition, the pH of different samples was
adjusted to different pH values using HCl and NaOH to test for the effect of changing pH
upon the size and electrophoretic mobility of the particles.
The hydrodynamic diameter of the particles was measured in response to temperature change
from 15 to 60°C). Samples were diluted with deionized water (1 mL of dialysed microgel
dispersion was diluted with 2 mL of water) before measurements. A quartz cuvette with two
polished windows (Starna Type 1) was used for all the measurements and the temperature of
the dispersion was controlled by a Peltier thermocouple. Data were collected every 1°C and
the samples were equilibrated for 2 minutes before each data collection point. Three
measurements, each consisting of 13 subruns, were taken at each temperature to obtain an
average and standard deviation of the hydrodynamic diameter. The data presented are the
average of the three measurements and the error bars are the standard deviation data.
Samples (p(NIPAM-co-5% AA)-hexenol) were diluted with sodium chloride (NaCl)
solutions (1 mL of dialysed particle dispersion was diluted with 2 mL of NaCl solution) to
reach a concentration of 1 x 10⁻⁴ M NaCl before measurements. The electrophoretic mobility
of p(NIPAM-co-5% AA)-hexenol was then measured in response to temperature change
across the range of 15-60ºC using a disposable folded capillary cell.
5.2.2.3 Infrared spectroscopy
A Shimadzu Fourier transform infrared (FT-IR) spectrophotometer with a KBr beam splitter
and diamond attenuated total reflection (ATR) crystal was used to carry out the IR
experiment in this work. Sixty-four scans for each sample were carried out. Microgel

p(NIPAM-co-5% AA-hexenol) Chapter Five
131
dispersions were dialysed and freeze-dried then the solid samples were used for IR
experiments. To record the spectrum of hexenol, liquid hexenol was used as purchased from
the commercial supplier (Sigma Aldrich) without any further modification.
5.2.2.4 Scanning electron microscopy
A Hitachi SU8030 cold cathode filled emission gun scanning electron microscope was used to obtain micrographs of p(NIPAM-co-5% AA)-hex particles. The accelerating voltage used
was 30 kV, the magnification was х25000 and х35000 and the working distance was 8.4
mm.
5.2.2.5 Emulsification
The emulsions were prepared by mixing glyceryl trioctanoate (tricaprylin) with (0-0.3 wt %)
p(NIPAM-co-5% AA)-hexenol suspended in ultra-pure Milli-Q water. The pH was adjusted
to 1.8 using HCl then all the components were mixed using an Ultra Turrax T25 basic
dispersing instrument at 16000 rpm for 5 minutes. The above procedure was repeated using
hexadecane as an oil phase at concentrations from 0-0.45 wt%.
5.2.2.6 Synthesis of microgellosomes
Emulsions were prepared by mixing hexadecane with p(NIPAM-co-5% AA)-hexenol (4%
v/v and 8.6% v/v, respectively in relation to the final emulsion volume) in Milli-Q water. The
pH was adjusted to 1.8 using HCl and then mixed using an Ultra Turrax T25 basic at 16000
rpm for 5 minutes at 55-60°C. An initiator (potassium persulphate) with concentration of 2.5
% w/v (in respect to the total emulsion volume) was dissolved in the water phase before the
homogenization.
The emulsion was then transferred to a 3-necked round-bottom flask equipped with a
magnetic stirrer and a condenser, and was kept under nitrogen gas atmosphere for at least 15
minutes. The flask was then immersed in hot oil bath to maintain the temperature at 75°C
and the reaction was continued for 6 hours.
5.2.2.7 Optical microscopy
The mixtures before and after the emulsification reaction were observed using an optical
microscope (Olympus DP70).

p(NIPAM-co-5% AA-hexenol) Chapter Five
132
5.2.2.8 Fluorescence microscopy
The bright field and fluorescence images of the emulsions were captured using a BX-51
fluorescence microscope equipped with a DP70 digital camera. The different objectives used
were 4x, 20x and 50x. The Hg-arc lamp, housed in a U-RFL-T power supply was used as an
excitation light source for fluorescence microscopy. All filters and equipment above were
manufactured by Olympus, Japan. Fluorescein diacetate treated samples required a MWIBA2
filter set (λexcitation = 460-490 nm, λemision = 510-550 nm). Image analysis software package
Image Pro Plus 6 was used to capture and process the microscope images from the DP70
digital camera.
5.2.2.9 Scanning electron microscopy
After emulsification, the reaction mixture was centrifuged at 1400 rpm for 15 minutes in an
Eppendorf mini spin plus in acetone to get rid of the oil in the samples. The aliquot was air
dried, crushed using a spatula and observed under a Hitachi TM 3000 bench top scanning
electron microscope operating in transmission mode with an accelerating voltage of 30 kV.
The samples were fixed on aluminium SEM stubs 15 mm x 6 mm mounted with carbon tabs
12 mm diameter all purchased from Agar Scientific, UK.
5.3. Results and discussion
The suggested structure of p(NIPAM-co-5% AA)-hexenol particles is shown in Figure 5.1.
The novel particles are expected to maintain the matrix structure of p(NIPAM). Several
charged groups affect the surface charge on the particle, these are; the SO4- arising from the
initiator used during the synthesis of p(NIPAM-co-5% AA) and the unreacted carboxylic
acid groups of acrylic acid. The figure also shows the expected presence of long hairy
structures formed by the esterification of the carboxylic acid (arising from acrylic acid) with
the hydroxyl group of 5-hexen-1-ol. These end with a vinyl group that will be further used
to polymerize particles together.
The use of 1-ethyl-3-(3-dimethyl aminopropyl) carbodiimide (EDC) as a coupling agent between
the carboxylic acid groups and amines to form amide groups (14, 15) or alcohols to form
corresponding esters (16-18) has been previously reported. This is due to its ability to activate
COOH groups which allow reactions involving nucleophilic attacks (19). It is sometimes used in
combination of N-hydroxysuccinimide (NHS) which helps activating the COOH groups leading to

p(NIPAM-co-5% AA-hexenol) Chapter Five
133
more efficient cross-linking reactions (19). One of the advantages of using this technique is that the
unreacted starting materials are water soluble and can be easily removed after the reaction (19).
Using EDC/NHS coupling methods made it possible to design particles with different
attached side chains with specific properties. Wu et al. have used EDC to catalyse the
coupling of the carboxylic acid of acrylic acid units in p(NIPAM-co-AA) particles to
2aminomethyl-5-fluorophenylboronic acid (FPBA) which is a glucose recognition moiety to
yield a microgel capable of sensing the glucose concentration in blood and releasing insulin
accordingly (20). Other studies have used EDC catalysis to couple carboxylic acid containing
microgels with antibodies and DNA (21), graphene (22), 3-aminophenylboronic acid
(APBA) (23), amine functionalized poly ethylene glycols (24), adipic acid dihydrozide (15).
Figure 5.1 The suggested structure of p(NIPAM-co-5% AA)-hexenol 5.3.1 Characterization of p(NIPAM-co-5% AA)-hexenol particle
5.3.1.1 Particle size
5.3.1.1.1 Effect of temperature
Figure 5.2 shows that the initial hydrodynamic diameter of p(NIPAM-co-5% AA)-hexenol
is approximately 680 nm. This size is larger than that of p(NIPAM-co-5% AA) (550 nm)
(12) due to the incorporation of a hydrophilic group (carboxylic acid group from acrylic acid).
Also, the attachment of hexenol to the AA extends the hairy layer of the particle (Figure 5.1)
and accordingly, the particle size. When the temperature exceeds the VPTT (35°C), the
particles deswell and at 45°C, the size is approximately 280 nm. This confirms that the
particles still show temperature responsiveness even after the attachment of the side chain.
The reacted side chain (acrylic acid ) hexenol +
From the initiator
Pendant vinyl group
X
X
SO 4 - SO 4 - SO 4 -
SO 4 -
SO 4 - COOH
SO 4 - SO 4 -
COOH
SO 4 -
SO 4 -
Unreacted acrylic acid moieties.
OCH 2 CH ( 2 ) 3 CH=CH 2
X
X

p(NIPAM-co-5% AA-hexenol) Chapter Five
134
The change in particle size is reversible; when the heated sample is cooled, the particle swells
again (data not shown) and the particle size at 15°C is comparable to the initial value (before
heating).
The uniformity of the particles can be determined using the Poly Dispersity Index (PdI). This
is a dimensionless parameter that represents the size distribution at every measurement. PdI
is scaled such that values close to zero are thought to be highly monodispersed. Meanwhile,
values greater than 0.7 indicate that the sample has a very broad size distribution and is
probably not suitable for the dynamic light scattering (DLS) technique. The PdI of all the
measurements of p(NIPAM-co-5% AA)-hexenol is 0.05-0.2 (across the temperature range
studied) which suggests a mono-dispersed particle size distribution.
5.3.1.1.2 Effect of pH
The presence of unreacted carboxylic acid groups in the structure of p(NIPAM-co-5% AA)-
hexenol suggests that it is pH sensitive. When the pH is below the pKa of AA (4.7) (12), the
COOH groups of AA are protonated and accordingly neutral (does not add surface charge to
the particle). When the pH exceeds the pKa of AA, the COOH groups are deprotonated into
COO- which increases the repulsion forces between the negatively charged groups on the
particle leading to a larger particle size (Figure 5.3). Accordingly, Figure 5.3 shows that the
major change in the particle size takes place around pH 5. This behaviour compares to that
of p(NIPAM-co-5% AA) (33).
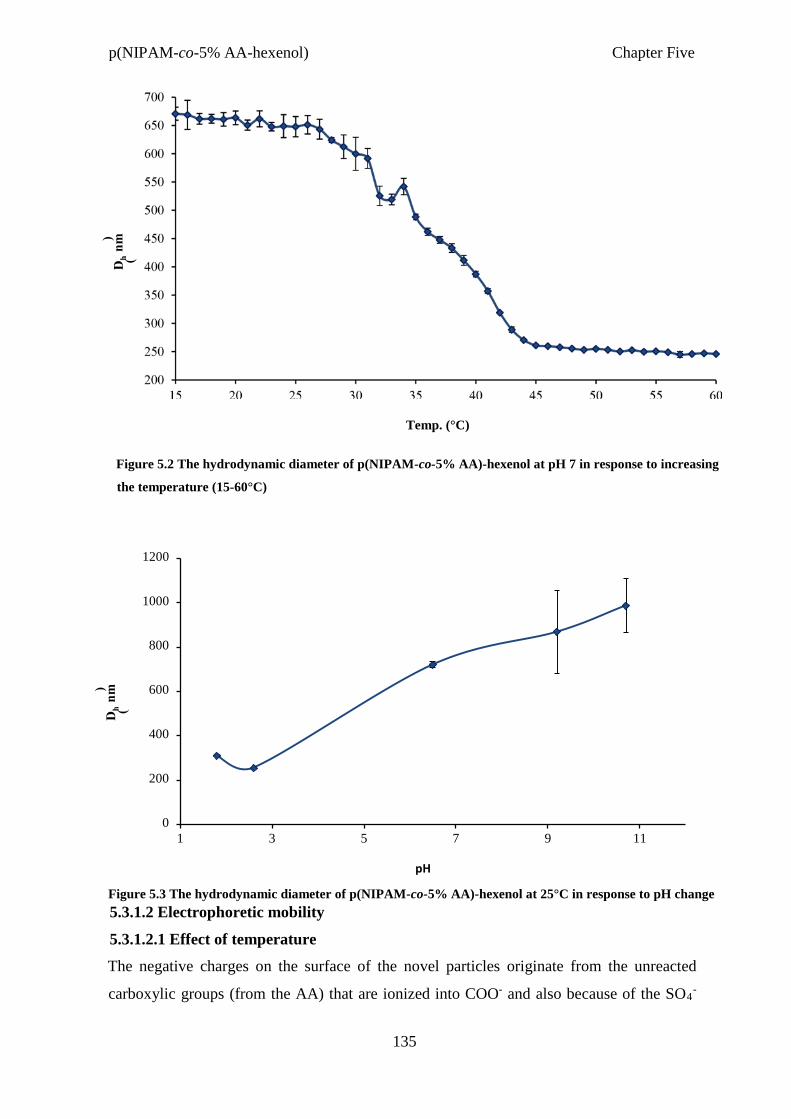
p(NIPAM-co-5% AA-hexenol) Chapter Five
135
Temp. (°C)
Figure 5.2 The hydrodynamic diameter of p(NIPAM-co-5% AA)-hexenol at pH 7 in response to increasing
the temperature (15-60°C)
Figure 5.3 The hydrodynamic diameter of p(NIPAM-co-5% AA)-hexenol at 25°C in response to pH change 5.3.1.2 Electrophoretic mobility
5.3.1.2.1 Effect of temperature
The negative charges on the surface of the novel particles originate from the unreacted
carboxylic groups (from the AA) that are ionized into COO- and also because of the SO4-
0
200
400
600
800
1000
1200
1 3 5 7 9 11
pH

p(NIPAM-co-5% AA-hexenol) Chapter Five
136
from the initiator. Figure 5.4 shows that the initial electrophoretic mobility of p(NIPAMco-
5% AA)-hexenol at 15°C is -1.78 µmcm/Vs. Increasing the temperature causes the particle
to deswell and hence increase the surface charge density and the electrophoretic mobility.
The electrophoretic mobility goes down to -2.8 µmcm/Vs at 45°C. Cooling the heated
dispersion to 15°C, the electrophoretic mobility increases to -1.68 µmcm/Vs (comparable to
the initial value). This shows that the effect of temperature on the mobility is reversible.
Figure 5.4 The electrophoretic mobility of p(NIPAM-co-5% AA)-hexenol in response to temperature change (15-55°C) at pH 7
5.3.1.2.2 Effect of pH
The effect of changing pH on the electrophoretic mobility of p(NIPAM-co-5% AA)- hexenol
particles is shown in Figure 5.5. As previously explained, increasing the pH above the pKa
of acrylic acid (4.7) causes the COOH groups to deprotonate into COO- and thus highly
increasing the particle surface charge and its electrophoretic mobility. The data in Figure 5.5

p(NIPAM-co-5% AA-hexenol) Chapter Five
137
compare to the size ones in Figure 5.3. The major change in the electrophoretic mobility is
seen around pH 5 which is close to the pKa of AA.
Figure 5.5 The electrophoretic mobility of p(NIPAM-co-5% AA)-hexenol at 25°C in response to pH change
5.3.1.3 Infrared spectroscopy
Tables 5.1 and 5.2 as well as Figure 5.6 show the FT-IR spectra of p(NIPAM-co-5% AA),
p(NIPAM-co-5% AA)-hexenol and 5-hexen-1-ol respectively. The spectra of p(NIPAMco-
5% AA) compares well with the literature (25-28) and so does hexenol (29). The spectrum
of p(NIPAM-co-5% AA)-hexenol show similarity to that of p(NIPAM-co-5% AA) (Table
5.1 and Figure 5.6). Areas that show shifts in the band or new bands are coloured in grey
(Figure 5.6). These are the areas between 1200 cm-1 and 1100 cm-1 and is between 630 cm-
1 and 450 cm-1. The spectrum of p(NIPAM-co-5% AA)-hexenol shows an extra band that is
not shown in p(NIPAM-co-5% AA), this is at 1200 cm-1 (Table 5.1 and Figure 5.6). This
band is thought to signify an ester linkage (30) referring to the esterification of the COOH of
acrylic acid and the OH of hexenol. This suggests the attachment of the hexenol to the
particle.
Table 5.1 FT-IR bands of p(NIPAM-co-5% AA) and p(NIPAM-co-5% AA) hexenol
-2.5
-2
-1.5
-1
-0.5
0 1 3 5 7 9 11
pH

p(NIPAM-co-5% AA-hexenol) Chapter Five
138
Peak
number
Wavenumber
(cm-1)
(p(NIPAM-co-
5% AA))
Wavenumber
(cm-1)
(p(NIPAM-co-5% AA)-hex)
Assignment References
1 3271 3263 N-H stretch (25, 28, 30)
2 2960 2954 -CH3 asymmetric and symmetric stretch
(25, 30)
3 2908 2899
4 1622 1625 C=O stretch (amide I bond)
(25-28, 30)
5 1525 1537 N-H deformation (amide II bond)
(27, 28, 30)
6 1448 1454 -CH3 asymmetric deformation
(30)
7 1375 1375 -CH2 symmetric deformation
(28, 30)
8 1363 1361
9 - 1200 C-O-C anti-sym stretch (ester)
(30)
10 1163 - C-C-N bending in amines
(25)
11 - 1145 C-O-C anti-sym stretch (ester)
(30)
12 - 623 O-C-O bending in esters
(30)
13 - 615
14 - 545 =CH2 in vinyl compounds
(30)
Table 5.2 FT-IR bands of 5-hexen-1-ol
Wavenumber (cm ) Assignment (30)
1 3305 OH stretch in alcohols
2 3070 =CH stretch in aromatic and unsaturated hydrocarbons

p(NIPAM-co-5% AA-hexenol) Chapter Five
139
3 2926 CH3 and CH2 (sym and asym stretch) in aliphatic compounds
4 2856
5 1639 C=C stretch in alkenes
6 1452 C-OH in-plane bend
7 1433
8 1411
9 1249
10 1055 CH2- O-H stretch in primary alcohols (C-O)
11 1031
12 991 CH=CH2 out of plane wag in vinyl compounds
13 906
14 817 CH=CH2 out of plane wag
15 729 (CH2)n rocking in hydrocarbons
16 628 C-OH bending in alcohols
17 549 CH=CH2 twisting in vinyl compounds

p(NIPAM-co-5% AA-hexenol) Chapter Five
140
-1

p(NIPAM-co-5% AA-hexenol) Chapter Five
3500 3300 3100 2900 2700 1700 1500 1300 1100 900 700 500
Wavenumber (cm-1)
p(NIPAM)- co-5%AA
p(NIPAM)- co-5%AA-hex
Hexenol
1
9
8 7 6
5 4
3 2
10
1 2 3
4 5 6 7 8
11 12 13 14
1
2
3
4 5
6 7 8
9
10 11
12
13 14
15
16
17
Figure 5.6 The FT-IR spectra of p(NIPAM-co-5% AA)-hexenol and p(NIPAM-co-5% AA) and 5-hexen-1-ol
131

p(NIPAM-co-5% AA-hexenol) Chapter Five
143
5.3.1.4 Scanning electron microscopy
Figure 5.7 show the SEM pictures of p(NIPAM-co-5% AA)-hexenol. The Figures show that
the particles are spherical in shape and monodispersed. The particle size shown in Figure
5.7 b compares to that shown by the DLS results (Figure 5.2).
(a)
(b)
Figure 5.7 SEM pictures of p(NIPAM-co-5% AA)-hexenol at 25°C with a magnification of (a) х25,000 and (b) х35,000

p(NIPAM-co-5% AA-hexenol) Chapter Five
144
5.3.2 Characterization of the emulsion stabilized by p(NIPAM-co-5% AA)-hexenol particles
The effect of microgel particles as an emulsifying agent was tested using two oils (tricaprylin
and hexadecane). These oils were chosen because their density was close to that of water
where the density of water, tricaprylin and hexadecane are 0.99 g/mL, 0.95 g/mL and 0.77
g/mL, respectively (31, 32). In both cases (using the two different oils), the use of the
microgel with a suitable concentration showed a significant effect on the emulsion
stabilization (Figures 5.8 and 5.9). Furthermore, the effect was shown to be consistent for a
week (Figures 5.8 and 5.9). At low microgel concentrations, it is clear that there are two
different phases (oily and aqueous) and an opaque top layer was observed due to the
creaming of the droplets. Increasing the microgel concentration caused a significant
decrease in the rate of creaming (Figures 5.8 and 5.9). Also, the number of emulsion droplets
increased with the increase in microgel concentration (as shown in Figures 5.10 and 5.11)
hence it can be concluded that the microgel was successfully adsorbed at the oil water
interface and caused the emulsion to be more stable.
The comparison between Figures 5.8 and 5.9 show that there is a difference in the
emulsifying properties of the particles for tricaprylin-in-water (Figure 5.8) and hexadecane-
in-water (Figure 5.9) emulsions. In the case of tricaprylin-in-water (Figure 5.8) emulsions,
a concentration of 0.3% (w/v) completely emulsifies the two phases. For the hexadecane-
in-water emulsion (Figure 5.9), the same concentration (0.3% w/v) shows two distinct layers
of liquid. Increasing the concentration of the particles to 0.45% (w/v) shows a more
homogenous phase than that at particle concentrations below 0.45% w/v. The difference in
the emulsification effect of the particles in the two different emulsions (at particle
concentrations of 0.3% w/v) can be attributed to the difference in the physical and chemical
properties of the two oils (tricaprylin and hexadecane). The difference in the densities of
both oils is an important factor. The density of tricaprylin (0.95 g/mL) is close to that of
water (0.99 g/mL) while hexadecane shows a lower density (0.77 g/mL) (31, 32).

p(NIPAM-co-5% AA-hexenol) Chapter Five
145
Figure 5.8 Emulsions of tricaprylin/water mixtures in the presence of different concentrations of p(NIPAMco-
5% AA)-hexenol (a) Different concentrations (w/v) of microgel dispersions before emulsification (b) Samples just after emulsification (c) Samples after 1 week of emulsification
A
C
B

p(NIPAM-co-5% AA-hexenol) Chapter Five
146
Figure 5.9 Emulsions of hexadecane/water mixtures in the presence of different concentrations of p(NIPAM-co-5% AA)-hexenol, samples after emulsification
Also, the molecular structures of the two oils may be an important factor. The molecular
structure of tricaprylin has three ester groups (six oxygen atoms) and a branched
hydrocarbon chain. This suggests an increase in the ability of the oil to protrude in the
aqueous phase. In the case of hexadecane, the molecular structure only consists of a
hydrocarbon chain which suggests less protrusion in the aqueous phase than tricaprylin.
The microscopy images of both tricaprylin-in-water and hexadecane-in-water emulsions
(Figures 5.10 and 5.11, respectively) show some differences between the two emulsions. At
the same particle concentration, the tricaprylin-in-water emulsion (Figure 5.10) has more
droplets than the hexadecane-in-water and of smaller size. This difference in behaviour is
attributed to the difference of the densities of the two oils in comparison to water.
0.1 % 0.2 % 0.3 % 0.4 % 0.45 %

p(NIPAM-co-5% AA-hexenol) Chapter Five
147
Figure 5.10 Optical (left) and fluorescent (right) microscopy images of tricaprylin/water emulsion in presence of 0.1, 0.2, 0.25 and 0.3% w/v of p(NIPAM -co-5% AA)-hexenol. All scale bars are 100 µm in size
0.1 %
0.2 %
0.25 %
0.3 %

p(NIPAM-co-5% AA-hexenol) Chapter Five
148
Figure 5.11 Optical (left) and fluorescent (right) microscopy images of hexadecane/water emulsion in
sizepresence of 0.2, 0.3, 0.4 and 0.45% w/v of p(NIPAM -co-5% AA)-hexenol. All scale bars are 100 µm in
5.3.3 Microgellosomes
The presence of a pendant vinyl group at the side chain of p(NIPAM-co-5% AA)-hexenol
particles made it possible to further crosslink the particles to form bigger structures referred
0.2 %
0.3 %
0.4 %
0.45 %

p(NIPAM-co-5% AA-hexenol) Chapter Five
149
to as microgellosomes. Figure 5.12 shows a representation of the suggested molecular
structure of microgellosomes. The size and morphology of the particles are important factors
that affect the stabilization of Pickering emulsions (33). Microgellosomes can be
synthesized in situ at the interface of oil and water and thus entrap the oil droplets inside its
hollow matrix and stabilize the emulsion. Since the building blocks of these microstructures
are p(NIPAM-co-5% AA)-hexenol particles, it is thought that the emulsions stabilized by
microgellosomes can be switched on/off by changing the environmental conditions such as
temperature and pH of the emulsion. These microstructures can be used in surfactant-free
formulations in cosmetics and personal care products. Other possible uses can include drug
delivery and industrial applications.
5.3.3.1 Characterization of microgellosomes
The SEM imaging of microgellosomes (Figure 5.13) shows that they are hollow structures,
15 – 20 µm in size. This compares with an original microgel size of 670 nm. The implication
therefore is that each microgellosome consists of 20 – 30 microgel particles. Also, there are
some smaller particles in the background, these can be smaller microgellosomes or some
unreacted singlet particles. The image in Figure 5.13 is consistent with what might be
expected from a “gel globule” formed as a result of an addition reaction between the pendant
vinyl groups as proposed in Figure 5.12.


p(NIPAM-co-5% AA-hexenol) Chapter Five
152
Figure 5.13 SEM image of microgellosomes formed by polymerizing p(NIPAM-co-5% AA)-hexenol
5.3.4 Characterization of emulsions stabilized by microgellosomes
The microgellosomes were used to stabilize a hexadecane-in-water emulsion. Figure 5.14
shows the formation of large droplets with average size of 20-30 µm. Both larger and smaller
species (microgellosomes and/or particles) shown in Figure 5.13 may well be making a
contribution towards the formation of emulsion droplets shown in Figure 5.14. It is not
suggested that one species is more important than the other.
Figure 5.14 Optical microscopy image of microgellosomes (0.1 w/v) stabilized emulsion
20 µ m

p(NIPAM-co-5% AA-hexenol) Chapter Five
153
5.4 Conclusions and future work
5.4.1 Conclusions
A novel particle p(NIPAM-co-5% AA)-hexenol was synthesized, characterized and tested
for its ability to stabilize emulsions (using two different oils). The new particles are spherical
in shape, negatively charged and show a larger size than p (NIPAM-co-5% AA).
Furthermore, they still show temperature/pH sensitivity and mono-dispersity. The IR
spectroscopy experiments suggest the chemical attachment of hexenol to the particles.
Oil-in-water emulsions (hexadecane or tricaprylin in water) could be stabilized by addition
of p(NIPAM-co-5% AA)-hexenol. The stability of the emulsions increased with increasing
the concentration of the microgel. The emulsions were stabilized by the formation of a layer
of microgel at the oil-water interface. The emulsions were poly-dispersed, though droplet
size of the dispersed phase was found to decrease with the increase in microgel concentration
and the number of droplets increased with the increase in the concentration of the microgel.
For the tricaprylin-in-water emulsion, a concentration of 0.3% w/v of the novel microgel
particles managed to stabilize the emulsion for a week. In case of the hexadecane emulsion
in water, 0.45% w/v microgel particles could show an increase in the emulsion stability and
a decrease in the creaming. Higher concentrations are thought to further improve the
emulsion stability.
The novel (p(NIPAM-co-5% AA)-hexenol) particles with a pendant vinyl group were also
further polymerized in the oil-water interface of emulsion droplets to synthesize a new
structure referred to as “microgellosomes”. The SEM images of washed polymerized
particles showed hollow capsules, which is typical for polymers produced for the interface
of emulsion droplets. Since the novel particles have a hairy structure and their size is
influenced by the temperature and pH change, we expect that the microgel capsules
produced will inherit these properties and have a semi-permeable membrane. These
enhanced properties would allow such particles to be used as pH and heat-responsive drug
carriers.
5.4.2 Future work
Further research is required to tune the ability of the novel microgel particles and
microgellosomes to turn the emulsifying properties on and off in response to environmental
triggers such as temperature and pH. More oils and concentrations can also be tried to
p(NIPAM-co-5% AA-hexenol) Chapter Five
154
optimize the amounts and concentrations needed to obtain a stable emulsion. These
concentrations are expected to vary according to the type and concentration of the oil used.
Also, further tests to investigate the potential applications of microgellosomes will be
conducted. These include testing the encapsulation, loading and release capabilities of them
(the microgellosomes). The ability of microgellosomes to deliver a loaded drug to a specific
site will also be tested. This can be applied to the release of drug molecules in specific sites
in the body.
5.5 References
1. Thorne J. B., Vine G. J., Snowden M. J. Microgel applications and commercial considerations. Colloid and Polymer Science. 2011;289:625-46. 2. International Union of Pure and Applied Chemistry. Compendium of Chemical Terminology - Gold Book. 2014. 3. Ngai T., Auweter H., Behrens S. H. Environmental Responsiveness of Microgel Particles and Particle-Stabilized Emulsions. Macromolecules. 2006;39:8171-7. 4. Attaa A. M., Dyab A. K., Allohedan H. A. A novel route to prepare highly surface active nanogel particles based on nonaqueous emulsion polymerization. Polymers for Advanced Technologies. 2013;24:986-96. 5. Li Z., Ngai T. Microgel particles at the fluid–fluid interfaces. Nanoscale. 2013;5:1399. 6. Zoppe J. O., Venditti R. A., Rojas O. J. Pickering emulsions stabilized by cellulose nanocrystals grafted with thermo-responsive polymer brushes. Journal of Colloid and Interface Science. 2012;369:202-9. 7. Tsuji S., Kawaguchi H. Thermosensitive Pickering Emulsion Stabilized by Poly(Nisopropylacrylamide)-Carrying Particles. Langmuir. 2008;24:3300-5. 8. Chevalier Y., Bolzinger A. M. Emulsions stabilized with solid nanoparticles: Pickering emulsions. Colloids and Surfaces A: Physicochemical and Engineering Aspects. 2013;439:23-34. 9. Destribats M., Lapeyre M., Sellier V., Leal-Calderon E., Schmitt F., Ravaine V. Water-in-Oil Emulsions Stabilized by Water-Dispersible Poly(N-isopropylacrylamide) Microgels: Understanding Anti-Finkle Behavior. Langmuir. 2011;27:14096-107.

p(NIPAM-co-5% AA-hexenol) Chapter Five
155
10. Destribats M., Wolfs M., Pinaud M., Lapeyre F., Sellier V., Schmitt E., Ravaine V. Pickering Emulsions Stabilized by Soft Microgels: Influence of the Emulsification Process on Particle Interfacial Organization and Emulsion Properties. Langmuir. 2013;29:1236774. 11. Destribats M., Lapeyre M., Wolfs V., Sellier M., Leal-Calderon E., Ravaine F., Schmitt V, Ravaine V. Soft microgels as Pickering emulsion stabilisers: role of particle deformability. Soft Matter. 2011;7:7689-98. 12. Mohsen R. Vine G. J., Majcen N., Alexander B. D., Snowden M. J. Characterization of thermo and pH responsive NIPAM based microgels and their membrane blocking potential. Colloids and Surfaces A: Physicochemical and Engineering Aspects. 2013;428:53-9. 13. Pelton R. Temperature-sensitive aqueous microgels. Advances in Colloid and Interface Science. 2000;85:1-33. 14. Vashist S. K. Comparison of 1-Ethyl-3-(3-Dimethylaminopropyl) Carbodiimide Based Strategies to Crosslink Antibodies on Amine-Functionalized Platforms for Immunodiagnostic Applications. Diagnostics. 2012;2:23-33. 15. Huang G. Synthesis and Study of Crystalline Hydrogels, Guided by a Phase Diagram. PhD thesis, University of North Texas; 2004. 16. Kammili V. R., Reddy G. M., Mukkanti K. Oxidation of alcohol to carboxylic acid under mild acidic condition and followed by synthesis of ester analogues of Corey’s lactone. Der Pharma Chemica. 2011;3:141-5. 17. Soto-Castro D., Cruz-Morales J. A., Apan M. T., Guadarrama P. Synthesis of NonCytotoxic Poly(Ester-Amine) Dendrimers as Potential Solubility Enhancers for Drugs: Methotrexate as a Case Study. Molecules. 2010;15:8082-97. 18. Otera J., Nishikido J. Esterification: Methods, Reactions, and Applications. John Wiley & Sons; 2009. 19. Rose J. B., Pacelli S., El Haj A. J., Dua H. S., Hopkinson A., White L. J., Rose F. R. Gelatin-Based Materials in Ocular Tissue Engineering. Materials. 2014;7:3106-35. 20. Wu W., Chen S., Hu Y., Zhou S. A Fluorescent Responsive Hybrid Nanogel for Closed-Loop Control of Glucose. Journal of Diabetes Science and Technology. 2012;6:892-901. 21. Su S., Ali M. M., Filipe C. D., Li Y., Pelton R. Microgel-Based Inks for PaperSupported Biosensing Applications. Biomacromolecules. 2008;8:935–41. 22. Chiu P. L. Microwave Enabled Dispersion of Highly Conductive Carbon Nanomaterials and Their Interfacial Assemblies. PhD thesis, the State University of New Jersey; 2013.

p(NIPAM-co-5% AA-hexenol) Chapter Five
156
23. Hu L., Serpe M. J. Poly(N-Isopropylacrylamide) Microgel-Based Etalons for Optical Sensing. J Anal Bioanal Techniques. 2012;3. 24. Peters J. T., Verghese S., Peppas N. A. Surface hydrolysis mediated PEGylation for the passivation of pNIPAM Nanogels. Society for Biomaterials; 2014. 25. Farooqi Z. H., Khan H. U., Shah S. M., Siddiq M. Stability of poly(Nisopropylacrylamide-co-acrylic acid) polymer microgels under various conditions of temperature, pH and salt concentration. Arabian Journal of Chemistry. 2013. 26. Chen H., Fang Y. Synthesis and characterization of temperature and pH responsive Poly(N-isopropylacrylamide) copolymer. China: MOE Key Laboratory of Food Colloids and Biotechnology, School of Chemical & Material Engineering, Jiangnan University. 27. Luo Q., Guan Y., Zhang Y., Siddiq M. Lead-Sensitive PNIPAM Microgels Modified with Crown Ether Groups. Journal of Polymer Science: Part A: Polymer Chemistry. 2010;48:4120–7. 28. Hu X., Hao X., Wu Y., Zhang J., Zhang X., Wang P. C., Zou G., Liang X. J. Multifunctional hybrid silica nanoparticles for controlled doxorubicin loading and release with thermal and pH dual response. J Mater Chem B. 2013;1:1109. 29. Hexen-1-ol. http://www.sigmaaldrich.com/spectra/ftir/FTIR003303.PDF. Accessed on 2nd of December, 2015. 30. Lambert J. B., Shurvell H. F., Lightner D., Cooks R. J. Introduction to organic spectroscopy. Verbit L., editor. New York/London: Macmillan Publishing Company/Collier Macmillan publishers; 1987. 31. Lide, D. R. Handbook of Chemistry and Physics, 83rd Edition. 2002, London/New York, CRC Press. 32. Haynes, W. M. Handbook of Chemistry and Physics, 91st Edition. 2010, London/New York, CRC Press.
33. Mathapa B. G., Paunov V. N. Cyclodextrin stabilised emulsions and cyclodextrinosomes. Physical Chemistry Chemical Physics. 2013; 15, 17903-14.

Conclusions and future work Chapter Six
157
Chapter Six Conclusions and Future work
6.1 Conclusions
Four novel NIPAM based particles have been designed, synthesized and characterized.
These are p(NIPAM)-co-5% VC, p(NIPAM)-co-5% AA-EDA-RhB, p(NIPAM)-co-5% LY
and p(NIPAM)-co-5% AA-hex. This work aims at designing and synthesizing particles that
have practical application in different fields that have been theoretically studied for years
such as drug delivery (1-5), biomedical applications (6-9) and responsive surfaces (10-12).
Different synthesis techniques have been undertaken in this work; for incorporating
comonomers with a pendant vinyl group (VC and LY), direct polymerization was used. For
incorporating hexenol using the alcoholic OH (to synthesize a particle with a pendant vinyl
group), a two-step procedure was used. Acrylic acid (AA) was directly incorporated in the
NIPAM based particle and then the COOH of AA was esterified with the OH of hexenol
using click chemistry. For incorporating RhB, a three-step procedure was used, where
p(NIPAM)-co-5% AA was synthesized, COOH of AA was coupled to one of the amino
groups of EDA and then the other amino group was coupled to the COOH of RhB using
click chemistry. Comparing the PdI of the four particles suggest that using a one-step direct
polymerization technique yields more uniform and mono-dispersed particles with PdI very
close to zero. Increasing the number of synthesis steps and elongating the hairy layer around
the particle yields less uniform and poly-dispersed particles with higher PdI values.
In the first results chapter, a novel fluorescent temperature-sensitive microgel particle
(p(NIPAM)-co-5% VC) with a VPTT of 32-35°C was synthesized and characterized using
DLS and fluorescence spectroscopy. At 15˚C (below the VPTT), the particle size is 290 nm
and deswells to 160 nm when the temperature exceeds the VPTT. The emission spectra of
the novel microgel dispersion excited at 300 nm show a similar emission wavelength to that
reported for VC (13). The emission (at 350 nm) of a known particle concentration (w/v)
excited at 300 nm increases by increasing the temperature above the VPTT. This shows that
both the size and fluorescence of the novel particle are temperature sensitive.
p(NIPAM)-co-5% VC was used to quantify the mass of microgel particles deposited on
different solid surfaces, these are stainless steel, glass pre-treated with base, glass pretreated

Conclusions and future work Chapter Six
158
with acid, quartz, gold, Teflon (the composition of the surfaces was determined using EDX).
The results show that at 25°C, the highest net mass of microgel particles (adsorbed minus
desorbed) was adsorbed on stainless steel, followed by glass pre-treated with base, glass pre-
treated with acid, quartz, gold then Teflon. At 45°C, the mass of adsorbed microgel particles
on all the previously mentioned surfaces increased. The order from the surface of highest
net adsorbed mass of microgel particles is: stainless steel, glass pre-treated with base, gold,
glass pre-treated with acid, quartz then Teflon.
The factors affecting the adsorption/desorption of cationic microgel particles on/from the
solid surfaces were studied. These include the effect of solid surface charge, surface
roughness (studied using AFM), temperature and hydrophilicity/hydrophobicity of the
surface. Results show that the effect of the solid (substrate) surface charge is the most
significant followed by that of surface roughness then temperature. On the other hand, the
effect of hydrophilicity/hydrophobicity of the surface showed to be the least significant of
the studied factors.
In the second results chapter, a fluorescent temperature/pH responsive particles (p(NIPAM)-
co-5%AA-EDA-RhB) was presented. The synthesis of this particle was carried out using a
three-step procedure. Step one was the synthesis of p(NIPAM)-co-5% AA. Step two was the
coupling of the COOH of AA to one of the amino groups of EDA. Step three was coupling
the second amino group of EDA to RhB using coupling chemistry. The particle is
zwitterionic due to the presence of both negative (due to initiator and AA) and positive (due
to EDA) charges on its surface. At 15°C, the particle size is 500 nm and deswells to 250 nm
when the temperature exceeds the VPTT. The particles are more stable in highly alkaline
pH media (pH 11.5). At lower pH values the particles tend to aggregate. This can be
attributed to the presence of opposite charges due to unreacted moieties of AA and EDA.
Changing the pH of the media changes the protonation state of these moieties which affects
their reactivity and hence particle stability. The particles are negatively charged with an
initial electrophoretic mobility of -2 µmcm/Vs at 15°C. The microscopy images show that
the particles are spherical in shape. It is also apparent from the pictures that there are bridges
between the particles. This can be attributed to the long hairy structures on the surface of the
particles due to the conjugation of two molecules (EDA and RhB). The suggested
applications of the novel particles include the stabilization of emulsions and drug delivery.

Conclusions and future work Chapter Six
159
In the third results chapter, p(NIPAM)-co-5% LY particle was synthesized, characterized
and its toxicity on HeLa and Vero cells was studied in vitro. The fluorescent probe LY was
chosen to be incorporated in p(NIPAM) particles due to the presence of a pendant vinyl
group in its molecular structure which makes it easy to polymerize. Negatively charged
fluorescent temperature/pH sensitive particles were produced. At 15°C and pH 7, the size of
the particle was 250 nm particle size is smaller than p(NIPAM) due to incorporating a
hydrophobic co-monomer), increasing the temperature to above the VPTT, the particle
deswells to 100 nm. The electrophoretic mobility of the particles at 15°C is -0.3 µmcm/Vs
and increases to -3.7 µmcm/Vs when the temperature exceeds the VPTT. The fluorescence
spectroscopy data of the novel particles suggest the successful incorporation of LY. The
fluorescence emission spectra of the new particles compares to that of LY (with a slight blue
shift of the emission peak due to the change of the environment surrounding the fluorescent
probe LY). The data also show that the fluorescence of the particles is affected by the change
in temperature and pH. This can be due to the change in particle size and/or the change in
LY properties with the environmental change. The microscopy studies show that the
particles are fluorescent, spherical, mono-dispersed and their average size is 120 nm which
is comparable to that shown by DLS at deswollen state.
A fluorescent temperature/pH sensitive system such as the one presented in this work
(p(NIPAM)-co-5% LY) can be very useful in various biological applications such as
diagnosis and drug delivery or both combined together. The use of these particles in
biological applications have been frequently challenged because of their suggested toxicity
problems especially that they include acrylamide. Also very few data have been reported in
literature about this topic. Accordingly, the study hereby provides some data that aim to
assess the toxicity of NIPAM based particles in vitro.
The toxicity of different concentrations of the novel particles (p(NIPAM)-co-5% LY, as well
as the 100% p(NIPAM) and the main monomer NIPAM was tested on two cell lines (HeLa
and Vero). The toxicity was tested in comparison to a positive control (dextran) and a
negative one (poly(ethylenimine)) (PEI). The results show that the two particles show cell
viability over 80% (for both cell lines HeLa and Vero) up to a concentration of 3 mg/mL
while NIPAM monomer showed cell viability over 80% at a concentration equal to or less
than 0.3 mg/mL. The comparison between the results of this study as well as some reported

Conclusions and future work Chapter Six
160
data from the literature with some existing drugs in the market, suggests the need for further
work to establish the viability of utilizing particles of this type for pharmaceutical
applications.
The fourth chapter is about p(NIPAM)-co-5% AA-hex particle with a pendant vinyl group
that enables further crosslinking of the particles to produce bigger structures referred to as
“microgellosomes”. Both the particles and the microgellosomes (including hydrophilic and
hydrophobic moieties) were used to stabilize oil-in-water emulsions. To polymerize hexenol
and keep its vinyl group free (unreacted), a new synthesis method was carried out. This was
the synthesis of p(NIPAM)-co-5% AA using surfactant free emulsion polymerization and
then esterifying the COOH of AA to the alcoholic OH of hexenol.
The novel particle (p(NIPAM)-co-5% AA-hex) is negatively charged and is responsive to
both temperature and pH having an initial particle size (at 15°C) of 680 nm. Increasing the
temperature to above the VPTT, the particle deswells to 280 nm. At 15°C, the
electrophoretic mobility of the particles is -1.7 µmcm/Vs while above the VPTT it increases
to reach -3.3 µmcm/Vs. The microscopy images show that the particles are spherical and
mono-dispersed.
The new particles with a hydrophilic co-monomer (AA) as well as a hydrophobic one
(hexenol) were used to stabilize emulsions. Oil-in-water emulsions using two different oils
(tricaprylin and hexadecane) and different concentrations of the new particles were prepared.
At lower concentrations of the particles (0.1% w/v), two different phases were observed.
Increasing the particle concentration (to about 0.3% w/v for tricaprylin and
0.45% w/v for hexadecane) showed a significant increase in the emulsion stability (persistent
for a week) suggesting that the particles were successfully adsorbed at the oil/water
interface.
6.2 Future work
Research in the field of environmentally responsive colloidal polymeric particles is growing.
This is because of the possibility of using these particles in different fields such as medical,
pharmaceutical, industrial and environmental applications. Also, there are various factors
that affect the synthesis, properties and applications of the particles. There are more than

Conclusions and future work Chapter Six
161
one suggested area of research for future work to further understand the properties and
possible applications of different colloidal particles such as the NIPAM based ones. These
include:
- New fluorescent environmentally responsive NIPAM based particles may be
designed by incorporating different kinds and concentrations of co-monomers. These
can be temperature sensitive or other triggers such as pH and photosensitivity can
also be added (synthesizing particles with more than one comonomer). Different
fluorescent probes with different excitation and emission wavelengths as well as
fluorescence intensities will also be tried as co-monomers, examples of suggested
fluorescent probes can include fluorescein isothiocyanate. The use of the new
particles in diagnostics, drug delivery as well as industrial applications will be
studied.
- The deposition of new NIPAM based particles on different solid surfaces such as
glass, gold, stainless steel and Teflon in response to different stimuli may be carried
out. Surfaces responsive to different environmental triggers such as pH and light will
be produced and studied. Such surfaces can have a lot of applications in the industrial
field as well as diagnostics and biotechnology (control of protein and cell adhesion
and bio-separation).
- The improvement of the pH sensitivity of p(NIPAM)-co-5% LY particles (chapter
three), particles with more than one co-monomer (p(NIPAM) co-polymerized with
both lucifer yellow and acrylic acid or other ionisable co-monomers) can be
designed. This aims at improving the ability of the particles to differentiate between
acidic and alkaline media and accordingly differentiate between the cancer cells
(which normally have low pH) and the the normal cells.
- To support the suggestion of using NIPAM based particles in drug delivery and other
biomedical applications, further toxicity studies should be carried out. This could
include more in vitro testing than the ones presented in chapter three (p(NIPAM)-
co-5% LY) and in vivo animal testing. Toxicity studies including other NIPAM
Conclusions and future work Chapter Six
162
based particles such as p(NIPAM), p(NIPAM)-co-vinyl cinnamate and p(NIPAM)-
co-acrylic acid might also be conducted.
- The uptake and release profiles of different drugs from NIPAM based particles will
be studied. Drugs with different hydrophilicities/hydrophobicities will be tried. This
will include the quantification (stoichiometric studies) of the weights of drugs
absorbed and/or released by a specific weight of particles.
- The effect of time on the stability of NIPAM based particles should be studied. This
includes the identification and quantification of degradation products of these
particles.
- Study the possibility of attaching different co-monomers to NIPAM particles using
different techniques such as coupling chemistry. This may make it more likely to
increase the use of a wider range of co-monomers which can lead to the synthesis of
particles responsive to different triggers. Accordingly, more applications to
environmentally responsive microgel particles such as NIPAM based ones may then
emerge.
6.3 References
1. Pinkrah V. T., Beezer A. E., Chowdhry B. Z., Gracia L. H., Cornelius V. J., Mitchell J. C., Castro-Lopez V., Snowden M. J. Swelling of cationic polyelectrolyte colloidal microgels: Thermodynamic considerations. Colloids and Surfaces A- Physicochemical and Engineering Aspects. 2005;262:76-80. 2. Ramkissoon-Ganorkar C., Liu F., Baudys M., Kim S. W. Modulating insulinrelease profile from pH thermosensitive polymeric beads through polymer molecular weight. Journal of Controlled Release. 1999;59:287-98.

Conclusions and future work Chapter Six
163
3. Castro Lopez V., Hadgraft J., Snowden M. J. The use of colloidal microgels as a (trans)dermal drug delivery system. International Journal of Pharmaceutics. 2005;292:137–47. 4. Wu W., Chen S., Hu Y., Zhou S. A Fluorescent Responsive Hybrid Nanogel for Closed-Loop Control of Glucose. Journal of Diabetes Science and Technology. 2012;6:892-901. 5. Ravaine V., Ancla C., Catargi B. Chemically controlled closed-loop insulin delivery. Journal of Controlled Release. 2008;132:2-11. 6. Yasui M., Shiroya T., Fujimoto K., Kawaguchi H. Activity of enzymes immobilized on microspheres with thermosensitive hairs. Colloids and Surfaces B-Biointerfaces. 1997;8:311-9. 7. Kondo A., Oku S., Higashitani K. Adsorption of gamma-globulin, a model protien for antibody on colloidal particles. Biotechnology and Bioengineering. 1991;37:537-43. 8. Kitano H., Nakamura K., Hirai Y., Kaku T., Ise N. Restricted diffusion effect on the binding of protiens to porous polymer resins as studied by repetitive injection method. Biotechnology and Bioengineering. 1988;31:547-52. 9. Pelton R. Temperature-sensitive aqueous microgels. Advances in Colloid and Interface Science. 2000;85:1-33. 10. Alarcon C. D., Farhan T., Osborne V. L., Huckb W. T., Alexander C. Bioadhesion at micro-patterned stimuli-responsive polymer brushes. Journal of Materials Chemistry. 2005:15:2089–94. 11. Burkert S., Bittrich E., Kuntzsch M., Muller M., Eichhorn K. J., Bellmann C., Uhlmann P., Stamm M. Protein Resistance of PNIPAAm Brushes: Application to Switchable Protein Adsorption. Langmuir. 2010:26:1786–95. 12. Qin L., He X. W., Zhang W., Li W. Y., Zhang Y. K. Macroporous thermosensitive imprinted hydrogel for recognition of protein by metal coordinate interaction. Anal Chem. 2009:81:7206–16. 13. Torres J. M. Designing dual thermoresponsive & photoresponsive materials for biomedical applications: MSc. thesis. McMaster University: 2011.