![Submission Title: Date Submitted: [Tom Matsumura, VLCC] · January 2008 Slide 3 Shinichiro Haruyama,VLCC doc.: IEEE 802.15- Submission Visible Light Communications](https://static.fdocuments.net/doc/165x107/5f3902208ee97e7a6578a297/submission-title-date-submitted-tom-matsumura-vlcc-january-2008-slide-3-shinichiro.jpg)
by Andrea Marongiu - Spiral: Home · Andrea Marongiu A thesis submitted ... VLCC Very Large Crude...
202
Imperial College London National Heart and Lung Institute Department of Respiratory Epidemiology, Occupational Medicine and Public Health MRC-PHE Centre for Environment and Health Arc welding and the risk of airways and cardiovascular diseases: WELSHIP study by Andrea Marongiu A thesis submitted for the degree of Doctor of Philosophy
Transcript of by Andrea Marongiu - Spiral: Home · Andrea Marongiu A thesis submitted ... VLCC Very Large Crude...

Imperial College London
National Heart and Lung Institute
Department of Respiratory Epidemiology, Occupational Medicine and
Public Health
MRC-PHE Centre for Environment and Health
Arc welding and the risk of airways and cardiovascular
diseases: WELSHIP study
by
Andrea Marongiu
A thesis submitted for the degree of Doctor of Philosophy

Dedication
In memory of my father Vittorio
‘No sentía cà moria càntu impàru ancora bollia’

Declaration
I herewith certify that this dissertation is my original work and that all material included that is not
my own work has been properly acknowledged.
Copyright declaration
The copyright of this thesis rests with the author and is made available under a Creative Commons
Attribution Non-Commercial No Derivatives licence. Researchers are free to copy, distribute or
transmit the thesis on the condition that they attribute it, that they do not use it for commercial
purposes and that they do not alter, transform or build upon it. For any reuse or redistribution,
researchers must make clear to others the licence terms of this work.

iv
Abstract
Globally there are around 10 million workers who routinely weld and are exposed to a metal fume
aerosol of small particles of largely metal oxides and gases. Their medium- and long-term
cardiorespiratory risks are incompletely understood.
This thesis describes a programme of novel research carried out in a large Middle Eastern
shipyard. Four studies were completed. First, a systematic review of published cross-sectional
surveys (N: 38) in welders were identified; a meta-analyses of 34 publications showed a clear
excess of asthma (OR 1.65; 95% CI 1.14, 2.37) and chronic bronchitis (OR 1.92; 1.50, 2.45) that
could not be explained by smoking. In contrast, there was remarkably, little summary evidence of
deficits in lung function in welders.
Second, a cross-sectional survey of shipyard workers (N: 529, response rate 93%) showed no
evidence of any decrements in lung or cardiac function in welders but suggested that symptoms of
respiratory infections in winter were more common in this group (OR 2.65; 1.22, 5.78) than in
matched referent workers. Support for this novel finding came from the third study, of clinical
records held by the yard’s medical centre over an eleven-year period (N: 15,954). Consultations
for respiratory infections were 72% higher in welders compared to office workers; there was a
clear exposure-response relationship across workers with different intensities of welding. The
fourth study, of a panel of 50 shipyard workers (response rate 100%) suggested a small cross-shift
decline in lung function and increase in arterial stiffness.
These findings suggest, for the first time, that welders are susceptible to a wide range of
respiratory infections. High quality, collaborative research in this setting is feasible; future studies
could usefully examine in more detail – including microbiological - the relationship between
welding fume exposure and respiratory infections. The potential health-benefits to the global
community of welders are substantial.

v
Acknowledgements
I would like to thank my supervisors Prof Paul Cullinan, Dr Cosetta Minelli, Dr Jo Zram and Dr
Cristina Canova, their encouragement, patience and willingness to share their experience has been
invaluable for the completion of this very ambitious project. I am particularly indebted to Prof Paul
Cullinan for the opportunity.
Without the enthusiasm, commitment, hard work and professionalism demonstrated by the
WELSHIP team in Dubai this research would have not been a success. I am grateful to Dr Omer
Imtiaz Hasan, Ms Anila Ali, Mr Sharoon Bakhsh, Mr Bobby George and Mr Nabeel Irfan for being
outstanding colleagues and remarkable friends.
I would like to thank Magda Wheatley for her time in helping with the arrangement of payments
to the study participants and to Stephanie MacNeill for her support and never-ending
encouragement. Many thanks go to Susie Schofield for her statistical advice and help with the
systematic literature review duplicate extraction of data.
For their time and willingness to share their knowledge, I wish to thank a panel of experts: Dr
David Green and Dr Ben Barratt for the collection of environmental exposure data and Dr Andre
Amaral for the collection of bio-samples. I am particularly grateful to Dr Martin Cosgrove for
sharing his experience and enthusiasm on welding and for his advice during the writing up stage.
I am grateful to the MRC-PHE Centre for Environment and Health for awarding me a studentship
and to DryDocks World Dubai for their partnership and commitment while conducting the
WELSHIP study.
Finally I would like to express how deeply indebted I am to my family and friends, Marian for
always being there, Bianca and Shanae for giving me shelter while in Dubai and for being good
listeners and Louise for proofreading the final draft. Above all, I am thankful to my mother Lalla,
Piero, Jason and Tess whose constant, unconditional love and support got me through tough
times.

vi
Abbreviations
ACGIH American Conference Of Governmental Hygienists AIx Augmentation Index Al Aluminium aPWV Aortic Pulse Wave Velocity ATS American Thoracic Society bBP Brachial Blood Pressure bDBP Brachial Diastolic Blood Pressure bMAP Brachial Mean Arterial Pressure BP Blood Pressure bSBP Brachial Systolic Blood Pressure cBP Central (Aortic) Blood Pressure cDBP Central (Aortic) Brachial Diastolic Blood Pressure COPD Chronic Obstructive Pulmonary Disease cSBP Central Systolic Blood Pressure DDW-D DryDocks World-Dubai DIP Desquamative Interstitial Pneumonia FCAW Flux-Core Arc Welding FEF25-75% Forced Expiratory Flow At 25–75% Of Forced Vital Capacity FEV1 Forced Expiratory Volume In 1 Second FFR Fume Formation Rate FP Fractional Polynomials FVC Forced Vital Capacity GMAW Gas Metal Arc Welding - MIG/MAG GTAW Gas Tungsten Arc Welding - See TIG HRV Heart Rate Variability IHD Ischaemic Heart Disease IPD Invasive Pneumococcal Disease IRR Incidence Rate Ratio LEV Local Exhaust Ventilation LRT Lower Respiratory Tract LRTI Lower Respiratory Tract Infection MFF Metal Fume Fever MI Myocardial Infarction MIG/MAG Metal Inert Gas/Metal Active Gas - See GMAW μm Micrometre MMA Manual Metal Arc Welding - See SMAW Or Stick MS Mild Steel OH Occupational Health OR Odds Ratio P P-Value PEFR Peak Expiratory Flow Rate PM Particulate Matter PPE Personal Protective Equipment PWA Pulse Wave Analysis PWV Pulse Wave Velocity SBP Systolic Blood Pressure

vii
SD Standard Deviation SDNN Standard Deviation Of Normal-To-Normal Intervals Between Heartbeats SE Standard Error SMAW Shielded Metal Arc Welding - See MMA or Stick SS Stainless Steel Stick welding Welding With Flux Coated Consumable Electrode - See SMAW or MMA TIG Tungsten Inert Gas Welding - See GTAW TLV® Threshold Limit Values Set By ACGIH UAE United Arab Emirates UFP Ultrafine Particles (<0.1 μm) ULCC Ultra Large Crude Carrier URT Upper Respiratory Tract URTI Upper Respiratory Tract Infection VLCC Very Large Crude Carrier WHR Waist-To-Hip Ratio
8
Contents
DEDICATION II
DECLARATION III
COPYRIGHT DECLARATION III
ABSTRACT IV
ACKNOWLEDGEMENTS V
ABBREVIATIONS VI
CHAPTER 1: BACKGROUND 14
1.1 ARC WELDING 14
1.1.1 Metal dust, fine particles and welding fume 15 1.1.2 Health and arc welding: an overview 16 1.2 RESEARCH HYPOTHESIS 17
1.3 AIMS AND OBJECTIVES 17
1.4 DATA SOURCES AND FIELDWORK 17
1.5 THESIS PLAN 21
1.6 RESEARCH IN A ‘REAL WORLD’ SETTING 21
CHAPTER 2: SYSTEMATIC LITERATURE REVIEW AND META-ANALYSIS ON LUNG FUNCTION AND OBSTRUCTIVE PULMONARY DISEASE IN ARC WELDERS 23
2.1 METHODS 23
2.1.1 Search strategy 23 2.1.2 Inclusion and exclusion criteria 24 2.1.3 Outcome measures 24 2.1.4 Data extraction 25 2.1.5 Statistical analyses 25 2.2 RESULTS 36
2.2.1 Characteristics of the studies included in the review 36 2.2.2 Meta-analysis results for lung function 38 2.2.3 Meta-analysis results for respiratory symptoms 41 2.2.4 Publication and small studies bias: asymmetry analysis 45 2.3 DISCUSSION 48
2.3.1 Lung function 48 2.3.2 Asthma and respiratory symptoms 49 2.3.3 Respiratory health of shipyard welders 50 2.3.4 Limitations 50 2.3.5 Strengths 51 2.4 CONCLUSION 52
CHAPTER 3: CROSS-SECTIONAL SURVEY 54
3.1 RESEARCH AIM AND OBJECTIVES 54
3.2 METHODS 54

9
3.2.1 Fieldworkers’ training and survey pilot 54 3.2.2 Sample selection and sample size 55 3.2.3 Survey process, data collection and storage 58 3.2.4 Data analysis 63 3.3 RESULTS 66
3.3.1 Sample characteristics 66 3.3.2 Cardiorespiratory health 70 3.3.3 Secondary analyses results 74 3.4 DISCUSSION 77
3.5 LIMITATIONS 83
3.6 CONCLUSION AND FUTURE RESEARCH 84
CHAPTER 4: RESPIRATORY INFECTIONS AND WELDING FUME EXPOSURE - AN EXAMINATION OF A WORKPLACE DATABASE. 86
4.1 RESEARCH AIM AND OBJECTIVES 86
4.2 METHODOLOGY 86
4.2.1 Target population, employment and medical data 86 4.2.2 Employment records data handling 87 4.2.3 Medical records data handling 89 4.2.4 Recoding of diagnosis for the 2000-2005 period 90 4.2.5 Diagnostic code assignment database 92 4.2.6 Data analyses 94 4.3 RESULTS 96
4.3.1 Primary analysis results 97 4.3.2 Secondary analysis results 99 4.4 DISCUSSION AND CONCLUSIONS 100
4.5 LIMITATIONS 101
4.6 CONCLUSIONS 101
CHAPTER 5: PANEL (PILOT) STUDY 103
5.1 RESEARCH AIMS AND OBJECTIVES 103
5.2 METHODS 103
5.2.1 Sample selection and target population 103 5.2.2 Survey timeline and fieldworkers’ training 104 5.2.3 Study process, data collection and storage 105 5.2.4 Statistical analysis 111 5.3 RESULTS 113
5.3.1 Sample characteristics 113 5.3.2 Cardiorespiratory health analyses 115 5.3.3 Overview of remaining collected outcomes 119 5.4 DISCUSSION 120
5.5 LIMITATIONS 123
5.6 CONCLUSION 124
CHAPTER 6: CONCLUSIONS 126
REFERENCES 128
10
APPENDICES 138
A.2.1 SEARCH STRATEGY 138
A.2.2 ESTIMATES EXTRACTION FORMS 141
A.2.3 ADDITIONAL FOREST PLOTS FOR LUNG FUNCTION MEASURES AND RESPIRATORY SYMPTOMS 143
A.2.4 ADDITIONAL FUNNEL PLOTS FOR LUNG FUNCTION MEASURES AND RESPIRATORY SYMPTOMS WITH PSEUDO 95%
CONFIDENCE LIMITS AND ASYMMETRY TESTING 161
A.3.1 CROSS-SECTIONAL SURVEY DOCUMENTS AND QUESTIONNAIRE 167
A.3.2 CROSS-SECTIONAL SURVEY FREQUENCY MATCHING 174
A.3.3 CROSS-SECTIONAL SURVEY DIAGRAM 175
A.3.4 SENSITIVITY ANALYSIS ADDITIONAL TABLES 176
A.4.1 COMPLETE LIST OF ALL DIAGNOSIS AND DIAGNOSTIC CODES 178
A.4.2 EXAMPLE OF RECODED DIAGNOSIS FOR THE SECOND INDEX LIST: 2000-2004 MEDICAL RECORDS 186
A.5.1 PANEL STUDY DOCUMENTS AND QUESTIONNAIRE 187
A.5.2 PANEL STUDY SAMPLING FRAME 194
A.5.3 PANEL STUDY DIAGRAM 196
A.5.4 SOP FOR HANDLING BLOOD SAMPLES 197
A.5.5 SUMMARY TABLE OF RESPIRATORY PANEL STUDIES 199
Tables
Chapter 1
Table 1.1: Particulate fraction, particulate matter (PM) size range and respiratory tract ............................................... 15
Chapter 2
Table 2.1 Summary table of all cross-sectional studies ordered by industry included in the systematic review .............. 29
Table 2.2 Outcomes’ summary table of all cross-sectional studies included in the meta-analysis ordered by industry .. 35
Chapter 3
Table 3.1 Exposure groups and job titles .......................................................................................................................... 57
Table 3.2 Outcomes and covariates considered as a priori confounders .......................................................................... 65
Table 3.3 Sample characteristics by exposure groups ...................................................................................................... 66
Table 3.4 Cardiorespiratory health by exposure groups ................................................................................................... 68
Table 3.5 Respiratory symptoms by exposure stratified by season .................................................................................. 70
Table 3.6 Multiple logistic and linear regression of binary and continuous cardiorespiratory outcomes (welders vs. non-
welder) .............................................................................................................................................................................. 71

11
Table 3.7 Multiple logistic and linear regression of binary and continuous cardiorespiratory outcomes by smoking
status (welders vs. non-welder) ........................................................................................................................................ 72
Table 3.8 Cardiorespiratory health in welders by years of welding exposure................................................................... 75
Table 3.9 Multiple logistic and linear regression of binary and continuous cardio-respiratory outcomes by years of
welding experience in welders. ......................................................................................................................................... 76
Chapter 4
Table 4.1 List of employment variables: 1979 to 2011 ..................................................................................................... 88
Table 4.2 List of occupations by occupation groups ......................................................................................................... 88
Table 4.3 List of health variables*: 2000 to 2011 ............................................................................................................. 89
Table 4.4 List of selected outcomes for analysis ............................................................................................................... 91
Table 4.5 List of queries used for assigning diagnostic code to the 2000-2005 data ....................................................... 92
Table 4.6 Acute conditions grouped by aetiology ............................................................................................................. 93
Table 4.7 Multivariable negative binomial regression of respiratory infection by occupation groups ............................. 97
Table 4.8 Multivariable negative binomial regression of respiratory infection by detailed exposure groupings ............. 98
Table 4.9 Multivariable negative binomial regression of respiratory infection by occupation groups and season .......... 99
Table 4.10 Multivariable negative binomial regression of respiratory infection by occupation groups and stratified by
season ............................................................................................................................................................................... 99
Chapter 5
Table 5.1 Summary of the tests performed on the appointment day ............................................................................. 106
Table 5.2 Welding consumables used frequently in the shipyard and typical chemical composition requirements set by
the American Welding Society ........................................................................................................................................ 107
Table 5.3 Sample characteristics by exposure groups .................................................................................................... 114
Table 5.4 Respiratory symptoms prevalence and Odds Ratios: welders vs. non-welders ............................................... 115
Table 5.5 Lung function and cardiovascular outcomes post-shift percentage change from pre-shift baseline
measurements by exposure groups ................................................................................................................................ 116
Table 5.6 Cross-shift percent changes of lung function outcomes adjusted by age and height for exposure groups
(welders vs. non-welders) and log-transformed (ln) PM2.5 concentration mg/m3 .......................................................... 116
Table 5.7 Cross-shift percent changes of lung function outcomes adjusted by age and waist-to-hip ratio (WHR), heart
rate (AIx only) for exposure groups (welders vs. non-welders) and log-transformed (ln) PM2.5 concentration mg/m3.. 119
Table 5.8 Number of HRV recording, DBS, blood and urine samples collected for each participant .............................. 120
Figures
Chapter 2
Figure 2.1 Algorithm for the identification of studies to be included in the systematic review ........................................ 25
Figure 2.2 Flow diagram of exclusion/inclusion of studies in the systematic review ........................................................ 28
Figure 2.3 Number of cross-sectional studies by year (decades) of publication ............................................................... 37
Figure 2.4 Comparison of FEV1 in welders and non-welders ............................................................................................. 39
Figure 2.5 Comparison of FVC in welders and non-welders .............................................................................................. 40
12
Figure 2.6 Comparison of FEV1/FVC Ratio in welders and non-welders............................................................................ 41
Figure 2.7 Comparison of asthma prevalence in welders and non-welders ..................................................................... 42
Figure 2.8 Comparison of chronic bronchitis prevalence in welders and non-welders ..................................................... 43
Figure 2.9 Comparison of shortness of breath prevalence in welders and non-welders .................................................. 44
Figure 2.10 Comparison of wheezing prevalence in welders and non-welders ................................................................ 45
Figure 2.11 Funnel plots for spirometry measures with pseudo 95% confidence limits and Egger’s asymmetry test ...... 47
Figure 2.12 Funnel plots for respiratory symptoms with pseudo 95% confidence limits and Peters’ asymmetry test ..... 47
Chapter 3
Figure 3.1 Cross-sectional survey timeline ........................................................................................................................ 55
Figure 3.2 Diagram for the cross-sectional survey sample selection ................................................................................ 56
Figure 3.3 Lower respiratory tract symptoms by month of attendance ........................................................................... 69
Chapter 4
Figure 4.1. Study cohort .................................................................................................................................................... 87
Figure 4.2 Study cohort for respiratory infections analysis ............................................................................................... 94
Figure 4.3 Number of infections by month ....................................................................................................................... 97
Chapter 5
Figure 5.1 Panel study timeline ....................................................................................................................................... 105
Figure 5.2 Scatter plots for FEV1 and FVC by age showing beta-coefficient for slope and 95% CI .................................. 118
Pictures
Chapter 1
Picture 1.1 Arabian peninsula and DryDocks World-Dubai. ............................................................................................. 19
Picture 1.2 Satelite view of DryDocks World-Dubai with medical centre highlighted. ..................................................... 19
Pictures 1.3 DryDocks World Dubai and WELSHIP team ................................................................................................... 20
Chapter 3
Pictures 3.1 Cross-sectional data collection ...................................................................................................................... 60
Pictures 3.2 Welders’ PPE ................................................................................................................................................. 60
Chapter 5
Pictures 5.1 Urine and blood sampling materials, blood and DBS collection .................................................................. 109
Pictures 5.2 ECG Holter monitor ..................................................................................................................................... 110
Pictures 5.3 Air-sampling materials ................................................................................................................................ 110

13
14
CHAPTER 1: Background
1.1 Arc welding
Electric arc-welding is a metalworking process that encompasses a variety of techniques aimed at
coalescing metals at high temperatures.1 Of the over 80 different welding processes some of the
most widely used are: Manual Metal Arc welding (MMA or SMAW or ‘stick’ welding), Metal
Inert/Active Gas welding (MIG/MAG or GMAW), Tungsten Inert Gas arc welding (TIG or GTAW),
Flux-Cored Arc Welding (FCAW).2 Arc-welding is a hazardous technique that presents unique
challenges and potential adverse health effects due to exposures to toxic gases, dusts, infrared
and ultraviolet irradiation and high temperatures.1 A by-product of the welding process is the
welding aerosol called metal fume, the chief constituents of which are small particles, primarily of
ultrafine diameter (UFP) - largely of metal oxides - and gases. The composition of the fume
depends on the metals that are being welded (base material) and the materials used to weld such
as the electrode coating, fluxing agents and shielding gases.3
Although we do not have exact figures of how many full time welders there are worldwide,
extrapolations from US estimates suggest that they amount to several millions.3 In Europe alone it
has been estimated that there are over 700,000 welders or 1,573 welders per 1.0 million
inhabitantsa.4 Assuming that the welder/population ratio and population structure around the
world are similar to those in Europe, if in 2010 the world population was estimated to be around
6.9 billion5, then the global number of welders would be roughly 10.9 million. Official estimates of
the numbers of arc welders are very few and in any case are inconsistent and approximate for
various reasons:
o trade unions estimates will only be indicative of the numbers of their members; 6, 7 further
these will be limited to economies where there are trade unions;
o often the term ‘welder’ is used generally, to define any type of occupation where any
welding techniques and allied processes are undertaken. In such cases the distinction
between an arc welder or an oxy-acetylene welder, for example, cannot be made; 8
o workers who use welding as part of their daily job but not as a main skill are seldom defined
as ‘welders’;
a It is not clear whether this estimate includes both men and women and estimates the entire population or only the
economically productive part of the European population (people aged 15-65).

15
o increasingly, manufacturing and industries where arc welding is commonly employed, such
as ship building, are shifting to low income and emerging economies9 where comprehensive
records might not be readily available.
Indeed, it is likely that in response to a shift in economic global patterns and the rise in
manufacturing demands outside high-income countries, the numbers of welders are likely to
increase particularly in countries where cheaper labour is available. This highlights the importance
of emerging economies as a pivotal setting for carrying out research in occupational medicine.
Collaboration between emerging economies and high-income countries has proven effective in
developing occupational health and safety standards and a range of sustainability infrastructures
to maintain these standards.10
1.1.1 Metal dust, fine particles and welding fume
As mentioned above, welding fume aerosol is a suspension of gases and fine dust of metals and
fluxes from the base metal and consumables used during arc welding. The definition of dust takes
into consideration the aerodynamic diameter of the small solid particles that, depending on their
size and shape, can penetrate different regions of the respiratory tract.11 In a welding fume, the
metal oxide nanoparticulate vapour from the consumables and weld pool condenses leading to
aggregation of particles into compounds.12 The difference in size of these nanoparticle
agglomerates, ranging from 0.005 to 20 μm,13 determines their deposition along the respiratory
tract with largest particles depositing between the entry points (mouth and nose) and the larynx
and the smallest particles penetrating as far as the alveolar region.11
For airborne dust sampling purposes, three groups of particulate fraction have been identified to
reflect particles’ aerodynamic diameter and the region of the respiratory tract on which they are
likely to deposit.11 Table 1.1 illustrates for each group of particulate fraction the corresponding PM
size range and the part of the respiratory involved in its deposition.
Table 1.1: Particulate fraction, particulate matter (PM) size range and respiratory tract
Particulate fraction PM size range Respiratory tract involved
Inhalable (coarse) 2.5 to 10 μm Upper respiratory tract
Thoracic (fine) 0.1 to 2.5 μm Lower respiratory tract
Respirable (ultrafine) <0.1 μm Distal respiratory tract

16
MMA welding generates more fume than MIG/MAG welding1 and FCAW the highest level UPF
mass concentration.14 Fume generated in enclosed spaces accumulates unless local exhaust
ventilation is used to remove it; or an air-fed helmet is used to supply the welder with clean fume-
free air. While most of the fume produced by mild- or carbon-steel welding is iron (80–95%) and
manganese (1–15%), other metals and inorganic compounds may also be present2 as may organic
and elemental carbon.15 The gases produced during welding – CO, O3, NOx – may locally reach
very high concentrations but in this context have seldom been studied as hazardous to health. The
particles in welding fume are predominantly in the UFP size range 16-21 with a close correlation
between ultrafine and total particle concentrations. Turbulence from heat generation at the arc
encourages aggregation and the formation of longer chains of primary particles but it is not known
whether when inhaled these dissociate into primary ultrafine particles upon interaction with
pulmonary cells and lung lining fluid.22
1.1.2 Health and arc welding: an overview
A proportion of the epidemiological research on welders’ health has focused on a range of
pulmonary and cardiovascular adverse outcomes.2, 3, 23, 24 The majority of studies examining
abnormal lung function and associated disorders have been cross-sectional surveys.23
Breathlessness and sputum production appear to be the most commonly reported complaints
among welders.2 Although occupational exposures to dusty and gaseous substances have long
been suggested as established risk factors for obstructive airway diseases,25-27 studies
endeavouring to ascertain an association between declining lung function and welding fume
exposures have been, when taken as whole, incoherent and conflicting even when accounting for
cigarette smoking as a confounding factor.23
Similarly, the relationship between exposure to welding fumes and cardiovascular diseases is
unclear. Previous studies that examined acute effects such as heart rate variability (HRV), markers
of inflammation, coagulation and vascular function, have failed to elucidate the significance of
these intermediate pre-clinical outcomes in the induction of ischaemic heart disease.24 In contrast,
several cohort studies, using national or occupational comparators, have shown increased risks of
cardiovascular disease in welders 28, 29 and a recent Danish record-linkage study of almost 6000
welders reported, for the first time, a dose-response relationship between lifetime exposure and
chronic ischaemic heart disease.30 A specific relationship between the metal component of
welding fume and HRV was reported by Cavallari and colleagues, indicative of the cardio-toxicity
of PM2.5 metal exposures, specifically manganese.31 In contrast, a laboratory-based study of non-

17
welding, never-smoking, healthy volunteers was unable to detect any association between HRV
and exposure to high levels of welding fume.32
It is apparent that the epidemiological evidence gathered thus far is patchy and inconclusive. A
comparative assessment of the different studies of welders’ pulmonary and cardiovascular health
is not a straightforward undertaking. This is due to the small number of longitudinal studies and to
the variety of techniques and applications of welding which make welders a heterogeneous group
of workers.2 Future research should focus on clarifying the long- and short-term effects of
occupational exposure to welding fumes on airways disease and intermediate cardiovascular pre-
clinical outcomes in homogeneous groups of welders in emerging economies.
1.2 Research hypothesis
Welding fume exposures disproportionally affect the cardiorespiratory health of shipyard
welders in comparison to non-welding shipyard workers;
1.3 Aims and objectives
Study 1: to review, systematically, the cross-sectional literature on the effects of welding fume
exposure on obstructive airways diseases; and to conduct a meta-analysis of their findings;
Study 2: to conduct a cross-sectional survey to measure the prevalence of welding-related
adverse cardio-respiratory outcomes in welders;
Study 3 : to analyse historical (retrospective) cohort data, from medical records, on the adverse
short-term respiratory health effects in welders;
Study 4 : to conduct a panel study to examine the feasibility of measuring short-term, acute,
welding-related cardio-respiratory effects by means of pre- and post-shift measurements in
welders to provide chemical and physical characterisation of welding fume and its metabolic
effects through metabolic profiling.
1.4 Data sources and fieldwork
Data for the literature review were obtained by conducting a systematic search with three search
engines as outlined Chapter 2. Effect estimates from the studies included in the review were
extracted in duplicate and entered into a specifically created database.
The data used for studies 3 and 5 refer to primary health information collected through fieldwork
at DryDocks World-Dubai (DDW-D), one of the world’s largest tanker repair shipyards (Picture 1.1).

18
The yard opened in 1978 under the guidance of the late ruler of Dubai, H.H. Sheikh Rashid Bin
Saeed Al Maktoum. Currently the yard’s main operations include vessel conversions, repair,
maintenance, new building and offshore construction for commercial oil and gas transport ships.
The site includes three dry docks, one of which is half a kilometre long, and handles around 350
vessels a year, most of them Ultra Large Crude Carriers (ULCCs) or Very Large Crude Carriers
(VLCCs); over the last 36 years of operation, the yard has repaired over 7500 vessels.
The yard’s medical centre (Pictures 1.2 & 1.3) provides primary care for approximately 10,000
employees of the yard and those of two other, smaller yards nearby; the Dubai Maritime City, to
the east by port Rashid, and Al Jadaf Shipyard (to the west of Dubai). The medical team comprises
of two medical doctors, 18 nurses, 1 pharmacist, seven administrative staff led by the chief
medical officer Dr Omer Imtiaz Hasan. The functions of the Medical Centre can be broadly divided
into 4 sections: General Medical Services, Emergency Services, Occupational Health (OH) and
Administrative Activities.
A team of OH nurses work closely with the safety department of the yard and conducts trainings
to the various departments on health and safety subjects’ e.g. manual handling, heat management
etc. The essence of their work is ‘general practice’ and little routine health surveillance is
undertaken, and none of the welder workforce. Fieldwork for studies 3 and 4 was undertaken by a
small group of nurses at the medical centre with the administrative assistance of Ms Aneela Zafar
Ali.
Data for study 4 were collected routinely by the medical centre from 2000 to 2011 with
employment data for the same period provided by the yard’s Human Resources department.

19
Picture 1.1 Arabian peninsula and DryDocks World-Dubai. Source: Google Earth imagery, 22°06’15.11’’N 34°18’01.54’’E; accessed on 06.12.2014
Picture 1.2 Satelite view of DryDocks World-Dubai with medical centre highlighted. Source: Google Earth imagery, 25°14’59.94’’N 55°15’42.49’’E; accessed on 06.12.2014

20
Pictures 1.3 DryDocks World Dubai and WELSHIP team: a. ship before and after repaint; b. ship cross-section for
conversion; c. sandblasting; d. crane-operator; f. welding plain; i. welding workshop; h. workers accomodations; i/j. medical centre; k. WELSHIP team.

21
1.5 Thesis plan
This thesis is organised over five subsequent chapters, each presenting original information to
address the aims and objectives outlined in section 1.3. Each chapter contains a methods, results,
discussion and conclusion section.
Chapter 2 (study 1) focuses on the results of a systematic review and meta-analysis of the cross-
sectional studies that have looked at the relationship between welding fume exposure, lung
function and respiratory diseases and symptoms.
Chapter 3 (study 2) describes the WELSHIP cross-sectional survey that collected prevalence data
on the cardiorespiratory health effects of welding fume exposure and reports the results of the
fieldwork conducted in the DDW-D in 2013.
Chapter 4 (study 3) explores further the findings of Chapter 3 with an analysis of historical data
collected by the yard’s medical centre between 2000 and 2011.
Chapter 5 (study 4) outlines the methods and fieldwork of a panel study (‘feasibility’) that
collected cross-shift cardiorespiratory, environmental and bio-markers data.
Chapter 6 provides an overall summary of the findings from each chapter with concluding remarks
on future research.
1.6 Research in a ‘real world’ setting
As mentioned in section 1.1, the global shift in manufacturing to low income and emerging
economies highlights the importance of conducting research into the hazards of arc welding in
these settings rather than, as before, in countries with more established, post-industrial
economies. Underlying the aims and objectives outlined above was a broader theme: whether a
viable, high-quality and potentially sustainable research collaboration could be built between a
western European University (Imperial College London) and a large and busy commercial
enterprise located ~4000 miles away.

22

23
CHAPTER 2: Systematic literature review and meta-analysis on lung
function and obstructive pulmonary disease in arc welders
This chapter will present a systematic review and meta-analysis of the published literature on lung
function and respiratory diseases and symptoms. The systematic review focuses exclusively on
cross-sectional studies for two reasons: the majority of studies looking at the respiratory health in
welders have been cross-sectional in design; a recently published systematic review looked at
welding fume exposure and lung function decline in longitudinal studies.33
2.1 Methods
2.1.1 Search strategy
Figure 2.1 shows the systematic selection process of studies to be included in this review. Three
electronic sources of published literature, Medline, Embase and Web of Science (WOS), were
interrogated to search for cross-sectional studies on lung function and respiratory diseases and
symptoms published up to 29 July 2013. The search strategy combined free text keywords and
MeSHb terms (or equivalent medical sub-headings for Embase) in two blocks, one for exposure
(welding fume) and one for the respiratory outcomes. The respiratory outcomes included lung
function measures (FEV1, FVC, FEV1/FVC ratio) and respiratory diseases and symptoms (asthma,
chronic bronchitis, shortness of breath and wheezing); full details of the search strategy are
provided in Appendix A.2.1.
Manuscripts identified in each database were uploaded to EndNote reference manager
programme, where duplicates across the three databases were subsequently removed.
Crosschecking of references was performed for all studies included and for previously published
reviews to identify any relevant studies that were missed by the electronic search. None of the
previous reviews was reported as having been performed systematically in this way. 23, 34, 35
The search was restricted to:
a) peer-reviewed research articles (thus excluding editorials, conference proceedings and books);
b) studies of human subjects;
c) articles written in English.
b The search in WOS could only be performed using a block of free-text keywords.

24
2.1.2 Inclusion and exclusion criteria
Abstracts from all references were examined and a three-stage exclusion process was followed, as
shown in Figure 2.2.
i. First stage: studies were excluded because they did not meet the electronic search strategy as
explained in 2.1.1;
ii. Second stage: all papers were organised by study design in order to identify those with a cross-
sectional design. These were further examined and the following exclusion criteria were applied:
welding techniques other than arc welding, such as oxyacetylene-welding, brazing and
friction stir welding;
absence of a comparison (non-exposed) group, such as surveillance cross-sectional surveys
of welders only;
population-based studies where the welder participants were not recruited from a work
setting.
iii. Third stage (meta-analysis only): exclusion from the meta-analysis of all studies without
appropriate published risk estimates.
2.1.3 Outcome measures
The cross-sectional studies included in the review investigated the association between welding
fume exposure and obstructive lung disease by measuring lung function with spirometry and/or
respiratory symptoms.
Three spirometric parameters (continuous outcomes) were considered: FEV1, FVC and FEV1/FVC
ratio. These were reported either as observed values expressed in terms of litres of lung volume
(L), or as a percent of predicted lung volume (%); the latter is often used to compare observed
measurements to those of individuals of the same age, gender and height in reference/index
healthy populations.36 The percentage quantifies how closely the observed value is to that in the
referent population. Where both values were reported, the predicted values were extracted.
Observed values were included only if the participants were similar of age and height. When the
standard deviation (SD) was not reported, this was estimated from either the reported range or
standard error (SE).
The four binary respiratory outcomes considered were asthma, chronic bronchitis, shortness of
breath and wheezing. These were mainly reported as raw numbers and/or proportions of subjects
with the outcome by exposure group, while effect measures such as odds ratios (OR) and adjusted
ORs were seldom reported.

25
Figure 2.1 Algorithm for the identification of studies to be included in the systematic review
2.1.4 Data extraction
A series of data entry forms interfaced with a database created in MS Access were used, after
being piloted, to catalogue the extracted data (See A.2.2). The database recorded information on
studies’ characteristics, methodology (including sample selection, response rate, questionnaire
used and analyses performed) results and main findings and on the effect size estimates for
analysis. Data were extracted in duplicate with the help of three other reviewersc, and
discrepancies were discussed until consensus was reached.
2.1.5 Statistical analyses
Meta-analyses with random effects models were conducted using the metan and metafunnel
packages in STATA V.13 (STATA CORP.) , the latter being used to explore publication and small
c Dr Cristina Canova, Ms Susie Schofield and Dr Joanna Szram; all from the Department of Occupational and Environmental Medicine, NHLI, Imperial College London
Three-stage exclusion process
Reading of full text whenever in doubt
Screening of titles and abstracts
Removal of duplicates
Import findings from the three databases into EndNote
Interrogate each of the three databases (Medline, Embase and WOS) using OVID as search engine
Define search strategy:
free-text keywords & MeSH terms or equivalent Embase subheadings

26
study bias.37 The random effects model, which assumes a varying true effect sized across studies
and allows for some between-study heterogeneity, was chosen instead of the fixed effect model,
which assumes a common effect size for all studies, because of the inherently different
characteristics in the included studies such as participants’ ages, national income level and degree
and type of exposure to welding fume.38
The standardised mean difference (SMD) was calculated to assess the difference in continuous
outcomes (lung function) between welders and non-welders as it allows for estimates measured in
different scales (e.g. observed values in L versus percent predicted) to be compared.39 The SMD
cannot be interpreted as a difference between welders and non-welders in the original units of
the outcome, e.g. L of air for FEV1 or FVC, as it is calculated in each study as the ratio of the mean
difference in lung function for welders vs. non-welders over the standard deviation (SD) for both
groups.39 The SMD were atteptively recalculated in litres of air for FEV1 and FVC and percentage
for FEV1/FVC by multiplying the SMDs by the corresponding standard deviations (SDs) obtained
from European Community for Steel and Coal (ECSC) standard European lung volumes values.40
Pooled ORs were calculated for binary respiratory outcomes.
Both visual examination of the forest plots and the I-squared (I2) statistic were used to assess the
presence of heterogeneity of results across studies. The I2 statistic is used to quantify the degree
of between-study heterogeneity, and describes the percentage of total variation across studies
that is due to true heterogeneity rather than chance.38 Higgins et al. 200341 provide a benchmark
for the interpretation of the I2 whereby values of 25%, 50%, and 75% correspond to low, medium
and high heterogeneity. To explore possible causes of heterogeneity when this was present, post-
hoc subgroup analyses were performed, as well as sensitivity analyses, which excluded studies
with extreme effect sizes.
Subgroup analyses defined a-priori were performed to examine whether the respiratory effects of
welding fume are modified by smoking status, welder’s age, country income level, and welding in
shipbuilding and ship-repair industries.
d True effect size and observed effect size of a study are used to refer to the absence or presence of sampling error. The true effect size of a study is the effect size in the population from which the sample was taken from – the sampling error would be zero. The observed effect size of a study is the actual observed effect size that will vary by study and with it the sampling error.
27
Smoking status: cigarette smoking is the single most important risk factor for airflow
limitation.42, 43 All the studies reporting estimates by smokers and non-smokers were included
in the analysis.
Age: typically the clinical manifestations of obstructive lung disease occur after the age of 40;42,
43 therefore to examine if the pooled estimates changed by welder’s age, this was grouped into
a dichotomous variable (28-37 and 38-55 years old), where 37.5 was the median age across all
studies.
Country income level: this was thought to be important in reflecting the implementation of
working safety polices, which could modify the effects of the exposure to welding fume. Data
on countries’ income levels for the year of publication of each study were obtained from the
World Bank’s World Atlas Method44 databasee. The majority of cross-sectional surveys included
in the review were conducted in high-income countries (66%), with the remainder from upper-
middle (10%), lower-middle (20%) or low-income (5%) nations. Because fewer studies were
conducted in non-high income countries, income level data were dichotomised into high-
income and medium/low-income.
Shipbuilding and ship-repair industries: as mentioned in Chapter 1, arc welding has a wide
spectrum of applications in different industries and the level of exposure to welding fume
varies accordingly. In shipbuilding and ship-repair industries, workers are exposed to high levels
of welding fume concentration resulting from welding in confined spaces with limited
ventilation.45 In addition, since 39% (15/38)46-61 of the studies included in the review were
conducted in shipbuilding/repair settings, as well as our WELSHIP study, particular attention
has been paid to welding in this setting.
Funnel plot asymmetry was assessed visually and, when at least ten studies were included in the
meta-analysis, statistically by using Egger’s test for SMD and Peters’ test for ORs.62
e As countries’ economic growth changes over the years, their income level is re-classified accordingly. Turkey for instance, was classified as lower-middle income country in 1995 and upper-middle income country in 2005.

28
Figure 2.2 Flow diagram of exclusion/inclusion of studies in the systematic review
1,279 papers (29 July 2013 search)
477 duplicates
802 unique papers
1st
Sta
ge e
xclu
sio
n
686 excluded
Reasons:
Different outcomes (i.e. lung cancer)
Animal studies
No welders included
Other welding processes
No metal welding
Not in English
7 added from cross-checking of references
109 after screening of
titles/abstracts
2n
d s
tage
exc
lusi
on
57 study designs excluded:
2 Case-control 5 Case report 16 Cohort * 12 Cross-over/Panel ** 23 Reviews/Commentary
52 Cross-sectional study
design papers considered
14 excluded from the review:
8 No comparison group 1 Population based 2 Welders used as comparison group 3 Welders mixed with other workers
3rd
sta
ge e
xclu
sio
n
38 Review Inclusion
4 Excluded from meta-analysis:
3 no estimates for extraction 1 lung function values reported as
observed with difference in age and height between participants
34 Meta-analysis inclusion
21 lung function
measurements
29 Respiratory diseases
and symptoms
* One study Rossignol 199663 presented both cohort and cross-sectional data. ** Two studies Keimig 198364 and Kilburn 198956 presented both panel and cross-sectional data.

29
Author - Year Location
Study population Welding
exposurea Sample size Mean age Smokers Response Main findings
(income level) rate
Engineering Welders Total (SD or range) % %
Anttipoika 197765
Finland (high)
Welders vs. blue-collar workers from engineering shops.
MMA on MS/STL
157 265 36
(10.1) NA NA
Higher prevalence of upper respiratory symptoms and bronchitis among welders. Bronchitis was not associated with length of exposure.
Bradshaw 199866
New Zealand (high)
Welders vs. blue-collar workers from engineering sites.
MIG/MAG/MMA/TIG on
MS/STL 62 131
39 (NA)
35% 95%
Chronic bronchitis was independently related to smoking, welding fume exposure and work-related symptoms. Work related respiratory symptoms were significantly associated with welding in confined-spaces.
Fishwick-200467
New Zealand (high)
Welders vs. blue-collar workers from engineering sites.
MIG/MAG/MMA/TIG on
MS/STL 49 75
39 (19 to 72)
31% NA
Nickel exposure from MIG/MAG and TIG welding was associated with work-related respiratory symptoms; and aluminium exposure from welding with a fall in FEV1 of at least 5% after 15 minutes of work.
Shipbuilding & Repair
Hunnicutt 196446 US (high)
Welders vs. blue-collar workers from a shipbuilding plant.
AW on NS 100 200 46
(NA) 65% NA
Welders had an increased risk of respiratory symptoms that significantly improved during weekends.
Peters 197347 US (high)
Welders vs. pipe-fitters from a shipbuilding plant.
MIG/MAG/MMA/TIG on
MS/STL 61 124 - NA 98%
Both welders and pipefitters had depressed lung function values. Welders had evidence of obstructive pulmonary disease only when compared to pipe-coverer workers exposed to asbestos. No difference in symptom prevalence found.
Barhad 197548 Romania (upper middle)
Welders vs. blue-collar workers from a shipyard.
MIG/MAG/MMA/FCAW on
NS 173 273 - 47% 95%
Cough and chronic bronchitis prevalences were higher in welders (not statistically significant). Dyspnoea and wheezing symptoms were significantly higher in welders. 1 in 5 welders had restrictive lung disease patterns. FEV1 decreased significantly with over 10 years of welding.
Table 2.1 Summary table of all cross-sectional studies ordered by industry included in the systematic review

30
Ross 197849 UK (high)
Welders vs. blue-collar workers from a shipyard.
MMA on NS 926 1681 - NA NA
Difference detected only for 50-59 year old welders in pneumonia and bronchitis when adjusted for smoking. Non-smoking 40-49 year old welders had more obstructive & restrictive disease than controls.
McMillan 197950 UK (high)
Welders from dockyards vs. electrical fitters.
MMA on NS 25 50 - 76% 79% No statistically significant difference in lung function between welders and controls.
Oxhoj 197951 Sweden (high)
Welders vs. white-collar workers from a shipyard.
MMA on MS/STL
119 209 43
(NA) 39% 92%
Prevalence of respiratory symptoms in non/ex-smoking welders was 4 to 5 times higher than in controls; lung function was suggestive of small airways disease in welders.
Akbarkhanzadeh 198052 UK (high)
Welders vs. blue-collar workers from a shipyard in Sunderland.
AW on NS 209 318 39
(NA) 52% NA
Chronic bronchitis and respiratory symptoms increased with age, welding and smoking; lower lung function values in welders than controls. Welding accelerates the natural aging process of the lungs.
McMillan 198453 UK (high)
Welders vs. blue-collar workers from dockyards.
MMA on MS/STL
135 270 55
(NA)
50% 89%
No convincing evidence of welding exposure leading to impairment of pulmonary function; a suggestion that welding may cause obstructive airway changes with no obvious excess of ill-health.
Lyngenbo 198957 Denmark (high)
Welders from a shipyard vs. metal workers & electricians from different industries.
MMA on MS/STL
74 105 - Smokers excluded
71%
Non-smoking MMA welders' spirometric values were significantly lower and prevalence of respiratory symptoms higher than in controls. Lungs of welders were physiologically 10-15 years older than those of controls.
Groth 198955 Denmark (high)
Welders from shipyards and engineering plants vs. local electricians.
MMA on MS/STL
2660 3541 - 61% 86%
High prevalence of chronic bronchitis and cough in welders was not explained by smoking; dose-response relationship between welding fume and prevalence of both upper and lower respiratory symptoms.

31
Kilburn 1989a56 US (high)
Welders from a shipyard vs. "Michigan men sample".
MIG/MAG/MMA/TIG on Al,
MS/STL 144 587 - 44% NA
Overall Al-MIG/MAG welding associated with higher levels of chronic bronchitis due to higher exposure to O3 and Al oxides. Non-smokes had more symptoms than smokers after welding Al perhaps due to thinner mucous blanket on their respiratory tract, less clearance stimulation and consequent easier absorption of Al and O3.
Hjortsberg 199258 Sweden (high)
Welders from a shipyard vs. white-collar workers.
MMA on NS 14 28 40
(24 to 56) Smokers excluded
NA
Increase in volume of trapped gas in welders compared to non-welders indicative of small airways disease. Post-bronchodilator FEV1 decrease of 6% in welders compared to 2% in non-welders.
Gennaro 199359 Italy (high)
Welders vs. metalworker from a shipyard in Genoa.
MMA on MS/STL
36 210 45
(NA) 66% NA
Welders have higher OR for restrictive lung disease perhaps due to exposure to asbestos while working in confined spaces as suggested by Cotes 1987.
68
Sobaszek 199860 France (high)
Welders vs. blue-collar workers from shipyards or tank building industry.
MIG/MAG/MMA/TIG on SS
134 386 41 (9)
41% NA
Respiratory symptoms more frequent in SS welders; lung function values decrease after 25 years of exposure, not linked to age. No obstructive disease observed.
Ould-Kadi 200761
Alegeria (lower middle)
Welders from a shipyard or metallurgic plant vs. blue-collar workers from the National Company Gas and Electricity.
MMA on MS/STL
114 2373 38
(NA) 49% NA
Welders were more likely to smoke and to work in confined and poorly ventilated spaces. They had a lower FVC and FEV1 compared to the control group and a 4% (p=0.01) reduction after adjustment for age, employment history, height, monthly salary and weight.
Vehicles manufacturing
Keimig 198364 US (high)
Welders vs. blue-collar workers from heavy construction equipment manufacturer.
MIG/MAG/MMA/FCAW on
MS/STL 91 171
33 (NA)
53% NA
Among non-smokers, welders had higher frequency of phlegm and phlegm & cough than non-welders. No difference in symptoms in smokers observed. No difference in lung function measures found.
Hayden 198469 UK (high)
Welders vs. blue-collar workers from automotive industry factories.
AW on NS 258 516 - 54% 49%
Welding in open-air and well-ventilated environment does not lead to respiratory diseases. Smoking was associated with respiratory symptoms and lower lung function.

32
Mur 198570 France (high)
Welders vs. blue-collar workers from a trailer manufacturing plant.
MIG/MAG/MMA/TIG on Al, MS/STL
346 560 36
(NA) 81% NA
Slight increase of bronchial hyperreactivity to acetylcholine in welders observed. Obstructive signs more frequent in welders working with poor ventilation. MS welders using MMA welding had more shortness of breath, recurrent bronchitis and obstructive signs than those using MIG
Fidan 200571 Turkey (upper middle)
Welders vs. blue-collar workers from an automobile production factory in Afyon.
AW on NS 51 82 33
(NA) 70% NA
Higher risk of chronic bronchitis in welders compared to non-welders (adjusted OR 4.78). Pulmonary function and oxidant-antioxidant status were negatively affected by welding exposure. Welders had a significant improvement in symptoms at weekends.
Hammond 200572 US (high)
Welders vs. blue-collar workers from an automobile production plant.
AW on NS 234 591 35
(NA) 13% 41%
Workers in the welding and painting departments experienced more respiratory symptoms and had higher numbers of asthma and COPD diagnoses due to greater exposure to respiratory irritants.
Sharifian 201173 Iran (lower middle)
Welders vs. office workers from an automobile assembly factory in Teheran.
AW on NS 43 172 32
(NA) 16% NA
Decrease in pulmonary function and increase in pulmonary obstruction pattern associated with work duration. Chronic bronchitis was higher in welders.
Subhashree 201374 India (lower middle)
Welders vs. blue-collar workers from an automobile production plant.
AW on NS 78 158 33
(21 to 52) 30% NA
Moderate obstruction in welders observed.
Other industries
Fogh 196975 Denmark (high)
Welders vs. blue-collar workers from different industries.
MIG/MAG/MMA/TIG on
MS/STL 156 308 - 76% NA
Symptoms and FEV1 impairment were found to be associated with smoking but not welding.
Zober 198576 Germany (high)
Welders vs. blue-collar workers from different industries.
MIG/MAG/MMA/TIG on
MS/STL 305 405
43 (NA)
32% 90%
Bronchitis detected explained by age and smoking; rhonchi and older age underline the deleterious effect of smoking and welding combined. MIG/MAG & MMA welding were likely to expose welder to excess fume particles than TIG.

33
Sjogren 198577 Sweden (high)
Al & SS Welders from different industries vs. local blue-collar workers.
MIG/MAG/MMA/TIG on Al, MS/STL
259 439 - 46% 100%
No obstructive disease detected and chronic bronchitis was associated with smoking but not welding. O3 and not Al were responsible for symptoms in Al workers. SS welders’ respiratory symptoms were associated with Cr exposure rather than total particle exposure.
Nielsen 199378 Sweden (high)
Welders from a tank for trucks production plant vs. blue-collar workers in a wine warehouse.
MIG/MAG/MMA/TIG on Al, MS/STL
25 50 43
(19 to 64)
30% NA
Welders had an increased prevalence of work-related eye and respiratory symptoms. Increased work-related upper airway symptoms observed in short-term welders possibly suggesting either a healthy worker effect or adaptation. No increase in chronic bronchitis in welders observed. Lung function results suggest a reactivity of the small airways.
Ozdemir 199579 Turkey (lower middle)
Welders vs. office workers from welding workshops in Ankara.
MMA on MS/STL
110 165 36
(NA) 69% NA
Symptoms and chronic bronchitis were more prevalent in in welder. Among smokers, welders had higher prevalence of chronic bronchitis and lower lung function than non-welders. No difference in lung function and chronic bronchitis between 2 groups of welders.
Wolf 199780 Austria (high)
Welders vs. blue-collar workers from different industries.
MMA on NS 64 166 38
(NA) NA 31%
Overall smoking was associated with lower lung function decline in welders; only MEF25 decrease in welders was associated with welding.
Erhabor 200181 Nigeria (low)
Welders vs. maintenance workers from a sub-urban community in Ile-Ife.
AW on NS 44 94 31
(NA) Smokers excluded
95%
Obstructive pattern with over 9 years of exposure and restrictive lung pattern with fewer than 9 years of exposure not associated with smoking was observed in welders.
Meo 200382 Pakistan (low)
Welders from welding workshops vs. workers from nearby shops in Karachi.
MMA on NS 50 100 37
(20 to 60) Smokers excluded
100%
Lung function in non-smoking welders was impaired and stratification of results showed a dose-effect relationship with years of welding. Gradual accumulation of obstructive pattern in both large and small airways observed.
Stepnewski 200383 Poland (upper middle)
Welders vs. blue-collar workers from a steel mill plant in Krakow.
MIG/MAG/MMA/TIG on Al, MS/STL
94 209 41
(NA) NA NA
Lung function suggests that COPD and small airway disease were more frequent in welders. The antioxidant system was affected in welders;, welding fume and gases are thought to be source of oxidant pollutant.

34
Jafari 200484 Iran (lower middle)
Welders from welding workshops vs. general population in Hamadam.
MMA on SS 63
(30) 141 (30)
30 (NA)
30% NA
Asthma, bronchitis and clinical symptoms were more frequent in welders. Spirometry values were lower in welders. A synergistic relationship between smoking and welding was observed.
Pourtaghi 200985 Iran (lower middle)
Welders vs. official & maintenance workers from a production plant in Arak.
MIG/MAG/MMA/TIG on MS/STL
160 246 34
(NA) 37% 81%
Welders had significantly higher prevalence of chronic bronchitis and lower FVC and PEFR than non-welders.
Jayawardana 200986 Sri Lanka (lower middle)
Welders vs. office workers from container yards.
AW on NS 41 82 38
(NA) 50% NA
Only chronic bronchitis was found to be higher in welders than in non-welders. There was no evidence of obstructive disease from spirometry.
Stoleski 201387 Macedonia (upper middle)
SS welders vs. office workers from a metallurgic plant.
MIG/MAG/MMA/FCAW on SS
39 78 44
(36 to 53) 27% NA
Compared to non-welders, welders had significantly higher prevalence of phlegm and cough; lower MEF50 and MEF75 and adverse respiratory effects for those with a work duration of 12 years.
a. Welding processes: AW=Arc Welding, generic term when no specific welding process was reported; MIG/MAG= Metal Inert / Active Gas welding (or GMAW); MMA= Manual Metal Arc welding (or SMAW) also commonly referred to as stick welding; TIG=Tungsten Inert Gas welding (or GTAW); FCAW= Flux-Cored Arc Welding. Base materials used for welding: Al= Aluminium; MS/STL= Mild Steel/ Steel (carbon steel); SS= Stainless Steel; NS= Not Specified. Gases: O3= Ozone

35
Author & Year
Lung Function Respiratory Symptoms
FEV1* FVC**
FEV1
FVC Ratio
Asthma Dyspnoea Chronic
Bronchitis Wheezing
Construction & Engineering
Anttipoika 197765
Bradshaw 199866
Shipbuilding & Repair
Hunnicutt 196446
Barhad 197548
McMillan 197950
Oxhoj 197951
Akbarkhanzadeh 198052
McMillan 198453
Lyngenbo 198957
Groth 198955
Kilburn 1989a56
Hjortsberg 199258
Gennaro 199359
Sobaszek 199860
Ould-Kadi 200761
Vehicles manufacturing
Keimig 198364
Hayden 198469
Mur 198570
Fidan 200571
Hammond 200572
Sharifian 201173
Subhashree 201374
Other industries
Fogh 196975
Zober 198576
Sjogren 198577
Nielsen 199378
Ozdemir 199579
Wolf 199780
Meo 200382
Stepnewski 200383
Jafari 200484
Table 2.2 Outcomes’ summary table of all cross-sectional studies included in the meta-analysis ordered by industry

36
2.2 Results
2.2.1 Characteristics of the studies included in the review
As shown in Figure 2.2, 802 papers were initially identified from the three databases after
exclusion of duplicates. Of these, 686 studies were excluded for the following six reasons: 1) the
outcomes did not relate to lung function or obstructive lung disease, i.e. lung cancer or metal
fume fever; 2) the study focused on animal studies; 3) no welders were included; 4) processes
other than arc welding processes were the primary exposure, such as oxy acetylene welding and
spot-welding; 5) the exposure involved welding of non-metals; 6) the language was not English.
Fifty-seven studies were excluded because their study design was not cross-sectional.
Finally, from the 56 cross-sectional studies identified, 14 were excluded because: 1) a comparison
group was absent;63, 88-94 2) the sample was not drawn from within a work setting but a general
population;95 3) welders specialised in different welding techniques were used as a comparison
group96, 97 and 4) results for welders and other workers were presented together.54, 98, 99
Thirty-eight studies were included in the review and 34 studies included in the meta-analysis. Four
studies were excluded from the meta-analysis because no effect estimates were reported,47, 49 or
lung function estimates reported as observed values were from study participants who differed in
age and height81 the estimates reported were only adjusted ORs without any raw data.67
Specifically for the latter study, since the majority of studies reported only prevalence data
without calculating adjusted ORs, to maintain uniformity in the analyses, only crude unadjusted
data were analysed.
All 38 studies included in the review were published within a period stretching over four decades
(Figure 2.3), with more than a third being published since 2000. The median total sample size was
205 (range: 28 to 3541), with median sample size for the welder’s group of 97 (14 to 2660). Two
Pourtaghi 200985
Jayawardana 200986
Stoleski 201387
Total 19 15 13 6 19 21 15
*Forced Expiratory Volume in 1 second
**Forced Vital Capacity
***Maximum Expiratory Flow at 25-75% of Forced Vital Capacity (interquartile range)
Predicted
Observed

37
fifths of studies (38%) were conducted in shipyards (Table 2.1), followed by vehicle manufacturing
plants (18%). The 14 (36%) studies grouped under “other industries” were conducted in a variety
of settings that included a steel pipe production plant100, metallurgic plants76, 83, 87, railroad tracks
production plant77, tank78 and container building plants,86 welding workshops79, 82, 84, unspecified
production plants75, 81, 85 and different industries in Austria.80
The arc welding processes most frequently used were MMA (38%) and a mixture of MIG/MAG,
MMA and TIG (30%). A quarter of studies did not specify the welding process used. Overall, of the
19 (54%) studies that reported information on base-metal used, mild steel was specified by 11
(58%).
The comparison groups for the welders were chosen primarily from non-welding blue-collar
workers (82%); office workers were also used in 15% of studies. One study in welding workshops
in Iran did not specify the origin of the comparison group and only stated that these were chosen
from outside the workshops.84 Data on participant’s age were reported by 27 studies, where
welders had a median age of 37.5 years and non-welders a median age of 36.8 years.
Figure 2.3 Number of cross-sectional studies by year (decades) of publication
Information on smoking was reported by 29 studies; in four studies smokers were not included in
the study sample57, 58, 81, 82, while four studies did not report data on the proportion of smokers in
the sample47, 49, 65, 83. Of the 15 studies reporting effect estimates by smoking, 12 reported on
symptoms and eight on lung function. The mean proportion of smoking workers included in the
studies was 47% (95% CI 40 to 54%).
8
10
7
13
0
2
4
6
8
10
12
14
1964/1979 1980/1989 1990/1999 2000/2013
Nu
mb
er o
f st
ud
ies
Year of publication

38
Data on symptoms’ prevalence and smoking were collected by using standard respiratory
questionnaires which were often adapted to each study; these included the Medical Research
Council Questionnaire (MRCQ) on respiratory symptoms101 (29%) and the American Thoracic
Society respiratory disease questionnaire102 (9%); 11% of studies reported using a questionnaire
developed specifically for the study. Additional information on the studies included in the review
can be found in Table 2.2.
Meta-analysis was performed on 34 studies, for a total sample size of 11,108 workers, to obtain
pooled estimates for lung function and/or symptoms. Table 2.2 provides details of which
outcomes were reported by each study. Fifteen studies measured both lung function and
respiratory symptoms; six measured only lung function and 14 only symptoms.
2.2.2 Meta-analysis results for lung function
The meta-analysis of lung function estimates included 5,061 workers (2,550 welders and 2,511
non-welders). In all sensitivity analyses, the study by Stepnewsky et al. 200383 was excluded
because it appeared different from the rest since its extreme SMD value with confidence interval
that did not overlap those of any other studies’. The forest plots for the subgroup analyses can be
found in A.2.3.
FEV1
The pooled SMD from the 19 studies of FEV1 (Figure 2.4) that included 4,474 workers showed a
statistically significant negative value for welders versus non-welders [-0.30 (95% CI: -0.53 to -
0.07)] with a high between-study heterogeneity (I2=92 %) which was explored by means of
sensitivity and subgroup analyses but was only partly explained. The heterogeneity remained high
after excluding Stepnewsky et al. 2003 (79%) and in most subgroups such as medium- and low-
income countries (I2=77%), 28-37 years old (I2=81%), smokers (I2=83%), non-smokers (I2=77%) and
in shipbuilding/repair industries (I2=71%). Heterogeneity fell slightly to a medium-high level with
the remainder subgroups where the I2 was below 70% in the 37-55 years old (56%) and high-
income (44%) subgroups.
The number of studies included in each subgroup varied between ten (22-37 years old), nine (each
country income level), seven (non-smokers), six (smokers and 37-53 years old) and five
(shipbuilding/repair industry). The SMD remained negative and statistically significant for welders

39
in all but two subgroup analyses: in high-income level [-0.04 (-0.15 to 0.07)] and 37-53 years old
age group [-0.11 (-0.32 to 0.09)] and shipyard and repair industry [-0.12 (-0.37 to 0.13)]. No
obvious trend could be observed in relation to studies’ year of publication.
Figure 2.4 Comparison of FEV1 in welders and non-welders
FVC
The pooled SMD from the 15 studies of FVC (Figure 2.5) that included 3,524 workers showed a
non-statistically significant negative value for welders versus non-welders [-0.07 (-0.27 to 0.12)]
with a high between-study heterogeneity (I2=85%) which was explored by means of sensitivity and
subgroup analyses. Excluding Stepnewisky et al. 2003 partly explained the high overall
heterogeneity and reduced the I2 to a medium-high level (63%) with a statistically significant SMD
[-0.15 (-0.28 to -0.02)] which could be translated into a decrease of 0.09 (0.37 to 0.01) L if all
values had been reported as observed FVC lung function. In subgroup analysis, heterogeneity
remained high among non-smokers (I2=81%) and in shipbuilding/repair industry (I2=75%). It fell to
a medium/medium-high level for all other subgroups with the SMD remaining not statistically
NOTE: Weights are from random effects analysis
Overall (I-squared = 91.9%, p = 0.000)
Author-year
Sharifian-2011
Subhashree-2013
Stoleski-2013
Fogh-1969
Gennaro-1993
Sobaszek-1998
Anttipoika-1977
Mur-1985
Meo-2003
Fidan-2005
Hjortsberg-1992
Wolf-1997
Stepnewski-2003
Akbarkhanzadeh-1980
Ozdemir-1995
Hayden-1984
Ould-Kadi-2007
Jayawardana-2009
Pourtaghi-2009
Location
Iran
India
Macedonia
Denmark
Italy
France
Finland
France
Pakistan
Turkey
Sweden
Austria
Poland
UK
Turkey
UK
Algeria
Sri Lanka
Iran
-0.33 (-0.56, -0.10)
SMD (95% CI)
-0.07 (-0.42, 0.27)
-0.63 (-1.03, -0.23)
-0.24 (-0.69, 0.20)
-0.01 (-0.23, 0.22)
-0.26 (-0.62, 0.10)
0.07 (-0.14, 0.28)
0.03 (-0.22, 0.27)
-0.27 (-0.44, -0.10)
-0.64 (-1.04, -0.23)
-0.42 (-0.88, 0.03)
0.80 (0.03, 1.58)
-0.23 (-0.55, 0.08)
-2.38 (-2.74, -2.03)
-0.27 (-0.50, -0.04)
-0.68 (-1.01, -0.35)
0.10 (-0.08, 0.27)
-0.35 (-0.60, -0.09)
0.35 (-0.09, 0.78)
-0.89 (-1.16, -0.61)
2256
(SD); Welders
43, 94.6 (9.9)
50, 72.9 (10.6)
39, 83.4 (9.3)
156, 102 (16.6)
36, 83.6 (19.8)
130, .99 (.15)
157, 3.96 (.7)
346, 90.6 (14.3)
50, 2.67 (.74)
51, 95.3 (11.9)
14, 105 (6.59)
64, 89 (14)
94, 95.7 (1.41)
209, 3.77 (.98)
110, 87.5 (13.7)
257, 129 (26.7)
114, 98.3 (12.9)
41, 2.63 (.576)
160, 3.7 (.74)
N, mean
2218
(SD); Non-welders
129, 95.3 (9.2)
50, 78.5 (6.93)
39, 85.5 (7.9)
152, 102 (17.8)
174, 89 (21.1)
234, .98 (.14)
108, 3.94 (.8)
214, 94.4 (14)
50, 3.09 (.57)
31, 101 (12.8)
14, 100 (5.81)
102, 92 (12)
115, 98.8 (1.23)
109, 4.03 (.93)
55, 96.4 (11.4)
257, 126 (29.4)
123, 103 (12.4)
41, 2.44 (.512)
86, 4.4 (.87)
N, mean
-0.33 (-0.56, -0.10)
SMD (95% CI)
-0.07 (-0.42, 0.27)
-0.63 (-1.03, -0.23)
-0.24 (-0.69, 0.20)
-0.01 (-0.23, 0.22)
-0.26 (-0.62, 0.10)
0.07 (-0.14, 0.28)
0.03 (-0.22, 0.27)
-0.27 (-0.44, -0.10)
-0.64 (-1.04, -0.23)
-0.42 (-0.88, 0.03)
0.80 (0.03, 1.58)
-0.23 (-0.55, 0.08)
-2.38 (-2.74, -2.03)
-0.27 (-0.50, -0.04)
-0.68 (-1.01, -0.35)
0.10 (-0.08, 0.27)
-0.35 (-0.60, -0.09)
0.35 (-0.09, 0.78)
-0.89 (-1.16, -0.61)
2256
(SD); Welders
43, 94.6 (9.9)
50, 72.9 (10.6)
39, 83.4 (9.3)
156, 102 (16.6)
36, 83.6 (19.8)
130, .99 (.15)
157, 3.96 (.7)
346, 90.6 (14.3)
50, 2.67 (.74)
51, 95.3 (11.9)
14, 105 (6.59)
64, 89 (14)
94, 95.7 (1.41)
209, 3.77 (.98)
110, 87.5 (13.7)
257, 129 (26.7)
114, 98.3 (12.9)
41, 2.63 (.576)
160, 3.7 (.74)
N, mean
0-2.74 0 2.74

40
significant for high-income countries [-0.05 (-0.20 to 0.10) I2=55%], 22-37 years old [-0.16 (-0.33 to
0.02) I2=67%] and 38-55 years old [0.15 (-0.36 to 0.07) I2=61%]. A statistically significant pooled
SMD was observed for the smoking and medium- and low-income countries subgroups where
welders showed small decreases in FVC compared to non-welders [-0.35 (-0.61 to -0.09) and -0.25
-0.43 to -0.07) respectively] which could be translated into 0.09 (0.17 to 0.01) L and 0.14 (0.24 to
0.05) L decrement. The number of studies included in each subgroup varied between nine (22-37
years old), eight (middle- and low-income), six (non-smokers and high-income), five (smokers and
37-53 years old) and four (shipbuilding/repair industry). As for FEV1, there was no evident
difference in the SMDs for FVC by the studies’ year of publication.
Figure 2.5 Comparison of FVC in welders and non-welders
FEV1/FVC Ratio The pooled SMD from 13 studies FEV1/FVC ratio (Figure 2.6) that included 2,978 workers showed a
statistically significant negative value for welders versus non-welders (-0.50; -0.92, -0.07) with a
high between-study heterogeneity (I2=96%). This was partly explained by means of sensitivity
analysis (63%; -0.15; -0.29, -0.00) that translated into a decrease of 1.1% (2.1, 0.03%) in FEV1/FVC
NOTE: Weights are from random effects analysis
Overall (I-squared = 83.3%, p = 0.000)
Gennaro-1993
Ozdemir-1995
Sharifian-2011
Jayawardana-2009
Author-year
Pourtaghi-2009
Ould-Kadi-2007
Fidan-2005
Anttipoika-1977
Akbarkhanzadeh-1980
Stepnewski-2003
Sobaszek-1998
Wolf-1997
Hayden-1984
Stoleski-2013
Meo-2003
Mur-1985
Italy
Turkey
Iran
Sri Lanka
Location
Iran
Algeria
Turkey
Finland
UK
Poland
France
Austria
UK
Macedonia
Pakistan
France
-0.04 (-0.21, 0.13)
-0.36 (-0.72, -0.00)
-0.45 (-0.78, -0.13)
-0.06 (-0.41, 0.28)
0.30 (-0.13, 0.74)
SMD (95% CI)
-0.28 (-0.54, -0.02)
-0.36 (-0.61, -0.10)
0.06 (-0.39, 0.51)
0.15 (-0.10, 0.40)
-0.23 (-0.46, 0.01)
1.07 (0.78, 1.36)
0.16 (-0.06, 0.37)
-0.08 (-0.39, 0.23)
-0.06 (-0.23, 0.12)
-0.39 (-0.83, 0.06)
-0.23 (-0.62, 0.16)
0.09 (-0.08, 0.26)
2036
36, 86.6 (18.6)
110, 86.6 (24.7)
43, 94.9 (10.6)
41, 2.97 (.704)
(SD); Welders
160, 4.73 (.71)
114, 99.5 (12.3)
51, 90.6 (12.1)
157, 4.95 (.8)
209, 5 (.98)
94, 98.7 (1.08)
130, 1.03 (.12)
64, 106 (14)
257, 161 (32.9)
39, 87.6 (9.7)
50, 3.98 (.67)
N, mean
346, 94.5 (11.8)
2002
174, 93.3 (18.5)
55, 96.4 (13)
129, 95.5 (9.2)
41, 2.79 (.448)
(SD); Non-welders
86, 4.95 (.9)
123, 104 (12.3)
31, 89.9 (11.3)
108, 4.83 (.8)
109, 5.22 (.95)
115, 97.5 (1.17)
234, 1.01 (.13)
102, 107 (12)
257, 163 (29.6)
39, 91.2 (8.9)
50, 4.14 (.72)
N, mean
214, 93.4 (12.1)
-0.04 (-0.21, 0.13)
-0.36 (-0.72, -0.00)
-0.45 (-0.78, -0.13)
-0.06 (-0.41, 0.28)
0.30 (-0.13, 0.74)
SMD (95% CI)
-0.28 (-0.54, -0.02)
-0.36 (-0.61, -0.10)
0.06 (-0.39, 0.51)
0.15 (-0.10, 0.40)
-0.23 (-0.46, 0.01)
1.07 (0.78, 1.36)
0.16 (-0.06, 0.37)
-0.08 (-0.39, 0.23)
-0.06 (-0.23, 0.12)
-0.39 (-0.83, 0.06)
-0.23 (-0.62, 0.16)
0.09 (-0.08, 0.26)
2036
36, 86.6 (18.6)
110, 86.6 (24.7)
43, 94.9 (10.6)
41, 2.97 (.704)
(SD); Welders
160, 4.73 (.71)
114, 99.5 (12.3)
51, 90.6 (12.1)
157, 4.95 (.8)
209, 5 (.98)
94, 98.7 (1.08)
130, 1.03 (.12)
64, 106 (14)
257, 161 (32.9)
39, 87.6 (9.7)
50, 3.98 (.67)
N, mean
346, 94.5 (11.8)
0-1.36 0 1.36
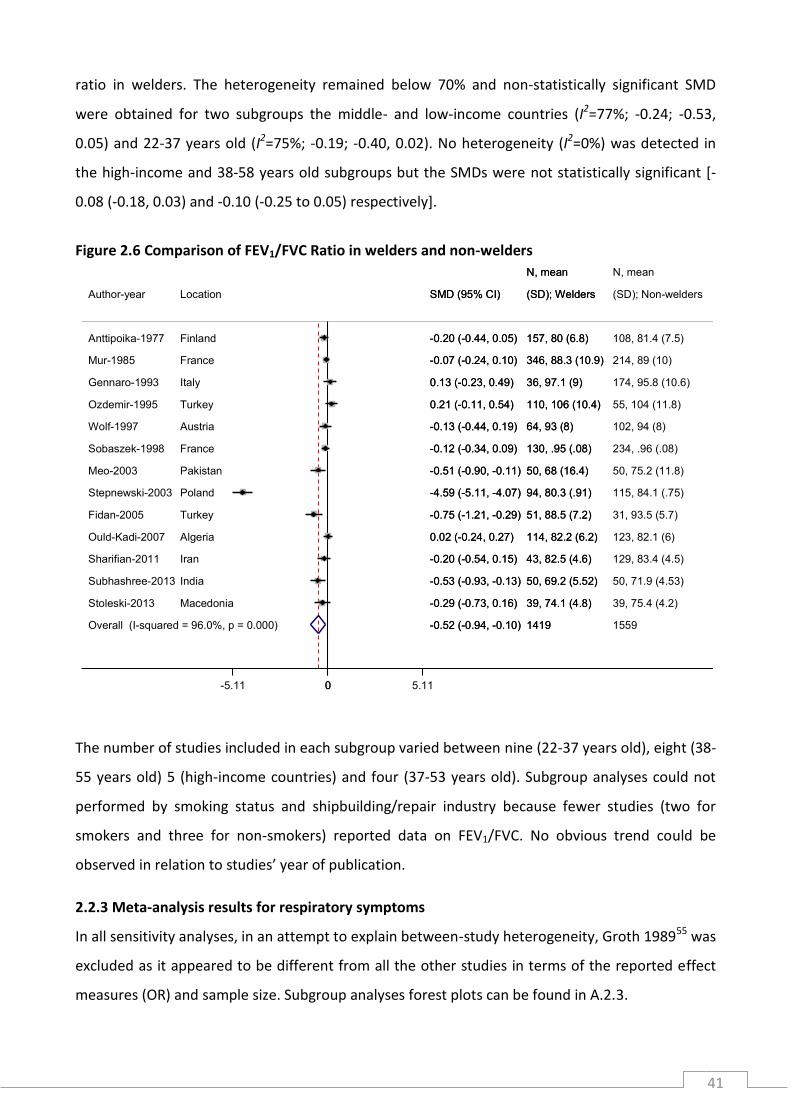
41
ratio in welders. The heterogeneity remained below 70% and non-statistically significant SMD
were obtained for two subgroups the middle- and low-income countries (I2=77%; -0.24; -0.53,
0.05) and 22-37 years old (I2=75%; -0.19; -0.40, 0.02). No heterogeneity (I2=0%) was detected in
the high-income and 38-58 years old subgroups but the SMDs were not statistically significant [-
0.08 (-0.18, 0.03) and -0.10 (-0.25 to 0.05) respectively].
Figure 2.6 Comparison of FEV1/FVC Ratio in welders and non-welders
The number of studies included in each subgroup varied between nine (22-37 years old), eight (38-
55 years old) 5 (high-income countries) and four (37-53 years old). Subgroup analyses could not
performed by smoking status and shipbuilding/repair industry because fewer studies (two for
smokers and three for non-smokers) reported data on FEV1/FVC. No obvious trend could be
observed in relation to studies’ year of publication.
2.2.3 Meta-analysis results for respiratory symptoms
In all sensitivity analyses, in an attempt to explain between-study heterogeneity, Groth 198955 was
excluded as it appeared to be different from all the other studies in terms of the reported effect
measures (OR) and sample size. Subgroup analyses forest plots can be found in A.2.3.
NOTE: Weights are from random effects analysis
Overall (I-squared = 96.0%, p = 0.000)
Subhashree-2013
Fidan-2005
Author-year
Meo-2003
Ould-Kadi-2007
Ozdemir-1995
Sobaszek-1998
Stepnewski-2003
Mur-1985
Stoleski-2013
Anttipoika-1977
Sharifian-2011
Gennaro-1993
Wolf-1997
India
Turkey
Location
Pakistan
Algeria
Turkey
France
Poland
France
Macedonia
Finland
Iran
Italy
Austria
-0.52 (-0.94, -0.10)
-0.53 (-0.93, -0.13)
-0.75 (-1.21, -0.29)
SMD (95% CI)
-0.51 (-0.90, -0.11)
0.02 (-0.24, 0.27)
0.21 (-0.11, 0.54)
-0.12 (-0.34, 0.09)
-4.59 (-5.11, -4.07)
-0.07 (-0.24, 0.10)
-0.29 (-0.73, 0.16)
-0.20 (-0.44, 0.05)
-0.20 (-0.54, 0.15)
0.13 (-0.23, 0.49)
-0.13 (-0.44, 0.19)
1419
50, 69.2 (5.52)
51, 88.5 (7.2)
(SD); Welders
50, 68 (16.4)
114, 82.2 (6.2)
110, 106 (10.4)
N, mean
130, .95 (.08)
94, 80.3 (.91)
346, 88.3 (10.9)
39, 74.1 (4.8)
157, 80 (6.8)
43, 82.5 (4.6)
36, 97.1 (9)
64, 93 (8)
1559
50, 71.9 (4.53)
31, 93.5 (5.7)
(SD); Non-welders
50, 75.2 (11.8)
123, 82.1 (6)
55, 104 (11.8)
N, mean
234, .96 (.08)
115, 84.1 (.75)
214, 89 (10)
39, 75.4 (4.2)
108, 81.4 (7.5)
129, 83.4 (4.5)
174, 95.8 (10.6)
102, 94 (8)
-0.52 (-0.94, -0.10)
-0.53 (-0.93, -0.13)
-0.75 (-1.21, -0.29)
SMD (95% CI)
-0.51 (-0.90, -0.11)
0.02 (-0.24, 0.27)
0.21 (-0.11, 0.54)
-0.12 (-0.34, 0.09)
-4.59 (-5.11, -4.07)
-0.07 (-0.24, 0.10)
-0.29 (-0.73, 0.16)
-0.20 (-0.44, 0.05)
-0.20 (-0.54, 0.15)
0.13 (-0.23, 0.49)
-0.13 (-0.44, 0.19)
1419
50, 69.2 (5.52)
51, 88.5 (7.2)
(SD); Welders
50, 68 (16.4)
114, 82.2 (6.2)
110, 106 (10.4)
N, mean
130, .95 (.08)
94, 80.3 (.91)
346, 88.3 (10.9)
39, 74.1 (4.8)
157, 80 (6.8)
43, 82.5 (4.6)
36, 97.1 (9)
64, 93 (8)
0-5.11 0 5.11

42
Asthma The pooled OR was calculated from data on 1,538 workers; this showed an increased risk in
asthma in welders compared to non-welders [1.65 (1.14 to 2.37) I2=0%]. No subgroup analyses
were performed because only six studies reported this outcome.
Figure 2.7 Comparison of asthma prevalence in welders and non-welders
Chronic bronchitis The analysis of chronic bronchitis included 8,608 workers from 21 studies and a showed a pooled
OR of 2.44 (1.61 to 3.70) with a high between-study heterogeneity (I2=85%); in the sensitivity
analysis, the level of heterogeneity dropped significantly by 45% and welders had almost twice the
risk of chronic bronchitis than non-welders [(1.92 (1.50 to 2.45)]. In all subgroup analyses the level
of heterogeneity remained below 70% and it was close to zero for low-income countries (I2=1.5%)
and shipbuilding/repair industry (I2=21%). Only analyses by smoking status showed non-
statistically significant ORs; these were 1.42 (0.88 to 2.28) in smokers and 2.41 (0.97 to 5.96) in
non-smokers.
Statistically significant pooled ORs were obtained for all the remaining groups. Older welders and
those in medium and low-income countries had over twice the risk of chronic bronchitis [(2.76
(1.75 to 4.36) and 2.50 (1.47 to 4.22)] respectively]; in high-income countries the OR was 1.70
NOTE: Weights are from random effects analysis
Overall (I-squared = 0.0%, p = 0.430)
Keimig-1983
Jayawardana-2009
Ould-Kadi-2007
Sobaszek-1998
Hammond-2005
Author-year
Jafari-2004
US
Sri Lanka
Algeria
France
US
Location
Iran
1.65 (1.14, 2.37)
0.51 (0.12, 2.21)
1.33 (0.47, 3.81)
1.08 (0.21, 5.47)
1.27 (0.47, 3.43)
2.02 (1.26, 3.24)
OR (95% CI)
5.22 (0.57, 47.94)
72/654
3/91
10/41
3/114
7/130
45/215
Welders
4/63
Events,
65/884
5/80
8/41
3/123
10/234
38/328
Non-welders
1/78
Events,
1.65 (1.14, 2.37)
0.51 (0.12, 2.21)
1.33 (0.47, 3.81)
1.08 (0.21, 5.47)
1.27 (0.47, 3.43)
2.02 (1.26, 3.24)
OR (95% CI)
5.22 (0.57, 47.94)
72/654
3/91
10/41
3/114
7/130
45/215
Welders
4/63
Events,
1.0209 1 47.9

43
(1.31 to 2.20) and in 28-37 years olds was 1.77 (1.04 to 3.00). The number of studies included in
the subgroup analyses were 13 (high-income), seven (smokers, 28-37 years old and
shipbuilding/repair industry), six (38-55 years old), five (medium- and low-income) and four (non-
smokers).
Figure 2.8 Comparison of chronic bronchitis prevalence in welders and non-welders
Shortness of breath
In total 7,245 workers from 19 studies were included in the pooled analysis of shortness of breath.
The pooled OR was 2.45 [(1.69 to 3.54) I2=74%]. In a sensitivity analysis, only a drop of 2% was
observed in the level of heterogeneity [2.59 (1.76 to 3.81) I2=72%]. In subgroup analyses, the level
of heterogeneity remained high (above 70%) for three of the subgroups: I2=81% among high-
income countries, 79% in smokers and 73% in the 22-37 years old group. For the remainder, the
level of heterogeneity ranged from I2=64% in shipyard and repair industry group to 0% in the
middle- and low-income countries group.
NOTE: Weights are from random effects analysis
Overall (I-squared = 84.6%, p = 0.000)
Zober-1985
Barhad-1975
McMillan-1984
Bradshaw-1998
Anttipoika-1977
Ozdemir-1995
Fidan-2005
Nielsen-1993
Akbarkhanzadeh-1980
Fogh-1969
Groth-1989
Sjogren-1985
Lyngenbo-1989
Sharifian-2011
Author-year
Kilburn-1989
Oxhoj-1979
Mur-1985
Sobaszek-1998
Gennaro-1993
Jayawardana-2009
McMillan-1979
Germany
Romania
UK
New Zealand
Finland
Turkey
Turkey
Sweden
UK
Denmark
Denmark
Sweden
Denmark
Iran
Location
US
Sweden
France
France
Italy
Sri Lanka
UK
2.44 (1.61, 3.70)
0.98 (0.60, 1.58)
1.64 (0.82, 3.27)
1.15 (0.55, 2.41)
3.05 (0.76, 12.35)
1.98 (1.03, 3.82)
3.50 (1.37, 8.97)
3.68 (1.11, 12.19)
3.27 (0.32, 33.84)
27.70 (1.67, 458.91)
1.35 (0.83, 2.21)
7.35 (5.76, 9.38)
2.16 (0.77, 6.07)
12.60 (0.72, 219.79)
5.53 (1.26, 24.19)
OR (95% CI)
2.17 (1.39, 3.39)
3.31 (1.49, 7.36)
1.12 (0.76, 1.65)
2.08 (0.82, 5.27)
1.51 (0.59, 3.83)
4.64 (1.19, 18.16)
2.88 (0.50, 16.48)
1675/5280
99/305
34/173
17/135
7/62
38/157
33/110
18/51
3/25
26/235
52/156
1117/2660
15/252
12/74
5/43
Welders
41/145
Events,
32/119
93/346
10/130
7/36
11/41
5/25
386/3328
33/100
13/100
15/135
3/75
15/108
6/55
4/31
1/25
0/109
41/152
79/881
5/176
0/31
3/129
Non-welders
68/443
Events,
9/90
53/214
9/234
24/174
3/41
2/25
2.44 (1.61, 3.70)
0.98 (0.60, 1.58)
1.64 (0.82, 3.27)
1.15 (0.55, 2.41)
3.05 (0.76, 12.35)
1.98 (1.03, 3.82)
3.50 (1.37, 8.97)
3.68 (1.11, 12.19)
3.27 (0.32, 33.84)
27.70 (1.67, 458.91)
1.35 (0.83, 2.21)
7.35 (5.76, 9.38)
2.16 (0.77, 6.07)
12.60 (0.72, 219.79)
5.53 (1.26, 24.19)
OR (95% CI)
2.17 (1.39, 3.39)
3.31 (1.49, 7.36)
1.12 (0.76, 1.65)
2.08 (0.82, 5.27)
1.51 (0.59, 3.83)
4.64 (1.19, 18.16)
2.88 (0.50, 16.48)
1675/5280
99/305
34/173
17/135
7/62
38/157
33/110
18/51
3/25
26/235
52/156
1117/2660
15/252
12/74
5/43
Welders
41/145
Events,
32/119
93/346
10/130
7/36
11/41
5/25
1.00218 1 459

44
Figure 2.9 Comparison of shortness of breath prevalence in welders and non-welders
Analyses by smoking status showed that the welders’ risk of shortness of breath was associated
with being a non-smoker [6.43 (2.63 to 15.7) I2=49%], working in a shipyard [3.32 (1.32 to 5.55)],
working in a middle or low-income country and with being older [3.17 (1.89 to 5.31)]. The number
of studies included in the subgroup analyses were ten (high-income), nine (28-37 years old), eight
(38-55 years old and medium- and low-income), seven (smokers) six (38-55 years old) and five
(non-smokers).
Wheezing
In total, data from 6,236 workers were included in the analysis of wheezing from 15 studies. The
pooled OR was 3.00 (1.73 to 5.19) and the studies included were highly heterogeneous (I2=86%);
in sensitivity analysis the level of heterogeneity did not change.
NOTE: Weights are from random effects analysis
Overall (I-squared = 73.5%, p = 0.000)
Oxhoj-1979
Jayawardana-2009
Kilburn-1989
Sharifian-2011
Stoleski-2013
McMillan-1984
Mur-1985
Groth-1989
Pourtaghi-2009
Author-year
Sobaszek-1998
Anttipoika-1977
McMillan-1979
Jafari-2004
Keimig-1983
Wolf-1997
Fidan-2005
Barhad-1975
Hunnicutt-1964
Ozdemir-1995
Sweden
Sri Lanka
US
Iran
Macedonia
UK
France
Denmark
Iran
Location
France
Finland
UK
Iran
US
Austria
Turkey
Romania
US
Turkey
2.45 (1.69, 3.54)
3.14 (1.72, 5.73)
2.52 (0.96, 6.62)
5.59 (3.17, 9.88)
0.74 (0.08, 6.84)
1.91 (0.51, 7.16)
4.90 (2.32, 10.32)
0.84 (0.41, 1.74)
1.22 (0.78, 1.91)
5.26 (2.37, 11.68)
OR (95% CI)
1.47 (0.84, 2.58)
0.83 (0.49, 1.40)
0.64 (0.10, 4.19)
3.18 (1.57, 6.43)
1.05 (0.48, 2.29)
5.79 (2.14, 15.64)
3.86 (1.41, 10.54)
4.65 (1.75, 12.31)
6.68 (1.46, 30.68)
10.57 (1.37, 81.38)
550/4295
60/119
17/41
34/145
1/43
7/39
38/135
19/346
84/2313
59/160
Welders
26/130
Events,
46/157
2/25
34/63
15/81
17/64
27/51
34/173
12/100
18/110
250/2950
22/90
9/41
23/443
4/129
4/39
10/135
13/201
26/869
8/80
Non-welders
34/234
Events,
36/108
3/25
21/78
16/90
6/102
7/31
5/100
2/100
1/55
2.45 (1.69, 3.54)
3.14 (1.72, 5.73)
2.52 (0.96, 6.62)
5.59 (3.17, 9.88)
0.74 (0.08, 6.84)
1.91 (0.51, 7.16)
4.90 (2.32, 10.32)
0.84 (0.41, 1.74)
1.22 (0.78, 1.91)
5.26 (2.37, 11.68)
OR (95% CI)
1.47 (0.84, 2.58)
0.83 (0.49, 1.40)
0.64 (0.10, 4.19)
3.18 (1.57, 6.43)
1.05 (0.48, 2.29)
5.79 (2.14, 15.64)
3.86 (1.41, 10.54)
4.65 (1.75, 12.31)
6.68 (1.46, 30.68)
10.57 (1.37, 81.38)
550/4295
60/119
17/41
34/145
1/43
7/39
38/135
19/346
84/2313
59/160
Welders
26/130
Events,
46/157
2/25
34/63
15/81
17/64
27/51
34/173
12/100
18/110
1.0123 1 81.4

45
Figure 2.10 Comparison of wheezing prevalence in welders and non-welders
Heterogeneity was not explained in subgroup analyses by shipyard and repair industry (I2=93%),
high-income level (I2=93%) and in smokers (I2=77%). It did however decrease considerably when
the risk of wheezing was analysed by age [22-37 years old (I2=40%) and 38-55 years old (I2=10%)],
non-smoking (I2=0%) and middle- and low-income (I2=0%). The risk of wheezing was at its highest
in non-smokers [9.06 (3.75 to 21.92)] and in middle- and low-income countries (3.94; 1.03, 8.36).
Older welders had a slightly higher risk than younger ones [2.09 (1.37 to 3.21) vs. 1.84 (1.06 to
3.20)].
2.2.4 Publication and small studies bias: asymmetry analysis
For spirometry measures, there was no statistical evidence of publication and small study bias,
with all p-values from the Egger’s test above the level of significance (Figure 2.11). Visual
examination of the funnel plots however, indicated a slight overall tendency of smaller studies
(larger SE for SMD) to be concentrated in the right-hand area of the plots; this is more evident for
FVC and FEV1/FVC ratio. In Figure 2.11, the SMDs become greater (negative direction) as the SE
size increases. This can be further observed in the additional funnel plots by subgroups,
NOTE: Weights are from random effects analysis
Overall (I-squared = 86.1%, p = 0.000)
Pourtaghi-2009
Barhad-1975
Stoleski-2013
Sharifian-2011
Groth-1989
Fidan-2005
Ozdemir-1995
Jafari-2004
Keimig-1983
Kilburn-1989
Oxhoj-1979
Author-year
Anttipoika-1977
Wolf-1997
Hunnicutt-1964
Sobaszek-1998
Iran
Romania
Macedonia
Iran
Denmark
Turkey
Turkey
Iran
US
US
Sweden
Location
Finland
Austria
US
France
3.00 (1.73, 5.19)
4.21 (1.42, 12.42)
2.46 (1.03, 5.87)
1.76 (0.39, 7.96)
1.99 (0.61, 6.45)
4.94 (3.93, 6.20)
9.23 (1.14, 74.99)
9.20 (0.52, 162.48)
1.00 (0.19, 5.30)
0.98 (0.46, 2.09)
30.11 (16.87, 53.75)
2.90 (1.30, 6.49)
OR (95% CI)
1.34 (0.77, 2.30)
1.62 (0.72, 3.64)
7.32 (1.61, 33.36)
1.59 (0.84, 3.01)
1244/3748
29/160
27/173
5/39
5/43
879/2313
12/51
8/110
7/63
16/81
130/145
29/119
Events,
Welders
50/157
14/64
13/100
20/130
316/2488
4/80
7/100
3/39
8/129
96/869
1/31
0/55
2/18
18/90
99/443
9/90
Events,
Non-welders
28/108
15/102
2/100
24/234
3.00 (1.73, 5.19)
4.21 (1.42, 12.42)
2.46 (1.03, 5.87)
1.76 (0.39, 7.96)
1.99 (0.61, 6.45)
4.94 (3.93, 6.20)
9.23 (1.14, 74.99)
9.20 (0.52, 162.48)
1.00 (0.19, 5.30)
0.98 (0.46, 2.09)
30.11 (16.87, 53.75)
2.90 (1.30, 6.49)
OR (95% CI)
1.34 (0.77, 2.30)
1.62 (0.72, 3.64)
7.32 (1.61, 33.36)
1.59 (0.84, 3.01)
1244/3748
29/160
27/173
5/39
5/43
879/2313
12/51
8/110
7/63
16/81
130/145
29/119
Events,
Welders
50/157
14/64
13/100
20/130
1.00615 1 162

46
particularly for the analyses by income level and age where a greater number of studies were
included (see A.2.4).
For respiratory symptoms, the p-values of Peters’ test for asymmetry were all above the level of
significance. Although Peters’ test was not performed for asthma, because only six studies were
included, visual examination (Figure 2.12) of the funnel plot shows some asymmetry whereby only
two studies are on the top and bottom right-hand side of the plot with the remainder four
scattered in the middle of the left-hand side of the plot. The circle indicates the absence of studies
in the right-hand side of the plot. The p-value for the chronic bronchitis funnel plot was almost
significant (p=0.069) and visual examination of the plot reveals a tendency for larger studies (top-
left hand side) to show smaller ORs than the smaller studies (middle- and bottom-right hand side).
The circle highlights the area of the plot where the absence of studies makes the plot look
asymmetrical; this can be observed further in the additional plots by subgroup (A.2.4).
There is no visual evidence of asymmetry in the funnel plot for shortness of breath. Wheezing, on
the other hand, shows some visual evidence of weak asymmetry given the absence of studies on
the bottom left-hand side of the plot (circle); the additional plots in A.2.4 confirm this.

47
Figure 2.11 Funnel plots for spirometry measures with pseudo 95% confidence limits and Egger’s asymmetry test Figure 2.12 Funnel plots for respiratory symptoms with pseudo 95% confidence limits and Peters’ asymmetry test
FEV1 FVC FEV1/FVC Ratio
Stan
dar
d e
rro
r o
f SM
D
Stan
dar
d e
rro
r o
f SM
D
Stan
dar
d e
rro
r o
f SM
D
SMD for FEV1 SMD for FVC SMD for FEV1/FVC Ratio
Egger's test p-value=0.235 Egger's test p-value=0.682 Egger's test p-value=0.075
Asthma Chronic bronchitis Shortness of breath Wheezing
Stan
dar
d E
rro
r o
f lo
g-O
Rs
Stan
dar
d E
rro
r o
f lo
g-O
Rs
Stan
dar
d E
rro
r o
f lo
g-O
Rs
Stan
dar
d E
rro
r o
f lo
g-O
Rs
Log-ORs for Asthma Log-ORs for Chronic bronchitis Log-ORs for Shortness of breath Log-ORs for Wheezing
Peters' test was not performed because only 6 studies were included Peters' test p-value=0.069 Peters' test p-value=0.399 Peters' test p-value=0.227
0.1
.2.3
.4
Sta
nda
rd e
rro
r o
f S
MD
-3 -2 -1 0 1SMD for FEV1
Egger's test p-value=0.235
FEV1
0
.05
.1.1
5.2
.25
Sta
nda
rd e
rro
r o
f S
MD
-.5 0 .5 1SMD for FVC
Egger's test p-value=0.682
FVC
0
.05
.1.1
5.2
.25
Sta
nda
rd e
rro
r o
f S
MD
-5 -4 -3 -2 -1 0SMD for FEV1/FVC Ratio
Egger's test p-value=0.075
FEV1/FVC Ratio0
.51
Sta
nda
rd e
rro
r o
f lo
g O
R
-2 -1 0 1 2 3Log-ORs for Asthma
Funnel plot with pseudo 95% confidence limits
0.5
11
.5
Sta
nda
rd e
rro
r o
f lo
g O
R
-2 0 2 4Log-ORs for Chronic Bronchitis
Funnel plot with pseudo 95% confidence limits
0.5
1
Sta
nda
rd e
rro
r o
f lo
g O
R
-2 -1 0 1 2 3Log-ORs for Shortness of breath
Funnel plot with pseudo 95% confidence limits
0.5
11
.5
Sta
nda
rd e
rro
r o
f lo
g O
R
-2 0 2 4Log-ORs for Wheezing
Funnel plot with pseudo 95% confidence limits

48
2.3 Discussion
This is the first systematic review of findings from published cross-sectional studies on the effects
of welding on lung function and respiratory symptoms. Given the high number of studies
conducted in shipyards, particular attention has been paid to the health of shipyard welders.
2.3.1 Lung function
The overall analyses for all spirometric indices showed that there was high between-study
heterogeneity. The pooled estimate for FEV1 could not be reported even after sensitivity and
subgroup analyses as the level of heterogeneity remained too high. When heterogeneity dropped
down to below 70%, for studies in high-income countries and older welders, the estimates were
not statistically significant.
The high heterogeneity found for FVC and FEV1/FVC ratio was better explained by sensitivity
analysis, and the pooled statistically significant estimates showed that welders had approximately
0.09L (0.17 to 0.01) of FVC and 1.1% of FEV1/FVC ratio decrement compared to non-weldersf; this
could be indicative of a mixture of both restrictive and obstructive lung disease patterns. It is
difficult to ascertain whether smoking could explain this apparent obstructive pattern given that
only few studies reported these data by smoking status.
Subgroup analyses of FVC by smoking and geographical location resulted in a statistically
significant association only for smokers and studies in medium- and low-income countries, with
the small reduction of FVC in welders compared to non-welders suggesting a restrictive lung
pattern. It is possible that welders working in middle- and low-income countries were more likely
to be exposed to asbestos or other occupational and environmental exposures (leading to
interstitial lung disease) than those in high-income countries or that the comparison groups of
workers used could have been exposed to other respiratory toxins.
f As mentioned in the methods section, translating the SMD decrease into litres of air for FEV1 and FVC should be considered as an indicative figure as the SMD was calculated by including observed and percent predicted lung function values.

49
A previously published systematic review that meta-analysed data on FEV1 decline in welders from
five longitudinal studies, found that the any reduction in FEV1 in welders was largely attributable
to smoking or a synergistic effect of smoking and welding.33 The evidence gained from the present
review and meta-analysis of cross-sectional lung function measurements is, to some extent, in line
with these findings, inasmuch as that any possible obstructive pattern is likely to be explained
(partially or completely) by the effect of smoking.
2.3.2 Asthma and respiratory symptoms
The pooled estimate for the effect of welding on asthma suggests that exposure to welding fume
could be an important risk factor for developing occupational asthma. A recently published
narrative review of arc welding and airway disease35 looked at the epidemiological evidence of
asthma and welding fume exposure and suggested that reliable diagnostic tools such respiratory
challenge tests to ascertain asthma following controlled exposure to welding fume should be
used. Although there is indeed evidence of increased risk for welders, every attempt needs to be
made to rule out irreversible obstructive lung disease (COPD).
The only other overall pooled estimate that was statistically significant with a low level of
heterogeneity was found for chronic bronchitis after sensitivity analyses. This showed that welders
had almost twice the risk of chronic bronchitis than non-welders. This is an important finding as
the literature thus far has presented an inconsistent picture. The somewhat surprising finding that
young workers were more at risk of chronic bronchitis than older workers could be explained by
survival pressures; a “healthy worker effect” would explain this disparity in risk between age
groups.
Subgroup analyses suggest that welders may experience a greater risk of chronic bronchitis,
shortness of breath and wheezing in middle- and low-income countries. This could be due to the
inadequacy of workplace safety measures in these countries that fail to protect workers from
welding fume exposure, thus leading to an increased risk of respiratory ill health, in line with what
was observed for lung function.
Subgroup analyses further suggested that the risk of shortness of breath and wheezing was higher
for non-smoking and older welders. Because of the non-specific nature of these symptoms, it is

50
difficult to attribute them to a precise aetiology. It does seem clear however, that these symptoms
are associated with exposure to welding fume and not smoking. Szram et al. 2013 systematic
review33 of longitudinal studies could not compare data on symptoms’ incidence as these were
not reported in a consistent fashion.
2.3.3 Respiratory health of shipyard welders
It was not possible to derive a pooled estimate from the subgroup analyses looking at lung
function in shipyard welders because the studies included were either highly heterogeneous, for
FEV1 and FVC, or too few for FVE1/FVC ratio. Conversely, subgroup analyses looking at respiratory
symptoms found the risk for chronic bronchitis and shortness of breath among shipyard welders
to be much higher than that among non-welders.
A longitudinal study conducted among Dutch shipyard welders found that welders were more
likely to be absent from work than non-welders employed in the same shipyard due to non-
malignant respiratory diseases.103 In contrast, a series of studies conducted by McMillan50, 53, 104-108
that looked at the health of workers employed at British Royal Navy dockyards concluded that
there was insufficient evidence to suggest that exposure to welding fume exposure leads to excess
respiratory disease,109 apart from some evidence of a higher incidence of upper respiratory
diseases.106, 110
2.3.4 Limitations
Several limitations should be considered before drawing final remarks on the collective evidence
gathered by this review.
Asymmetry analyses showed that there is an overall tendency of small studies to report larger
differences in lung function or effects in symptoms between welders and non-welders. Although
the test for funnel plot asymmetry was inconclusive for all but one outcome (the p-value for
chronic bronchitis was borderline significant), visual examination provided sufficient evidence to
suggest that there is publication bias favouring a negative association between welding fume
exposure in large studies and better respiratory health, with the exception of shortness of breath.
Notably, studies reporting on chronic bronchitis were particularly biased towards an inflation of
estimates. Publication bias is not the only possible cause of asymmetry in funnel plots, with other
causes including methodological and quality issues associated with small studies (small-study bias)
and other sources of heterogeneity between smaller and larger studies.37, 111 For example, the
asymmetry observed could reflect the fact that studies from medium- and low-income country are
smaller and have some of the largest effect sizes.

51
The funnel plots for the subgroup analyses showed that even after the heterogeneity was partly
explained (by income at country level, age groups or shipyard welding) asymmetry was still
present favouring greater effect estimates from smaller studies. This could suggest that the small
studies included in this review are likely to be methodologically weak and analytically inadequate
to produce reliable effect estimates.
When conducting a review of cross-sectional studies, the pooled estimates obtained from its
meta-analyses should be considered cautiously when drawing conclusions, given the
methodological shortfalls of such a study design in assessing causality between exposure and
outcomes112 and the near ubiquitous potential for a healthy worker effect.113 In addition, the
estimates included in the analyses were not adjusted for age or smoking and for this reason
statistically significant pooled estimates need to be viewed in light of this important limitation.
2.3.5 Strengths
A review of meta-analyses in occupational epidemiology has highlighted some of their
shortcomings. Between-study heterogeneity and sources of funnel plot asymmetry have not been
consistently explored nor taken into account when reporting summary results.114 By contrast, this
review has sought to explore these by using sensitivity and subgroup analyses, and funnel plot
asymmetry testing.
Additionally, the majority of previous meta-analyses have not considered the implications of
different types of occupational exposure and this review, by focusing only on welding fume
produced by arc welding, has striven to maintain a level of homogeneity in the type of exposure
experienced by welders.
This review has considered the wider picture of epidemiological research on the respiratory health
effects of arc welding by considering both its historical and future direction. Historically, cross-
sectional study design has been widely used and shipyards chosen as their main setting. The shift
in global manufacturing will increasingly place emerging economies as the centre of research on
welders’ health.

52
2.4 Conclusion
Bearing in mind the limitations posed by small study and healthy worker effect biases, this
systematic review and meta-analyses of cross-sectional studies has shown that welding fume and
not smoking is likely to increase the risk of chronic bronchitis, asthma, wheezing and shortness of
breath in welders. Welders in middle- and low-income countries, those employed in shipyard and
repaired industry had higher risk. The results from the lung function meta-analysis suggest a mixed
restrictive and obstructive lung pattern in welders that is not explained by smoking.

53

54
CHAPTER 3: Cross-sectional survey
3.1 Research aim and objectives
The aim of this study was to measure and compare the prevalence of cardiorespiratory health
outcomes in a group of welders and non-welding workers selected from the workforce of a
shipyard in the Middle East. To achieve this, a cross-sectional survey was conceived, developed
and implemented.
The survey collected respiratory and cardiovascular health data along with current and past
occupational history. A small pilot was conducted to test the feasibility of running the survey and
to gauge the response rate among shipyard workers as a survey of this kind and magnitude had
never been carried out before in this facility.
3.2 Methods
3.2.1 Fieldworkers’ training and survey pilot
The survey’s timeline (Figure 3.1) began with obtaining ethical approval from the Imperial College
Research and Ethical Committee (ref: ICREC_12_3_2).g In early October 2012, I provided the
fieldworkers with training to perform spirometry with EasyOne spirometers, to measure arterial
stiffness with the Vicorder oscillometric device and to implement each stage of the cross-sectional
survey. The training lasted 10 days.
The fieldwork was carried out by the three members of the Occupational Nursing team employed
at Drydocks World Dubai Medical Centre: Mr Sharoon Bakhsh, Mr Bobby George and Mr Nabeel
Irfan. During the training period, the translated versions of the questionnaire were piloted for
comprehension among a selection of patients in the waiting room of the Medical Centre.
g Ethical approval was granted for both the cross-sectional survey and the panel study (see Chapter 5).

55
In late November 2012, the cross-sectional survey pilot was carried out for a period of two weeks
during which 28 people were invited, one declined and seven did not turn up for the induction; 20
agreed to participate (71%, 20/28)h.
Figure 3.1 Cross-sectional survey timeline
3.2.2 Sample selection and sample size
The sample for the cross-sectional pilot and survey was selected randomly by using a frequency
matching approach for nationality and age within the sampling frame of eligible participants.
Overall, there were 8,316 shipyard employees in 2012, most of whom were one of four
nationalities: Indian (35%), Pilipino (22%), Bangladeshi (19%) and Pakistani (13%).
Following a series of exclusion criteria that were adopted to obtain the sampling frame, as shown
in Fig. 3.2, 3,996 shipyard workers were excluded. These criteria were:
a. employment for less than a year: to guarantee a potential welding exposure of at least a
year;
b. office workers: these were considered to be systematically different from all other
shipyard workers in terms of their level of education and work exposures (medical
members of staff were included in this group);
c. workers with probable exposure to solvents, fine dust and smoke: respiratory and
cardiovascular health outcomes could result from such exposures alone.
h During the survey, the 7 workers who did not present for induction would have been invited three times in total for
induction before they were considered as having declined – during the pilot this was not feasible given the time frame of 2 weeks.
12th October 2012 Dubai fieldworkers
training
18th November 2012 Pilot phase
30th December 2012 fieldwork
started
14th January 2014 fieldwork
completed
September 2012 ethical approval received from
ICREC

56
Among the eligible, 33 employees were excluded because their quit date was in November or in
December 2012 and therefore too close to the beginning of the survey to assure that their
remuneration for participation could be received with their final pay.
Figure 3.2 Diagram for the cross-sectional survey sample selection
8,316 (employed in 2012)
2,099 not eligible because employed after 2011
6,217 (employed in or before 2011)
1,513 excluded occupations:
office workers
18 531
medical office workers
exposure to solvents, fine dusts and smoke
206 138
50 40 20 22
488
cleaners firemen insulators maintenance masons metalworkers/galvanizing dept. painter/sand blaster workers
351 excluded nationalities:
169 31 50
Nepalese Polish other nationalities
33
job quit date was in November/December 2012
4,320 sampling frame
592 survey sample
The eligible employees were then grouped in terms of levels of exposure to welding fume by
looking at their occupation and job title as per the employment records’ data. Workers were
assigned to a four-level exposure group divided as in table 3.1. These groups were used to select

57
the sample with the aim of exploring any possible dose-response relationship between welding
exposure and health outcomes.
Table 3.1 Exposure groups and job titles
Sample size
As shown in Chapter 2 (p. 36) the median sample size of previous cross-sectional studies included
in the systematic review was 205 (range: 28 to 3541) participants. A sample size of 500 individuals
(125 for each exposure group) was thought a reasonable number in relation to the resources
available for this project. An estimated attendance rate based on the results from the pilot was
taken into account to select the cross-sectional sample and oversampling was applied to make
sure that the desired number of 500 participants was achieved.
In virtue of the high attendance rate (71%) achieved in the pilot, the number of participants
required to collect data from 500 workers was oversampled by only 100 participants (17%). Thus,
a sample of 604 workers and a response rate as low as 85% would have been sufficient to obtain
the desired sample size of 500.
When the survey sample selection was performed, eight out of 20 pilot participants were
randomly selected and the remainder 12 pilot participants were not included in the analyses of
the survey data to prevent any possible bias. If these were to be included, the random selection
based on frequency of nationality and age would have been violated.
The “high” exposure group was taken as the index group and its distributions of ethnicity were
matched to the distributions in the “medium”, “low” and “unexposed” groups. Details of the
Exposure levels Occupations
high welders
medium platers boilermakers
low pipe-fitters
non-exposed blue collar workers (general) carpenters dock workers drivers electrician/wiremen
hydraulics workers mechanical rigger/machinist security stager/scaffolding

58
frequency matching can be found in Appendix A.3.2. Due to rounding up during the frequency
matching, a sample of 592 workers was identified. Of these, 26 workers had already left their
employment before they could be invited and 93% (529/566) agreed to participate.
The list of selected participants was ordered randomly and survey IDs, different from the
employee ID, were assigned sequentially. Participants were invited weekly by their survey ID
number. This random order of invitation was disrupted only during the months of July and August
2013 (the Holy month of Ramadan during which only non-Muslim shipyard workers were invited).
3.2.3 Survey process, data collection and storage
Shipyard workers were invited weekly with an invitation letter (A.3.1) via email to the
departments in which they were working. The invitation letter, the consent form and the survey
questionnaire were translated into five languages: Bangla, Malayalam, Tamil, Tagalog and Urdu.
Ms Anila Ali was responsible for sending the invitation letter in both the appropriate national
languagei and in English and for checking the availability of the prospective participants on the
electronic employment records database where all workers’ details regarding annual leave and
working shift times could be checked. Workers who were on annual leave or night shift were
invited at a later date and those no longer working at the yard were excluded from the sample and
did not count towards to the response rate calculation.
In the email containing the invitation letter, workers were invited to a short induction during
which the fieldworkers explained the details of the study and answered any questions or concerns.
In case of acceptance to the invitation, an appointment for the following week was arranged after
taking into consideration absolute and relative contraindications for performing spirometry
(absolute: having had eye surgery, open chest or abdominal surgery, stroke or heart attack in the
last three months and having been diagnosed by a doctor with a detached retina; relative:
respiratory infection). Such inductions took place at the yard’s Medical Centre each Thursday
afternoon. Upon participation, participants received a small monetary acknowledgementj that was
paid directly into their monthly salary.
i Workers from India were sent both the Malayalam and Tamil versions of the invitation letter. j AED 50.00 or AED 100.00 in case their appointment lasted longer than 75 minutes as per the yard’s policy.

59
Participants were given the opportunity to decline at every stage of the recruitment process:
a) following invitation by email - the Medical Centre research team contact number was
provided;
b) at induction – the invitation was sent for three consecutive weeks before they were
considered as having declined;
c) before or during their appointment;
Appointments given on the Thursday before each sampling week were arranged for the morning
between 08:00 and 12:00. Appointments would typically last for one hour, depending on the
successful performance of spirometry manoeuvres, and on average 3-4 appointments would be
arranged each day. All the measurements were conducted in the WELSHIP study research room
(see Pictures 3.1) at the shipyard’s Medical Centre where all the research equipment was kept.
The temperature-controlled (~22C) research room provided privacy and a quiet environment to
allow the participants to feel at ease. A hospital bed was placed inside the room for the
participants to lie down for their cardiovascular measurements.
Full details of the survey algorithm can be found in appendix A.3.3. In summary, the following
stages would be followed to implement the survey on the appointment day:
1 • signing of the consent form • signing of the consent form
2 • measurement of weight, height, waist and hip circumferences • measurement of weight, height, waist and hip circumferences
3 • arterial stiffness measurements with the Vicorder device • arterial stiffness measurements with the Vicorder device
4 • pre-bronchodilator spirometry • pre-bronchodilator spirometry
5 • administration of bronchodilator • administration of bronchodilator
6 • questionnaire • questionnaire
7 • post-bronchodilator spirometry • post-bronchodilator spirometry

60
Anthropometric measurements
Height and weight were measured using a Seca 405/9 scale. Participants were asked to remove
their footwear for measuring their height but were weighed in their work overalls made of thin
cotton fabric.
Waist and hip circumferences were measured to calculate a waist-to-hip ratio (WHR). These were
measured with a soft plastic measuring tape following WHO guidelines.115
Arterial stiffness
Arterial stiffness can be measured non-invasively by arterial pulse wave velocity (PWV) and
augmentation index (AIx), the former calculates the speed of travel of the pulse wave along an
arterial segment (carotid-femoral) and the latter the proportion of reflective wave (resulting from
late systolic peak).116 PWA and AIx measurements for assessing arterial stiffness were obtained
Pictures 3.1 Cross-sectional data collection a. consent form; b. height measuring; c. PWV and AIx measured with Vicorder; d. spirometry coaching; e. pre-bronchodilator spirometry; g. bronchodilator; g. questionnaire.
Pictures 3.2 Welders’ PPE h. protective clothing i. disposable breathing mask; j. welding helmet

61
using the Vicorder apparatus that has been shown to provide reliable estimates compared to
more invasive alternatives.117 Compared to other commonly used devices to measure arterial
stiffness, such as the SphygmoCor applanation tonometer, the Vicorder device has the advantage
of producing reliable readings of PWV and AIx that are not operator-depended and require only
brief training.118
Participants were asked to lie supine on the hospital bed with the upper body raised at 45° angle.
The brachial and femoral cuffs were placed on the right arm and upper right thigh. The neck
pressure pad was placed unfastened behind the neck until the PWV was measured so that the
attached hose and inflatable pad would sit over the right carotid area. The distance between the
suprasternal notch and the middle of the femoral cuff (clearly outlined with a marker pen) was
measured in centimetres with the measuring tape and entered in the Vicorder software to
calculate PWV.
First brachial blood pressure (bBP) and AIx were measured three times each and then, after
fastening the neck pressure pad (with a Velcro fixing), PWV was measured three times. In total
nine measurements were collected and the mean of each measurement was used for the
analyses.
Spirometry
Spirometry measurements were made with portable ndd EasyOneTM Spirometers. Calibration of
the spirometers was checked every morning prior to sampling with a 3.0L syringe. The EasyOne
was set to store the “3 Best Curves” option and to choose the best value. EasyOne spirometers
have a built-in grading and quality control algorithm that scores each manoeuvre based on the
American Thoracic Society (ATS) 2005 guidelines119 and advises the operator when further blows
are needed to achieve acceptability – participants were asked to repeat up to five manoeuvres for
both pre- and post-bronchodilator test; if acceptability was not achieved the test was manually
terminated. All manoeuvres were performed in a seated position and a practical demonstration of
how to perform the manoeuvres and active coaching by the fieldworkers were delivered with
every test.

62
Acceptable grades were scored between “A” to “C” and inadequate ones between “D” and “F”.
After completion of the survey, all manoeuvres scoring “D” and below were re-examined for
acceptability by an expert chest physician.
Two puffs of bronchodilator (short-acting beta-agonist, salbutamol, 100 mg per puff) were
administered through a Volumetric spacer. To perform the post-bronchodilator manoeuvres
participants had to wait for 15 minutes during which time they were asked to complete the
questionnaire.
Questionnaire
The survey questionnaire (A.3.1) collected information on occupational exposure history,
respiratory and cardiovascular symptoms as well as on smoking and alcohol intake.
Occupational exposure prior to employment at the shipyard was assessed only in years of
exposure to welding fume and “dusty jobs”. More detailed information on workplace exposure to
welding fume was collected for the employment duration at the shipyard including specific
questions for welders to assess their daily average exposure to welding fume (in hours), welding
processes used and the use of personal protective equipment (PPE) and a subjective assessment
of the quality of local ventilation.
Questions on respiratory symptoms included the current presence of cough, phlegm, wheezing,
shortness of breath, chest illness; and of metal fume fever over the past year. The MRC definition
of chronic bronchitis120 was adapted and defined as regular cough and phlegm production at any
time during the day or night for at least three months in the past year. Work-related symptoms
were assessed by a set of questions where participants were asked if their symptom(s) worsened
during their working shift and/or while working inside ships or whether there was an
improvement on rest days.
The questionnaire data were double entered onto a data entry form created with EpiData Data
Entry software and inconsistencies were rectified by crosschecking the questionnaire hard copy.
63
3.2.4 Data analysis
The prevalence of respiratory and cardiovascular symptoms and of lung function and arterial
stiffness outcomes were examined univariately in relation to whether shipyard workers reported
welding or not. In multivariable analyses hours of welding as a continuous variable was used to
assess the effect of welding on the outcomes of interest. All the analyses were performed with
STATA V.13 (Stata Corp.) and a p value of <0.05 was considered significant.
Outcomes of interest
The outcomes of interest were divided into subjective outcomes, reported respiratory and
cardiovascular symptoms, and objective outcomes, measured lung function and PWA.
Subjective outcomes
Respiratory symptoms, including work-related ones, were grouped together to include all of the
participants who reported one or more of the following: cough, phlegm, wheezing, shortness of
breath or chest-illness.
Chronic bronchitis prevalence was measured by combining the information obtained about the
questionnaire’s questions on both cough and phlegm during the past year.
Cardiovascular symptoms, the prevalence of angina pectoris and irregular heartbeats, were
examined individually.
Objective outcomes
Post-bronchodilator measures of lung function considered were forced expiratory volume in 1
second (FEV1 in litres), forced vital capacity (FVC in litres) and FEV1/FVC ratio as a percentage.
Arterial stiffness measures considered were PWV meters per second (PWV m/s) and AIx as a
percentage.
Covariates and confounders
Age, height, weight, WHR, ethnicity, smoking, alcohol intake and seasonality were considered to
assess the relationship between the welding and health outcomes. WHR has been found to be a
64
more reliable predictor than Body Mass Index (BMI) for obesity and cardiovascular diseases121 and
for all-cause mortality.122
Smoking was expressed in terms of pack-years [(number of daily cigarettes*smoking years)/20]
and included both current and previous smokers’ pack-years. All ‘never smokers’ were assigned a
zero value for pack-years.
Seasonality was considered an important predictor for acute respiratory symptomsk and reflected
the months of the year when shipyard workers were invited to participate in the survey. These
were grouped into two seasons: winter (October to March) and summer (April to September).
Welding exposure duration in years was considered as a possible confounder of the relationship
with cardiorespiratory outcomes among welders only.
Primary analyses
Multivariable logistic regression analysis for symptoms and multivariable linear regression for lung
function and arterial stiffness measurements were used. All the analyses were stratified by
smoking status and analyses of respiratory symptoms were further stratified by seasonality.
As mentioned above, smoking pack years included smokers, ex-smokers and non-smokers who
were assigned zero pack years. The distribution of this variable thus has a spike around the zero
value for all the never smokers. The inclusion of pack years in the regression model, without taking
into account the spike at zero, would assume a monotonic relationship between each outcome
and pack years thus resulting in a violation of the linearity assumption. To overcome this, a two-
stage fractional polynomial-based (FP) approach developed by Royston and Sauerbrei123 was used
to model pack years (dose-response) and smoking status. With this two-stage procedure, first
smoking status and smoking pack years are entered in a model to define the best FP function for
smoking pack years; second, an assessment was made as to whether smoking status or pack years
could be eliminated without affecting the model fit.123 Different sets of a priori confounders were
considered for different outcomes (Table 3.2).
k Acute respiratory symptoms were considered to have an infective agent aetiology, characterised by a rapid onset
and short course.

65
Table 3.2 Outcomes and covariates considered as a priori confounders
Respiratory symptoms = age, nationality, smoking, pack-years*
Cardiovascular symptoms = age, nationality, smoking, pack-years* and alcohol intake
Lung function = age, height, nationality, smoking and pack-years*
Arterial stiffness: AIx = age, heart rate, nationality, smoking pack-years* and alcohol intake
Arterial stiffness: PWV = age, nationality, smoking, pack-years* and alcohol intake
* The inclusion of pack years in the model was assessed by means of the FP-based approach mentioned above. Secondary analyses
The dose-response relationship between welding exposure and health outcomes was further
explored among shipyard workers who reported welding. Welding exposure was measured in
terms of reported welding years, which included the years at the shipyard and welding years
before. The dose-response relationship was examined and stratified by the welding process used,
ventilation and the use of a breathing mask. Respiratory symptoms were further stratified by
season of reporting.

66
3.3 Results
3.3.1 Sample characteristics
There were only a few statistically significant ‘demographic’ differences between welders and
non-welders. As shown on Table 3.3, the sample had a median age of 38 years (range: 29 to 51
years) with a borderline statistically significant difference of one year between welders and non-
welders (p=0.058). Half of the workers were from Bangladesh but no difference was found
between the distributions of nationality among the groups of workers. The differences in the
average workers’ height, weight and WHR were small but statistically significant.
Table 3.3 Sample characteristics by exposure groups
Characteristics Welders
n:274 Non-welders
n:255 Total N:529 P
Age - median (IQR) 37.6 (12) 39.5 (13) 38.4 (12) 0.058
Nationality - n (%)
Bangladeshi 146 (53) 116 (45) 262 (50)
Indian 86 (31) 96 (38) 182 (34)
Filipino 30 (11) 23 (9) 53 (10)
Pakistani 12 (4) 20 (8) 32 (6) 0.101
Height - mean (SD) 164 (5) 166 (6) 165 (6) 0.001
Weight - median (IQR) 66 (11) 69 (15) 67 (13) 0.002
Waist/Hip Ratio - mean (SD) 0.94 (0.05) 0.95 (0.05) 0.94 (0.05) 0.020
Smoking - n (%)
Current 67 (24) 62 (24) 129 (24)
Past 34 (12) 31 (12) 65 (12)
Never 173 (63) 161 (63) 334 (63) 0.997
Pack-years - median (IQR)
Current smokers 4.5 (6) 3.8 (6) 4.1 (6) 0.474
Past smokers 2.6 (4) 2.4 (6) 2.4 (4) 0.788
Current & past smokers 3.6 (5) 3.4 (6) 3.5 (5) 0.798
Alcohol regular intake - n (%)
Current 58 (21) 53 (21) 111 (21)
In the past 17 (6) 24 (9) 41 (8)
Never 197 (72) 177 (70) 374 (71) 0.391
Frequency of current alcohol intake - n (%)
Less than once a week 53 (92) 49 (91) 102 (92) -
1-3 days a week † - † - † - -
4-6 days a week † - † - † - 0.354
Years of welding at the shipyard - median (IQR) 5.7 (3) - - 5.7 (3)

67
cont. sample characteristics by exposure groups
Characteristics Welders
n:274 Non-welders
n:255 Total N:529 P
Past welding - n (%) 192 (70) 53 (21) 245 (46) <0.001
Years of past welding - median (IQR) 5 (6) 4 (4) 5 (6) 0.121
Total years of welding experience - median (IQR) 9 (9) - - 9 (9) -
Daily hours of arc welding - median (IQR) 4 (5) - - 4 (5) -
Full-time welders (5 to 7 hours daily) – n (%) 134 (49) - - 134 (49)
Part-time welders (2 to 4 hours daily) – n (%) 72 (26) - - 72 (26)
Part-time welders (>2 hours daily) – n (%) 68 (25) - - 68 (25) -
Arc welding process* used - n (%)
MMA 219 (80) - - 219 (80)
MIG/MAG 43 (16) - - 43 (16)
TIG 11 (4) - - 11 (4) -
Cutting & grinding - n (%) 230 (84) 72 (28) 302 (57) <0.001
Daily hours of cutting & grinding - median (IQR) 3 (4) 2 (3) 3 (4) 0.081
Painting - n (%) 4 (1) 8 (3) 12 (2) 0.193
Daily hours of painting - median (IQR) 1 (0) 2 (2) 2 (2) -
Past dusty work exposure - n (%) 87 (32) 73 (29) 160 (30) 0.418
Years of past dusty work - median (IQR) 5 (4) 4 (7) 4 (5) 0.773
Breathing mask worn while welding - n (%)
Always 193 (71) - - 193 (71)
Most of the time 58 (21) - - 58 (21)
Sometimes 19 (7) - - 19 (7)
Never 3 (1) - - 3 (1) -
Bandana over mouth while welding - n (%)
Always 62 (23) - - 62 (23)
Most of the time 30 (11) - - 30 (11)
Sometimes 68 (25) - - 68 (25)
Never 113 (41) - - 113 (41) -
Satisfactory level of ventilation - n (%)
Always 105 (38) - - 105 (38)
Most of the time 92 (34) - - 92 (34)
Sometimes 75 (27) - - 75 (27)
Never 1 (0.4) - - 1 (0.4) -
†= omitted because cell number is <5
*Welding processes: MIG/MAG =Metal Inert/Active Gas welding (GMAW); MMA= Manual Metal Arc welding (Stick or SMAW); TIG= Tungsten Inert Gas welding (GTAW).
There were no statistically significant differences in reported smoking and alcohol intake with two
thirds of workers ever smoking and only two-fifths currently drinking alcohol. Shipyard workers
were employed for an average of six years (1 to 28 years) with welders having on average a six
months shorter tenure than non-welders (p=0.018). While employed at the yard, welders have

68
been welding for an average of five years and eight months and for a total of nine years (2 to 36
years) lifetime welding experience.
Welding at the yard was reported for a daily median of four hours (1.2 minutes to 7 hours)l with
almost half of welders (full-time) welding for a median of seven hours. Stick welding on MS was
the main (80%) welding process used and just over two-thirds reported always wearing a
disposable breathing mask (see Picture 3.2); three out of five welders reported wearing a
handkerchief over the mouth for extra protection.
Table 3.4 Cardiorespiratory health by exposure groups
Welders
n:274 Non-welders
n:255 Total N:529
P
Respiratory health
Respiratory symptoms - n (%) Lower respiratory tract symptoms 44 (16) 27 (11) 71 (13) 0.065 Lower respiratory tract work-related 37 (14) 21 (8) 58 (11) 0.053 Upper & lower respiratory tract 47 (17) 29 (11) 76 (14) 0.058
Cough - n (%) 18 (7) 8 (3) 26 (5) 0.068 Lasting for 3 months in past year 6 (2) 3 (1) 9 (2) 0.368 Work-related 17 (6) 5 (2) 22 (4) 0.015
Phlegm - n (%) 20 (7) 10 (4) 30 (6) 0.093 Lasting for 3 months in past year 5 (2) 8 (3) 13 (2) 0.330 Work-related 17 (6) 9 (4) 26 (5) 0.155
Wheezing - n (%) 10 (4) 5 (2) 15 (3) 0.242 Work-related 8 (3) 5 (2) 13 (2) 0.477
Shortness of breath - n (%) 16 (16) 8 (3) 24 (5) 0.136 Work-related 15 (5) 7 (3) 22 (4) 0.116
Chest illness in last year - n (%) 8 (3) 2 (1) 10 (2) 0.072 Chronic bronchitis - n (%) 2 (1) 2 (1) 4 (1) 0.942 Diagnosed asthma - n (%) 6 (2) 1 (1) 7 (1) 0.071
Asthma worsens while working 2 (1) - - 2 (1) 0.172 Metal fume fever - n (%) 71 (26) 19 (7) 90 (17) <0.001
1 - 2 episodes in the last year - n (%) 31 (44) 5 (28) 36 (36) 3 - 4 episodes in the last year - n (%) 3 (4) 1 (6) 4 (4) None 37 (52) 12 (67) 49 (55) 0.471
Lung Function test performed - n (%) 274 (100) 252 (99) 526 (99) 0.072 Pre-bronchodilator 269 (98) 245 (97) 514 (98) 0.465
QC grade A 147 (55) 141 (58) 288 (56) QC grade B 37 (14) 41 (17) 78 (15) QC grade C to F (re-graded) 85 (32) 63 (26) 148 (29) 0.289 QC grade C to F (re-graded) 76 (29) 69 (29) 145 (29) 0.888
l The questionnaire asked welders how many hours a day they would perform welding but this question was answered by nine workers in terms of minutes per week.

69
cont. cardiorespiratory health by exposure groups
Welders
n:274 Non-welders
n:255 Total N:529 P
Post-bronchodilator 264 (96) 240 (95) 504 (96) QC grade A 132 (50) 116 (48) 248 (49) QC grade B 56 (21) 55 (23) 111 (22)
Lung function (post-bronchodilator values) - mean (SD)
FEV1 2.85 (0.04) 2.88 (0.5) 2.87 (0.46) 0.405 FEV1 predicted % 72% (10.9) 71% (29) 72% (21.6) 0.467 FVC 3.45 (0.51) 3.50 (0.5) 3.48 (0.53) 0.262 FVC predicted % 74% (10.5) 73% (24) 74% (18.0) 0.479 FEV1/FVC Ratio % 82% (5.8) 82% (5.3) 82% (5.5) 0.873 Bronchodilator reversibility (GINA)a 5 (1.8) 10 (3.9) 15 (2.8) 0.157
Cardiovascular health Arrhythmia in the past year - n (%) 10 (4) 8 (3) 18 (3) 0.745
Diagnosed angina - n (%) 5 (2) 4 (2) 9 (2) 0.820 Systolic blood pressure mmHg - median (IQR) 132 (16) 135 (18) 134 (17) 0.018 Diastolic blood pressure mmHg - median (IQR) 74 (10) 75 (11) 75 (10) 0.217
Heart rate - median (IQR) 69 (14) 69 (15) 69 (8) 0.332 Central aortic pressure mmHg - median (IQR) 99.1 (12) 101 (13.9) 100 (13.3) 0.061 Pulse pressure mmHg - median (IQR) 57.7 (9.3) 59.3 (10.3) 58.3 (9.3) 0.014 Arterial stiffness measurements - n (%) 274 (100) 255 (100) 529 (100) -
Augmentation Index - mean (SD) 19.2 (6.88) 19.6 (6.57) 19.4 (6.73) 0.479 Pulse Wave Velocity - median (IQR) 7.0 (0.97) 7.1 (1.43) 7.03 (1.13) 0.089
a. Only includes pre- & post-bronchodilator spirometries with a high QC grade of A or B.
Figure 3.3 Lower respiratory tract symptoms by month of attendance
0%
5%
10%
15%
20%
25%
30%
35%
40%
45%
50%
Jan Feb Mar Apr May Jun Jul Aug Sept Oct Nov Dec
Prp
ort
ion
of
resp
irat
ory
sym
pto
ms
Lower respiratory tract symptoms Lower respiratory tract symptoms work-related
Test for trend p>0.001

70
Table 3.5 Respiratory symptoms by exposure stratified by season
Respiratory health - n (%)
Winter (Oct-Mar)
Summer (Apr-Sept)
Welders n: 107
Non-welders n: 106 P
Welders n: 167
Non-welders n: 149 P
Cough 14 (13) 5 (5) 0.032 8 (5) 3 (2) 0.179 Cough work-related 11 (10) 3 (3) 0.028 6 (4) 2 (1) 0.204 Phlegm 16 (15) 5 (5) 0.012 5 (3) 7 (5) 0.429 Phlegm work-related 12 (11) 4 (4) 0.039 5 (3) 5 (3) 0.855 Wheezing 6 (6) 4 (4) 0.527 5 (3) 2 (1) 0.319 Wheezing work-related 3 (3) 3 (3) 0.991 5 (3) 2 (1) 0.319 Shortness of breath 13 (12) 7 (7) 0.165 4 (2) 2 (1) 0.494 Shortness of breath work-related 6 (6) 1 (1) 0.056 2 (1) 0 - 0.180 Chest illness in last year 5 (5) 1 (1) 0.100 3 (2) 1 (1) 0.372 Lower respiratory tract 27 (25) 14 (13) 0.026 17 (10) 13 (9) 0.660 Lower respiratory tract work-related 22 (21) 12 (11) 0.066 15 (9) 9 (6) 0.324 Upper & lower respiratory tract 28 (26) 15 (14) 0.029 19 (11) 14 (9) 0.565
3.3.2 Cardiorespiratory health
Respiratory health
Symptoms: as shown in Table 3.4, respiratory symptoms’ frequency was low and only a few
statistically significant differences were observed between welders and non-welders.
Although welders reported a statistically significant higher prevalence of work-related cough than
non-welders, only four participants reported having chronic bronchitis and diagnosed asthma was
reported only by seven participants, no differences between the exposure groups were observed.
Although the prevalence of chronic bronchitis among ever smokers was higher than that in never
smokers, this was not significant (1% vs. 0.6%, p=0.581). A quarter of welders reported ever having
had metal fume fever and more than two in five experienced it no more than twice in the previous
year; 19 non-welders reported metal fume fever although none of them were currently exposed
to any welding or grinding. Of these, seven workers reported welding in the past but the
remainder reported never welding. Workers, who reported MFF although never having welded in
their job, were either platers or pipe-fitters who work in proximity to welders.
Lower respiratory tract symptoms (cough, phlegm, wheezing and shortness of breath) followed a
seasonal pattern whereby high peaks were reported in the winter months and tailed off during the
summer ones (Figure 3.3, p<0.001).
After stratification by season, cough and phlegm prevalence in winter months in welders
(including for work-related symptoms) was higher than that in non-welders - this difference was

71
statistically significant. In summer however, this difference disappeared. There was no difference
in the prevalence of either wheezing or shortness of breath (including work-related) even when
stratified by season (Table 3.5).
Table 3.6 Multiple logistic and linear regression of binary and continuous cardiorespiratory outcomes (welders vs. non-welder)
OR AOR*
Binary (95% CI) (95% CI) P
Lower respiratory tract symptoms 2.22
(1.09, 4.52) 1.74a
(1.01, 2.98) 0.044
Lower respiratory tract symptoms work-related 1.74
(0.99, 3.06) 1.89a
(1.05, 3.43) 0.035
Angina pectoris 1.17
(0.31, 4.39) 3.06b
(0.62, 15.02) 0.169
Arrhythmia 1.17
(0.45, 3.01) 1.06b
(0.39, 2.94) 0.903
Beta Beta-adjusted* P-value
Continuous (95% CI) (95% CI)
FEV1 -0.03
(-0.11, 0.05) -0.03c
(-0.09, 0.04) 0.415
FVC -0.05
(-0.15, 0.04) -0.02c
(-0.10, 0.59) 0.607
FEV1/FVC ratio 0.08
(-0.90, 1.06) -0.47c
(-1.39, 0.45) 0.312
AIx -0.41
(-1.57, 0.74) -0.08d
(-1.04, 0.87) 0.864
PWV -0.02
(-1.02, 0.97) 0.14b
(0.88, 1.16) 0.785
* All models including smoking pack years were rejected with the FP procedure a. adjusted for age, nationality, smoking status and seasons; b. adjusted for age, nationality, smoking status, WHR and regular alcohol intake; c. adjusted for age, nationality, smoking status and height d. adjusted for age, nationality, heart rate, smoking status, WHR and regular alcohol intake
In multivariable analysis (Table 3.6), welders were 74% and 89% more likely to report respiratory
symptoms and work-related symptoms (respectively) than non-welders. From the same model,
smoking workers compared to never smoking ones had an adjusted odds ratio (AOR) of 2.21 (95%
CI: 1.31 to 3.75). The AOR (adjusted for age, nationality, smoking status) for reported symptoms in
winter was 2.65 (1.22 to 5.78) and 2.39 (1.04 to 5.48) for work-related ones (welders vs. non-
welders); these effects disappeared in summer where the AOR were 1.12 [(0.52 to 2.43),
Pinteraction=0.117] and 1.44 [(0.61 to 3.45) Pinteraction=0.415].

72
Table 3.7 Multiple logistic and linear regression of binary and continuous cardiorespiratory outcomes by smoking status (welders vs. non-welder)
Ever
sm
oke
rs
Welders n: 101
Non-welders n: 93 OR AOR P
Binary n (%) n (%) (95% CI) (95% CI)
Lower respiratory tract symptoms
22 (22%) 12 (13%) 1.88 (0.87, 4.05)
2.10a (0.92, 4.64)
0.071
Lower respiratory tract symptoms work-related
21 (21%) 7 (8%) 2.23 (1.30, 8.00)
3.76a (1.46, 9.70)
0.006
Angina pectoris 3 (3%) 1 (1.1%) 2.81 (0.29, 27.6)
4.19b (0.18, 96.5)
0.370
Arrhythmia 4 (4%) 4 (4.3%)
0.92 (0.22, 3.78)
1.00b (0.24, 4.28)
0.996
Continuous mean (sd) mean (sd)
Beta Beta-adjusted P-value
(95% CI) (95% CI)
FEV1 2.81 (0.43) 2.90 (0.47) -0.09 (-0.21, 0.04)
-0.05c (-0.15, 0.05)
0.357 FVC 3.45 (0.50) 3.54 (0.53) -0.08
(-0.23, 0.06) -0.01c
(-0.11, 0.11) 0.872
FEV1/FVC - median (IQR) 81.6 (5.99) 82.0 (5.57) -0.40
(-2.12, 1.31) -1.07c
(-2.66, 0.51) 0.105
AIx - median (IQR) 21.2 (6.44) 20.9 (6.72) 0.29
(-1.57, 2.15) 0.05d
(-1.14, 1.25) 0.929
PWV - median (IQR) 7.33 (1.47) 6.90 (0.98) -1.04
(-1.86, -0.22) -0.98b
(-1.82, -0.14) 0.023
Nev
er s
mo
kers
Welders n: 161
Non-welders n: 173 OR AOR P
Binary n (%) n (%) (95% CI) (95% CI)
Lower respiratory tract symptoms
22 (13%) 14 (8.7%) 1.53 (0.75, 3.10)
1.45a (0.70, 3.00)
0.311
Lower respiratory tract symptoms work-related
16 (9.3%) 13 (8%) 1.16 (0.54, 2.49)
1.10a (0.50, 2.41)
0.814
Angina pectoris 3 (1.9%) 2 (1.2%) 0.62 (0.10, 3.73)
2.25b (0.21, 23.6)
0.499 Irregular heartbeats 4 (2.5%) 6 (3.5%) 1.41
(0.39, 5.09) 0.98b
(0.21, 4.35) 0.975
Continuous mean (sd) mean (sd)
Beta Beta-adjusted P (95% CI) (95% CI)
FEV1 2.87 (0.46) 2.88 (0.47) -0.01 (-0.11, 0.10)
-0.01c (-0.10, 0.08)
0.777 FVC 3.45 (0.51) 3.49 (0.56) -0.08
(-0.23, 0.06) -0.01c
(-0.13, 0.12) 0.985
FEV1/FVC - median (IQR) 83.9 (6.84) 83.4 (6.36) 0.41
(-0.77, 1.60) -0.09c
(-1.21, 1.03) 0.874
AIx - median (IQR) 21.2 (7.33) 21 (9) -0.87
(-2.31, 0.56) 0.32d
(-1.29, 1.94) 0.692
PWV - median (IQR) 6.93 (1.27) 7.00 (0.97) 0.57
(-0.93, 2.07) 0.72b
( -0.82, 2.26) 0.357
a. adjusted for age, nationality and season; b. adjusted for age, nationality, WHR and regular alcohol intake; c. adjusted for age, nationality, height; ality, and height d. adjusted for age, nationality, heart rate, WHR and regular alcohol intake.

73
Stratifying by smoking status only gave a statistically significant AOR for work-related respiratory
symptoms (Table 3.7). Among ever-smoking workers, welders had almost a fourfold increase in
the risk of work-related respiratory symptoms compared to non-welders but no difference was
observed among never smoking workers. The test for interaction was borderline significant only
for work-related symptoms (Pinteraction=0.05). In the same analyses, symptoms both overall and
work-related in ever-smokers were more likely to be reported in winter than summer [AORm 2.31
(1.05 to 5.10) and 2.74 (1.14 to 6.55) respectively]. In winter, welders were almost three times as
likely as non-welders to report symptoms: overall the AOR was 2.65 (1.22 to 5.78) and work-
related was 2.39 (1.04 to 5.48); no effects were observed in summer.
Only 11 participants were not able to perform a lung function test and of the 518 workers who
did, 514 pre- and 504 post-bronchodilator tests were acceptable. Quality control grading of A and
B was achieved by 71% of both pre- and post-bronchodilator tests. There were no important
differences in the univariable and multivariable analyses for any of the lung function
measurements between welders and non-welders even after stratification by smoking.
In addition, in multivariable analysis of lung function, FEV1 decreased with age [-0.03 (-0.09 to -
0.04)] and among Filipino workers [-0.08 (-0.16 to -0.01)] and increased with height [0.03 (0.03 to
0.04)]. Similarly, FVC decreased with age [0.02 (-0.02 to -0.01)] and among Filipino workers [-0.10
(-0.19 to -0.01)] and increased with height [0.04 (0.04 to 0.05)]. FEV1/FVC ratio decreased with age
[-0.25 (-0.30 to -0.19)], height [-0.10 (-0.19 to -0.02)] and among Pakistani workers [-3.02 (-5.08 to
-0.95)].
Cardiovascular health
Symptoms: the prevalences of reported arrhythmias and angina pectoris were lower than those
observed for respiratory symptoms and no differences were seen between shipyard workers.
Arterial stiffness: all shipyard workers had an AIx measurement and only one PWV measurement
was missing. In univariable and multivariable analyses no difference was observed between
workers; the only difference was observed after stratification by smoking status whereby ever-
smoking non-welders had a lower PWV (-1.05 m/s) than ever-smoking non-welders; the test for
m
Adjusted for reported welding, age, nationality and season
74
interaction was highly significant (Pinteraction<0.001). In multivariable analysis, AIx increased with
age [0.33 (0.26 to 0.40)], WHR [13.5 (1.80 to 25.3)] and among smokers [2.29 (1.03 to 3.54)]; it
decreased among Filipinos [-4.93 (-7.20 to -2.67)]. PWV increased with age [0.11 (0.04 to 0.18)].
3.3.3 Secondary analyses results
Among welders, in univariable analysis, welding for more than 10 years compared to welding for
nine years or less was associated with a higher WHR and a higher proportion of ever smokers.
Welders with two to nine years of welding experience reported welding for a median of two hours
and just over one fifth reported being exposed to dust in previous jobs (See A.3.4 for additional
tables).
There were no differences between the two groups of welding experience for any of the
respiratory and cardiovascular symptoms. However, welders with longer welding experience had
statistically significant lower lung function indices and cardiovascular health outcomes, including
heart rate and blood pressure, when compared with welders with shorter welding experience
(Table 3.8).
These differences disappeared after adjustment in multivariable analysis. Only reported angina
pectoris was found to have a significant p-value indicated that for every year increase in welding
experience the risk of reported angina pectoris decreased by 1% (Table 3.9).
No associations were found between any of the cardiorespiratory outcomes after stratification by
reported PPE (use of breathing mask and ventilation) or welding technique used.

75
Table 3.8 Cardiorespiratory health in welders by years of welding exposure
2/9 years welding
experience
10/36 years welding
experience Total P
Respiratory health N: 153 N: 121 N: : 274
Respiratory symptoms - n (%) 20 (13) 24 (20) 44 (16) 0.130 Respiratory symptoms work related - n (%) 17 (11) 20 (17) 37 (14) 0.193 Upper & lower respiratory tract 21 (14) 26 (21) 47 (17) 0.091 Diagnosed asthma - n (%) 4 (3) 2 (2) 6 (2) 0.589
Asthma worsens while working - - 2 (2) 2 (1) 0.110 Metal fume fever while working at the yard - n (%) 34 (22) 37 (31) 71 (26) 0.117
Number of episodes in the last year - n (%)
1 - 2 episodes 19 (56) 12 (32) 31 (44)
3 - 4 episodes 2 (6) 1 (3) 3 (4) None 13 (38) 24 (65) 37 (52) 0.079
Lung Function test performed - n (%) 153 (100) 121 (100) 274 (100) - Pre-bronchodilator 149 (97) 120 (99) 269 (98) 0.272
QC grade A 86 (58) 61 (51) 147 (55) QC grade B 23 (15) 14 (12) 37 (14) QC grade C to F (regraded) 40 (27) 45 (38) 85 (32) 0.161
Post-bronchodilator 150 (98) 114 (94) 264 (96) 0.094 QC grade A 79 (53) 53 (46) 132 (50)
QC grade B 32 (21) 24 (21) 56 (21)
QC grade C to F (regraded) 39 (26) 37 (32) 76 (29) 0.488
Lung function (post-bronchodilator values)
FEV1 - mean (SD) 2.97 (0.43) 2.69 (0.42) 2.85 (0.45) <0.001 FEV1 predicted %- mean (SD) 73 (10) 72 (12) 73 (11) 0.664 FVC - mean (SD) 3.56 (0.48) 3.31 (0.51) 3.45 (0.51) <0.001 FVC predicted %- mean (SD) 74 (10) 74 (11) 74 (11) 0.676 FEV1/FVC Ratio % - mean (SD) 83 (5.5) 81 (5.8) 82 (5.8) <0.001 Bronchodilator reversibility (GINA)a - n (%) 3 (3) 2 (3) 5 (3) 0.949
Cardiovascular health
Episodes of arrhythmia in the past year - n (%) 6 (4) 4 (3) 10 (4) 0.787 Diagnosed angina pectoris - n (%) 3 (2) 2 (2) 5 (2) 0.850 Heart rate - median (IQR) 68 (13) 70 (14) 69 (14) 0.050 Systolic blood pressure mmHg - median (IQR) 130 (13) 134 (20) 132 (16) 0.004 Diastolic blood pressure mmHg - median (IQR) 73 (10) 76 (10) 74 (10) <0.001
Arterial stiffness measurements - n (%) 153 (100) 121 (100) 274 (100) - Augmentation Index - mean (SD) 18 (6.9) 21 (6.2) 19 (6.8) <0.001 Pulse Wave Velocity - median (IQR) 6.8 (0.9) 7.2 (1.0) 7.0 (0.97) 0.010
a. Only includes pre- & post-bronchodilator spirometries with a high QC grade of A or B.

76
Table 3.9 Multiple logistic and linear regression of binary and continuous cardio-respiratory outcomes by years of welding experience in welders. Change of ORs and beta-coefficients for every year increase of welding years
Outcome: OR AOR P
Binary (95% CI) (95% CI)
Lower respiratory tract symptoms 1.04
(0.99, 1.09) 1.05a
(0.97, 1.13 ) 0.218
Lower respiratory tract symptoms work-related 1.04
(0.99, 1.09) 1.05a
(0.97, 1.13 ) 0.243
Angina pectoris 0.84
(0.14, 5.11) 0.01b
(0.00, 1.01) 0.050
Arrhythmia 0.97
(0.87, 1.08) 1.07b
(0.92, 1.25) 3.71
Continuous Beta Beta-adjusted P-value
(95% CI) (95% CI)
FEV1 -0.02
(-0.03, -0.01) -0.01c
(-0.02, 0.01) 0.303
FVC -0.02
(-0.02, -0.01) -0.01c
(-0.02, 0.01) 0.172
FEV1/FVC -0.21
(-0.31, -0.11) -0.01c
(-0.13, 0.15) 0.892
AIx 0.27
(0.17, 0.37) -0.02d
(-0.17, 0.12) 0.773
PWV 0.03
(-0.08, 0.14) -0.03b
(-0.18, 0.12) 0.704
* All models including smoking pack years were rejected with the FP procedure a. adjusted for age, nationality, smoking status and season; b. adjusted for age, nationality, smoking status, WHR and regular alcohol intake; c. adjusted for age, nationality, smoking status and height d. adjusted for age, heart rate, nationality, smoking status, WHR and regular alcohol intake

77
3.4 Discussion
The WELSHIP cross-sectional survey was the first study to be conducted in this busy shipyard and
the first anywhere to observe a seasonal pattern in the risk of respiratory symptoms among
welders.
This study differs from previous surveys in terms of sample size, proportion of smokers and
duration of participants’ recruitment into the study. The sample size was twice as big as the
average of previously published cross-sectional studies, including those conducted in shipyards.
The proportion of current smokers included in this sample was low (one in four) compared to
almost half of those included in previous studies (see Chapter 2; Table 2.1). On average, the
sample participants had been employed for almost six years and, given a median age of 38 years,
would have begun their employment at the yard in their early thirties. This relatively short tenure
is likely to reflect the transient nature of the labour force of the United Arab Emirates (UAE).
Population statistics from the latest 2010 Census show that 86% of the UAE population are non-
nationals of whom 77% are male.124 The population of the UAE is notably a transient population of
expatriates employed in a variety of industries125, the majority from the Indian subcontinent
(India, Pakistan and Bangladesh), the Philippines, Arab Republic of Egypt, the Republic of Yemen,
the Islamic Republic of Iran and Sudan.126
The statistically significant shorter tenure (by six months) of welders compared to non-welders
might be explained by their working conditions; welders have to endure the extreme heat
produced by arc welding, over 10,000 °C2, as well as the outside absolute temperatures and
relativity humidity that in Dubai can reach 48.5 °C (July 2013) and 98% (January 2013)127. A cohort
study from the Netherlands found that shipyard welders were 20% more likely than other workers
to leave their job due to health reasons, including respiratory, cardiovascular, locomotor and
mental disorders. 103
The questionnaire responses indicated that welders were mainly exposed to welding fume
produced by MMA and MIG/MAG on mild steel. Previous cross-sectional studies that conducted
exposure measurements found that total dust concentration measured in the welder’s breathable
zone from MMA and MIG/MAG processes on mild steel could exceed the American Conference of
Industrial Hygienists (ACGIH) TLV of 5mg/m3. 65, 76, 85 Welding with MMA and MIG/MAG produces a

78
far higher fume formation rate (FFR) - hundreds of milligrams per minute – when compared to TIG
(tens of micrograms per minute) because of the use of consumables such as flux-coated
electrodes (MMA) and core-wire (MIG/MAG).19 Metal oxides frequently found in MMA on MS
fume are, ordered by concentration, Fe, Mn, Si, Na, F and K; whereas MMA on MS fume metals
include Fe, Mn and Si.23
Three previous cross-sectional studies found the concentration levels of Fe to exceed the
recommended TLV51, 76, 84; whereas three other studies found Fe concentration to be lower than
TLV threshold47, 64, 67. Although exposure measurements were not conducted for this study (but
see Chapter 4), welders reported inconsistent use of PPE and it is likely that welders in this
shipyard are exposed to high concentration levels of metal oxides. Such exposure is likely to be
higher during working shifts that take place inside ships where poor ventilation is coupled with
inconsistent use of PPE and working in confined spaces. Two previous studies measured the
highest concentration of metal PM when welding in confined and poorly ventilated spaces.14, 76
In this survey, reported respiratory symptoms and illnesses were infrequent overall. Metal fume
fever (MFF) was ‘ever’ reported by a quarter of welders with more than half of these not reporting
it in the previous year. MFF is an acute influenza-like respiratory complaint with a quick onset and
short-lived symptoms after exposure to metal fume containing zinc oxides and welders and
metalworkers in galvanizing plants are most at risk.128-130
Overall, lower respiratory tract symptoms (including work-related ones) were less frequent than
reported MFF. The seasonal pattern that emerged from questionnaire data is suggestive of an
infectious aetiology since the level of exposure to welding fume does not differ by season.
Although a small proportion of symptoms were reported during summer months, it was in winter
that high peaks were observed overall. Had these symptoms been observed throughout the year,
a non-infectious, probably ‘irritant’ aetiology would have been a plausible interpretation. The
highest peak was recorded in January when the daily average maximum temperature in Dubai was
25 °C and the lowest average was 17 °C (compared to July’s 42 °C and 33 °C).127 This finding is not
surprising given the known seasonal cycle of respiratory infections131 and increased risk of
transmission attributable to the presence of major hub airports, such as Abu Dhabi’s, Dubai’s and
Sharjah’s, where multiple close contacts between individuals provide a fertile ground for person to
person transmission.132 In the UAE, respiratory infections were reported to be the second most

79
common non-life threatening health issue in 2010 and, because of this, respiratory disorders were
identified as one of four major public health issues in the country.132 Multivariable analysis
confirms that symptoms were, overall, twice more likely to be reported in summer than in winter.
When the prevalence of respiratory symptoms in welders was compared to that of non-welders,
the former disproportionally experienced the burden of these in winter with a quarter of welders
reporting cough, phlegm, shortness of breath and wheezing (compared to one in eight of non-
welders). There was no observed difference between the groups of workers during the summer
months. Multivariable analysis confirmed that welders were indeed more at risk of reporting
respiratory symptoms (including work-related ones), particularly if they were ever smokers. The
borderline p-value for the effect modification of smoking and work-related symptoms seems to
support the finding of heightened risk among smoking welders for work-related symptoms. The
test for effect modification by season, however, was not significant; this could be due to small
numbers included in the analyses.
Previous cross-sectional studies found a statistically significant increased prevalence in welders of
both upper and lower respiratory tract symptoms and infections.49, 55, 64, 65, 76, 81, 84 It is not always
clear whether non-chronic (often described as ‘acute’) bronchitis reported in previous studies
actually refers to a lower respiratory tract infection or it is simply an early sign of chronic
bronchitis that did not meet the MRC definition. Nevertheless, as previously shown in Chapter 2,
welders have a higher risk of reported respiratory tract symptoms, airways conditions (such
chronic bronchitis and asthma) and probably infections.
There is agreement over the increased susceptibility of welders, and other workers exposed to
metal fume, to lobar pneumonia following analyses of occupational mortality data in England and
Wales that highlighted excess deaths in welders predominantly attributable to this condition.133
Invasive pneumococcal disease (IPD) in welders has recently been the centre of attention
inasmuch as welders have been identified as a potential group of individuals at occupational risk
of IPD and for whom an immunisation programme should be considered (after assessment of
exposure control measures in use).110, 134 Lobar pneumonia is generally caused by Streptococcus
pneumoniae bacteria commonly found in the upper respiratory tract and transmitted through
person to person direct or indirect oral contact.135 Of the four cross-sectional studies that
reported specifically on the prevalence of pneumonia only two found this to be higher in

80
(smoking) welders64 and older welders regardless of smoking status.49 However, the remainder did
not find any difference between welders and non-welders.65, 76 One study on shipyard employees
work absences found that smoking welders have longer spells of both upper and lower tract
respiratory diseases.105
A possible pathological mechanism that makes welders more susceptible to (winter) respiratory
infections, could be the effect that high concentrations or overload of iron (siderosis) have in
impairing the host lung’s immune response by means of free radical damage leading to
macrophage cytoxicity.136 Animal studies have also shown how inhalation of non-metals such as
fluoride (present in welding electrode fluxes) supresses lung antibacterial mechanisms in rats3.
Sensitivity analysis looking at respiratory symptoms in relation to years of welding did not find any
difference in prevalence. The assumption underpinning such analysis was that an increased
prevalence of symptoms would have been observed with a greater number of years of welding
and therefore a cumulative exposure effect. However, as previously shown by studies looking at
lobar pneumonia deaths and infectous pneumonia from metal fume exposure, the risk of
respiratory infections is likely to be temporary and of an acute nature.137, 138
No difference in lung function measurements was observed in this sample. As shown in Chapter 2,
the majority of published cross-sectional studies47-49, 52, 57-61, 67, 71-74, 79, 82-85 found a decrement in
lung function in welders although a few, four studies, did not measure any difference;50, 53, 64, 86
four further studies found a decrease in lung function that was attibutable to smoking and not
welding.69, 75, 80, 81 In our study, stratification by smoking status and sentistivity analyses did not
show any changes in lung function. As mentioned in Chapter 2, a systematic review of longitudinal
studies among welders looking at lung function decline found this to be associated with smoking.33
One limitation in observing any lung impairment in relation to cumulative welding fume exposure
and older age in this study could be explained by a healthy worker effect. Welders with impaired
lung function are more likely to have left their job, thus leaving only welders with healthy lung
function; the transient nature of this workforce is likely to encourage workers with ill health to
return to their country of origin.
Further, the majority of PM produced during arc welding processes is of a respirarable and ultra
fine (UFP) fraction with an aerodynamic diameter <0.5 µm.2 Such fine metal particles are likely to
81
be deposited and remain trapped in the small airways of the lungs (bronchioles and alveoli) and
thus to activate clearance by phagocytosis of alveolar macrophages to engulf such foreign
particles.139, 140 It has been suggested that such deposition could lead to a type of pulmonary
fibrosis known as occupational desquamative interstitial pneumonia (DIP)35 characterised by a
build-up of intra-alveolar macrophages in the lung’s distal airspace.141 Since restrictive lung
patterns are usually absent with DIP,141 lung function measurement alone might not be able to
detect restriction and might explain why it is not always possible to detect lung function changes.
The lower FVC among Filipinos and FEV1/FVC in Pakistani could perhaps be due to ethnic
physiological differences.
The overall prevalence of arrhythmia and angina pectoris was low and no difference was found
between welders and non-welders. A previous cross-sectional study conducted in Norway in a
stainless steel welding factory found that welders had an adjusted OR of 2.61 (1.2 to 5.7) for
angina pectoris compared to non-welders.142 In this study welders were on average ten years
older than those in our study and, as the risk of angina increases with age with over 45 year olds
being more at risk,143 this might explain the low overall prevalence that we found and no
difference between the groups of workers. Conversely, a prospective cohort study looking at
cardiovascular disease among Danish welders over 20 years found no increased risk for angina
pectoris in welders, whom had a mean age of 42 years, when compared to the general population
after adjustment for age, smoking and alcohol intake.30 As the authors highlighted, the Danish
study is likely to have underestimated the risk of angina as the cardiovascular health data used
were collected from hospital admission records and did not include all other events that might
have been treated by general practitioners.30
In sensitivity analysis, however, the risk of angina in welders decreased by 1% for every year of
welding irrespectively of age, alcohol intake and obesity. After taking into account the small
number reporting angina and therefore the estimate’s wide confidence interval and the marginally
significant p-value, this result suggests that a cumulative welding fume exposure might decrease
the risk of ischaemic heart disease (IHD). This finding, if compared to previous studies looking at
the effects of PM exposure on the occurrence of IHD, is surprising and can only be explained by a
healthy worker effect whereby welders with angina are less likely to be employed in such a
strenuous and physically active occupation as that of welders. A Swedish study looking at
mortality found, in the 1990 census records, welders to have disproportionally experienced IHD-

82
related deaths when compared to other workers; the author tentatively linked this excess
mortality to the inhalation of welding fume PM and inflammatory responses.144 Studies on air
pollution have robustly linked ambient PM exposure to an array of cardiovascular adverse
outcomes.145-153 A recent systematic review on the effect of occupational exposure to fine dust
and cardiovascular diseases concluded in a possible association between ambient PM and
increased risk of IHD mortality, non-fatal myocardial infarction (MI), heart rate variability (HRV)
and systemic inflammation (i.e. C-reactive protein).24 Adding to this, two successive studies on IHD
mortality and disease in occupational settings provided further evidence of the effects of fine
ambient PM.154, 155 The aforementioned review stressed, in its recommendations, the importance
of clarifying the role of intermediate cardiovascular outcomes in relation to workers’
cardiovascular health paying particular attention to the acute and chronic effects.
The intermediate cardiovascular outcomes measured in our study, such as haemodynamic and
vascular indices, were within normal parameters.156-158 PWV and AIx values are known to increase
with age,156, 157, 159 and they have been positively associated with premature coronary artery
disease,160 cardiovascular risk,159 hypercholesterolaemia,161 hypertension, diabetes (type 1 & 2),
smoking and obesity.162 Whereas AIx has been found to be a more sensitive surrogate measure for
arterial stiffness in young adults under the age of 50, PWV would better suited for older
individuals.157 It follows that out of the two measurements, AIx would have been able to detect
any difference in arterial stiffness in this study as 89% of shipyard workers were younger than 50.
Interestingly, the found slight decrease in PWV among smokers, supported by the highly
significant test for interaction, is in antithesis with the previous result that smoking significantly
increases arterial stiffness.163
The reason we did not observe any increase in AIx values in welders might be explained by the
findings of a cross-shift panel study looking at AIx among boilermakers exposure to welding fume
PM2.5.164 The study found that welding fume exposure had only an acute effect on vascular
function as AIx values measured soon after the working shift were increased, after controlling for
circadian variations, compared to those measured at baseline (pre-shift) and on next morning.
Welding fume exposure appeared to have a short-lived acute effect in increasing AIx values
possibly explained by the effect of PM2.5 on the sympathetic nervous system.164

83
Since we measured vascular function in the morning between 08:00 am and 10:00 am and not
after the shift, it could be that we were not able to detect any difference between the groups.
Further, in sensitivity analysis after adjustment, the increase of haemodynamic and vascular
indices with years of welding observed in the descriptive analysis disappeared and no association
of elevated risk was found. As for respiratory health analyses, the healthy worker effect and the
transient nature of this population are likely to have played an important role.
3.5 Limitations
Our study had several limitations. In primis, the unreliable data collected on hours of welding to
assess fume exposure precluded us from conducting a more in-depth analysis to explore any
possible dose-response relationship between welding fume and cardiorespiratory health.
Further, the transient nature of this workforce coupled with the inherently present healthy worker
effect bias in occupational health research,113 probably brought us to underestimate the risk that
welding fume exposure poses and prevented us from observing any effect on lung function and
preclinical cardiovascular outcomes as reported in previous studies. Cross-sectional studies and
occupational research looking at non-fatal health outcomes are particularly vulnerable to the
healthy worker effect bias.113 In addition, although cross-sectional study designs are relatively easy
to conduct, useful for generating hypotheses for further research and to observe associations
between risk factors and outcome, a major pitfall is the inability to ascertain an exposure-outcome
temporal relationship to allow any inference on causality to be made.112
The cultural dimension that provided the backdrop for this study brings us to call into question the
reliability on alcohol intake data and consequently to ponder over the results of the cardiovascular
health analyses. Although alcohol consumption is permitted in designated establishments, such as
hotels and bars, it is strictly prohibited in workplaces since the UAE is a Muslim country. For this,
the shipyard runs random alcohol checks on the workforce. In turn, even if the majority of our
study participants were not Muslim, as those from Bangladesh and Pakistan, it is possible that the
alcohol-free shipyard policy and the alcohol checks are likely to foster unwillingness in participants
to divulge accurate information on alcohol consumption in response to the yard’s alcohol testing.

84
3.6 Conclusion and future research
This is the first study to propose a possible association between welding fume exposure and a
seasonal pattern of respiratory symptoms suggesting a heightened vulnerability of welding fume
exposed workers to respiratory infections with a possible effect modification by smoking. In spite
of the challenges conducting epidemiological research in a busy working shipyard present, the
successful completion of this study with a high response rate provides a solid basis for conducting
future health research with this workforce.
In order to explore further the found associations between welding fume exposure and cardio-
respiratory health a longitudinal study will be needed. Particular attention should be paid to
understanding the value of preclinical cardiovascular outcomes and to conducting a detailed
microbiomic, seasonal surveillance of this workforce for to explore the association between
welding fume and respiratory infections.

85

86
CHAPTER 4: Respiratory infections and welding fume exposure -
an examination of a workplace database.
4.1 Research aim and objectives
In chapter 3, an important result from the cross-sectional survey suggested that welders are more
susceptible to respiratory infections than non-welders. The aim of this chapter is to explore this
potential relationship further by analysing historical data collected over 11 years (2000 to 2011) by
the shipyard’s medical centre. The focus will be to measure and compare the infection rate of
respiratory infections in groups of employees variously exposed to welding fume.
Since 2000, the medical centre at DDW-D has comprehensively recorded every employee’s
encounter. These opportunistic medical data were linked to the employment records of every
employee.
4.2 Methodology
4.2.1 Target population, employment and medical data
Before the datasets could be transferred, ethical approval was sought on 23 January 2012 and
obtained on 30 April 2012 from the Imperial College Research and Ethical Committee
(ICREC_12_3_1).
Overall, 15,956 men employed permanently at Drydocks World Dubai between 1 January 2000
and 31 December 2011 were included in the analysis; we did not include women or contractors’
staff (Figure 4.1).
Anonymised employment and medical data up until 31 December 2011 were obtained from the
yard separately. Albeit the yard uses a centralised electronic system to store all the information
relating to its employees, not all information is accessible by all departments within the yard. For
this reason, the medical data were received separately from the employment history data; the
two sets of data shared the same employee identification number (EmpID) by which they could be
linked after a series of consistency checks were performed.

87
4.2.2 Employment records data handling
The employment dataset, which is used for personnel and payroll purposes, included 18,900
records from 1979 to 2011; each record contained information on 17 entries from the employee’s
demographics to their employment history while at the yard (Table 4.1). From the original list of
departments and sections received in the employment record dataset, only 46 (out of 73)
departments and 94 (out of 123) sections were kept for the analysis. Twenty-seven departments
(and 29 sections) from the nearby Dubai Maritime City and Al Jadaf Shipyard were excluded
(Figure 4.1).
There were 694 different job descriptions (skill description). All employees were assigned to one of
27 occupation groups in order to identify and distinguish the welders from the non-welders and to
identify different levels of exposure to welding fume.
Figure 4.1. Study cohort
18,900 workers were employed at the three different yards
from 1979 to 2011
680 workers who were employed at either Dubai
Maritime City or Al Jadaf yard were excluded
18,220 workers were exclusively employed at
Drydocks World from 1979 to 2011
166 female workers were excluded.
2,098 male workers were excluded because stopped working before 01.01.2000 (when the cohort started)
15,956 eligible male workers were entered in the analyses of
the cohort

88
Table 4.1 List of employment variables: 1979 to 2011
- Employee ID code - Department code - Department name - Section code - Section name
- Skill code - Skill description - Nationality - Gender
- Date of birth - Age - Date of join - Quit date
- Normal hours - Overtime hours - Leave Hours* - Sick hours
* Excluding: sick & business leave
Table 4.2 List of occupations by occupation groups
Welding occupation groups Occupations N (%)
Wel
der
s High (n=2,150) Welders 2,150 (13)
Medium (n=2,492) Boilermakers 71 (0.4) Platers 2,421 (15)
Low (n=1,224) Pipe-fitters 1,224 (7.7)
No
n-w
eld
ers Non-exposed (n= 9,067)
Blue-collar workers 164 (1.0) Carpenters 139 (0.9) Cleaners 524 (3.3) Dock workers 305 (1.9) Drivers 434 (2.7) Electricians/Wiremen 854 (5.4) Engineers 206 (1.3) Firemen 363 (2.3) Hydraulics workers 71 (0.4) Insulators 91 (0.6) Maintenance 123 (0.8) Masons 37 (0.2) Mechanical 1,473 (9.2) Metal worker/galvanizing dept. 55 (0.3) Riggers/Machinists 920 (5.8) Safety workers 104 (0.7) Security wardens 500 (3.1) Stagers/Scaffolders 1,117 (7.0) Store keepers 91 (0.6)
Smoke/paint/blast-workers (n= 1,859)
Firemen 363 (2.3) Painter/ Blasters 1,496 (9.4)
Office/Medical staff (N=1,023) Medical staff 36 (0.2) Office workers 987 (6.2)
Total 15,956 (100)
Subsequently the non-welders were grouped into 23 different occupations (Table 4.2) by using the
information on skill description, skill code, section name, section code, department name and
code. This was achieved with an MS Excel and STATA V.13 (STATA CORP.) .

89
A ‘blue-collar’ worker group included all of those workers whose skill description could not be
included in any of the other 22 occupation groups of the non-welders; these included mainly
fitters and workers described as ‘labourers’.
Finally, five main occupation groups were created: welders, non-welders, workers exposed to
smoke, solvents (painters) and dust (sandblasters) and office workers. Welders were classified
according to three levels of exposure: high, medium and low according to the proportion of their
work devoted to welding, based on job title.
4.2.3 Medical records data handling
Whether employed records were received as one dataset, medical data were avoidable as
separate datasets for each of the 11 years. The employment data included information on every
employee ever employed at the yard the medical data, however, only contained opportunistic
data of those employees who had a health event for which they had sought medical attention. In
addition, the medical datasets included medical records for contractors and non-permanent
employees who, as mentioned above in section 4.3.1, were excluded from the analysis.
Table 4.3 List of health variables*: 2000 to 2011
- Employee ID code - Year - Employee type - Complaint number - Complaint date - Complaint
- Diagnosis code - Diagnosis - Classification code - Classification - Injury cause - Injury type
- Body part - Remarks - Symptoms - Treatment - Special treatment - Medicine
- Visit status - Sick leave start date - Sick leave end date - Sick leave hours - Total hours lost
*Excluding: hours lost, recommended sick leave days, referred to hospital, admitted to hospital In 2006, a new system for storing health records was introduced and in the process of transferring
the information recorded during the 2000-2005 period, some of the information was lost or stored
differently. The information contained under “Diagnosis code” and “Diagnosis” variables was only
consistently available for the years from 2006 to 2011.
From 2000 to 2005, these were intermittently filled in and a recoding/allocation process of
diagnosis and diagnostic codes was implemented. Specifically, the 2005 dataset did not have

90
diagnostic codes assigned but had textual information on diagnosis, whereas the datasets from
2000 to 2004 had inconsistently completed information on both diagnostic codes and diagnosis.
Thus for the years between 2000 and 2005, there were three different types of medical record:
Type 1) complete medical records with diagnostic codes and diagnosis assigned (from 2005);
Type 2) complete diagnosis but missing diagnostic codes (from 2000 to 2005);
Type 3) missing diagnosis and diagnostic codes (from 2000 to 2004).
4.2.4 Recoding of diagnosis for the 2000-2005 period
All datasets containing medical data on permanent employees from 2000 to 2005 were merged
into one dataset. The merged dataset was separated out according to the types listed above.
Records of types 2 and 3 required diagnostic codes and diagnosis. A complete list of all 401
diagnosis and diagnostic codes ever recorded in the yard (A.4.1) was provided by the yard’s data
manager Ms Anila Ali. From this list, outcomes/complaints with a respiratory, cardiovascular,
ophthalmic or neurological origin were identified and used for assigning the codes to the type 2
medical records; in total 37 outcomes of interest were identified (Table 4.4).
Specifically for type 3 medical records, information on diagnosis and/or symptoms was recorded
under the “Remarks” variable instead of being under “Diagnosis”; these were used to populate
the empty fields of the diagnosis variable.
The retrieved diagnosis information under the “Remarks” variable was recorded as a mixture of
symptoms and conditions. These had spelling inconsistencies that would not allow a
straightforward linkage between diagnostic codes from the list in table 4.4 to be allocated.
Therefore, a coding system was devised to allow comparison of these records with the 2006-2011
period; a second index list of diagnosis and diagnostic codes was manually created by filtering the
4,071 retrieved diagnosis data and assigning the diagnostic name and codes according to the first
index list received from the yard (Table 4.4). An example of the manually coded index list can be
seen in A.4.2. All coding of medical data was performed blind from the employment data and thus
the occupation groups.

91
Table 4.4 List of selected outcomes for analysis
Code Diagnosis
Res
pir
ato
ry
(N
:18
)
D200 Asthmatic Bronchitis D114 Breathing Difficulty D300 Bronchitis D328 COPD- Non Occupational D327 COPD- Occupational D029 Chronic lung disease r188 Chronic Sinusitis D124, D385 Sinusitis D066 Exposure to smoke / fumes D027 Influenza D030 Lung disease- occupational D343 Metal Fume Fever D028 Pneumonia D118 Rhinitis r313 Sore Throat D007, D370 Tuberculosis D000, r026 Upper respiratory tract infection D232 Welding Smoke Inhalation
Car
dio
vasc
ula
r (N
:6)
D022, D023 Hypertension r223 Hypotension D024 Ischemic heart disease r025 Pulmonary Heart Disease D262 Cerebral Vascular Accident D378 Myocardial Infarction
Op
hth
alm
ic
(N
:7)
D330 Cataract D018 Conjunctivitis D088 Eye Irritation D075, D076 Foreign body-eye D212 Pterygium D082, r131, r190, r189 Stye D019 Welding flash
Ne
uro
logi
cal
(N:6
)
D324 Bell's Palsy D133 Dizziness D135 Headache D115 Migraine D162 Vertigo D255 Weakness

92
4.2.5 Diagnostic code assignment database
A four-stage process for assigning the codes to the data types 2 and 3 was devised by means of a
series of queries, in an MS Access purposely built database. The medical datasets were imported
into the database and linked to one of the index lists of diagnosis and codes. The queries assigned
a) diagnostic codes; b) information on type of complaint and; c) whether the outcome/complaint
was a chronic (non-repeatable condition) or not.
Table 4.5 illustrates the various queries, records used and the number of assigned codes to
outcomes/complaints.
Overall, in the eleven year period, there were 298,727 records of the various medical respiratory,
cardiovascular, ophthalmic and neurological outcomes/complaints. Of these, 39,305 were chronic
and 259,422 were acute conditions.
Acute conditions were further grouped into three aetiological groups: infections, mechanical and
non-mechanical/symptoms (see Table 4.6).
Table 4.5 List of queries used for assigning diagnostic code to the 2000-2005 data
Query name Table name Index list used Total Coded To code
A) Add codes to table with diagnosis
2000-2005 no codes + diagnosis
List 2011-2000 diagnostic codes complete unique 41,412 22,978 18,434
B) Add codes to query A table with manual list
A) added codes to table with diagnosis
List 2000-2005 manually diagnostic codes 18,434 3,766 14,668
C) Add codes to table with manually assigned diagnosis
2000-2005 added diagnosis & no codes
List 2011-2000 diagnostic codes complete unique 164,876 52,328 112,548
D) Add codes to query C table with manual list
C) added codes to table with manually added diagnosis
List 2000-2005 manually diagnostic codes
112,548 34,016 78,532

93
Table 4.6 Acute conditions grouped by aetiology
Aetiology Acute conditions Total
Infections (n: 201,404)
Conjunctivitis 4,233 Bronchitis 815 Influenza 73 Rhinitis 36 Sinusitis 1,272 Sore Throat 1,521 Stye 3,800 URTI* 190,409 Viral Conjunctivitis 60
Non-mechanical/symptoms (n: 46,960)
Haemoptysis 35 Dyspnoea 44 Breathing Difficulty 142 Chest pain/ Breathing 221 Vertigo 423 Visual disturbances 1,508 Weakness 2,878 Chest Pain 3,906 Dizziness 5,541 Headache 15,146 Eye Irritation 16,301
Mechanical (n: 11,078)
Cough & smoke inhalation 9
Metal Fume Fever 9
Welding Smoke inhalation 14
Injury to eye 27
Exposure to smoke/fume 135
Welding flash 538
Foreign body in eye 10,346
Total 259,422
*URTI: upper respiratory tract infection

94
4.2.6 Data analyses
In line with the aim of this chapter, the analysis will only focus on the relationship between
welding fume exposure and respiratory infections. The increased risk of welders in reporting
respiratory infections found in the cross-sectional survey will be thus explored further. Following a
series of consistency checks, three workers were excluded from the initial cohort The data were
analysed using STATA V.13 (Stata Corp.) and p<0.05 was considered significant.
Figure 4.2 Study cohort for respiratory infections analysis
15,956 eligible male workers
1 worker’s date of join was reported in 1900 1 worker had no employment data 1 worker’s first date of employment recorded after date
of medical visit
15,954 eligible male workers were entered in the analysis
Outcome of interest
For each individual who presented to the shipyard’s medical centre the numbers of visits were
calculated to include different respiratory infective symptoms/diagnoses of bronchitis, influenza,
pneumonia, shortness of breath, sinusitis, sore throat, tuberculosis or URTI. If an individual had
three visits for URTI and two visits for bronchitis, for instance, five visits were calculated and
assigned to that individual.
In order to distinguish between visits for the same complaint, such as follow-ups, first visits were
identified. All the visits recoded within 28 days after the first visit were considered as follow-ups
and therefore excluded. A visit recorded 28 days after the previous visit was considered a separate
complaint and counted as such.
Exposure of interest
The dichotomous exposure variable of being a welder or non-welder included in the cross-
sectional survey’s sampling frame was extended to include other non-welding shipyard employees

95
as outlined previously in section 4.2.2. Workers exposed to smoke, such as firefighters, to solvents
such as painters, and to dust, such as sandblasters (defined here as smoke/paint/blast workers)
and office workers were included in addition to non-welding shipyard workers and compared to
welders. As seen in chapter 3, the definition of the occupation group initially used to define the
sampling frame taken from the employment records and used in the cross-sectional did not
accurately reflect whether workers were exposed to welding fume.
Covariates and confounders
The regressions fitted were all adjusted for age, ethnicity, work duration at the shipyard and
season. Age was calculated as age at study entry. Four groups of the most frequent nationalities
were included with a fifth group for all the remainder nationalities because of small numbers.
Duration of employment was calculated between the recorded date of first employment and 31st
December 2011 (end of the follow-up period). Winter and summer seasons were defined in the
same way as in the cross-sectional survey.
Primary analysis
Incidence Risk Ratios (IRR) for the number of visits for the three exposure categories (non-welders,
smoke/paint/blast workers and welders, compared to the baseline office workers) were estimated
using a count regression model, with a negative binominal distribution instead of a Poisson
distribution due to the presence of over-dispersion. The office workers’ group was taken as the
referent group and, to explore any possible dose-response relationship, the other occupation
groups were ordered as follows: non-welders, smoke/paint/blasters’ group and welders; and then,
at a finer level of resolution, the three categories of welders (‘high’, ‘medium’ and ‘low’ exposure
welders) were used as outlined in section 4.2.2. The effect of season and its possible effect
modification was explored by formal testing with an interaction term in the regression (workers’
group*season) as seen in Chapter 3.
Secondary analysis
The population used for the cross-sectional survey was linked to the cohort dataset to create a
subset of the cohort data with added and accurate information on exposure collected by the
cross-sectional survey. The steps followed in the primary analysis were followed in the secondary
analysis for the subset of data.

96
4.3 Results
Between 2000 to 2011 the medical centre recorded 191,104 medical visits for respiratory
infectious diseases in 13,286 employees. After follow-up visits were excluded, 103,840 infections
from 13,286 employees were identified.
The overall median age of the cohort was 32 years (range: 19 to 71). On average,
fume/paint/blast-workers were one year younger [median: 31 (19 to 71)] and non-welders one
year older [33 [19 to 71)] than welders and office workers (p<0.001). The median length of
employment was four years (0 to 29) with office workers having slightly longer tenure than all
other occupation groups [4.2 (0 to 29); p<0.001).
Workers from Bangladesh were mainly employed as welders (58%) as in the cross-sectional study.
The most frequent nationality among the smoke/paint/blast-workers was Filipino (14%), in non-
welders Pakistani (62%) while office workers were from a mixture of other nationalities (17%); all
of these differences were statistically significant (p<0.001).
Welders were the group with the greatest number of respiratory infections recorded over the 11
years period with a median of six (0 to 55) episodes per individual followed by smoke/paint/blast-
workers [4 (0 to 55)] non-welders [3 (0 to 49)] and office workers [2 (0 to 49)]; these differences
were statistically significant (p<0.001). Among nationalities, workers from Bangladesh and
Pakistan had a median of six infections [(0 to 55) and (0 to 49) respectively] and workers from the
50 other nationalities had the lowest number with two (0 to 40) infections (p<0.001). Respiratory
infections were more frequent during winter months (p<0.001) with the highest peaks recorded in
October, November, December and March (Figure 4.3).
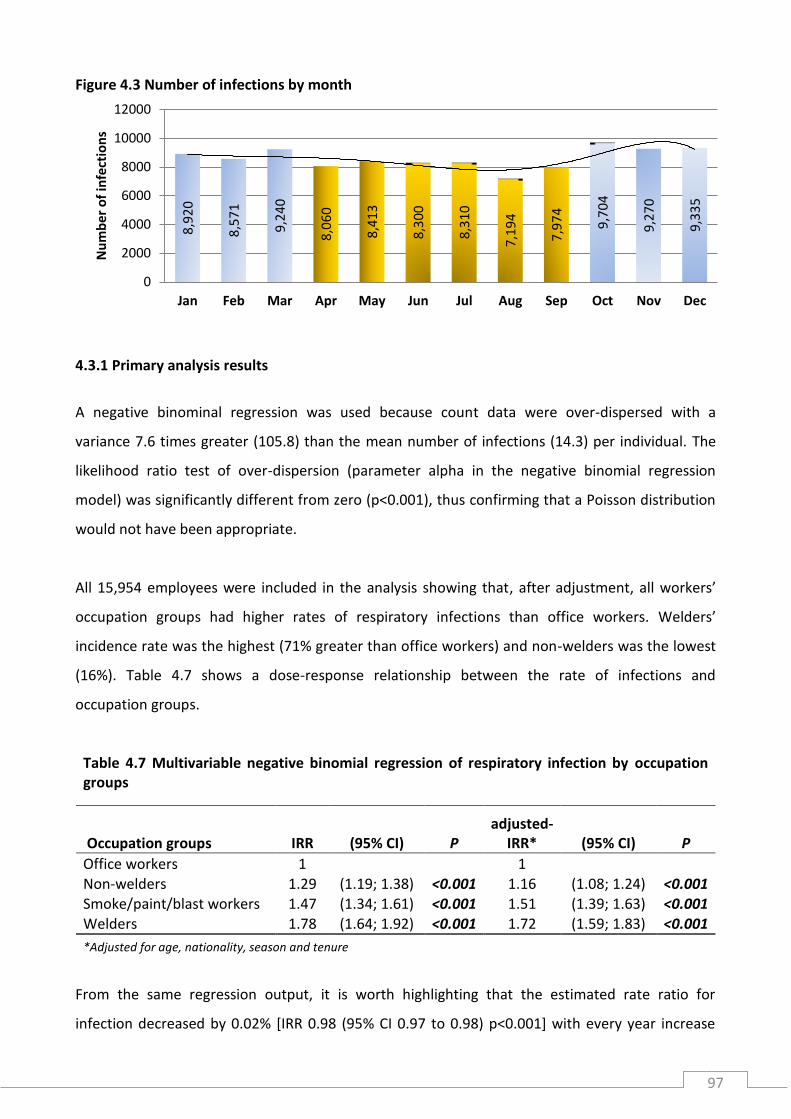
97
Figure 4.3 Number of infections by month
4.3.1 Primary analysis results
A negative binominal regression was used because count data were over-dispersed with a
variance 7.6 times greater (105.8) than the mean number of infections (14.3) per individual. The
likelihood ratio test of over-dispersion (parameter alpha in the negative binomial regression
model) was significantly different from zero (p<0.001), thus confirming that a Poisson distribution
would not have been appropriate.
All 15,954 employees were included in the analysis showing that, after adjustment, all workers’
occupation groups had higher rates of respiratory infections than office workers. Welders’
incidence rate was the highest (71% greater than office workers) and non-welders was the lowest
(16%). Table 4.7 shows a dose-response relationship between the rate of infections and
occupation groups.
Table 4.7 Multivariable negative binomial regression of respiratory infection by occupation groups
Occupation groups IRR (95% CI) P adjusted-
IRR* (95% CI) P
Office workers 1 1 Non-welders 1.29 (1.19; 1.38) <0.001 1.16 (1.08; 1.24) <0.001 Smoke/paint/blast workers 1.47 (1.34; 1.61) <0.001 1.51 (1.39; 1.63) <0.001
Welders 1.78 (1.64; 1.92) <0.001 1.72 (1.59; 1.83) <0.001
*Adjusted for age, nationality, season and tenure
From the same regression output, it is worth highlighting that the estimated rate ratio for
infection decreased by 0.02% [IRR 0.98 (95% CI 0.97 to 0.98) p<0.001] with every year increase
8,9
20
8,5
71
9,2
40
8,0
60
8,4
13
8,3
00
8,3
10
7,1
94
7,9
74
9,7
04
9,2
70
9,3
35
0
2000
4000
6000
8000
10000
12000
Jan Feb Mar Apr May Jun Jul Aug Sep Oct Nov Dec
Nu
mb
er o
f in
fect
ion
s

98
when all the other variables were held constant in the model. Overall, the four nationalities
specified in the analyses had higher rates of infection than the mixed nationalities group. The IRR
for workers from Pakistan and Bangladesh was 1.66 (1.55 to 1.78) and 1.64 (1.53 to 1.74)
respectively (p<0.001). Further, the rate of infections increased by 11% [1.11 (1.11 to 1.11)
p<0.001) for every year of tenure. In winter compared to summer, the IRR was 1.77 (1.70 to 1.85;
p<0.001).
When welders’ group was further subdivided by the three welding exposure categories to examine
any exposure-response relationship, there was an increase in risk with estimated exposure to
welding fume (Table 4.8).
Table 4.8 Multivariable negative binomial regression of respiratory infection by detailed exposure groupings
Occupation groups adjusted-
IRR* (95% CI) P
Office workers 1 Non-welders 1.16 (1.08; 1.24) <0.001 Firemen 1.12 (1.00; 1.27) 0.058 Paint/blast workers 1.61 (1.48; 1.74) <0.001 Welders: low 1.42 (1.30; 1.54) <0.001 Welders: medium 1.75 (1.62; 1.89) <0.001 Welders: high 1.86 (1.72; 2.01) <0.001 *Adjusted for age, nationality and tenure
In winter, compared to office workers, all the other workers’ groups had increased rates of
infections with non-welders having the smallest rate increase (16%) and welders the greatest
(78%). In summer months, welders still had an increased rate of infections but this was 49% lower
than that in winter. Even in summer welders and smoke/paint/blast workers had a higher rate of
infection than office workers but non-welders’ IRR crossed 1.0 and thus was not statistically
significant (Table 4.10). When an interaction term for rates of infection between season and
occupation groups was added to the model, this showed a highly statistically significant p-value
(p<0.001).

99
Table 4.9 Multivariable negative binomial regression of respiratory infection by occupation groups and season
Winter Summer
Occupation groups adjusted-
IRR* (95% CI) P adjusted-
IRR* (95% CI) P
Office workers 1 1 Non-welders 1.16 (1.08; 1.26) <0.001 1.08 (0.97; 1.21) 0.158 Smoke/paint/blast workers 1.57 (1.43; 1.71) <0.001 1.16 (1.02; 1.32) 0.024 Welders 1.78 (1.65; 1.93) <0.001 1.29 (1.15; 1.45) <0.001
*Adjusted for age, nationality and tenure
4.3.2 Secondary analysis results
When the data collected in the cross-sectional survey were linked to the historical medical centre
data, five participants (3 welders and 2 non-welders) were not present in the cohort data. When
comparing the occupation groups from the historical data to the information on arc welding
reported in the cross-sectional survey, almost a third (32%) of those defined as welders did not
report arc welding during the survey.
Workers who reported welding in the cross-sectional survey had a higher infection IRR than non-
welders with a 26% increase overall and in winter (Table 4.9). As in the cross-sectional results, the
test for interaction was not significant (p=0.110).
Table 4.10 Multivariable negative binomial regression of respiratory infection by occupation groups and stratified by season
adjusted-IRR* (95% CI) P
Occupation groups Non-welders 1 Welders 1.26 (1.10; 1.44) 0.001
Winter Non-welders 1 Welders 1.26 (1.08; 1.47) 0.003
Summer Non-welders 1 Welders 1.17 (0.87; 1.57) 0.306 *Adjusted for age, nationality, season and tenure

100
From the same model, the estimates for IRR were not statistically significant for age and
nationality; the rate did however increase by 10% with every year of employment [1.10 (1.08 to
1.12) p<0.001].
4.4 Discussion and conclusions
The aim of these analyses was to explore further the findings obtained in the cross-sectional
survey where a higher risk was found among welders compared to non-welders in reporting
respiratory symptoms that were likely, given their seasonal pattern, to be of an infectious
aetiology.
These analyses provide additional and stronger evidence that welders have an increased risk and
are more susceptible to respiratory infections than other workers employed in this shipyard,
particularly in winter. Different levels of welding fume exposure resulted in an interesting
exposure-response relationship whereby highly exposed full-time welders had higher rates of
infections of lower exposed welders. These results also provide further supporting evidence to the
proposed infectious aetiology of the respiratory symptoms reported in the cross-sectional and the
effect modification of such risk by season. In sensitivity analysis, similarly to the analysis of cross-
sectional data in Chapter 3, the effect modification by season could not be confirmed. This could
be explained by the lack of power of the cross-sectional survey in detecting such difference.
It is important to bear in mind that respiratory infections have an airborne route of transmission
and are therefore easily transmitted between individuals living and working in close proximity. The
different pattern of infection rates observed by occupation groups could be partly explained by
where non-office workers live. All such workers are likely to live in the residential accommodation
around the shipyard where, depending on the size of the room, up to six workers can share the
same apartment. In addition, the different pattern in rates of infection by nationality could be
explained by the shipyard’s flexibility in the allocation of who lives in such dwellings where it is not
uncommon that workers of same nationality live together.

101
4.5 Limitations
The definition of occupation groups, as shown both in Chapter 3 and the current one, represents a
pitfall in accurately ascertaining the workers’ exposure based exclusively on information held in
the employment records. It is likely that those workers defined as welders in the cohort data were
active welders when such data was collected and stopped welding by the time they were recruited
in the cross-sectional survey; however, this is difficult to establish accurately.
These analyses assume that the respiratory infections experienced by the workforce are reported
to the shipyard’s medical centre equally by employees in each worker group. It is important to
highlight the possibility that office workers, who reported the lowest rates of infections, could
seek medical care elsewhere.
Ultimately, these analyses were based on secondary data collected by a primary care facility. As
such, since they were not designed to be collected for research purposes, there are analytical and
interpretational limitations that cannot be addressed.
4.6 Conclusions
None of the previous cross-sectional studies was able to confirm their main findings with analyses
of a workplace medical database. In this respect, this highlights the advantages of carrying out
explorative analyses of workplace medical data, when these are available, while remaining a
financially viable option.
These results reinforce the finding that workers exposed to welding have a higher risk of
respiratory infections than other workers and that such increased susceptibility is possibly
mediated by exposure to welding fume.

102

103
CHAPTER 5: Panel (pilot) study
A cross-shift panel study is a type of longitudinal study design that allows monitoring and studying
the acute effects of a given exposure on health within a relatively short period – usually one or
more working shifts.
In the last thirty years, 17 panel studies of acute respiratory responses to welding fume exposure
have been published;50, 51, 56, 64, 165-178 eight of acute cardiovascular effects31, 32, 164, 179-183 and two
with metabolomic profiling following welding fume exposure.184, 185 No studies have yet been
published on adduct profiling in blood in relation to welding fume exposure. These studies just
mentioned have all been tailored to address the respiratory, cardiovascular and metabolomics and
adduct profiling separately.
5.1 Research aims and objectives
The primary aim of the WELSHIP panel cross-shift study was to measure and examine short-term,
welding-related cardio-respiratory effects by means of pre-, during- and post-shift measurements
in welders and non-welders employed at Drydocks World Dubai shipyard. Pre- and post-shift
measurements included all the assessments performed in the cross-sectional study (Chapter 3) as
well as biological samples collected to measure metal content in urine and to perform metabolic
and adduct profiling in blood. Throughout the working shift, a personal air-sampling pump was
used for exposure assessment of welding fume; and a 3-lead ECG Holter monitor to measure heart
rate variability (HRV).
The secondary aim was to assess the feasibility of performing the above measurements in a panel
study design with the intention of conducting a larger study in the same setting and population in
the future. By virtue of the complex nature of this study and the logistic challenges posed by its
implementation in a busy working shipyard, the WELSHIP panel study was conceived as a ‘pilot’.
5.2 Methods
5.2.1 Sample selection and target population
A subset of participants in the cross-sectional survey was selected, to include only full time
welders who reported welding for a minimum of five hours daily, and non-welders. Workers taking
regular medication for any condition were excluded.

104
The panel participants were all never-smokers from Bangladesh. Smokers were excluded to
circumvent any possible confounding effects of smoking. Bangla speaking workers were chosen for
three reasons: firstly, the majority of the cross-sectional survey participants were from
Bangladesh; secondly to streamline the translation of the study documentation (invitation letter,
consent form and questionnaires; see A.5.1); and thirdly to make the relatively small sample more
homogeneous.
Fifty participants (25 welders and 25 non-welders) were invited to participate from a sampling
frame of 114 eligible workers. The sampling frame did not include:
workers who had already left their job (n=6);
one worker who neither completed the questionnaire nor had a spirometry test in the
cross-sectional survey;
‘full-time’ welders who did not report any welding - all foremen (n=5);
‘non-welding’ workers who reported welding in the past (n=4).
Welders were ordered by years of welding experience in ascending order and those with the
fewest years of experience were selected first to reduce the effects of cumulative exposure to
welding fume; non-welders were frequency matched by age (in years) to welders (See sampling
frame of never-smoking workers A.5.2).
Panel participants were invited in a similar way to the cross-sectional participants (see Chapter 3,
section 3.3.2). Briefly, an invitation letter was sent to each participant’s department via internal
email; they were invited to come along to a group induction prior to the beginning of the study to
have explained the various tests they would be performing, to have the opportunity to ask
questions about the study and to be given an appointment. Appointments were scheduled daily
from 23 March to 01 June 2014; a 100% response rate was achieved as all of the first 50 invited
participants agreed to take part.
5.2.2 Survey timeline and fieldworkers’ training
The original WELSHIP protocol did not include the collection of biological samples for urine metal
content and metabolomic and adduct profiling. An amendment to the original protocol received
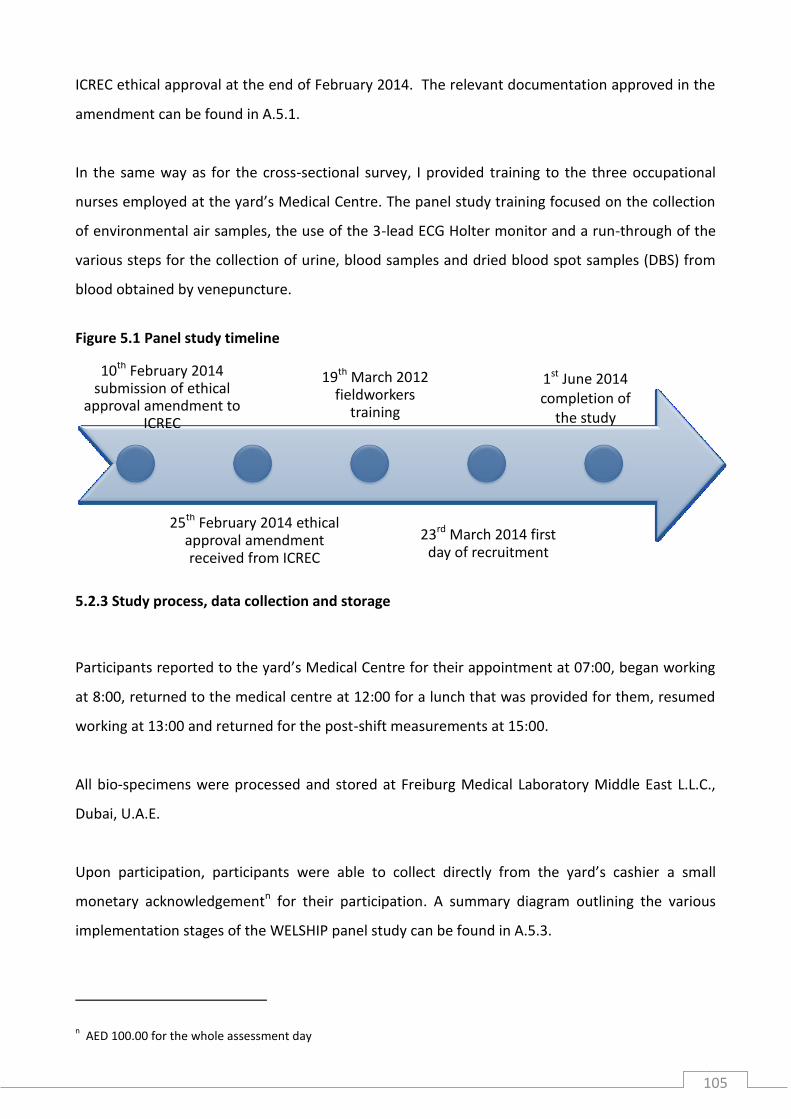
105
ICREC ethical approval at the end of February 2014. The relevant documentation approved in the
amendment can be found in A.5.1.
In the same way as for the cross-sectional survey, I provided training to the three occupational
nurses employed at the yard’s Medical Centre. The panel study training focused on the collection
of environmental air samples, the use of the 3-lead ECG Holter monitor and a run-through of the
various steps for the collection of urine, blood samples and dried blood spot samples (DBS) from
blood obtained by venepuncture.
Figure 5.1 Panel study timeline
5.2.3 Study process, data collection and storage
Participants reported to the yard’s Medical Centre for their appointment at 07:00, began working
at 8:00, returned to the medical centre at 12:00 for a lunch that was provided for them, resumed
working at 13:00 and returned for the post-shift measurements at 15:00.
All bio-specimens were processed and stored at Freiburg Medical Laboratory Middle East L.L.C.,
Dubai, U.A.E.
Upon participation, participants were able to collect directly from the yard’s cashier a small
monetary acknowledgementn for their participation. A summary diagram outlining the various
implementation stages of the WELSHIP panel study can be found in A.5.3.
n AED 100.00 for the whole assessment day
19th March 2012 fieldworkers
training
1st June 2014 completion of
the study
23rd March 2014 first day of recruitment
10th February 2014 submission of ethical
approval amendment to ICREC
25th February 2014 ethical approval amendment received from ICREC

106
Anthropometric measurements, arterial stiffness and spirometry
Details of the measurements performed on the appointment day are shown in Table 5.1.
Anthropometric measurements were performed only in the pre-shift assessment after the first
urine sample. Arterial stiffness estimation and spirometry were performed pre- and post-shift.
Details of how these data were collected can be found in section 3.2.3 (Chapter 3, pp. 60-61).
Table 5.1 Summary of the tests performed on the appointment day
Measurements
Pre-shift During-shift Post-shift
urine sample anthropometric measurements arterial stiffness pre-bronchodilator spirometry bronchodilator questionnaire blood sample dried blood spot post-bronchodilator spirometry
ECG Personal air-sampler
urine sample arterial stiffness pre-bronchodilator spirometry bronchodilator questionnaire blood sample dried blood spot post-bronchodilator spirometry
Questionnaire
The panel questionnaire was adapted from the one used in the cross-sectional survey. Specifically
formulated questions asked information relevant to the aim of the panel study (acute effects of
welding fume) and to aid the additional tests that were performed (see A.5.1). The questionnaire
was delivered twice, with pre- and post-shift questions.
A short food diary asked questions regarding food consumed at breakfast, lunch and dinner on the
day before the appointment and breakfast and lunch on the day of the appointment. In addition,
questions on beverages consumed and the approximate quantities of these were asked. This short
food diary was formulated to complement the results of metabolomic profiling in blood samples.
Questions on symptoms were asked during the pre- and post-shift assessments and specific
questions to welders were asked to detail the type of welding, base metal and consumables used
during the day of the assessment to inform the likely chemical characteristics of the welding fume
to which they were exposed (see Table 5.1).

107
Smoking questions were used to confirm that the workers chosen were non-smokers and to
document any exposure to passive smoking.
Additionally, welders were asked whether they had any health problems due to welding. This
question was included after having been suggested by a welder foreman during a small focus
group that took place prior to the start of the study.
Table 5.2 Welding consumables used frequently in the shipyard and typical chemical composition requirements set by the American Welding Society
E7018-1a E309La ER71T1b E316c
Carbon (C ) 0.15% 0.04% 0.18% 0.08% Manganese (Mn) 1.60% 0.5% - 2.5% 1.75% 0.5% - 2.5% Phosphorus (P) 0.035% 0.04% 0.03% 0.04% Sulphur (S) 0.035% 0.03% 0.03% 0.03% Silicon (Si) 0.75% 0.90% 0.90% 1% Chromium (Cr) 0.08% 22% - 14% - 17% - 20% Nickel (Ni) 0.30% 12% - 14% - 11% - 14% Molybdenum (Mo) 0.30% 0.75% - 2% - 3% Copper (Cu) - 0.75% - 0.75%
Mn + Ni + Cr + Mo + V 1.75% - - - a. MMA electrodes for mild-steel b. Different chemical compositions are achieved when welding with 100% CO
2 or 75%Ar/25% C0
2
c. Stainless steel electrodes
Urine samples
Two 50 ml samples of urine (one each pre- and post-shift) were collected in a polypropylene tube;
each sample was assigned a separate reference number. Methods to analyse urine samples
include:
• gas-chromatography and liquid chromatography, with mass spectrometry to detect metabolites
that the body might produce in response to exposures during the shift;
• inductively coupled plasma mass spectrometry to quantify the metals being excreted in the
urine (used as a biomarker of exposure); currently the list of metals considered for analysis
includes: iron, manganese, chromium, nickel, cadmium, copper, lead, molybdenum, arsenic and
selenium (non-metal);
• routine test for creatinine concentration (e.g. using the alkaline picrate method), which is
necessary to correct the concentrations of metals excreted in the urine.

108
Blood samples
Blood samples were collected with four ‘Vacutainers’, one for serum and three for EDTA whole
blood. In addition, a Guthrie card was spotted with eight drops of blood. The blood samples were
collected in the following order:
1. 4 ml of blood with Vacutainer for serum (Tube 1)
2. ~8 ml of blood with EDTA Vacutainer for buffy coat (Tube 2)
3. 8 spots of blood from the blood collection for Tube 2
Full details of the blood processing procedure can be found in A.5.4. In summary, at the laboratory
after centrifugation, blood samples were divided into aliquots:
Tube 1: am/pm 12 vials of 0.5 ml=6ml
am: 4ml divided into 6 of 0.5ml aliquot per person
pm: 4ml divided into 6 of 0.5ml aliquot per person
Tube 2: am/pm 6 vials of 2ml=12ml
am: 10ml divided into 3 of 2ml aliquots per person
pm: 10ml divided into 3 of 2ml aliquots per person
Welding fume sample collection
Environmental measurements for gravimetric analysis, oxidative potential and characterisation of
welding fume metals and metal compounds of the respirable fraction in the welder’s breathable
zone (~6 hours measurements) were performed using a Casella Tuff 4 Plus I.S. Teflon-coated
25mm Emfab™ filters (PALL 7219) and an IOM sampling head to collect PM2.5. The sampling head
was attached with safety pins to the overalls of the workers (see Pictures 5.3).
Specific foam filters were mounted onto the IOM sampling head for filtering out any coarse
particulates (PM10) and the pre-weighed Emfab filter was placed behind it to capture the
remaining fine particulates. After sampling, the Emfab filters were then stored in a fridge at 4oC
and sent to the MRC-PHE Centre for Environment and Health laboratory at King’s College London
for post-sampling weighing.

109
The air sampler’s airflow was set at 2.5L/min and calibrated and checked daily with a rotameter
before each sampling. At the end of each shift, the IOM sampling head was mounted onto the
rotameter to check the post-sampling airflow. Pre- and post-sampling airflow and sampling time
were recorded for gravimetric analysis.
Gravimetric analysis was conducted by calculating the PM2.5 concentration from the filter weights
and aerosol volume. Aerosol volume was calculated first by multiplying the volumetric airflow rate
(cubic meter per minute) by the sampling time (in minutes). Ultimately, the concentration of PM2.5
was calculated by dividing the final mass (mg) by the aerosol volume (Vs).
Volume of air sample (VS) in m3:
VS in m3= [𝐱̅ =
(𝑎𝑚_𝑓𝑙𝑜𝑤 𝑟𝑎𝑡𝑒+𝑝𝑚_𝑓𝑙𝑜𝑤 𝑟𝑎𝑡𝑒)
2
1000] ∗ (ℎ𝑟 𝑠𝑎𝑚𝑝𝑙𝑖𝑛𝑔 𝑡𝑖𝑚𝑒 ∗ 60 𝑚𝑖𝑛)
PM2.5 concentration in mg/m3
C=𝑀2 − 𝑀1
𝑉s
Where:
M1 = mass of filter before sampling (mg); M2 = mass of filter after sampling (mg); VS = volume of air sampled (m3)
HRV monitoring A 3-lead ECG Lifecard CF digital Holter monitor (Spacelabs Healthcare®) recorded ECG on
removable cards for approximately six hours. The hook-up adhesive electrode pads were
connected to the three leads; the skin pads were placed after cleaning, shaving and abrading the
skin to maximise adhesion and ECG recording quality (Pictures 5.2).
Pictures 5.1 Urine and blood sampling materials, blood and DBS collection

110
Pictures 5.2 ECG Holter monitor e. skin shaving; f. positioned electrodes; g. Holter monitor and neck holding pouch
Pictures 5.3 Air-sampling materials
i. IOM cassette and Emfab filter; j. PUF foam filter; k. loaded cassette IOM and sampling head; l/m/n. fitted air sampler in worker’s breathable zone o. Emfab filter before and after sampling on a welder; p/q. storage of filters after sampling; r. cleaning of IOM cassetes with ethanol after sampling

111
Storage of blood, urine samples and welding fume filters
All bio-specimens of urine and blood aliquots were stored at -80°C at the Freiburg Medical
Laboratory. After the blood samples were collected, these were kept at 4°C in the Medical Centre;
urine samples were kept at 4°C before freezing. Urine and blood samples were collected from the
Medical Centre twice daily and couriered for processing and storage at the lab. The DBS cards
were kept in dry condition at room temperatures in the WELSHIP study room of the Medical
Centre.
The Emfab filters were placed into 30mm petri dishes; after sampling the filters were kept, in
darkness inside a cardboard box, at 4°C together with field blank filters (see Pictures 5.4).
5.2.4 Statistical analysis
The statistical analysis was limited to the respiratory, cardiovascular (excluding HRV) and exposure
measurement outcomes. Additional funding is being sought to process HRV data, urine and blood
samples.
Outcomes of interest
As in the cross-sectional study, the outcomes of interest were divided into subjective outcomes,
reported respiratory and cardiovascular symptoms, and objective outcomes, measured lung
function and PWA (see Chapter 3, p. 63).
Subjective outcomes
Respiratory symptoms were grouped together to include any one or more of the following: cough,
phlegm, wheezing, shortness of breath or chest-illness. The questionnaire asked whether any of
the above symptoms were experienced before and during the working shift. The analysis looked at
those respiratory symptoms reported soon after the shift.
Objective outcomes
Post-bronchodilator measures of lung function considered were forced expiratory volume in 1
second (FEV1 in litres), forced vital capacity (FVC in litres), FEV1/FVC ratio as a percentage and
Forced Expiratory Flow rate (FEF25-75). Covariates used to analyse lung function data were age,
height and log-transformed (ln) PM2.5 concentration.

112
Arterial stiffness measures considered were pulse wave velocity (PWV m/s) and augmentation
index (%). Covariates used to analyse cardiovascular data were age, waist-hip ratio and ln-PM2.5
concentration.
Sensitivity analysis
All objective cardiorespiratory outcomes have been analysed in relation to total years of welding
experience, using the same covariates as for the main analyses.
The analysis looked at the percent difference between the pre- and post-shift measurements
within each participant (in both groups) and related these to welding fume concentration. The
non-welders’ group included four ‘full time’ welders who were recruited for the panel study but
did not perform any welding on the day of their assessment. Outcomes’ percentage difference
was analysed by fitting multivariable linear regressions. All analyses were performed with STATA
V.13 (Stata Corp.) and a p<0.05 was considered significant.

113
5.3 Results
5.3.1 Sample characteristics
As shown in Table 5.3, the samples’ median age was 37 (range 26 to 50) years with no difference
between welders and non-welders. Compared to the results from the cross-sectional study,
workers were, on average, one year younger; this mainly reflects the sampling strategy adopted to
select the panel participants. Further, there was no difference for all other anthropometric
measurements between the groups. Only four workers, all non-welders, reported having been
exposed to environmental tobacco smoke.
The study participants had been employed for a median of seven (3 to 20) years and welders had a
median of nine (3 to 26) years of welding experience in total. The most frequently reported
welding technique was MMA (stick) welding, with 15 (71%) welders performing a median of three
(1 to 4) hours. MIG/MAG welding was performed by four (19%) welders for a median of 4.5 hours
(2 to 5). Only one welder reported TIG welding (for five hours).
Welding was mainly performed in welding workshops on mild steel (MS) base metal and the most
frequently used consumable for MMA was E7018-1 that, as shown in Table 5.2, has high
concentrations of Mn and Mn+Ni+Cr+Mo+V compound. Welders reported consistent use of
breathing masks and satisfactory levels of ventilation, which is not surprising given the open-plan
set up of the welding workshops (see Pictures 1.3).
Personal exposure measurement was performed for an average of five (2.4 to 5.5) hours with no
difference between the exposure groups. Gravimetric analysis results showed that welders were
exposed to concentrations of PM2.5 as high as 5.69 mg/m3, higher than non-welder exposures. This
difference was statistically significant

114
Table 5.3 Sample characteristics by exposure groups
Characteristics Welders (n: 21)
Non-welders (n: 29)
Total (n: 50) P
Age - median (IQR) 35.9 (10.4) 37.3 (10.5) 36.6 (10) 0.852
Height (cm) - mean (SD) 163 (5) 165 (7) 164 (6) 0.371
Weight (Kg) - median (IQR) 68 (8) 68 (13) 68 (12) 0.523
Waist-to-Hip Ratio - mean (SD) 0.95 (0.04) 0.95 (0.04) 0.95 (0.04) 0.504 Passive smoking am - n (%) 0 3 (10) 3 (6) 0.128
Passive smoking during shift - n (%) 0 1 (5) 1 (2) 0.390
Tenure in years - median (IQR) 7 (2) 6 (3) 7 (3) 0.293
Total years of welding - median (IQR) 9 (8) - 9 (8) -
Worked on previous day - n (%) 20 (95) 25 (86) 45 (90) 0.293
Years of past welding - median (IQR) 5 (6) 4 (4) 5 (6) 0.121
Total years of welding experience - median (IQR) 9 (9) - - 9 (9) -
Hours welding - median (IQR)
MMA 3 (3) - - 3 (3) -
MIG/MAG 4.5 (2) - - 4.5 (2) -
TIG 5 (0) - - 5 (0) -
Electrodes used - n (%)*
E7018-1 11 (52) - - 11 (52) -
E309L 4 (19) - - 4 (19) -
ER71T1 5 (24) - - 5 (24) -
E316 1 (5) - - 1 (5) -
Shielding gas in GMAW & GTAW - n (%)
Argon 2 (10) - - 2 (10) -
CO2 5 (24) - - 5 (24) -
Argon/CO2 1 (5) - - 1 (5) -
Argon/Helium 2 (10) - - 2 (10) -
Welding base-metal - n (%)
Mild steel 17 (81) - - 17 (81) -
Stainless steel 4 (19) - - 4 (19) -
Breathing mask worn while welding - n (%)
Always 20 (95) - - 20 (95) -
Most of the time 1 (5) - - 1 (5) -
Bandana over mouth while welding - n (%)
Always 7 (33) - - 7 (33) -
Most of the time 2 (10) - - 2 (10) -
Never 12 (57) - - 12 (57) -
Satisfactory level of ventilation - n (%)
Always 14 (67) - - 14 (67) -
Most of the time 8 (33) - - 8 (33) -

115
Cont.
Characteristics Welders
n:21 Non-welders
n:29 Total N:50 P
Welding site in the shipyard - n (%)
Welding plain 2 (10) - - 2 (10) -
Workshop 19 (90) - - 19 (90) -
Cutting & grinding - n (%) 4 (19) 1 (3) 5 (10) 0.070
Hours of cutting & grinding - median (IQR) 1 (1.4) 1 (0) 1 (1) 1.00
PM2.5 concentration mg/m3 - median (IQR) 1.57 (1.69) 0.10 (0.07) 0.19 (1.10) <0.001 PM2.5 concentration mg/m3 – [range] [0.11 to 5.69] [0.01 to 0.53] [0.01 to 5.69]
Air-sampling time (min) - median (IQR) 306 (47) 307 (7) 306 (11) 0.443
Air-sampling time (min) – [range] [146 to 324] [203 to 332] [146 to 332]
* More than one reported
**Welding processes: MIG/MAG =Metal Inert Gas welding; MMA = Manual Metal Arc Welding (Stick); TIG= Tungsten Inert Gas welding.
5.3.2 Cardiorespiratory health analyses
Respiratory symptoms at baseline were low overall with no difference between the groups of
workers. Cough was the only symptom to be reported to develop during the shift; again, the
prevalence was low and no difference was detected in between welders and non-welders (Table
5.3).
Table 5.4 Respiratory symptoms prevalence and Odds Ratios: welders vs. non-welders
Welder (n: 21)
Non-welders (n: 29)
OR 95% CI P
Symptoms overall - n (%)
Pre-shift 4 (19) 4 (14) 1.47 (0.32 to 6.83) 0.621
During shift 2 (10) 1 (3) 2.95 (0.24 to 36.46) 0.377
Symptoms during shift - n (%)
Cough 2 (10) 1 (3) 2.95 (0.24 to 36.46) 0.377
Phlegm 0 0 0 0 0 - -
Wheeze 0 0 0 0 0 - -
Shortness of breath 0 0 0 0 0 - -
The average quality control score for the pre- and post-shift post-bronchodilator spirometry tests
was grade “A”; all spirometric tests were therefore included in the analysis. There was a mean
cross-shift decrease in post-shift FEV1 and FVC of 1.2% and 1.6% respectively (Table 5.4); welders
compared to non-welders had a greater decrease for both measurements although this difference
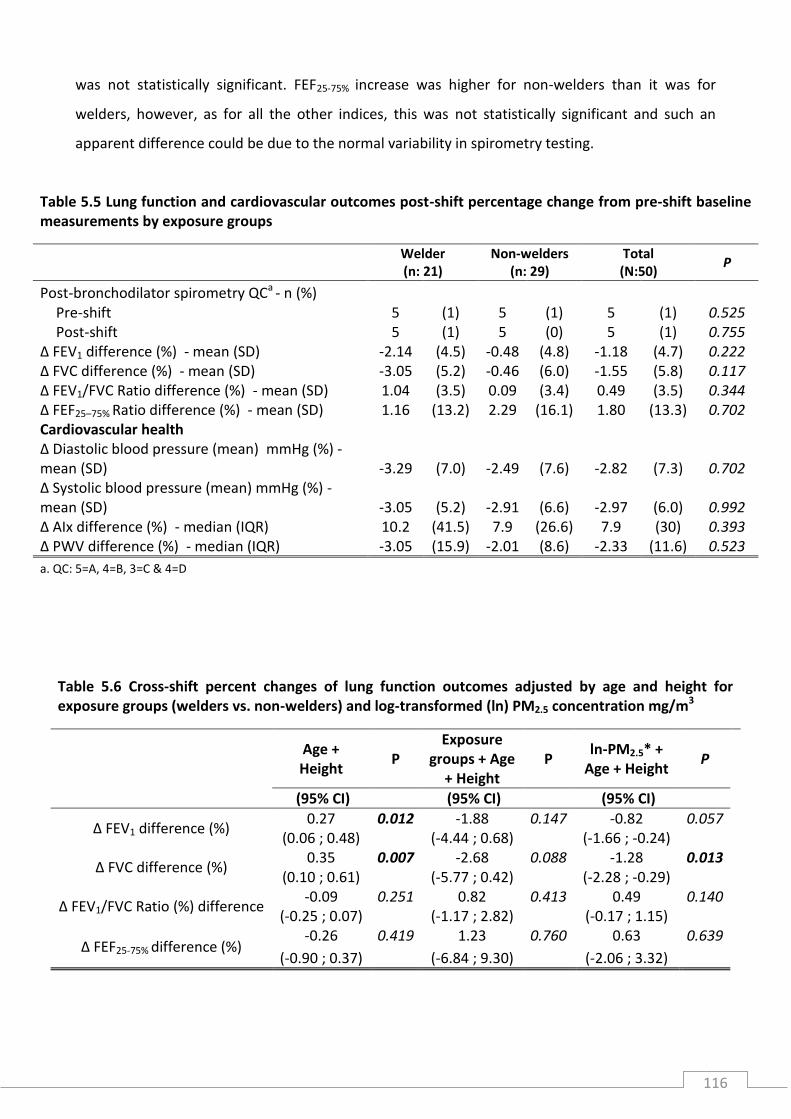
116
was not statistically significant. FEF25-75% increase was higher for non-welders than it was for
welders, however, as for all the other indices, this was not statistically significant and such an
apparent difference could be due to the normal variability in spirometry testing.
Table 5.5 Lung function and cardiovascular outcomes post-shift percentage change from pre-shift baseline measurements by exposure groups
Welder (n: 21)
Non-welders (n: 29)
Total (N:50)
P
Post-bronchodilator spirometry QCa - n (%) Pre-shift 5 (1) 5 (1) 5 (1) 0.525
Post-shift 5 (1) 5 (0) 5 (1) 0.755 Δ FEV1 difference (%) - mean (SD) -2.14 (4.5) -0.48 (4.8) -1.18 (4.7) 0.222 Δ FVC difference (%) - mean (SD) -3.05 (5.2) -0.46 (6.0) -1.55 (5.8) 0.117 Δ FEV1/FVC Ratio difference (%) - mean (SD) 1.04 (3.5) 0.09 (3.4) 0.49 (3.5) 0.344 Δ FEF25–75% Ratio difference (%) - mean (SD) 1.16 (13.2) 2.29 (16.1) 1.80 (13.3) 0.702 Cardiovascular health
Δ Diastolic blood pressure (mean) mmHg (%) - mean (SD) -3.29 (7.0) -2.49 (7.6) -2.82 (7.3) 0.702 Δ Systolic blood pressure (mean) mmHg (%) - mean (SD) -3.05 (5.2) -2.91 (6.6) -2.97 (6.0) 0.992 Δ AIx difference (%) - median (IQR) 10.2 (41.5) 7.9 (26.6) 7.9 (30) 0.393 Δ PWV difference (%) - median (IQR) -3.05 (15.9) -2.01 (8.6) -2.33 (11.6) 0.523
a. QC: 5=A, 4=B, 3=C & 4=D
Table 5.6 Cross-shift percent changes of lung function outcomes adjusted by age and height for exposure groups (welders vs. non-welders) and log-transformed (ln) PM2.5 concentration mg/m3
Age + Height
P Exposure
groups + Age + Height
P ln-PM2.5* +
Age + Height P
(95% CI) (95% CI) (95% CI)
Δ FEV1 difference (%) 0.27 0.012 -1.88 0.147 -0.82 0.057
(0.06 ; 0.48)
(-4.44 ; 0.68)
(-1.66 ; -0.24)
Δ FVC difference (%) 0.35 0.007 -2.68 0.088 -1.28 0.013
(0.10 ; 0.61)
(-5.77 ; 0.42)
(-2.28 ; -0.29)
Δ FEV1/FVC Ratio (%) difference -0.09 0.251 0.82 0.413 0.49 0.140
(-0.25 ; 0.07)
(-1.17 ; 2.82)
(-0.17 ; 1.15)
Δ FEF25-75% difference (%) -0.26 0.419 1.23 0.760 0.63 0.639
(-0.90 ; 0.37) (-6.84 ; 9.30) (-2.06 ; 3.32)

117
In multivariable analysis (Table 5.5) FEV1 and FVC percentage change increased 0.27% and 0.35%
for every year of age increase (controlling for height) which suggests that older workers
performed better in the post-shift spirometry than younger workers did. In an attempt to explore
this further, the scatter plots in Figure 5.2 would suggest that the better performance in the post-
shift spirometry is attributable to older non-welding workers. However, after testing for
interaction between age and being a welder or not, the interaction term’s p-values were not
significant (FEV1 Pinteraction=0.125 and FVC Pinteraction=0.065); therefore the observed difference of
the slopes of plots could not be confirmed.
In the second model, looking at changes by exposure group, there was no difference between
welders and non-welders for FEV1, and a borderline significant decrease of FVC by 2.68% in
welders versus non-welders. The final model that assessed changes for every unit increase of ln-
PM2.5 concentration (adjusted for age and height), showed that the only statistically significant
decrease was for FVC by 1.28%. The FEV1 decrease was borderline significant and all other changes
observed for FEV1/FVC% and FEF25-75% did not achieve significance level.

118
Figure 5.2 Scatter plots for FEV1 and FVC by age showing beta-coefficient for slope and 95% CI

119
Table 5.7 Cross-shift percent changes of lung function outcomes adjusted by age and waist-to-hip ratio (WHR), heart rate (AIx only) for exposure groups (welders vs. non-welders) and log-transformed (ln) PM2.5 concentration mg/m3
Age + WHR + HR
Exposure groups + Age + WHR +
HR
ln-PM2.5* + Age + WHR +
HR
(95% CI) P (95% CI) P (95% CI) P
Δ AIx difference (%) -3.42 0.290 -4.31 0.904 1.87 0.875
(-9.85, 3.01)
(-75.96, 67.34)
(-21.99, 25.74)
Δ PWV difference (%) -0.21 0.627 8.61 0.074 1.37 0.400
(-1.10, 0.67) (-0.87, 18.10) (-1.88, 4.62)
Note: only AIx was adjusted for AM heart rate
All post-shift cardiovascular measurements showed a percentage change from the pre-shift ones
(Table 5.5). Although none of them reached statistical significance, blood pressure and PWV
decreased from pre- to post-shift measurements and AIx increased in the afternoon. In
multivariable analysis (Table 5.7), AIx did not change for any of the models. PWV however,
showed a borderline statistically significant increase of 8.61% among welders compared to non-
welders. This result suggests that welders have a higher PWV reading in the post-shift
measurements.
When all of the respiratory outcomes were analysed in relation to number of welding years, the
only significant relationship seen was with FEV1, which after adjusting for age and height,
decreased by 0.50% [(-0.94 to -0.07) p=0.024] for every year increase of welding experience. None
of the cardiovascular outcomes, after adjusting for age and WHR, showed any difference in
percentage for years of welding.
5.3.3 Overview of remaining collected outcomes
As mentioned in section 5.2.2, additional funding will be required to process the data collected on
Heart Rate Variability (HRV) and biological samples (blood, dried blood spots (DBS) and urine)
collected. Table 5.8 shows that only one recording for HRV among welders was not collected due
to a recording failure of the Holder monitor; all of the remaining outcomes were successfully
collected for each of the fifty participants.

120
Table 5.8 Number of HRV recording, DBS, blood and urine samples collected for each participant
Welder (n: 21)
Non-welders (n: 29)
Total (N: 50)
HRV recordings – n (%) 20 (95) 29 (100) 49 (98)
Blood samples – n (%) Pre-shift 21 (100) 29 (100) 50 (100) Post-shift 21 (100) 29 (100) 50 (100)
DBS – n (%) Pre-shift 21 (100) 29 (100) 50 (100) Post-shift 21 (100) 29 (100) 50 (100)
Urine Samples – n (%) Pre-shift 21 (100) 29 (100) 50 (100)
Post-shift 21 (100) 29 (100) 50 (100)
5.4 Discussion
The primary aim of this panel study was to assess the acute effects of welding fume exposure on
the cardiorespiratory health of workers. The results from the initial explorative analyses showed
that exposure to welding fume was associated with an acute effect in lowering the lung function
of the large airways in the post-shift measurements; and that FEV1 decrease was inversely
associated with years of welding experience; no association was found between a welding shift
and the vascular function indices measured.
The weak evidence of FEV1 decrease with PM2.5 concentration is consistent with previous studies
that measured welding fume concentration and found no reduction in FEV1 across a welding
shift.50, 51, 64, 165, 167, 176 Only one study found that FEV1 decrease was correlated with Fe oxide
concentrations.169 The observation in this study that the FVC decrease post-shift was related to
higher PM2.5 mass concentration has not been reported before. Cross-shift effect of welding fume
have been shown to decrease lung function parameters and increase impulse oscillometric
parameters resistance.174 As shown in A.5.5, nine studies measured welding fume dust
concentration and none found this to be associated with a decrease in FVC. Only three specified
measurement of the PM2.5 fraction50, 174, 177 the remainder only referred to measuring total dust,
which could indicate courser (PM10) fraction. Of the studies that did not measure dust
concentration,56, 166, 170-172, 175 only one found no difference in lung function between welders and
non-welders.56 Two studies in particular found that FEV1 decreased after only 15 minutes171 and 3
hours175 of welding.

121
The majority of studies found that welding fume exposure did not have an acute effect on the
small airways56, 64, 176, 177 which is consistent with our findings. There is a great deal of variability
when measuring lung function of the small airways and the repeatability of such measures is often
an issue. Two studies found that welding fume decreased FEF25-75% by 2.5% after seven hours
exposure171, and that the greatest decreased in MEF25% was measured after three hours of
welding with MMA on alloyed base metal.175 Decreases of small airway’s lung function measures,
when no changes are observed in the large airways, are thought to be an early sign of airflow
obstruction.
Welding experience, in years, was associated with a decrease in FEV1 after adjusting for age and
height; this result is consistent with one study that found a 2.7% decrease in FEV1 with 20 years of
welding experience, as well as 3.8% and 3.5% reductions in PEF and MMEF respectively.172 A
statistically significant decrease in predicated values of FEV1, FVC, MEF75% and FEV1/FVC ratio
between pre- and post-shift associated with years of welding was observed in one study but this
was not related to PM2.5 concentration nor was such decrease quantified.174 Ten years of welding
experience was also found to be associated with an increased prevalence of chronic bronchitis
among non-smokers in one study.56 This could possibly be explained by a cumulative effect over
the years of welding fume in reducing lung function. Because of a low prevalence of respiratory
symptoms, we were not able to explore them further.
The results showing no difference in pre- and post-shift AIx measurements among workers
indicate that there was no measureable acute effect following exposure to welding fume with
either exposure status or PM2.5 concentration. As mentioned in Chapter 3, AIx was measured in 26
boilermakers taking part in a panel study over two days;179 a post-shift increase and decrease in
the next-morning AIx, after accounting for circadian variation, was reported. The authors
hypothesised that welding fume PM2.5 concentration had an immediate and delayed effect on
arterial stiffening and advised that the role of specific metal components of metal fume be
evaluated in future studies. The WELSHIP panel study will be able to assess the effect of specific
metal in relation to the chemical profile of the welding fume samples as well by looking at the
oxidative potential of the metals found in the air samples.
The borderline statistically significant increase of PWV among welders cannot be compared to any
other studies as these only measured AIx. PWV has been found to be a better indicator of arterial

122
stiffness in older individuals,157 as mentioned in Chapter 3. There was no difference among
welders and non-welders in terms of known risk factors for arterial stiffness (age or WHR) to
explain such difference. If this result were confirmed with a larger study in this population, the
acute effect of welding fume PM2.5 on PWV would be an unprecedented finding.
The secondary aim of this study was to test the feasibility of conducting a complex panel study of
acute cardiorespiratory effects of welding fume exposure in a busy shipyard. The 100% response
rate and the near optimal completion of sample collection confirm that, despite the challenging
logistic conditions dictated by the fieldwork site, a cross-shift panel study in a busy shipyard such
as Drydocks World Dubai is indeed feasible.
The analyses performed thus far, will be more informative once all other outcomes have been
included. A previous panel study on HRV in welders showed that decline of SDNN (standard
deviation of normal-to-normal intervals between heartbeats) was associated with higher values of
AIx and systemic inflammation.180
Previous studies on HRV and welding fume exposure have been conducted in either healthy
volunteers exposed to welding fume by sitting next to a welder32 or boilermakers from an
apprentice welding school.31, 179-181 Our panel study will be the first to date to assess HRV and
vascular function among shipyard welders with the aim of measuring the role of chemical
components of welding fume and their oxidative potential on the cardiac autonomic nervous
system. We hope to be able to explore further the role of Mn in generating a likely cardiotoxic
effect as previously observed.31 Mn and Fe compounds are expected to be the major components
of the welding fume to which this population of welders have been exposed given the base metal
(mild steel) and the consumables used (see Table 5.1).
In addition, only two studies have been conducted among workers exposed to welding fume in
relation to serum (among boilermakers)185 or urine (among shipyard welders)184 metabolites. The
latter found that metabolites such as taurine, glycine, and betaine in urine, important in regulating
and inhibiting inflammatory responses caused by reactive oxygen species (ROS), were significantly
increased in welders suggesting oxidative stress.184 The study on boilermakers found that
exposure to welding fume was associated with a decreased in fatty acids that could indicate
important biomarkers for health disorders including HRV.185

123
5.5 Limitations
Due to the small sample size, it is possible that this study was not able to detect changes in lung
function; the median sample size of the panel studies on respiratory health already published is 68
(range 6 to 367) participants. Moreover, the low repeatability and intra-subject variability of small
airway’s lung function measurements is likely to be a limiting factor. Conversely, compared to the
eight panel studies on cardiovascular outcomes, that had a median sample size of 26 (range 12 to
36), the WELSHIP panel had double the number of participants.
As mentioned in the methodology section (5.2.1) the four welders who did not perform any
welding on the day were categorised as referents for this analysis. To maximise resources, the
larger panel study will add to the entry requirements that welders will have to be assigned to a
welding shift on the scheduled study day.
A further limitation of this study was the inclusion of workers who worked on the previous day
because of the time constraints in which this study was conducted and logistical implications of
arranging for workers to have their rest days preceding their scheduled day. Any future WELSHIP
panel study will be recruiting over a longer period and will endeavour to make the appropriate
arrangements to meet this criterion.
Previous studies have already highlighted that some of the acute effects of welding fume can
manifest immediately after exposure as well as with a delayed response. For this reason,
consideration will be given to designing a future study to collect data over a longer period of 24 or
48 hours.
Finally, the data on exposure collected with the personal sampler cannot inform on peaks of high
concentration of PM2.5 during the working shift. It is likely that depending on the welding
technique being used and the conditions in which the welding is being performed the
concentration of PM2.5 will differ throughout the day. Therefore, to aid the collection of such
detailed data, consideration will be given to using a portable DustTrakTM Aerosol Monitor (TSI, Inc.,
St. Paul, MN) for continuous PM2.5 monitoring which will provide readings every 10 seconds,
keeping a log of these, to determine the timing and minute-average concentration of welding

124
fume. Further, this will allow comparison of concentration readings with those calculated
gravimetrically with the air sampler already used.
5.6 Conclusion
This study was conducted with the primary aim to explore the acute short-term cardiorespiratory
health effects of welding fume on shipyard welders assessing exposure to PM2.5 both
quantitatively (gravimetric analysis) and qualitatively (chemical characterisation and fume
oxidative potential). Health assessment was conducted by looking at lung function, arterial
stiffness, HRV, metal content in urine and metabolic and adducts profiling in blood. Only data on
lung function, arterial stiffness and gravimetric analysis were available for analysis.
These initial results suggest that exposure to PM2.5 from welding fume was associated with a small
fall in FVC cross-shift and that cross-shift FEV1 decrease was inversely associated with years of
welding experience. There was weaker evidence of a possible acute response in arterial stiffness in
welders that will require further exploration.

125

126
Chapter 6: Conclusions
The programme of work reported in this thesis had a number of aims:
First, the focus was on the relationship between medium- and long-term welding fume exposure
and adverse cardiorespiratory health outcomes. A previously published review of longitudinal
studies had found a small effect on age-related lung function decline that was not easily
distinguishable from the effects of smoking. Similarly, the findings from our systematic review and
meta-analyses of the much larger cross-sectional literature found little summary evidence for FEV1
changes and only small effects on FVC and FEV1/FVC ratio that are of doubtful clinical significance.
In line with these results, the cross-sectional survey we conducted (Chapter 3), one of the largest
ever conducted and with an unprecedently high response rate (93%) failed to detect any
important differences in lung function that could be attributed to work as a welder, despite
(Chapter 5) likely very high exposures to welding fume. Taken together, these observations
suggest that welding fume exposure induces at most only very subtle deficits in lung function.
Similarly, we failed to detect any adverse effects on intermediate cardiovascular outcomes in the
cross-sectional survey although there was a subtle change in smoking welders who had a lower
overall pulse wave velocity compared to non-welders. It is likely that changes in intermediate
cardiovascular outcomes will be difficult to detect using standard workplace-based
epidemiological techniques.
In contrast, the findings relating to respiratory symptoms were both novel and interesting. While a
heightened risk of pneumococcal pneumonia in welders has long been recognised, there has to
date been a complete absence of evidence that this propensity might extend to other, non-
pneumonic respiratory infections. Our findings suggest that this might very well be the case; at
cross-sectional survey, welders were overall more likely to report symptoms of (seasonal)
respiratory infections and, among smokers, this likelihood increased to almost four times that of
non-welders. These findings were subsequently corroborated by a detailed examination of work
medical database (Chapter 4) where, over a decade of reporting, the rate of consultations for
respiratory infection at the yard’s medical centre were significantly higher among welders than

127
other manual and non-manual employees; and, within the welding group, higher in those with
more frequent exposure.
These findings would not be implausible. Welding fume exposure, particularly to high
concentrations or particulate iron, might readily enhance microbial colonization and infection.
From an occupational point of view, this is an important area for further research. Future studies
in this area could usefully include direct measures of seasonal “microbiomic” surveillance in
welders in relation to their welding fume exposure. Cross-shift, panel studies, such as described in
Chapter 5, might be useful in this respect since they allow detailed measurement of exposures.
An underpinning aim of the work presented here was to establish whether high-quality
collaborative (academic-industry) research could be undertaken in this setting; based on our
experience, this seems entirely possible. This is not to say that there were not difficulties. These
included the 5000 mile separation between the two partners, making fieldwork and project
management logistically difficult; the diverse and complex mixture of cultural and linguistic
influences which we probably captured incompletely; the transient nature of a large migrant
workforce; and, initially, a complete lack of research infrastructure and trained field staff. For the
large part, these hurdles seem surmountable through a combination of industry, attention to
detail and close and respectful relationships between team members. The prospects for further
collaborative work seem strong.
128
References
1. Guidotti TL. Global Occupational Health. First ed. United States of America: Oxford University Press, Inc.; 2011. 2. Antonini JM, Taylor MD, Zimmer AT, Roberts JR. Pulmonary responses to welding fumes: role of metal constituents. Journal of toxicology and environmental health Part A. 2004; 67:233-49. 3. Antonini JM. Health effects of welding. Critical reviews in toxicology. 2003; 33:61-103. 4. Hofe Dv. Determination of the quantity of people working in the field of welding in Europe2008: Available from: http://www.svets.se/download/18.7cf9c5aa121e17bab42800026584/Welding_in_the_EU.pdf. 5. United Nations PD, Department of Economic and Social Affairs. World Population Prospects, the 2010 Revision - Total Population - Both Sexes 2011 [cited 2012 22/06/2012]; Available from: http://esa.un.org/unpd/wpp/Excel-Data/population.htm. 6. Hessel PA, Melenka LS, Michaelchuk D, Herbert FA, Cowie RL. Lung health among plumbers and pipefitters in Edmonton, Alberta. Occupational and environmental medicine. 1998; 55:678-83. 7. Hessel PA, Melenka LS, Michaelchuk D, Herbert FA, Cowie RL. Lung health among boilermakers in Edmonton, Alberta. American journal of industrial medicine. 1998; 34:381-6. 8. La Vecchia GM, Maestrelli P. [New welding processes and health effects of welding]. Giornale italiano di medicina del lavoro ed ergonomia. 2011; 33:252-6. 9. Laursen W. Power Shift The Maritime Executive. 2012. 10. Partanen TJ, Hogstedt C, Ahasan R, Aragon A, Arroyave ME, Jeyaratnam J, et al. Collaboration between developing and developed countries and between developing countries in occupational health research and surveillance. Scandinavian journal of work, environment & health. 1999; 25:296-300. 11. World Health Organization. Hazard Prevention and Control in the Work Environment: Airborne Dust Geneva: WHO; 1999 (W HO/SDE/OEH/99.14). 12. Haidar J. An analysis of heat transfer and fume production in gas metal arc welding. III. Journal of Applied Physics. 1999; 85:3448-59. 13. Jenkins NT, Eagar TW. Chemical analysis of welding fume particles - Airborne particle size is the most important factor in determining the accuracy of a method for chemical analysis. Weld J. 2005; 84:87s-93s. 14. Lehnert M, Pesch B, Lotz A, Pelzer J, Kendzia B, Gawrych K, et al. Exposure to inhalable, respirable, and ultrafine particles in welding fume. Annals of Occupational Hygiene. 2012; 56:557-67. 15. Dasch J, D'Arcy J. Physical and chemical characterization of airborne particles from welding operations in automotive plants. Journal of occupational and environmental hygiene. 2008; 5:444-54. 16. Elihn K, Berg P. Ultrafine particle characteristics in seven industrial plants. The Annals of occupational hygiene. 2009; 53:475-84. 17. Brouwer DH, Gijsbers JH, Lurvink MW. Personal exposure to ultrafine particles in the workplace: exploring sampling techniques and strategies. The Annals of occupational hygiene. 2004; 48:439-53. 18. Stephenson D, Seshadri G, Veranth JM. Workplace exposure to submicron particle mass and number concentrations from manual arc welding of carbon steel. AIHA journal : a journal for the science of occupational and environmental health and safety. 2003; 64:516-21.

129
19. Voitkevich V. Welding fumes properties Welding fumes: formation, properties and biological effects: Abington; 1995. p. 24-9. 20. Hewett P. Estimation of regional pulmonary deposition and exposure for fumes from SMAW and GMAW mild and stainless steel consumables. American Industrial Hygiene Association journal. 1995; 56:136-42. 21. Farrants G, Schuler B, Karlsen J, Reith A, Langard S. Characterization of the morphological properties of welding fume particles by transmission electron microscopy and digital image analysis. American Industrial Hygiene Association journal. 1989; 50:473-9. 22. Antonini JM, Lewis AB, Roberts JR, Whaley DA. Pulmonary effects of welding fumes: review of worker and experimental animal studies. American journal of industrial medicine. 2003; 43:350-60. 23. Grant M. Welding In: Hendrick DJea, editor. Occupational disorders of the lung : recognition, management and prevention W.B. Saunders: W.B. Saunders 2002. p. 467-79. 24. Fang SC, Cassidy A, Christiani DC. A systematic review of occupational exposure to particulate matter and cardiovascular disease. International journal of environmental research and public health. 2010; 7:1773-806. 25. Becklake MR. Occupational exposures: evidence for a causal association with chronic obstructive pulmonary disease. The American review of respiratory disease. 1989; 140:S85-91. 26. Becklake MR. Chronic airflow limitation: its relationship to work in dusty occupations. Chest. 1985; 88:608-17. 27. Boschetto P, Quintavalle S, Miotto D, Lo Cascio N, Zeni E, Mapp CE. Chronic obstructive pulmonary disease (COPD) and occupational exposures. J Occup Med Toxicol. 2006; 1:11. 28. Newhouse ML, Oakes D, Woolley AJ. Mortality of welders and other craftsmen at a shipyard in NE England. Br J Ind Med. 1985; 42:406-10. 29. Sjogren B, Gyntelbreg F, Hilt B. Ischemic heart disease and welding in Scandinavian studies. Scandinavian Journal of Work, Environment and Health, Supplement. 2006:50-3. 30. Ibfelt E, Bonde JP, Hansen J. Exposure to metal welding fume particles and risk for cardiovascular disease in Denmark: a prospective cohort study. Occupational and environmental medicine. 2010; 67:772-7. 31. Cavallari JM, Eisen EA, Fang SC, Schwartz J, Hauser R, Herrick RF, et al. PM2.5 metal exposures and nocturnal heart rate variability: a panel study of boilermaker construction workers. Environmental health : a global access science source. 2008; 7:36. 32. Scharrer E, Hessel H, Kronseder A, Guth W, Rolinski B, Jorres RA, et al. Heart rate variability, hemostatic and acute inflammatory blood parameters in healthy adults after short-term exposure to welding fume. International archives of occupational and environmental health. 2007; 80:265-72. 33. Szram J, Schofield SJ, Cosgrove MP, Cullinan P. Welding, longitudinal lung function decline and chronic respiratory symptoms: a systematic review of cohort studies. The European respiratory journal : official journal of the European Society for Clinical Respiratory Physiology. 2013; 42:1186-93. 34. Morgan WK. On welding, wheezing, and whimsy. American Industrial Hygiene Association journal. 1989; 50:59-69. 35. Cosgrove M. Arc welding and airway disease. Weld World. 2014:1-7. 36. Miller M, Pincock A. Predicted values: How should we use them? Thorax. 1988; 43:265-7. 37. Sterne JAC, Harbord RM. Funnel plots in meta-analysis. Stata Journal. 2004; 4:127-41. 38. Borenstein M. Introduction to meta-analysis. Chichester, U.K.: John Wiley & Sons; 2009. 39. Sedgwick P, Marston L. Meta-analyses: Standardised mean differences. BMJ (Online). 2013; 347.

130
40. Quanjer PH, Tammeling GJ, Cotes JE, Pedersen OF, Peslin R, Yernault JC. Lung volumes and forced ventilatory flows. Report Working Party Standardization of Lung Function Tests, European Community for Steel and Coal. Official Statement of the European Respiratory Society. Eur Respir J Suppl. 1993; 16:5-40. 41. Higgins J, Thompson S, Deeks J, Altman D. Measuring inconsistency in meta-analyses. Br Med J. 2003; 327:557-60. 42. Decramer M, Janssens W, Miravitlles M. Chronic obstructive pulmonary disease. The Lancet. 2012; 379:1341-51. 43. Doherty D. The pathophysiology of airway dysfunction. The American journal of medicine. 2004; 117 Suppl 12A:11S-23S. 44. The World Bank "World Development Indicators". GNI per capita, Atlas method [Data file]. 2013 [22/01/2014]; Available from: http://data.worldbank.org/indicator/NY.GNP.PCAP.CD. 45. Zielhuis RL, Wanders, S.P. . Health effects and medical wastage due to combined exposure in welding. In: Stern RM, Communities CotE, editors. Health hazards and biological effects of welding fumes and gases: proceedings of the International Conference on Health Hazards and Biological Effects of Welding Fumes and Gases, Copenhagen, 18-21 February 1985: Excerpta Medica; 1986. p. 497-533. 46. Hunnicutt TN, Jr., Cracovaner DJ, Myles JT. Spirometric Measurements in Welders. Archives of environmental health. 1964; 8:661-9. 47. Peters JM, Murphy RL, Ferris BG, Burgess WA, Ranadive MV, Perdergrass HP. Pulmonary function in shipyard welders: an epidemiologic study. Archives of environmental health. 1973; 26:28-31. 48. Barhad B, Teculescu D, Craciun O. Respiratory symptoms, chronic bronchitis, and ventilatory function in shipyard welders. International archives of occupational and environmental health. 1975; 36:137-50. 49. Ross DS. WELDERS HEALTH - RESPIRATORY SYSTEM, AND WELDING .4. Metal Construction. 1978; 10:119-&. 50. McMillan GH, Heath J. The health of welders in naval dockyards: acute changes in respiratory function during standardized welding. The Annals of occupational hygiene. 1979; 22:19-32. 51. Oxhoj H, Bake B, Wedel H, Wilhelmsen L. Effects of electric arc welding on ventilatory lung function. Archives of environmental health. 1979; 34:211-7. 52. Akbarkhanzadeh F. Long-term effects of welding fumes upon respiratory symptoms and pulmonary function. Journal of occupational medicine : official publication of the Industrial Medical Association. 1980; 22:337-41. 53. McMillan GH, Pethybridge RJ. A clinical, radiological and pulmonary function case-control study of 135 Dockyard welders aged 45 years and over. The Journal of the Society of Occupational Medicine. 1984; 34:3-23. 54. Cotes JE, Feinmann EL, Male VJ, Rennie FS, Wickham CA. Respiratory symptoms and impairment in shipyard welders and caulker/burners. British journal of industrial medicine. 1989; 46:292-301. 55. Groth M, Lyngenbo O. Respiratory symptoms in Danish welders. Scandinavian journal of social medicine. 1989; 17:271-6. 56. Kilburn KH, Warshaw RH, Boylen CT, Thornton JC. Respiratory symptoms and functional impairment from acute (cross-shift) exposure to welding gases and fumes. Am J Med Sci. 1989; 298:314-9. 57. Lyngenbo O, Groth S, Groth M, Olsen O, Rossing N. Occupational lung function impairment in never-smoking Danish welders. Scandinavian journal of social medicine. 1989; 17:157-64.

131
58. Hjortsberg U, Orbaek P, Arborelius M, Jr. Small airways dysfunction among non-smoking shipyard arc welders. British journal of industrial medicine. 1992; 49:441-4. 59. Gennaro V, Baser ME, Costantini M, Merlo F, Robutti P, Tockman MS. Effects of smoking and occupational exposures on pulmonary function impairment in Italian shipyard workers. Medicina del Lavoro. 1993; 84:121-32. 60. Sobaszek A, Edme JL, Boulenguez C, Shirali P, Mereau M, Robin H, et al. Respiratory symptoms and pulmonary function among stainless steel welders. Journal of occupational and environmental medicine / American College of Occupational and Environmental Medicine. 1998; 40:223-9. 61. Ould-Kadi F, Nawrot TS, Hoet PH, Nemery B. Respiratory function and bronchial responsiveness among industrial workers exposed to different classes of occupational agents: a study from Algeria. Journal of occupational medicine and toxicology (London, England). 2007; 2:11. 62. Harbord RM, Harris RJ, Sterne JAC. Updated tests for small-study effects in meta-analyses. Stata Journal. 2009; 9:197-210. 63. Rossignol M, Seguin P, DeGuire L. Evaluation of the utility of spirometry in a regional public health screening program for workers exposed to welding fumes. Journal of occupational and environmental medicine / American College of Occupational and Environmental Medicine. 1996; 38:1259-63. 64. Keimig DG, Pomrehn PR, Burmeister LF. Respiratory symptoms and pulmonary function in welders of mild steel: a cross-sectional study. American journal of industrial medicine. 1983; 4:489-99. 65. Anttipoika M, Hassi J, Pyy L. RESPIRATORY-DISEASES IN ARC WELDERS. International archives of occupational and environmental health. 1977; 40:225-30. 66. Bradshaw LM, Fishwick D, Slater T, Pearce N. Chronic bronchitis, work related respiratory symptoms, and pulmonary function in welders in New Zealand. Occupational and environmental medicine. 1998; 55:150-4. 67. Fishwick D, Bradshaw L, Slater T, Curran A, Pearce N. Respiratory symptoms and lung function change in welders: are they associated with workplace exposures? The New Zealand medical journal. 2004; 117:U872. 68. Cotes JE, Steel J, Leathart GL. Work-related Lung Disorders: Blackwell Scientific; 1987. 69. Hayden SP, Pincock AC, Hayden J, Tyler LE, Cross KW, Bishop JM. Respiratory symptoms and pulmonary function of welders in the engineering industry. Thorax. 1984; 39:442-7. 70. Mur JM, Teculescu D, Pham QT, Gaertner M, Massin N, Meyer-Bisch C, et al. Lung function and clinical findings in a cross-sectional study of arc welders. An epidemiological study. International archives of occupational and environmental health. 1985; 57:1-17. 71. Fidan F, Unlu M, Koken T, Tetik L, Akgun S, Demirel R, et al. Oxidant-antioxidant status and pulmonary function in welding workers. Journal of occupational health. 2005; 47:286-92. 72. Hammond SK, Gold E, Baker R, Quinlan P, Smith W, Pandya R, et al. Respiratory health effects related to occupational spray painting and welding. Journal of occupational and environmental medicine / American College of Occupational and Environmental Medicine. 2005; 47:728-39. 73. Sharifian SA, Loukzadeh Z, Shojaoddiny-Ardekani A, Aminian O. Pulmonary adverse effects of welding fume in automobile assembly welders. Acta medica Iranica. 2011; 49:98-102. 74. Subhashree AR, Shanthi B, Parameaswari PJ. The Red Cell Distribution Width as a sensitive biomarker for assessing the pulmonary function in automobile welders- a cross sectional study. Journal of Clinical and Diagnostic Research. 2013; 7:89-92. 75. Fogh A, Frost J, Georg J. Respiratory symptoms and pulmonary function in welders. The Annals of occupational hygiene. 1969; 12:213-8.

132
76. Zober A, Weltle D. Cross-sectional study of respiratory effects of arc welding. The Journal of the Society of Occupational Medicine. 1985; 35:79-84. 77. Sjogren B, Ulfvarson U. Respiratory symptoms and pulmonary function among welders working with aluminum, stainless steel and railroad tracks. Scandinavian journal of work, environment & health. 1985; 11:27-32. 78. Nielsen J, Dahlqvist M, Welinder H, Thomassen Y, Alexandersson R, Skerfving S. Small airways function in aluminium and stainless steel welders. International archives of occupational and environmental health. 1993; 65:101-5. 79. Ozdemir O, Numanoglu N, Gonullu U, Savas I, Alper D, Gurses H. Chronic effects of welding exposure on pulmonary function tests and respiratory symptoms. Occupational and environmental medicine. 1995; 52:800-3. 80. Wolf C, Pirich C, Valic E, Waldhoer T. Pulmonary function and symptoms of welders. International archives of occupational and environmental health. 1997; 69:350-3. 81. Erhabor GE, Fatusi S, Obembe OB. Pulmonary functions in ARC-welders in Ile-Ife, Nigeria. East African medical journal. 2001; 78:461-4. 82. Meo SA, Azeem MA, Subhan MM. Lung function in Pakistani welding workers. Journal of occupational and environmental medicine / American College of Occupational and Environmental Medicine. 2003; 45:1068-73. 83. Stepnewski M, Kolarzyk E, Pietrzycka A, Kitlinski M, Helbin J, Brzyszczan K. Antioxidant enzymes and pulmonary function in steel mill welders. International journal of occupational medicine and environmental health. 2003; 16:41-7. 84. Jafari AJ, Assari MJ. Respiratory effects from work-related exposure to welding fumes in Hamadan, Iran. Archives of environmental health. 2004; 59:116-20. 85. Pourtaghi GK, H.; Salem, M. Pourtagh, F.; Lahmi, M. Pulmonary Effects of Occupational Exposure to Welding Fumes. Australian Journal of Basic and Applied Sciences. 2009; 3:3291-6. 86. Jayawardana P, Abeysena C. Respiratory health of welders in a container yard, Sri Lanka. Occup Med (Lond). 2009; 59:226-9. 87. Stoleski S, Karadzinska-Bislimovska J, Mijakoski D. Respiratory symptoms, immunological changes, ventilatory capacity, and bronchial responsiveness in welders. Macedonian Journal of Medical Sciences. 2012; 5:99-106. 88. Doig AT, Duguid LN. The health of welders Report. London: Her Majesty's Stationary Office1951 Dec. 89. Ghasemkhani M, Kumashiro M, Rezaei M, Anvari AR, Mazloumi A, Sadeghipour HR. Prevalence of respiratory symptoms among workers in industries of south Tehran, Iran. Industrial health. 2006; 44:218-24. 90. Jani V, Mazumdar V. Prevalence of respiratory morbidity among welders in unorganized sector of Baroda City. Indian J Occup Environ Med. 2004; 8:16-21. 91. Kilburn KH, Warshaw RH. Pulmonary functional impairment from years of arc welding. The American journal of medicine. 1989; 87:62-9. 92. Korczynski RE. Occupational health concerns in the welding industry. Applied occupational and environmental hygiene. 2000; 15:936-45. 93. Rajkumar. A study of respiratory symptoms and lung function of welders in Delhi. Indian journal of occupational and environmental medicine. 2000; 4:168-71. 94. Stepniewski M, Kolarzyk E, Zagrodzki P, Solarska K, Pietrzycka A, Kitlinski M, et al. Pattern recognition methods in evaluation of the structure of the laboratory data biominerals, antioxidant enzymes, selected biochemical parameters, and pulmonary function of welders. Biological trace element research. 2003; 93:39-46.

133
95. Lillienberg L, Zock JP, Kromhout H, Plana E, Jarvis D, Toren K, et al. A population-based study on welding exposures at work and respiratory symptoms. The Annals of occupational hygiene. 2008; 52:107-15. 96. Kalliomaki PL, Kalliomaki K, Korhonen O, Nordman H, Rahkonen E, Vaaranen V. Respiratory status of stainless steel and mild steel welders. Scandinavian journal of work, environment & health. 1982; 8 Suppl 1:117-21. 97. Nakadate T, Aizawa Y, Yagami T, Zheg YQ, Kotani M, Ishiwata K. Change in obstructive pulmonary function as a result of cumulative exposure to welding fumes as determined by magnetopneumography in Japanese arc welders. Occupational and environmental medicine. 1998; 55:673-7. 98. Chinn DJ, Cotes JE, el Gamal FM, Wollaston JF. Respiratory health of young shipyard welders and other tradesmen studied cross sectionally and longitudinally. Occupational and environmental medicine. 1995; 52:33-42. 99. Kilburn KH. Neurobehavioral and respiratory findings in jet engine repair workers: A comparison of exposed and unexposed volunteers. Environmental research. 1999; 80:244-52. 100. Pandit K, Tiwari RR. Morbidity profile of steel pipe production workers. Indian journal of occupational and environmental medicine. 2008; 12:88-90. 101. Cotes JE. Medical Research Council Questionnaire on Respiratory Symptoms (1986). Lancet. 1987; 2:1028. 102. Ferris BG. Epidemiology Standardization Project (American Thoracic Society). The American review of respiratory disease. 1978; 118:1-120. 103. Wanders SP, Zielhuis GA, Vreuls HJ, Zielhuis RL. Medical wastage in shipyard welders: a forty-year historical cohort study. International archives of occupational and environmental health. 1992; 64:281-91. 104. McMillan GH. Studies of the health of welders in naval dockyards. The Annals of occupational hygiene. 1978; 21:377-92. 105. McMillan GH. The health of welders in naval dockyards: welding, tobacco smoking and absence attributed to respiratory diseases. The Journal of the Society of Occupational Medicine. 1981; 31:112-8. 106. McMillan GH, Molyneux MK. The health of welders in naval dockyards: the work situation and sickness absence patterns. The Journal of the Society of Occupational Medicine. 1981; 31:43-60. 107. McMillan GH. The health of welders in naval dockyards. The risk of asbestos-related diseases occurring in welders. Journal of occupational medicine : official publication of the Industrial Medical Association. 1983; 25:727-30. 108. McMillan GH, Pethybridge RJ. The health of welders in naval dockyards: proportional mortality study of welders and two control groups. The Journal of the Society of Occupational Medicine. 1983; 33:75-84. 109. McMillan GH. The health of welders in naval dockyards: final summary report. Journal of the Royal Naval Medical Service. 1983; 69:125-31. 110. Palmer KT, Cosgrove MP. Vaccinating welders against pneumonia. Occup Med (Lond). 2012; 62:325-30. 111. Sterne J, Sutton A, Ioannidis J, Terrin N, Jones D, Lau J, et al. Recommendations for examining and interpreting funnel plot asymmetry in meta-analyses of randomised controlled trials. BMJ (Online). 2011; 343. 112. Sedgwick P. Cross sectional studies: advantages and disadvantages2014. 113. Pearce N, Checkoway H, Kriebel D. Bias in occupational epidemiology studies. Occupational and environmental medicine. 2007; 64:562-8.

134
114. McElvenny DM, Armstrong BG, Jarup L, Higgins JP. Meta-analysis in occupational epidemiology: a review of practice. Occup Med (Lond). 2004; 54:336-44. 115. Organization WH. Waist circumference and waist–hip ratio: report of a WHO expert consultation, Geneva, 8–11 December 2008.2011: Available from: http://whqlibdoc.who.int/publications/2011/9789241501491_eng.pdf. 116. Yasmin, Brown MJ. Similarities and differences between augmentation index and pulse wave velocity in the assessment of arterial stiffness. QJM. 1999; 92:595-600. 117. Pucci G, Cheriyan J, Hubsch A, Hickson SS, Gajendragadkar PR, Watson T, et al. Evaluation of the Vicorder, a novel cuff-based device for the noninvasive estimation of central blood pressure. Journal of hypertension. 2013; 31:77-85. 118. Hickson SS, Butlin M, Broad J, Avolio AP, Wilkinson IB, McEniery CM. Validity and repeatability of the Vicorder apparatus: a comparison with the SphygmoCor device. Hypertension research : official journal of the Japanese Society of Hypertension. 2009; 32:1079-85. 119. Miller MR, Hankinson J, Brusasco V, Burgos F, Casaburi R, Coates A, et al. Standardisation of spirometry. The European respiratory journal : official journal of the European Society for Clinical Respiratory Physiology. 2005; 26:319-38. 120. Definition and classification of chronic bronchitis for clinical and epidemiological purposes. A report to the Medical Research Council by their Committee on the Aetiology of Chronic Bronchitis. Lancet. 1965; 1:775-9. 121. Yusuf S, Hawken S, Ounpuu S, Bautista L, Franzosi MG, Commerford P, et al. Obesity and the risk of myocardial infarction in 27,000 participants from 52 countries: a case-control study. Lancet. 2005; 366:1640-9. 122. Seidell JC. Waist circumference and waist/hip ratio in relation to all-cause mortality, cancer and sleep apnea. European journal of clinical nutrition. 2010; 64:35-41. 123. Royston P, Sauerbrei W, Becher H. Modelling continuous exposures with a 'spike' at zero: a new procedure based on fractional polynomials. Statistics in medicine. 2010; 29:1219-27. 124. National Bureau Of Statistics. Population Estimates 2006 - 2010. In: Demographic and Social Statistics, editor. UAE: National Bureau Of Statistics; 2011. 125. Gibson JMD, Brammer A, Davidson C, Folley T, Launay F, Thomsen J. Environmental Burden of Disease Assessment: Springer; 2013. 126. Migration and Remittances Factbook 2011. United Arab Emirates. The World Bank,; 2011 [21/09/2014]; Available from: http://siteresources.worldbank.org/INTPROSPECTS/Resources/334934-1199807908806/UnitedArabEmirates.pdf. 127. National Bureau Of Statistics. Climate 2013. Climate Statistics. UAE: National Bureau Of Statistics; 2014. 128. Emmanouil C. Mechanisms of metal fume fever and its provocation by selected metals. Fresenius Environ Bull. 2012; 21:2310-5. 129. Van Pee D, Vandenplas O, Gillet JB. Metal fume fever. Eur J Emerg Med. 1998; 5:465-6. 130. Mueller EJ, Seger DL. Metal fume fever--a review. The Journal of emergency medicine. 1985; 2:271-4. 131. Dowell SF. Seasonal variation in host susceptibility and cycles of certain infectious diseases. Emerging infectious diseases. 2001; 7:369-74. 132. Loney T, Aw TC, Handysides DG, Ali R, Blair I, Grivna M, et al. An analysis of the health status of the United Arab Emirates: the 'Big 4' public health issues. Global health action. 2013; 6:20100. 133. Coggon D, Inskip H, Winter P, Pannett B. Lobar pneumonia: an occupational disease in welders. Lancet. 1994; 344:41-3.

135
134. Public Health England. The Green Book: Immunisation against infectious disease: Pneumococcal. In: Health Do, editor. London, United Kingdom: The Stationery Office; 2013. 135. Heymann DL, Association APH. Control of Communicable Diseases Manual: American Public Health Association; 2008. 136. Palmer K, Coggon D. Does occupational exposure to iron promote infection? Occupational & Environmental Medicine. 1997; 54:529-34. 137. Palmer KT, Poole J, Ayres JG, Mann J, Burge PS, Coggon D. Exposure to metal fume and infectious pneumonia. American journal of epidemiology. 2003; 157:227-33. 138. Palmer KT, Cullinan P, Rice S, Brown T, Coggon D. Mortality from infectious pneumonia in metal workers: a comparison with deaths from asthma in occupations exposed to respiratory sensitisers. Thorax. 2009; 64:983-6. 139. Vincent JH. The fate of inhaled particles. Aerosol Science for Industrial Hygienists: Elsevier Science; 1995. p. 166-203. 140. Hidy GM. Health effects of inhaled aerosols. Aerosols, an industrial and environmental science: Academic Press; 1984. p. 578-645. 141. Godbert B, Wissler MP, Vignaud JM. Desquamative interstitial pneumonia: an analytic review with an emphasis on aetiology. European respiratory review : an official journal of the European Respiratory Society. 2013; 22:117-23. 142. Hilt B, Qvenild T, Rømyhr O. Morbidity from ischemic heart disease in workers at a stainless steel welding factory. Norsk Epidemiologi. 1999; 9. 143. Martin CR, Preedy VR. Scientific Basis of Healthcare: Angina: Science Publishers; 2011. 144. Sjogren B, Fossum T, Lindh T, Weiner J. Welding and ischemic heart disease. International journal of occupational and environmental health. 2002; 8:309-11. 145. Brook RD, Franklin B, Cascio W, Hong Y, Howard G, Lipsett M, et al. Air Pollution and Cardiovascular Disease: A Statement for Healthcare Professionals From the Expert Panel on Population and Prevention Science of the American Heart Association. Circulation. 2004; 109:2655-71. 146. Peters A, Emerson L, Verrier RL, Schwartz J, Gold DR, Mittleman M, et al. Air Pollution and Incidence of Cardiac Arrhythmia. Epidemiology. 2000; 11:11-7. 147. Pope CA, Dockery DW. Air pollution and life expectancy in China and beyond. Proceedings of the National Academy of Sciences of the United States of America. 2013; 110:12861-2. 148. Peters A. Ambient Particulate Matter and the Risk for Cardiovascular Disease. Progress in Cardiovascular Diseases. 2011; 53:327-33. 149. Dominici F, Peng RD, Bell ML, Pham L, McDermott A, Zeger SL, et al. Fine particulate air pollution and hospital admission for cardiovascular and respiratory diseases. Jama. 2006; 295:1127-34. 150. Peters A, Dockery DW, Muller JE, Mittleman MA. Increased particulate air pollution and the triggering of myocardial infarction. Circulation. 2001; 103:2810-5. 151. Pekkanen J, Peters A, Hoek G, Tiittanen P, Brunekreef B, de Hartog J, et al. Particulate air pollution and risk of ST-segment depression during repeated submaximal exercise tests among subjects with coronary heart disease: the Exposure and Risk Assessment for Fine and Ultrafine Particles in Ambient Air (ULTRA) study. Circulation. 2002; 106:933-8. 152. Brook RD, Rajagopalan S, Pope CA, Brook JR, Bhatnagar A, Diez-Roux AV, et al. Particulate Matter Air Pollution and Cardiovascular Disease: An Update to the Scientific Statement From the American Heart Association. Circulation. 2010; 121:2331-78. 153. Peters A. Particulate matter and heart disease: Evidence from epidemiological studies. Toxicology and Applied Pharmacology. 2005; 207:477-82.

136
154. Costello S, Brown DM, Noth EM, Cantley L, Slade MD, Tessier-Sherman B, et al. Incident ischemic heart disease and recent occupational exposure to particulate matter in an aluminum cohort. Journal of exposure science & environmental epidemiology. 2014; 24:82-8. 155. Costello S, Garcia E, Hammond SK, Eisen EA. Ischemic heart disease mortality and PM(3.5) in a cohort of autoworkers. American journal of industrial medicine. 2013; 56:317-25. 156. Reference Values for Arterial Stiffness C. Determinants of pulse wave velocity in healthy people and in the presence of cardiovascular risk factors: 'establishing normal and reference values'. European heart journal. 2010; 31:2338-50. 157. McEniery CM, Yasmin, Hall IR, Qasem A, Wilkinson IB, Cockcroft JR, et al. Normal vascular aging: differential effects on wave reflection and aortic pulse wave velocity: the Anglo-Cardiff Collaborative Trial (ACCT). Journal of the American College of Cardiology. 2005; 46:1753-60. 158. Koivistoinen T, Koobi T, Jula A, Hutri-Kahonen N, Raitakari OT, Majahalme S, et al. Pulse wave velocity reference values in healthy adults aged 26-75 years. Clinical physiology and functional imaging. 2007; 27:191-6. 159. Nürnberger J, Keflioglu-Scheiber A, Opazo Saez AM, Wenzel RR, Philipp T, Schäfers RF. Augmentation index is associated with cardiovascular risk. Journal of Hypertension. 2002; 20:2407-14. 160. Weber T, Auer J, O'Rourke MF, Kvas E, Lassnig E, Berent R, et al. Arterial stiffness, wave reflections, and the risk of coronary artery disease. Circulation. 2004; 109:184-9. 161. Wilkinson IB, Prasad K, Hall IR, Thomas A, MacCallum H, Webb DJ, et al. Increased central pulse pressure and augmentation index in subjects with hypercholesterolemia. Journal of the American College of Cardiology. 2002; 39:1005-11. 162. Laurent S, Cockcroft J, Van Bortel L, Boutouyrie P, Giannattasio C, Hayoz D, et al. Expert consensus document on arterial stiffness: methodological issues and clinical applications. European heart journal. 2006; 27:2588-605. 163. Mahmud A, Feely J. Effect of smoking on arterial stiffness and pulse pressure amplification. Hypertension. 2003; 41:183-7. 164. Fang SC, Eisen EA, Cavallari JM, Mittleman MA, Christiani DC. Acute changes in vascular function among welders exposed to metal-rich particulate matter. Epidemiology. 2008; 19:217-25. 165. Francis TJ. A study of the immediate effects of welding fume on pulmonary function. Journal of the Royal Naval Medical Service. 1982; 68:136-44. 166. Oleru G, Ademiluyi SA. Some acute and long-term effects of exposure in welding and thermal-cutting operations in Nigeria. International archives of occupational and environmental health. 1987; 59:605-12. 167. Marquart H, Smid T, Heederik D, Visschers M. Lung function of welders of zinc-coated mild steel: cross-sectional analysis and changes over five consecutive work shifts. American journal of industrial medicine. 1989; 16:289-96. 168. Kilburn KH, Warshaw R, Boylen CT, Thornton JC, Hopfer SM, Sunderman FW, Jr., et al. Cross-shift and chronic effects of stainless-steel welding related to internal dosimetry of chromium and nickel. American journal of industrial medicine. 1990; 17:607-15. 169. Akbar-Khanzadeh F. Short-term respiratory function changes in relation to workshift welding fume exposures. International archives of occupational and environmental health. 1993; 64:393-7. 170. Donoghue AM, Glass WI, Herbison GP. Transient changes in the pulmonary function of welders: a cross sectional study of Monday peak expiratory flow. Occupational and environmental medicine. 1994; 51:553-6. 171. Fishwick D, Bradshaw LM, Slater T, Pearce N. Respiratory symptoms, across-shift lung function changes and lifetime exposures of welders in New Zealand. 1997 [updated Oct; cited 23 5]; 1997/12/24:[351-8].

137
172. Sobaszek A, Boulenguez C, Frimat P, Robin H, Haguenoer JM, Edme JL. Acute respiratory effects of exposure to stainless steel and mild steel welding fumes. Journal of occupational and environmental medicine / American College of Occupational and Environmental Medicine. 2000; 42:923-31. 173. Sjogren B. Fluoride exposure and respiratory symptoms in welders. International journal of occupational and environmental health. 2004; 10:310-2. 174. Gube M, Brand P, Conventz A, Ebel J, Goeen T, Holzinger K, et al. Spirometry, impulse oscillometry and capnovolumetry in welders and healthy male subjects. Respiratory medicine. 2009; 103:1350-7. 175. Brand P, Gube M, Gerards K, Bertram J, Kaminski H, John AC, et al. Internal exposure, effect monitoring, and lung function in welders after acute short-term exposure to welding fumes from different welding processes. Journal of occupational and environmental medicine / American College of Occupational and Environmental Medicine. 2010; 52:887-92. 176. Brand P, Bischof K, Siry L, Bertram J, Schettgen T, Reisgen U, et al. Exposure of healthy subjects with emissions from a gas metal arc welding process: part 3--biological effect markers and lung function. International Archives of Occupational & Environmental Health. 2013; 86:39-45. 177. Golbabaei F, Khadem M, Ghahri A, Babai M, Hosseini M, Seyedsomea M, et al. Pulmonary functions of welders in gas transmission pipelines in Iran. Int J Occup Saf Ergon. 2013; 19:647-55. 178. Hartmann L, Bauer M, Bertram J, Gube M, Lenz K, Reisgen U, et al. Assessment of the biological effects of welding fumes emitted from metal inert gas welding processes of aluminium and zinc-plated materials in humans. International journal of hygiene and environmental health. 2014; 217:160-8. 179. Cavallari JM, Fang SC, Eisen EA, Schwartz J, Hauser R, Herrick RF, et al. Time course of heart rate variability decline following particulate matter exposures in an occupational cohort. Inhalation toxicology. 2008; 20:415-22. 180. Fang SC, Cavallari JM, Eisen EA, Chen JC, Mittleman MA, Christiani DC. Vascular function, inflammation, and variations in cardiac autonomic responses to particulate matter among welders. American journal of epidemiology. 2009; 169:848-56. 181. Cavallari JM, Fang SC, Mittleman MA, Christiani DC. Circadian variation of heart rate variability among welders. Occupational and environmental medicine. 2010; 67:717-9. 182. Fang SC, Eisen EA, Cavallari JM, Mittleman MA, Christiani DC. Circulating adhesion molecules after short-term exposure to particulate matter among welders. Occupational and environmental medicine. 2010; 67:11-6. 183. Rice MB, Cavallari J, Fang S, Christiani D. Acute decrease in HDL cholesterol associated with exposure to welding fumes. Journal of Occupational and Environmental Medicine. 2011; 53:17-21. 184. Kuo C-H, Wang K-C, Tian T-F, Tsai M-H, Chiung Y-M, Hsiech C-M, et al. Metabolomic Characterization of Laborers Exposed to Welding Fumes. Chemical Research in Toxicology. 2012; 25:676-86. 185. Wei Y, Wang Z, Chang CY, Fan T, Su L, Chen F, et al. Global metabolomic profiling reveals an association of metal fume exposure and plasma unsaturated fatty acids. PloS one. 2013; 8:e77413.

138
Appendices
A.2.1 Search strategy
Web of Science: search on 29/07/2013 (only limits available are language and type of publication)
Databases:
Science Citation Index Expanded (SCI-EXPANDED) --1970-present
Social Sciences Citation Index (SSCI) --1970-present Search terms: free texto (FT) only:
FT: weld*
and
FT: lung* or airway* or respiratory or pulmonary or bronch* or chronic obstructive lung disease or chronic obstructive pulmonary disease or BHR or COPD or wheez* or cough or dyspn* or shortness of breath or spirometr*
Embase (Ovid): search on 29/07/2013
Database: Embase Classic+Embase 1947 to 2013 July 29 Search terms= free text (FT) and subheadings (SH)
FT: weld* or SH: welding/ or welding fume/
and
FT: lung* or airway* or respiratory or pulmonary or bronch* or chronic obstructive lung disease or chronic obstructive pulmonary disease or BHR or COPD or wheez* or cough or dyspn* or shortness of breath or spirometr*
or SH: lung/ or airway/ or airway obstruction/ or respiratory airflow/ or spirometry/ or chronic
obstructive lung disease/ or wheezing/ or abnormal respiratory sound/ or coughing/ or chronic cough/ or dyspnea/
o wheez* and other symptoms common in COPD were added to the free text in WOS add. Asthma was dropped to focus only on irreversible bronchial obstruction.

139
Medline (Ovid): search on 27/07/2013
Database: Ovid MEDLINE(R) In-Process & Other Non-Indexed Citations and Ovid MEDLINE(R) 1946 to Present Search terms: free text (FT) and Medical Subject Headings (MeSH):
FT: weld* or SH: welding/
and
FT: lung* or airway* or respiratory or pulmonary or bronch* or chronic obstructive lung disease or chronic obstructive pulmonary disease or BHR or COPD or wheez* or cough or dyspn* or shortness of breath or spirometr*
or SH: Lung/ or Respiratory System/ or Respiratory Sounds/ or Respiratory Insufficiency/ or
cough/ or dyspnea/ or respiratory hypersensitivity/ or bronchitis/ or pulmonary disease, chronic obstructive/ or bronchitis, chronic/ or Respiratory Tract Diseases/ or Occupational Diseases/ or Spirometry/

140

141
A.2.2 Estimates extraction forms

142

143
A.2.3 Additional forest plots for lung function measures and respiratory symptoms
By smoking, country income level, welders’ age and shipbuilding and repair industry subgroups
NOTE: Weights are from random effects analysis
Overall (I-squared = 77.0%, p = 0.000)
Stoleski-2013
Fogh-1969
Mur-1985
Author-year
Pourtaghi-2009
Hjortsberg-1992
Wolf-1997
Jayawardana-2009
Hayden-1984
Subhashree-2013
Gennaro-1993
Fidan-2005
Anttipoika-1977
Meo-2003
Ozdemir-1995
Akbarkhanzadeh-1980
Ould-Kadi-2007
Sobaszek-1998
Sharifian-2011
Macedonia
Denmark
France
Location
Iran
Sweden
Austria
Sri Lanka
UK
India
Italy
Turkey
Finland
Pakistan
Turkey
UK
Algeria
France
Iran
-0.19 (-0.34, -0.05)
-0.24 (-0.69, 0.20)
0.00 (-0.22, 0.22)
-0.06 (-0.23, 0.11)
SMD (95% CI)
-0.89 (-1.16, -0.61)
0.80 (0.03, 1.58)
-0.23 (-0.55, 0.08)
0.35 (-0.09, 0.78)
0.08 (-0.10, 0.25)
-0.63 (-1.03, -0.23)
-0.26 (-0.62, 0.10)
-0.33 (-0.78, 0.12)
0.03 (-0.22, 0.27)
-0.64 (-1.04, -0.23)
-0.47 (-0.80, -0.14)
-0.27 (-0.50, -0.04)
-0.35 (-0.60, -0.09)
0.07 (-0.14, 0.28)
-0.07 (-0.42, 0.27)
2406
39, 83.4 (9.3)
156, 3.7 (.68)
346, 3.59 (.671)
(SD); Treatment
160, 3.7 (.74)
14, 105 (6.59)
64, 89 (14)
N, mean
41, 2.63 (.576)
257, 3.82 (.88)
50, 72.9 (10.6)
36, 83.6 (19.8)
51, 3.7 (.6)
157, 3.96 (.7)
50, 2.67 (.74)
110, 3.29 (.59)
209, 3.77 (.98)
114, 98.3 (12.9)
130, .99 (.15)
43, 94.6 (9.9)
2361
39, 85.5 (7.9)
152, 3.7 (.77)
214, 3.63 (.699)
(SD); Control
86, 4.4 (.87)
14, 100 (5.81)
102, 92 (12)
N, mean
41, 2.44 (.512)
257, 3.75 (.97)
50, 78.5 (6.93)
174, 89 (21.1)
31, 3.9 (.6)
108, 3.94 (.8)
50, 3.09 (.57)
55, 3.57 (.6)
109, 4.03 (.93)
123, 103 (12.4)
234, .98 (.14)
129, 95.3 (9.2)
-0.19 (-0.34, -0.05)
-0.24 (-0.69, 0.20)
0.00 (-0.22, 0.22)
-0.06 (-0.23, 0.11)
SMD (95% CI)
-0.89 (-1.16, -0.61)
0.80 (0.03, 1.58)
-0.23 (-0.55, 0.08)
0.35 (-0.09, 0.78)
0.08 (-0.10, 0.25)
-0.63 (-1.03, -0.23)
-0.26 (-0.62, 0.10)
-0.33 (-0.78, 0.12)
0.03 (-0.22, 0.27)
-0.64 (-1.04, -0.23)
-0.47 (-0.80, -0.14)
-0.27 (-0.50, -0.04)
-0.35 (-0.60, -0.09)
0.07 (-0.14, 0.28)
-0.07 (-0.42, 0.27)
2406
39, 83.4 (9.3)
156, 3.7 (.68)
346, 3.59 (.671)
(SD); Treatment
160, 3.7 (.74)
14, 105 (6.59)
64, 89 (14)
N, mean
41, 2.63 (.576)
257, 3.82 (.88)
50, 72.9 (10.6)
36, 83.6 (19.8)
51, 3.7 (.6)
157, 3.96 (.7)
50, 2.67 (.74)
110, 3.29 (.59)
209, 3.77 (.98)
114, 98.3 (12.9)
130, .99 (.15)
43, 94.6 (9.9)
0-1.58 0 1.58
(excluding Stepnewski-2003)
FEV1
NOTE: Weights are from random effects analysis
Overall (I-squared = 83.0%, p = 0.000)
Sobaszek-1998
Jafari-2004
Ozdemir-1995
Author-year
Pourtaghi-2009
Hayden-1984
Akbarkhanzadeh-1980
France
Iran
Turkey
Location
Iran
UK
UK
-0.37 (-0.73, -0.01)
0.00 (-0.33, 0.33)
-1.49 (-2.18, -0.79)
-0.65 (-1.04, -0.25)
SMD (95% CI)
-0.50 (-0.94, -0.05)
0.14 (-0.09, 0.38)
-0.19 (-0.51, 0.13)
502
N, mean
58, .95 (.13)
24, 2.12 (.504)
74, 87.5 (13.6)
(SD); Treatment
58, 4.73 (.69)
136, 3.79 (.82)
107, 3.63 (1.04)
424
N, mean
91, .95 (.14)
18, 3.09 (.812)
40, 96.3 (13.7)
(SD); Control
31, 5.12 (.94)
140, 3.66 (.97)
59, 3.82 (.95)
-0.37 (-0.73, -0.01)
0.00 (-0.33, 0.33)
-1.49 (-2.18, -0.79)
-0.65 (-1.04, -0.25)
SMD (95% CI)
-0.50 (-0.94, -0.05)
0.14 (-0.09, 0.38)
-0.19 (-0.51, 0.13)
502
N, mean
58, .95 (.13)
24, 2.12 (.504)
74, 87.5 (13.6)
(SD); Treatment
58, 4.73 (.69)
136, 3.79 (.82)
107, 3.63 (1.04)
0-2.18 0 2.18
FEV1 among smokers

144
NOTE: Weights are from random effects analysis
Overall (I-squared = 76.9%, p = 0.000)
Ozdemir-1995
Mur-1985
Akbarkhanzadeh-1980
Hayden-1984
Sobaszek-1998
Pourtaghi-2009
Jafari-2004
Author-year
Turkey
France
UK
UK
France
Iran
Iran
Location
-0.23 (-0.56, 0.10)
-0.43 (-1.16, 0.29)
0.12 (-0.34, 0.58)
-0.39 (-0.74, -0.05)
0.13 (-0.28, 0.55)
0.15 (-0.25, 0.55)
-0.16 (-0.50, 0.19)
-1.11 (-1.54, -0.68)
SMD (95% CI)
427
N, mean
23, 85.8 (14)
33, 3.92 (.54)
102, 3.92 (.9)
45, 4.32 (.88)
37, 1.04 (.14)
102, 4.73 (.72)
39, 2.8 (.878)
(SD); Treatment
359
N, mean
11, 91.1 (6.9)
40, 3.84 (.73)
50, 4.27 (.86)
44, 4.2 (.94)
70, 1.02 (.13)
49, 4.85 (.87)
60, 3.61 (.615)
(SD); Control
-0.23 (-0.56, 0.10)
-0.43 (-1.16, 0.29)
0.12 (-0.34, 0.58)
-0.39 (-0.74, -0.05)
0.13 (-0.28, 0.55)
0.15 (-0.25, 0.55)
-0.16 (-0.50, 0.19)
-1.11 (-1.54, -0.68)
SMD (95% CI)
427
N, mean
23, 85.8 (14)
33, 3.92 (.54)
102, 3.92 (.9)
45, 4.32 (.88)
37, 1.04 (.14)
102, 4.73 (.72)
39, 2.8 (.878)
(SD); Treatment
0-1.54 0 1.54
FEV1 among non-smokers
NOTE: Weights are from random effects analysis
.
.
Overall (I-squared = 77.0%, p = 0.000)
Akbarkhanzadeh-1980
Meo-2003
Medium/Low
Stoleski-2013
Subtotal (I-squared = 73.6%, p = 0.000)
Anttipoika-1977
Mur-1985
Jayawardana-2009
Ould-Kadi-2007
Fogh-1969
Fidan-2005
Sharifian-2011
Sobaszek-1998
Hjortsberg-1992
Pourtaghi-2009
Ozdemir-1995
Subhashree-2013
Subtotal (I-squared = 44.3%, p = 0.073)
Hayden-1984
Author-year
Wolf-1997
Gennaro-1993
High
UK
Pakistan
Macedonia
Finland
France
Sri Lanka
Algeria
Denmark
Turkey
Iran
France
Sweden
Iran
Turkey
India
UK
Location
Austria
Italy
-0.19 (-0.34, -0.05)
-0.27 (-0.50, -0.04)
-0.64 (-1.04, -0.23)
-0.24 (-0.69, 0.20)
-0.38 (-0.61, -0.15)
0.03 (-0.22, 0.27)
-0.06 (-0.23, 0.11)
0.35 (-0.09, 0.78)
-0.35 (-0.60, -0.09)
0.00 (-0.22, 0.22)
-0.33 (-0.78, 0.12)
-0.07 (-0.42, 0.27)
0.07 (-0.14, 0.28)
0.80 (0.03, 1.58)
-0.89 (-1.16, -0.61)
-0.47 (-0.80, -0.14)
-0.63 (-1.03, -0.23)
-0.04 (-0.15, 0.07)
0.08 (-0.10, 0.25)
SMD (95% CI)
-0.23 (-0.55, 0.08)
-0.26 (-0.62, 0.10)
2027
209, 3.77 (.98)
50, 2.67 (.74)
39, 83.4 (9.3)
658
157, 3.96 (.7)
346, 3.59 (.671)
41, 2.63 (.576)
114, 98.3 (12.9)
156, 3.7 (.68)
51, 3.7 (.6)
43, 94.6 (9.9)
130, .99 (.15)
14, 105 (6.59)
160, 3.7 (.74)
110, 3.29 (.59)
50, 72.9 (10.6)
1369
257, 3.82 (.88)
(SD); Treatment
64, 89 (14)
36, 83.6 (19.8)
N, mean
1968
109, 4.03 (.93)
50, 3.09 (.57)
39, 85.5 (7.9)
604
108, 3.94 (.8)
214, 3.63 (.699)
41, 2.44 (.512)
123, 103 (12.4)
152, 3.7 (.77)
31, 3.9 (.6)
129, 95.3 (9.2)
234, .98 (.14)
14, 100 (5.81)
86, 4.4 (.87)
55, 3.57 (.6)
50, 78.5 (6.93)
1364
257, 3.75 (.97)
(SD); Control
102, 92 (12)
174, 89 (21.1)
N, mean
-0.19 (-0.34, -0.05)
-0.27 (-0.50, -0.04)
-0.64 (-1.04, -0.23)
-0.24 (-0.69, 0.20)
-0.38 (-0.61, -0.15)
0.03 (-0.22, 0.27)
-0.06 (-0.23, 0.11)
0.35 (-0.09, 0.78)
-0.35 (-0.60, -0.09)
0.00 (-0.22, 0.22)
-0.33 (-0.78, 0.12)
-0.07 (-0.42, 0.27)
0.07 (-0.14, 0.28)
0.80 (0.03, 1.58)
-0.89 (-1.16, -0.61)
-0.47 (-0.80, -0.14)
-0.63 (-1.03, -0.23)
-0.04 (-0.15, 0.07)
0.08 (-0.10, 0.25)
SMD (95% CI)
-0.23 (-0.55, 0.08)
-0.26 (-0.62, 0.10)
2027
209, 3.77 (.98)
50, 2.67 (.74)
39, 83.4 (9.3)
658
157, 3.96 (.7)
346, 3.59 (.671)
41, 2.63 (.576)
114, 98.3 (12.9)
156, 3.7 (.68)
51, 3.7 (.6)
43, 94.6 (9.9)
130, .99 (.15)
14, 105 (6.59)
160, 3.7 (.74)
110, 3.29 (.59)
50, 72.9 (10.6)
1369
257, 3.82 (.88)
(SD); Treatment
64, 89 (14)
36, 83.6 (19.8)
N, mean
0-1.58 0 1.58
(excluding Stepnewski-2003)
FEV1 by income level

145
NOTE: Weights are from random effects analysis
.
.
Overall (I-squared = 76.2%, p = 0.000)
Ozdemir-1995
28/37 years
Author-year
Ould-Kadi-2007
Gennaro-1993
38/55 years
Wolf-1997
Akbarkhanzadeh-1980
Stoleski-2013
Sharifian-2011
Meo-2003
Hjortsberg-1992
Mur-1985
Subhashree-2013
Subtotal (I-squared = 81.4%, p = 0.000)
Pourtaghi-2009
Anttipoika-1977
Sobaszek-1998
Fidan-2005
Subtotal (I-squared = 56.4%, p = 0.043)
Jayawardana-2009
Turkey
Location
Algeria
Italy
Austria
UK
Macedonia
Iran
Pakistan
Sweden
France
India
Iran
Finland
France
Turkey
Sri Lanka
-0.23 (-0.39, -0.07)
-0.47 (-0.80, -0.14)
SMD (95% CI)
-0.35 (-0.60, -0.09)
-0.26 (-0.62, 0.10)
-0.23 (-0.55, 0.08)
-0.27 (-0.50, -0.04)
-0.24 (-0.69, 0.20)
-0.07 (-0.42, 0.27)
-0.64 (-1.04, -0.23)
0.80 (0.03, 1.58)
-0.06 (-0.23, 0.11)
-0.63 (-1.03, -0.23)
-0.31 (-0.53, -0.08)
-0.89 (-1.16, -0.61)
0.03 (-0.22, 0.27)
0.07 (-0.14, 0.28)
-0.33 (-0.78, 0.12)
-0.11 (-0.32, 0.09)
0.35 (-0.09, 0.78)
1614
110, 3.29 (.59)
(SD); Treatment
114, 98.3 (12.9)
36, 83.6 (19.8)
64, 89 (14)
209, 3.77 (.98)
39, 83.4 (9.3)
43, 94.6 (9.9)
50, 2.67 (.74)
14, 105 (6.59)
346, 3.59 (.671)
50, 72.9 (10.6)
1122
160, 3.7 (.74)
157, 3.96 (.7)
130, .99 (.15)
51, 3.7 (.6)
N, mean
492
41, 2.63 (.576)
1559
55, 3.57 (.6)
(SD); Control
123, 103 (12.4)
174, 89 (21.1)
102, 92 (12)
109, 4.03 (.93)
39, 85.5 (7.9)
129, 95.3 (9.2)
50, 3.09 (.57)
14, 100 (5.81)
214, 3.63 (.699)
50, 78.5 (6.93)
887
86, 4.4 (.87)
108, 3.94 (.8)
234, .98 (.14)
31, 3.9 (.6)
N, mean
672
41, 2.44 (.512)
-0.23 (-0.39, -0.07)
-0.47 (-0.80, -0.14)
SMD (95% CI)
-0.35 (-0.60, -0.09)
-0.26 (-0.62, 0.10)
-0.23 (-0.55, 0.08)
-0.27 (-0.50, -0.04)
-0.24 (-0.69, 0.20)
-0.07 (-0.42, 0.27)
-0.64 (-1.04, -0.23)
0.80 (0.03, 1.58)
-0.06 (-0.23, 0.11)
-0.63 (-1.03, -0.23)
-0.31 (-0.53, -0.08)
-0.89 (-1.16, -0.61)
0.03 (-0.22, 0.27)
0.07 (-0.14, 0.28)
-0.33 (-0.78, 0.12)
-0.11 (-0.32, 0.09)
0.35 (-0.09, 0.78)
1614
110, 3.29 (.59)
(SD); Treatment
114, 98.3 (12.9)
36, 83.6 (19.8)
64, 89 (14)
209, 3.77 (.98)
39, 83.4 (9.3)
43, 94.6 (9.9)
50, 2.67 (.74)
14, 105 (6.59)
346, 3.59 (.671)
50, 72.9 (10.6)
1122
160, 3.7 (.74)
157, 3.96 (.7)
130, .99 (.15)
51, 3.7 (.6)
N, mean
492
41, 2.63 (.576)
0-1.58 0 1.58
(excluding Stepnewski-2003)
FEV1 by welders' age
NOTE: Weights are from random effects analysis
Overall (I-squared = 70.5%, p = 0.009)
Author-year
Hjortsberg-1992
Sobaszek-1998
Ould-Kadi-2007
Akbarkhanzadeh-1980
Gennaro-1993
Location
Sweden
France
Algeria
UK
Italy
-0.12 (-0.37, 0.13)
SMD (95% CI)
0.80 (0.03, 1.58)
0.07 (-0.14, 0.28)
-0.35 (-0.60, -0.09)
-0.27 (-0.50, -0.04)
-0.26 (-0.62, 0.10)
2406
(SD); Treatment
14, 105 (6.59)
130, .99 (.15)
114, 98.3 (12.9)
209, 3.77 (.98)
36, 83.6 (19.8)
N, mean
2361
(SD); Control
14, 100 (5.81)
234, .98 (.14)
123, 103 (12.4)
109, 4.03 (.93)
174, 89 (21.1)
N, mean
-0.12 (-0.37, 0.13)
SMD (95% CI)
0.80 (0.03, 1.58)
0.07 (-0.14, 0.28)
-0.35 (-0.60, -0.09)
-0.27 (-0.50, -0.04)
-0.26 (-0.62, 0.10)
2406
(SD); Treatment
14, 105 (6.59)
130, .99 (.15)
114, 98.3 (12.9)
209, 3.77 (.98)
36, 83.6 (19.8)
N, mean
0-1.58 0 1.58
FEV1 in Shipbuilding & Repair

146
NOTE: Weights are from random effects analysis
Overall (I-squared = 85.4%, p = 0.000)
Sobaszek-1998
Stoleski-2013
Fidan-2005
Ould-Kadi-2007
Author-year
Anttipoika-1977
Ozdemir-1995
Meo-2003
Stepnewski-2003
Jayawardana-2009
Pourtaghi-2009
Sharifian-2011
Mur-1985
Gennaro-1993
Akbarkhanzadeh-1980
Wolf-1997
France
Macedonia
Turkey
Algeria
Location
Finland
Turkey
Pakistan
Poland
Sri Lanka
Iran
Iran
France
Italy
UK
Austria
-0.07 (-0.27, 0.12)
0.16 (-0.06, 0.37)
-0.39 (-0.83, 0.06)
-0.14 (-0.59, 0.30)
-0.36 (-0.61, -0.10)
SMD (95% CI)
0.15 (-0.10, 0.40)
-0.67 (-1.00, -0.34)
-0.23 (-0.62, 0.16)
1.07 (0.78, 1.36)
0.30 (-0.13, 0.74)
-0.28 (-0.54, -0.02)
-0.06 (-0.41, 0.28)
-0.06 (-0.23, 0.11)
-0.36 (-0.72, -0.00)
-0.23 (-0.46, 0.01)
-0.08 (-0.39, 0.23)
1779
130, 1.03 (.12)
39, 87.6 (9.7)
51, 4.1 (.7)
114, 99.5 (12.3)
(SD); Treatment
157, 4.95 (.8)
110, 3.86 (.76)
50, 3.98 (.67)
94, 98.7 (1.08)
41, 2.97 (.704)
160, 4.73 (.71)
43, 94.9 (10.6)
346, 4.81 (.69)
36, 86.6 (18.6)
209, 5 (.98)
64, 106 (14)
N, mean
1745
234, 1.01 (.13)
39, 91.2 (8.9)
31, 4.2 (.7)
123, 104 (12.3)
(SD); Control
108, 4.83 (.8)
55, 4.38 (.8)
50, 4.14 (.72)
115, 97.5 (1.17)
41, 2.79 (.448)
86, 4.95 (.9)
129, 95.5 (9.2)
214, 4.85 (.76)
174, 93.3 (18.5)
109, 5.22 (.95)
102, 107 (12)
N, mean
-0.07 (-0.27, 0.12)
0.16 (-0.06, 0.37)
-0.39 (-0.83, 0.06)
-0.14 (-0.59, 0.30)
-0.36 (-0.61, -0.10)
SMD (95% CI)
0.15 (-0.10, 0.40)
-0.67 (-1.00, -0.34)
-0.23 (-0.62, 0.16)
1.07 (0.78, 1.36)
0.30 (-0.13, 0.74)
-0.28 (-0.54, -0.02)
-0.06 (-0.41, 0.28)
-0.06 (-0.23, 0.11)
-0.36 (-0.72, -0.00)
-0.23 (-0.46, 0.01)
-0.08 (-0.39, 0.23)
1779
130, 1.03 (.12)
39, 87.6 (9.7)
51, 4.1 (.7)
114, 99.5 (12.3)
(SD); Treatment
157, 4.95 (.8)
110, 3.86 (.76)
50, 3.98 (.67)
94, 98.7 (1.08)
41, 2.97 (.704)
160, 4.73 (.71)
43, 94.9 (10.6)
346, 4.81 (.69)
36, 86.6 (18.6)
209, 5 (.98)
64, 106 (14)
N, mean
0-1.36 0 1.36
NOTE: Weights are from random effects analysis
Overall (I-squared = 62.9%, p = 0.001)
Wolf-1997
Akbarkhanzadeh-1980
Author-year
Jayawardana-2009
Sharifian-2011
Ould-Kadi-2007
Pourtaghi-2009
Sobaszek-1998
Gennaro-1993
Anttipoika-1977
Mur-1985
Ozdemir-1995
Stoleski-2013
Fidan-2005
Meo-2003
Austria
UK
Location
Sri Lanka
Iran
Algeria
Iran
France
Italy
Finland
France
Turkey
Macedonia
Turkey
Pakistan
-0.15 (-0.28, -0.02)
-0.08 (-0.39, 0.23)
-0.23 (-0.46, 0.01)
SMD (95% CI)
0.30 (-0.13, 0.74)
-0.06 (-0.41, 0.28)
-0.36 (-0.61, -0.10)
-0.28 (-0.54, -0.02)
0.16 (-0.06, 0.37)
-0.36 (-0.72, -0.00)
0.15 (-0.10, 0.40)
-0.06 (-0.23, 0.11)
-0.67 (-1.00, -0.34)
-0.39 (-0.83, 0.06)
-0.14 (-0.59, 0.30)
-0.23 (-0.62, 0.16)
2406
64, 106 (14)
209, 5 (.98)
(SD); Treatment
41, 2.97 (.704)
43, 94.9 (10.6)
114, 99.5 (12.3)
N, mean
160, 4.73 (.71)
130, 1.03 (.12)
36, 86.6 (18.6)
157, 4.95 (.8)
346, 4.81 (.69)
110, 3.86 (.76)
39, 87.6 (9.7)
51, 4.1 (.7)
50, 3.98 (.67)
2361
102, 107 (12)
109, 5.22 (.95)
(SD); Control
41, 2.79 (.448)
129, 95.5 (9.2)
123, 104 (12.3)
N, mean
86, 4.95 (.9)
234, 1.01 (.13)
174, 93.3 (18.5)
108, 4.83 (.8)
214, 4.85 (.76)
55, 4.38 (.8)
39, 91.2 (8.9)
31, 4.2 (.7)
50, 4.14 (.72)
-0.15 (-0.28, -0.02)
-0.08 (-0.39, 0.23)
-0.23 (-0.46, 0.01)
SMD (95% CI)
0.30 (-0.13, 0.74)
-0.06 (-0.41, 0.28)
-0.36 (-0.61, -0.10)
-0.28 (-0.54, -0.02)
0.16 (-0.06, 0.37)
-0.36 (-0.72, -0.00)
0.15 (-0.10, 0.40)
-0.06 (-0.23, 0.11)
-0.67 (-1.00, -0.34)
-0.39 (-0.83, 0.06)
-0.14 (-0.59, 0.30)
-0.23 (-0.62, 0.16)
2406
64, 106 (14)
209, 5 (.98)
(SD); Treatment
41, 2.97 (.704)
43, 94.9 (10.6)
114, 99.5 (12.3)
N, mean
160, 4.73 (.71)
130, 1.03 (.12)
36, 86.6 (18.6)
157, 4.95 (.8)
346, 4.81 (.69)
110, 3.86 (.76)
39, 87.6 (9.7)
51, 4.1 (.7)
50, 3.98 (.67)
0-1 0 1
(excluding Stepnewski-2003)
FVC

147
NOTE: Weights are from random effects analysis
Overall (I-squared = 52.1%, p = 0.080)
Author-year
Pourtaghi-2009
Ozdemir-1995
Sobaszek-1998
Jafari-2004
Akbarkhanzadeh-1980
Location
Iran
Turkey
France
Iran
UK
-0.35 (-0.61, -0.09)
SMD (95% CI)
-0.16 (-0.60, 0.28)
-0.69 (-1.09, -0.30)
-0.16 (-0.49, 0.17)
-0.84 (-1.48, -0.20)
-0.17 (-0.48, 0.15)
502
(SD); Treatment
58, 4.35 (.88)
74, 87 (16.7)
58, 1.01 (.1)
24, 3.55 (.317)
107, 4.91 (1.04)
N, mean
424
(SD); Control
31, 4.49 (.87)
40, 97.7 (12.5)
91, 1.03 (.14)
18, 4.01 (.751)
59, 5.07 (.82)
N, mean
-0.35 (-0.61, -0.09)
SMD (95% CI)
-0.16 (-0.60, 0.28)
-0.69 (-1.09, -0.30)
-0.16 (-0.49, 0.17)
-0.84 (-1.48, -0.20)
-0.17 (-0.48, 0.15)
502
(SD); Treatment
58, 4.35 (.88)
74, 87 (16.7)
58, 1.01 (.1)
24, 3.55 (.317)
107, 4.91 (1.04)
N, mean
0-1.48 0 1.48
FVC among smokers
NOTE: Weights are from random effects analysis
Overall (I-squared = 80.7%, p = 0.000)
Ozdemir-1995
Jafari-2004
Author-year
Mur-1985
Pourtaghi-2009
Akbarkhanzadeh-1980
Sobaszek-1998
Turkey
Iran
Location
France
Iran
UK
France
-0.35 (-0.75, 0.05)
-0.66 (-1.39, 0.08)
-1.21 (-1.65, -0.77)
SMD (95% CI)
0.01 (-0.45, 0.48)
-0.26 (-0.60, 0.08)
-0.32 (-0.66, 0.02)
0.22 (-0.18, 0.62)
427
23, 81.1 (13.3)
N, mean
39, 3.84 (.445)
(SD); Treatment
33, 4.92 (.56)
102, 3.63 (.74)
102, 5.1 (.9)
37, 1.06 (.15)
359
11, 90 (14.2)
N, mean
60, 4.51 (.612)
(SD); Control
40, 4.91 (.76)
49, 3.82 (.73)
50, 5.4 (1.05)
70, 1.03 (.13)
-0.35 (-0.75, 0.05)
-0.66 (-1.39, 0.08)
-1.21 (-1.65, -0.77)
SMD (95% CI)
0.01 (-0.45, 0.48)
-0.26 (-0.60, 0.08)
-0.32 (-0.66, 0.02)
0.22 (-0.18, 0.62)
427
23, 81.1 (13.3)
N, mean
39, 3.84 (.445)
(SD); Treatment
33, 4.92 (.56)
102, 3.63 (.74)
102, 5.1 (.9)
37, 1.06 (.15)
0-1.65 0 1.65
FVC among non-smokers

148
NOTE: Weights are from random effects analysis
.
.
Overall (I-squared = 62.9%, p = 0.001)
Akbarkhanzadeh-1980
Stoleski-2013
Gennaro-1993
Author-year
Anttipoika-1977
Medium/Low
Wolf-1997
Sobaszek-1998
Sharifian-2011
Ould-Kadi-2007
Subtotal (I-squared = 52.7%, p = 0.039)
Meo-2003
Jayawardana-2009
Mur-1985
Subtotal (I-squared = 55.4%, p = 0.047)
Pourtaghi-2009
Ozdemir-1995
Fidan-2005
High
UK
Macedonia
Italy
Location
Finland
Austria
France
Iran
Algeria
Pakistan
Sri Lanka
France
Iran
Turkey
Turkey
-0.15 (-0.28, -0.02)
-0.23 (-0.46, 0.01)
-0.39 (-0.83, 0.06)
-0.36 (-0.72, -0.00)
SMD (95% CI)
0.15 (-0.10, 0.40)
-0.08 (-0.39, 0.23)
0.16 (-0.06, 0.37)
-0.06 (-0.41, 0.28)
-0.36 (-0.61, -0.10)
-0.25 (-0.43, -0.07)
-0.23 (-0.62, 0.16)
0.30 (-0.13, 0.74)
-0.06 (-0.23, 0.11)
-0.05 (-0.20, 0.10)
-0.28 (-0.54, -0.02)
-0.67 (-1.00, -0.34)
-0.14 (-0.59, 0.30)
1550
209, 5 (.98)
39, 87.6 (9.7)
36, 86.6 (18.6)
(SD); Treatment
157, 4.95 (.8)
64, 106 (14)
130, 1.03 (.12)
43, 94.9 (10.6)
N, mean
114, 99.5 (12.3)
608
50, 3.98 (.67)
41, 2.97 (.704)
346, 4.81 (.69)
942
160, 4.73 (.71)
110, 3.86 (.76)
51, 4.1 (.7)
1495
109, 5.22 (.95)
39, 91.2 (8.9)
174, 93.3 (18.5)
(SD); Control
108, 4.83 (.8)
102, 107 (12)
234, 1.01 (.13)
129, 95.5 (9.2)
N, mean
123, 104 (12.3)
554
50, 4.14 (.72)
41, 2.79 (.448)
214, 4.85 (.76)
941
86, 4.95 (.9)
55, 4.38 (.8)
31, 4.2 (.7)
-0.15 (-0.28, -0.02)
-0.23 (-0.46, 0.01)
-0.39 (-0.83, 0.06)
-0.36 (-0.72, -0.00)
SMD (95% CI)
0.15 (-0.10, 0.40)
-0.08 (-0.39, 0.23)
0.16 (-0.06, 0.37)
-0.06 (-0.41, 0.28)
-0.36 (-0.61, -0.10)
-0.25 (-0.43, -0.07)
-0.23 (-0.62, 0.16)
0.30 (-0.13, 0.74)
-0.06 (-0.23, 0.11)
-0.05 (-0.20, 0.10)
-0.28 (-0.54, -0.02)
-0.67 (-1.00, -0.34)
-0.14 (-0.59, 0.30)
1550
209, 5 (.98)
39, 87.6 (9.7)
36, 86.6 (18.6)
(SD); Treatment
157, 4.95 (.8)
64, 106 (14)
130, 1.03 (.12)
43, 94.9 (10.6)
N, mean
114, 99.5 (12.3)
608
50, 3.98 (.67)
41, 2.97 (.704)
346, 4.81 (.69)
942
160, 4.73 (.71)
110, 3.86 (.76)
51, 4.1 (.7)
0-1 0 1
(excluding Stepnewski-2003)
FVC by income level
NOTE: Weights are from random effects analysis
.
.
Overall (I-squared = 62.9%, p = 0.001)
Sharifian-2011
Ozdemir-1995
Fidan-2005
Akbarkhanzadeh-1980
Wolf-1997
Gennaro-1993
Ould-Kadi-2007
Author-year
Subtotal (I-squared = 67.3%, p = 0.002)
Anttipoika-1977
Stoleski-2013
Meo-2003
28/37 years
38/55 years
Pourtaghi-2009
Sobaszek-1998
Subtotal (I-squared = 61.2%, p = 0.035)
Jayawardana-2009
Mur-1985
Iran
Turkey
Turkey
UK
Austria
Italy
Algeria
Location
Finland
Macedonia
Pakistan
Iran
France
Sri Lanka
France
-0.15 (-0.28, -0.02)
-0.06 (-0.41, 0.28)
-0.67 (-1.00, -0.34)
-0.14 (-0.59, 0.30)
-0.23 (-0.46, 0.01)
-0.08 (-0.39, 0.23)
-0.36 (-0.72, -0.00)
-0.36 (-0.61, -0.10)
SMD (95% CI)
-0.16 (-0.33, 0.02)
0.15 (-0.10, 0.40)
-0.39 (-0.83, 0.06)
-0.23 (-0.62, 0.16)
-0.28 (-0.54, -0.02)
0.16 (-0.06, 0.37)
-0.15 (-0.36, 0.07)
0.30 (-0.13, 0.74)
-0.06 (-0.23, 0.11)
1550
43, 94.9 (10.6)
110, 3.86 (.76)
51, 4.1 (.7)
209, 5 (.98)
64, 106 (14)
36, 86.6 (18.6)
114, 99.5 (12.3)
(SD); Treatment
1072
157, 4.95 (.8)
39, 87.6 (9.7)
50, 3.98 (.67)
N, mean
160, 4.73 (.71)
130, 1.03 (.12)
478
41, 2.97 (.704)
346, 4.81 (.69)
1495
129, 95.5 (9.2)
55, 4.38 (.8)
31, 4.2 (.7)
109, 5.22 (.95)
102, 107 (12)
174, 93.3 (18.5)
123, 104 (12.3)
(SD); Control
837
108, 4.83 (.8)
39, 91.2 (8.9)
50, 4.14 (.72)
N, mean
86, 4.95 (.9)
234, 1.01 (.13)
658
41, 2.79 (.448)
214, 4.85 (.76)
-0.15 (-0.28, -0.02)
-0.06 (-0.41, 0.28)
-0.67 (-1.00, -0.34)
-0.14 (-0.59, 0.30)
-0.23 (-0.46, 0.01)
-0.08 (-0.39, 0.23)
-0.36 (-0.72, -0.00)
-0.36 (-0.61, -0.10)
SMD (95% CI)
-0.16 (-0.33, 0.02)
0.15 (-0.10, 0.40)
-0.39 (-0.83, 0.06)
-0.23 (-0.62, 0.16)
-0.28 (-0.54, -0.02)
0.16 (-0.06, 0.37)
-0.15 (-0.36, 0.07)
0.30 (-0.13, 0.74)
-0.06 (-0.23, 0.11)
1550
43, 94.9 (10.6)
110, 3.86 (.76)
51, 4.1 (.7)
209, 5 (.98)
64, 106 (14)
36, 86.6 (18.6)
114, 99.5 (12.3)
(SD); Treatment
1072
157, 4.95 (.8)
39, 87.6 (9.7)
50, 3.98 (.67)
N, mean
160, 4.73 (.71)
130, 1.03 (.12)
478
41, 2.97 (.704)
346, 4.81 (.69)
0-1 0 1
(excluding Stepnewski-2003)
FVC by welders' age

149
NOTE: Weights are from random effects analysis
Overall (I-squared = 75.3%, p = 0.007)
Author-year
Gennaro-1993
Ould-Kadi-2007
Akbarkhanzadeh-1980
Sobaszek-1998
Location
Italy
Algeria
UK
France
-0.18 (-0.44, 0.08)
SMD (95% CI)
-0.36 (-0.72, -0.00)
-0.36 (-0.61, -0.10)
-0.23 (-0.46, 0.01)
0.16 (-0.06, 0.37)
2406
(SD); Treatment
N, mean
36, 86.6 (18.6)
114, 99.5 (12.3)
209, 5 (.98)
130, 1.03 (.12)
2361
(SD); Control
N, mean
174, 93.3 (18.5)
123, 104 (12.3)
109, 5.22 (.95)
234, 1.01 (.13)
-0.18 (-0.44, 0.08)
SMD (95% CI)
-0.36 (-0.72, -0.00)
-0.36 (-0.61, -0.10)
-0.23 (-0.46, 0.01)
0.16 (-0.06, 0.37)
2406
(SD); Treatment
N, mean
36, 86.6 (18.6)
114, 99.5 (12.3)
209, 5 (.98)
130, 1.03 (.12)
0-.723 0 .723
FVC in Shipbuilding & Repair
NOTE: Weights are from random effects analysis
Overall (I-squared = 96.1%, p = 0.000)
Sharifian-2011
Stepnewski-2003
Ozdemir-1995
Anttipoika-1977
Subhashree-2013
Author-year
Mur-1985
Stoleski-2013
Sobaszek-1998
Meo-2003
Wolf-1997
Gennaro-1993
Ould-Kadi-2007
Fidan-2005
Iran
Poland
Turkey
Finland
India
Location
France
Macedonia
France
Pakistan
Austria
Italy
Algeria
Turkey
-0.50 (-0.92, -0.07)
-0.20 (-0.54, 0.15)
-4.59 (-5.11, -4.07)
0.41 (0.08, 0.73)
-0.20 (-0.44, 0.05)
-0.53 (-0.93, -0.13)
SMD (95% CI)
-0.02 (-0.19, 0.15)
-0.29 (-0.73, 0.16)
-0.12 (-0.34, 0.09)
-0.51 (-0.90, -0.11)
-0.13 (-0.44, 0.19)
0.13 (-0.23, 0.49)
0.02 (-0.24, 0.27)
-0.75 (-1.21, -0.29)
1419
43, 82.5 (4.6)
94, 80.3 (.91)
110, 85.9 (8.67)
157, 80 (6.8)
50, 69.2 (5.52)
(SD); Treatment
346, 74.1 (9.5)
39, 74.1 (4.8)
130, .95 (.08)
50, 68 (16.4)
N, mean
64, 93 (8)
36, 97.1 (9)
114, 82.2 (6.2)
51, 88.5 (7.2)
1559
129, 83.4 (4.5)
115, 84.1 (.75)
55, 82.3 (9.76)
108, 81.4 (7.5)
50, 71.9 (4.53)
(SD); Control
214, 74.3 (8.8)
39, 75.4 (4.2)
234, .96 (.08)
50, 75.2 (11.8)
N, mean
102, 94 (8)
174, 95.8 (10.6)
123, 82.1 (6)
31, 93.5 (5.7)
-0.50 (-0.92, -0.07)
-0.20 (-0.54, 0.15)
-4.59 (-5.11, -4.07)
0.41 (0.08, 0.73)
-0.20 (-0.44, 0.05)
-0.53 (-0.93, -0.13)
SMD (95% CI)
-0.02 (-0.19, 0.15)
-0.29 (-0.73, 0.16)
-0.12 (-0.34, 0.09)
-0.51 (-0.90, -0.11)
-0.13 (-0.44, 0.19)
0.13 (-0.23, 0.49)
0.02 (-0.24, 0.27)
-0.75 (-1.21, -0.29)
1419
43, 82.5 (4.6)
94, 80.3 (.91)
110, 85.9 (8.67)
157, 80 (6.8)
50, 69.2 (5.52)
(SD); Treatment
346, 74.1 (9.5)
39, 74.1 (4.8)
130, .95 (.08)
50, 68 (16.4)
N, mean
64, 93 (8)
36, 97.1 (9)
114, 82.2 (6.2)
51, 88.5 (7.2)
0-5.11 0 5.11

150
Smoking only 2 studies Non-smoking only 3 studies
NOTE: Weights are from random effects analysis
Overall (I-squared = 63.4%, p = 0.002)
Ozdemir-1995
Sobaszek-1998
Fidan-2005
Gennaro-1993
Ould-Kadi-2007
Mur-1985
Author-year
Sharifian-2011
Wolf-1997
Stoleski-2013
Subhashree-2013
Anttipoika-1977
Meo-2003
Turkey
France
Turkey
Italy
Algeria
France
Location
Iran
Austria
Macedonia
India
Finland
Pakistan
-0.15 (-0.29, -0.00)
0.41 (0.08, 0.73)
-0.12 (-0.34, 0.09)
-0.75 (-1.21, -0.29)
0.13 (-0.23, 0.49)
0.02 (-0.24, 0.27)
-0.02 (-0.19, 0.15)
SMD (95% CI)
-0.20 (-0.54, 0.15)
-0.13 (-0.44, 0.19)
-0.29 (-0.73, 0.16)
-0.53 (-0.93, -0.13)
-0.20 (-0.44, 0.05)
-0.51 (-0.90, -0.11)
1419
110, 85.9 (8.67)
130, .95 (.08)
51, 88.5 (7.2)
36, 97.1 (9)
114, 82.2 (6.2)
346, 74.1 (9.5)
(SD); Treatment
43, 82.5 (4.6)
64, 93 (8)
39, 74.1 (4.8)
N, mean
50, 69.2 (5.52)
157, 80 (6.8)
50, 68 (16.4)
1559
55, 82.3 (9.76)
234, .96 (.08)
31, 93.5 (5.7)
174, 95.8 (10.6)
123, 82.1 (6)
214, 74.3 (8.8)
(SD); Control
129, 83.4 (4.5)
102, 94 (8)
39, 75.4 (4.2)
N, mean
50, 71.9 (4.53)
108, 81.4 (7.5)
50, 75.2 (11.8)
-0.15 (-0.29, -0.00)
0.41 (0.08, 0.73)
-0.12 (-0.34, 0.09)
-0.75 (-1.21, -0.29)
0.13 (-0.23, 0.49)
0.02 (-0.24, 0.27)
-0.02 (-0.19, 0.15)
SMD (95% CI)
-0.20 (-0.54, 0.15)
-0.13 (-0.44, 0.19)
-0.29 (-0.73, 0.16)
-0.53 (-0.93, -0.13)
-0.20 (-0.44, 0.05)
-0.51 (-0.90, -0.11)
1419
110, 85.9 (8.67)
130, .95 (.08)
51, 88.5 (7.2)
36, 97.1 (9)
114, 82.2 (6.2)
346, 74.1 (9.5)
(SD); Treatment
43, 82.5 (4.6)
64, 93 (8)
39, 74.1 (4.8)
N, mean
50, 69.2 (5.52)
157, 80 (6.8)
50, 68 (16.4)
0-1.21 0 1.21
(excluding Stepnewski-2003)
FEV1/FVC Ratio
NOTE: Weights are from random effects analysis
.
.
Overall (I-squared = 63.4%, p = 0.002)
Sharifian-2011
Subhashree-2013
Subtotal (I-squared = 77.1%, p = 0.000)
Wolf-1997
Author-year
Gennaro-1993
Anttipoika-1977
Fidan-2005
Ould-Kadi-2007
Subtotal (I-squared = 0.0%, p = 0.585)
Medium/Low
Mur-1985
Meo-2003
High
Sobaszek-1998
Stoleski-2013
Ozdemir-1995
Iran
India
Austria
Location
Italy
Finland
Turkey
Algeria
France
Pakistan
France
Macedonia
Turkey
-0.15 (-0.29, -0.00)
-0.20 (-0.54, 0.15)
-0.53 (-0.93, -0.13)
-0.24 (-0.53, 0.05)
-0.13 (-0.44, 0.19)
SMD (95% CI)
0.13 (-0.23, 0.49)
-0.20 (-0.44, 0.05)
-0.75 (-1.21, -0.29)
0.02 (-0.24, 0.27)
-0.08 (-0.18, 0.03)
-0.02 (-0.19, 0.15)
-0.51 (-0.90, -0.11)
-0.12 (-0.34, 0.09)
-0.29 (-0.73, 0.16)
0.41 (0.08, 0.73)
1190
43, 82.5 (4.6)
50, 69.2 (5.52)
457
64, 93 (8)
(SD); Treatment
36, 97.1 (9)
157, 80 (6.8)
51, 88.5 (7.2)
114, 82.2 (6.2)
733
346, 74.1 (9.5)
50, 68 (16.4)
130, .95 (.08)
39, 74.1 (4.8)
110, 85.9 (8.67)
N, mean
1309
129, 83.4 (4.5)
50, 71.9 (4.53)
477
102, 94 (8)
(SD); Control
174, 95.8 (10.6)
108, 81.4 (7.5)
31, 93.5 (5.7)
123, 82.1 (6)
832
214, 74.3 (8.8)
50, 75.2 (11.8)
234, .96 (.08)
39, 75.4 (4.2)
55, 82.3 (9.76)
N, mean
-0.15 (-0.29, -0.00)
-0.20 (-0.54, 0.15)
-0.53 (-0.93, -0.13)
-0.24 (-0.53, 0.05)
-0.13 (-0.44, 0.19)
SMD (95% CI)
0.13 (-0.23, 0.49)
-0.20 (-0.44, 0.05)
-0.75 (-1.21, -0.29)
0.02 (-0.24, 0.27)
-0.08 (-0.18, 0.03)
-0.02 (-0.19, 0.15)
-0.51 (-0.90, -0.11)
-0.12 (-0.34, 0.09)
-0.29 (-0.73, 0.16)
0.41 (0.08, 0.73)
1190
43, 82.5 (4.6)
50, 69.2 (5.52)
457
64, 93 (8)
(SD); Treatment
36, 97.1 (9)
157, 80 (6.8)
51, 88.5 (7.2)
114, 82.2 (6.2)
733
346, 74.1 (9.5)
50, 68 (16.4)
130, .95 (.08)
39, 74.1 (4.8)
110, 85.9 (8.67)
N, mean
0-1.21 0 1.21
(excluding Stepnewski-2003)
FEV1/FVC Ratio by income level

151
Respiratory symptoms
NOTE: Weights are from random effects analysis
.
.
Overall (I-squared = 63.4%, p = 0.002)
Fidan-2005
Author-year
Subtotal (I-squared = 0.0%, p = 0.516)
28/37 years
Meo-2003
Gennaro-1993
Subhashree-2013
38/55 years
Subtotal (I-squared = 74.7%, p = 0.000)
Sharifian-2011
Ould-Kadi-2007
Mur-1985
Stoleski-2013
Anttipoika-1977
Wolf-1997
Sobaszek-1998
Ozdemir-1995
Turkey
Location
Pakistan
Italy
India
Iran
Algeria
France
Macedonia
Finland
Austria
France
Turkey
-0.15 (-0.29, -0.00)
-0.75 (-1.21, -0.29)
SMD (95% CI)
-0.10 (-0.25, 0.05)
-0.51 (-0.90, -0.11)
0.13 (-0.23, 0.49)
-0.53 (-0.93, -0.13)
-0.19 (-0.40, 0.02)
-0.20 (-0.54, 0.15)
0.02 (-0.24, 0.27)
-0.02 (-0.19, 0.15)
-0.29 (-0.73, 0.16)
-0.20 (-0.44, 0.05)
-0.13 (-0.44, 0.19)
-0.12 (-0.34, 0.09)
0.41 (0.08, 0.73)
1190
51, 88.5 (7.2)
(SD); Treatment
269
50, 68 (16.4)
36, 97.1 (9)
50, 69.2 (5.52)
921
43, 82.5 (4.6)
114, 82.2 (6.2)
346, 74.1 (9.5)
39, 74.1 (4.8)
157, 80 (6.8)
64, 93 (8)
130, .95 (.08)
110, 85.9 (8.67)
N, mean
1309
31, 93.5 (5.7)
(SD); Control
549
50, 75.2 (11.8)
174, 95.8 (10.6)
50, 71.9 (4.53)
760
129, 83.4 (4.5)
123, 82.1 (6)
214, 74.3 (8.8)
39, 75.4 (4.2)
108, 81.4 (7.5)
102, 94 (8)
234, .96 (.08)
55, 82.3 (9.76)
N, mean
-0.15 (-0.29, -0.00)
-0.75 (-1.21, -0.29)
SMD (95% CI)
-0.10 (-0.25, 0.05)
-0.51 (-0.90, -0.11)
0.13 (-0.23, 0.49)
-0.53 (-0.93, -0.13)
-0.19 (-0.40, 0.02)
-0.20 (-0.54, 0.15)
0.02 (-0.24, 0.27)
-0.02 (-0.19, 0.15)
-0.29 (-0.73, 0.16)
-0.20 (-0.44, 0.05)
-0.13 (-0.44, 0.19)
-0.12 (-0.34, 0.09)
0.41 (0.08, 0.73)
1190
51, 88.5 (7.2)
(SD); Treatment
269
50, 68 (16.4)
36, 97.1 (9)
50, 69.2 (5.52)
921
43, 82.5 (4.6)
114, 82.2 (6.2)
346, 74.1 (9.5)
39, 74.1 (4.8)
157, 80 (6.8)
64, 93 (8)
130, .95 (.08)
110, 85.9 (8.67)
N, mean
0-1.21 0 1.21
(excluding Stepnewski-2003)
FEV1/FVC Ratio by welders' age
NOTE: Weights are from random effects analysis
Overall (I-squared = 40.2%, p = 0.033)
Kilburn-1989
McMillan-1979
Barhad-1975
Lyngenbo-1989
Author-year
Sjogren-1985
Ozdemir-1995
Nielsen-1993
Sharifian-2011
Fidan-2005
Anttipoika-1977
Jayawardana-2009
McMillan-1984
Mur-1985
Zober-1985
Gennaro-1993
Oxhoj-1979
Bradshaw-1998
Akbarkhanzadeh-1980
Fogh-1969
Sobaszek-1998
US
UK
Romania
Denmark
Location
Sweden
Turkey
Sweden
Iran
Turkey
Finland
Sri Lanka
UK
France
Germany
Italy
Sweden
New Zealand
UK
Denmark
France
1.92 (1.50, 2.45)
2.17 (1.39, 3.39)
2.88 (0.50, 16.48)
1.64 (0.82, 3.27)
12.60 (0.72, 219.79)
OR (95% CI)
2.16 (0.77, 6.07)
3.50 (1.37, 8.97)
3.27 (0.32, 33.84)
5.53 (1.26, 24.19)
3.68 (1.11, 12.19)
1.98 (1.03, 3.82)
4.64 (1.19, 18.16)
1.15 (0.55, 2.41)
1.12 (0.76, 1.65)
0.98 (0.60, 1.58)
1.51 (0.59, 3.83)
3.31 (1.49, 7.36)
3.05 (0.76, 12.35)
27.70 (1.67, 458.91)
1.35 (0.83, 2.21)
2.08 (0.82, 5.27)
558/2620
41/145
5/25
34/173
12/74
Treatment
15/252
33/110
Events,
3/25
5/43
18/51
38/157
11/41
17/135
93/346
99/305
7/36
32/119
7/62
26/235
52/156
10/130
307/2447
68/443
2/25
13/100
0/31
Control
5/176
6/55
Events,
1/25
3/129
4/31
15/108
3/41
15/135
53/214
33/100
24/174
9/90
3/75
0/109
41/152
9/234
1.92 (1.50, 2.45)
2.17 (1.39, 3.39)
2.88 (0.50, 16.48)
1.64 (0.82, 3.27)
12.60 (0.72, 219.79)
OR (95% CI)
2.16 (0.77, 6.07)
3.50 (1.37, 8.97)
3.27 (0.32, 33.84)
5.53 (1.26, 24.19)
3.68 (1.11, 12.19)
1.98 (1.03, 3.82)
4.64 (1.19, 18.16)
1.15 (0.55, 2.41)
1.12 (0.76, 1.65)
0.98 (0.60, 1.58)
1.51 (0.59, 3.83)
3.31 (1.49, 7.36)
3.05 (0.76, 12.35)
27.70 (1.67, 458.91)
1.35 (0.83, 2.21)
2.08 (0.82, 5.27)
558/2620
41/145
5/25
34/173
12/74
Treatment
15/252
33/110
Events,
3/25
5/43
18/51
38/157
11/41
17/135
93/346
99/305
7/36
32/119
7/62
26/235
52/156
10/130
1.4 1 10
(excluding Groth-1989)
Chronic bronchitis

152
NOTE: Weights are from random effects analysis
Overall (I-squared = 60.3%, p = 0.014)
Zober-1985
Author-year
Kilburn-1989
Sjogren-1985
McMillan-1984
Ozdemir-1995
Akbarkhanzadeh-1980
Mur-1985
Oxhoj-1979
Germany
Location
US
Sweden
UK
Turkey
UK
France
Sweden
1.42 (0.88, 2.28)
0.68 (0.37, 1.24)
OR (95% CI)
1.40 (0.74, 2.63)
1.73 (0.58, 5.10)
0.71 (0.31, 1.60)
3.79 (1.32, 10.85)
26.22 (1.55, 442.67)
1.08 (0.65, 1.81)
2.67 (0.91, 7.82)
212/770
69/174
Treatment
19/57
Events,
12/119
13/68
26/74
19/107
39/127
15/44
159/699
28/57
Control
53/201
Events,
5/82
17/68
5/40
0/59
45/155
6/37
1.42 (0.88, 2.28)
0.68 (0.37, 1.24)
OR (95% CI)
1.40 (0.74, 2.63)
1.73 (0.58, 5.10)
0.71 (0.31, 1.60)
3.79 (1.32, 10.85)
26.22 (1.55, 442.67)
1.08 (0.65, 1.81)
2.67 (0.91, 7.82)
212/770
69/174
Treatment
19/57
Events,
12/119
13/68
26/74
19/107
39/127
15/44
1.4 1 10
(excluding Groth-1989)
Chronic bronchitis among smokers
NOTE: Weights are from random effects analysis
Overall (I-squared = 49.0%, p = 0.067)
Mur-1985
Author-year
Kilburn-1989
Sjogren-1985
Zober-1985
McMillan-1984
Akbarkhanzadeh-1980
Oxhoj-1979
France
Location
US
Sweden
Germany
UK
UK
Sweden
2.41 (0.97, 5.96)
0.08 (0.00, 1.46)
OR (95% CI)
4.40 (1.85, 10.47)
5.27 (0.27, 103.27)
2.26 (0.82, 6.25)
0.18 (0.01, 4.03)
7.93 (0.44, 141.72)
4.89 (1.35, 17.65)
74/564
0/33
Treatment
17/72
Events,
3/128
30/131
0/23
7/102
17/75
25/440
6/40
Control
9/137
Events,
0/94
5/43
2/23
0/50
3/53
2.41 (0.97, 5.96)
0.08 (0.00, 1.46)
OR (95% CI)
4.40 (1.85, 10.47)
5.27 (0.27, 103.27)
2.26 (0.82, 6.25)
0.18 (0.01, 4.03)
7.93 (0.44, 141.72)
4.89 (1.35, 17.65)
74/564
0/33
Treatment
17/72
Events,
3/128
30/131
0/23
7/102
17/75
1.4 1 10
(excluding Groth-1989)
Chronic bronchitis among non-smokers

153
NOTE: Weights are from random effects analysis
.
.
Overall (I-squared = 40.2%, p = 0.033)
Medium/Low
High
Gennaro-1993
Anttipoika-1977
Subtotal (I-squared = 1.5%, p = 0.398)
Bradshaw-1998
Sharifian-2011
Subtotal (I-squared = 37.7%, p = 0.069)
McMillan-1984
Jayawardana-2009
Fidan-2005
Lyngenbo-1989
Fogh-1969
Sobaszek-1998
Sjogren-1985
Author-year
Akbarkhanzadeh-1980
Kilburn-1989
Zober-1985
Nielsen-1993
McMillan-1979
Barhad-1975
Oxhoj-1979
Mur-1985
Ozdemir-1995
Italy
Finland
New Zealand
Iran
UK
Sri Lanka
Turkey
Denmark
Denmark
France
Sweden
Location
UK
US
Germany
Sweden
UK
Romania
Sweden
France
Turkey
1.92 (1.50, 2.45)
1.51 (0.59, 3.83)
1.98 (1.03, 3.82)
2.76 (1.75, 4.36)
3.05 (0.76, 12.35)
5.53 (1.26, 24.19)
1.70 (1.31, 2.20)
1.15 (0.55, 2.41)
4.64 (1.19, 18.16)
3.68 (1.11, 12.19)
12.60 (0.72, 219.79)
1.35 (0.83, 2.21)
2.08 (0.82, 5.27)
2.16 (0.77, 6.07)
OR (95% CI)
27.70 (1.67, 458.91)
2.17 (1.39, 3.39)
0.98 (0.60, 1.58)
3.27 (0.32, 33.84)
2.88 (0.50, 16.48)
1.64 (0.82, 3.27)
3.31 (1.49, 7.36)
1.12 (0.76, 1.65)
3.50 (1.37, 8.97)
558/2620
7/36
38/157
101/418
Events,
7/62
5/43
457/2202
17/135
11/41
18/51
12/74
52/156
10/130
15/252
Treatment
26/235
41/145
99/305
3/25
5/25
34/173
32/119
93/346
33/110
307/2447
24/174
15/108
29/356
Events,
3/75
3/129
278/2091
15/135
3/41
4/31
0/31
41/152
9/234
5/176
Control
0/109
68/443
33/100
1/25
2/25
13/100
9/90
53/214
6/55
1.92 (1.50, 2.45)
1.51 (0.59, 3.83)
1.98 (1.03, 3.82)
2.76 (1.75, 4.36)
3.05 (0.76, 12.35)
5.53 (1.26, 24.19)
1.70 (1.31, 2.20)
1.15 (0.55, 2.41)
4.64 (1.19, 18.16)
3.68 (1.11, 12.19)
12.60 (0.72, 219.79)
1.35 (0.83, 2.21)
2.08 (0.82, 5.27)
2.16 (0.77, 6.07)
OR (95% CI)
27.70 (1.67, 458.91)
2.17 (1.39, 3.39)
0.98 (0.60, 1.58)
3.27 (0.32, 33.84)
2.88 (0.50, 16.48)
1.64 (0.82, 3.27)
3.31 (1.49, 7.36)
1.12 (0.76, 1.65)
3.50 (1.37, 8.97)
558/2620
7/36
38/157
101/418
Events,
7/62
5/43
457/2202
17/135
11/41
18/51
12/74
52/156
10/130
15/252
Treatment
26/235
41/145
99/305
3/25
5/25
34/173
32/119
93/346
33/110
1.4 1 10
(excluding Groth-1989)
Chronic Bronchitis by country income level
NOTE: Weights are from random effects analysis
.
.
Overall (I-squared = 52.2%, p = 0.012)
Zober-1985
38/55 years
Nielsen-1993
Sobaszek-1998
28/37 years
Fidan-2005
Ozdemir-1995
Subtotal (I-squared = 54.1%, p = 0.042)
McMillan-1984
Subtotal (I-squared = 56.3%, p = 0.033)
Oxhoj-1979
Sharifian-2011
Author-year
Gennaro-1993
Jayawardana-2009
Mur-1985
Bradshaw-1998
Akbarkhanzadeh-1980
Anttipoika-1977
Germany
Sweden
France
Turkey
Turkey
UK
Sweden
Iran
Location
Italy
Sri Lanka
France
New Zealand
UK
Finland
2.06 (1.45, 2.92)
0.98 (0.60, 1.58)
3.27 (0.32, 33.84)
2.08 (0.82, 5.27)
3.68 (1.11, 12.19)
3.50 (1.37, 8.97)
1.77 (1.04, 3.00)
1.15 (0.55, 2.41)
2.50 (1.47, 4.23)
3.31 (1.49, 7.36)
5.53 (1.26, 24.19)
OR (95% CI)
1.51 (0.59, 3.83)
4.64 (1.19, 18.16)
1.12 (0.76, 1.65)
3.05 (0.76, 12.35)
27.70 (1.67, 458.91)
1.98 (1.03, 3.82)
399/1795
99/305
3/25
10/130
18/51
33/110
194/985
17/135
205/810
32/119
5/43
Treatment
7/36
11/41
93/346
7/62
26/235
38/157
Events,
178/1520
33/100
1/25
9/234
4/31
6/55
91/867
15/135
87/653
9/90
3/129
Control
24/174
3/41
53/214
3/75
0/109
15/108
Events,
2.06 (1.45, 2.92)
0.98 (0.60, 1.58)
3.27 (0.32, 33.84)
2.08 (0.82, 5.27)
3.68 (1.11, 12.19)
3.50 (1.37, 8.97)
1.77 (1.04, 3.00)
1.15 (0.55, 2.41)
2.50 (1.47, 4.23)
3.31 (1.49, 7.36)
5.53 (1.26, 24.19)
OR (95% CI)
1.51 (0.59, 3.83)
4.64 (1.19, 18.16)
1.12 (0.76, 1.65)
3.05 (0.76, 12.35)
27.70 (1.67, 458.91)
1.98 (1.03, 3.82)
399/1795
99/305
3/25
10/130
18/51
33/110
194/985
17/135
205/810
32/119
5/43
Treatment
7/36
11/41
93/346
7/62
26/235
38/157
Events,
1.00218 1 459
(excluding Groth-1989)
Chronic bronchitis by welders' age

154
NOTE: Weights are from random effects analysis
Overall (I-squared = 21.3%, p = 0.254)
Lyngenbo-1989
Author-year
Gennaro-1993
Sobaszek-1998
Kilburn-1989
McMillan-1984
McMillan-1979
Akbarkhanzadeh-1980
Oxhoj-1979
Barhad-1975
Denmark
Location
Italy
France
US
UK
UK
UK
Sweden
Romania
2.05 (1.46, 2.86)
12.60 (0.72, 219.79)
OR (95% CI)
1.51 (0.59, 3.83)
2.08 (0.82, 5.27)
2.17 (1.39, 3.39)
1.15 (0.55, 2.41)
2.88 (0.50, 16.48)
27.70 (1.67, 458.91)
3.31 (1.49, 7.36)
1.64 (0.82, 3.27)
184/1072
12/74
Treatment
7/36
10/130
41/145
17/135
5/25
26/235
32/119
Events,
34/173
140/1341
0/31
Control
24/174
9/234
68/443
15/135
2/25
0/109
9/90
Events,
13/100
2.05 (1.46, 2.86)
12.60 (0.72, 219.79)
OR (95% CI)
1.51 (0.59, 3.83)
2.08 (0.82, 5.27)
2.17 (1.39, 3.39)
1.15 (0.55, 2.41)
2.88 (0.50, 16.48)
27.70 (1.67, 458.91)
3.31 (1.49, 7.36)
1.64 (0.82, 3.27)
184/1072
12/74
Treatment
7/36
10/130
41/145
17/135
5/25
26/235
32/119
Events,
34/173
1.4 1 10
(excluding Groth-1989)
Chronic bronchitis in Ship-building/repair industry
NOTE: Weights are from random effects analysis
Overall (I-squared = 71.9%, p = 0.000)
Kilburn-1989
Jafari-2004
Fidan-2005
Wolf-1997
Keimig-1983
Sobaszek-1998
Oxhoj-1979
Author-year
Mur-1985
McMillan-1979
Ozdemir-1995
Pourtaghi-2009
McMillan-1984
Stoleski-2013
Sharifian-2011
Jayawardana-2009
Anttipoika-1977
Barhad-1975
Hunnicutt-1964
US
Iran
Turkey
Austria
US
France
Sweden
Location
France
UK
Turkey
Iran
UK
Macedonia
Iran
Sri Lanka
Finland
Romania
US
2.59 (1.76, 3.81)
5.59 (3.17, 9.88)
3.18 (1.57, 6.43)
3.86 (1.41, 10.54)
5.79 (2.14, 15.64)
1.05 (0.48, 2.29)
1.47 (0.84, 2.58)
3.14 (1.72, 5.73)
OR (95% CI)
0.84 (0.41, 1.74)
0.64 (0.10, 4.19)
10.57 (1.37, 81.38)
5.26 (2.37, 11.68)
4.90 (2.32, 10.32)
1.91 (0.51, 7.16)
0.74 (0.08, 6.84)
2.52 (0.96, 6.62)
0.83 (0.49, 1.40)
4.65 (1.75, 12.31)
6.68 (1.46, 30.68)
466/1982
34/145
34/63
27/51
17/64
15/81
26/130
60/119
Treatment
19/346
2/25
18/110
59/160
38/135
7/39
1/43
17/41
46/157
34/173
12/100
Events,
224/2081
23/443
21/78
7/31
6/102
16/90
34/234
22/90
Control
13/201
3/25
1/55
8/80
10/135
4/39
4/129
9/41
36/108
5/100
2/100
Events,
2.59 (1.76, 3.81)
5.59 (3.17, 9.88)
3.18 (1.57, 6.43)
3.86 (1.41, 10.54)
5.79 (2.14, 15.64)
1.05 (0.48, 2.29)
1.47 (0.84, 2.58)
3.14 (1.72, 5.73)
OR (95% CI)
0.84 (0.41, 1.74)
0.64 (0.10, 4.19)
10.57 (1.37, 81.38)
5.26 (2.37, 11.68)
4.90 (2.32, 10.32)
1.91 (0.51, 7.16)
0.74 (0.08, 6.84)
2.52 (0.96, 6.62)
0.83 (0.49, 1.40)
4.65 (1.75, 12.31)
6.68 (1.46, 30.68)
466/1982
34/145
34/63
27/51
17/64
15/81
26/130
60/119
Treatment
19/346
2/25
18/110
59/160
38/135
7/39
1/43
17/41
46/157
34/173
12/100
Events,
1.4 1 10
(excluding Groth-1989)
Shortness of breath
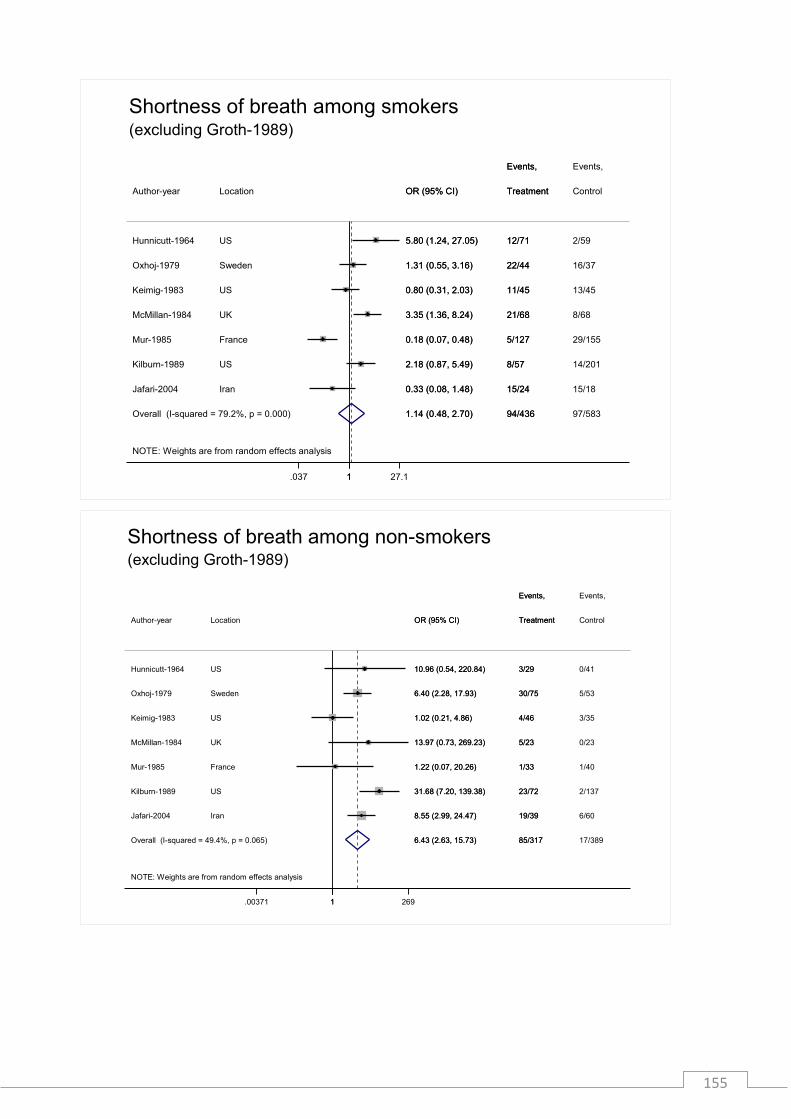
155
NOTE: Weights are from random effects analysis
Overall (I-squared = 79.2%, p = 0.000)
Mur-1985
Keimig-1983
Hunnicutt-1964
Author-year
Jafari-2004
McMillan-1984
Kilburn-1989
Oxhoj-1979
France
US
US
Location
Iran
UK
US
Sweden
1.14 (0.48, 2.70)
0.18 (0.07, 0.48)
0.80 (0.31, 2.03)
5.80 (1.24, 27.05)
OR (95% CI)
0.33 (0.08, 1.48)
3.35 (1.36, 8.24)
2.18 (0.87, 5.49)
1.31 (0.55, 3.16)
94/436
5/127
11/45
12/71
Treatment
15/24
21/68
8/57
22/44
Events,
97/583
29/155
13/45
2/59
Control
15/18
8/68
14/201
16/37
Events,
1.14 (0.48, 2.70)
0.18 (0.07, 0.48)
0.80 (0.31, 2.03)
5.80 (1.24, 27.05)
OR (95% CI)
0.33 (0.08, 1.48)
3.35 (1.36, 8.24)
2.18 (0.87, 5.49)
1.31 (0.55, 3.16)
94/436
5/127
11/45
12/71
Treatment
15/24
21/68
8/57
22/44
Events,
1.037 1 27.1
(excluding Groth-1989)
Shortness of breath among smokers
NOTE: Weights are from random effects analysis
Overall (I-squared = 49.4%, p = 0.065)
Keimig-1983
Hunnicutt-1964
Jafari-2004
Author-year
Kilburn-1989
McMillan-1984
Oxhoj-1979
Mur-1985
US
US
Iran
Location
US
UK
Sweden
France
6.43 (2.63, 15.73)
1.02 (0.21, 4.86)
10.96 (0.54, 220.84)
8.55 (2.99, 24.47)
OR (95% CI)
31.68 (7.20, 139.38)
13.97 (0.73, 269.23)
6.40 (2.28, 17.93)
1.22 (0.07, 20.26)
85/317
4/46
3/29
19/39
Treatment
23/72
5/23
30/75
1/33
Events,
17/389
3/35
0/41
6/60
Control
2/137
0/23
5/53
1/40
Events,
6.43 (2.63, 15.73)
1.02 (0.21, 4.86)
10.96 (0.54, 220.84)
8.55 (2.99, 24.47)
OR (95% CI)
31.68 (7.20, 139.38)
13.97 (0.73, 269.23)
6.40 (2.28, 17.93)
1.22 (0.07, 20.26)
85/317
4/46
3/29
19/39
Treatment
23/72
5/23
30/75
1/33
Events,
1.00371 1 269
(excluding Groth-1989)
Shortness of breath among non-smokers

156
NOTE: Weights are from random effects analysis
.
.
Overall (I-squared = 71.9%, p = 0.000)
Mur-1985
Pourtaghi-2009
Subtotal (I-squared = 81.4%, p = 0.000)
Medium/Low
Sobaszek-1998
Keimig-1983
Ozdemir-1995
Fidan-2005
Subtotal (I-squared = 0.0%, p = 0.569)
Jafari-2004
Kilburn-1989
Stoleski-2013
Jayawardana-2009
McMillan-1984
Author-year
Wolf-1997
Sharifian-2011
McMillan-1979
Oxhoj-1979
Anttipoika-1977
Hunnicutt-1964
Barhad-1975
High
France
Iran
France
US
Turkey
Turkey
Iran
US
Macedonia
Sri Lanka
UK
Location
Austria
Iran
UK
Sweden
Finland
US
Romania
2.59 (1.76, 3.81)
0.84 (0.41, 1.74)
5.26 (2.37, 11.68)
2.18 (1.25, 3.79)
1.47 (0.84, 2.58)
1.05 (0.48, 2.29)
10.57 (1.37, 81.38)
3.86 (1.41, 10.54)
3.54 (2.47, 5.08)
3.18 (1.57, 6.43)
5.59 (3.17, 9.88)
1.91 (0.51, 7.16)
2.52 (0.96, 6.62)
4.90 (2.32, 10.32)
OR (95% CI)
5.79 (2.14, 15.64)
0.74 (0.08, 6.84)
0.64 (0.10, 4.19)
3.14 (1.72, 5.73)
0.83 (0.49, 1.40)
6.68 (1.46, 30.68)
4.65 (1.75, 12.31)
466/1982
19/346
59/160
269/1302
26/130
15/81
18/110
27/51
197/680
34/63
34/145
7/39
17/41
38/135
Treatment
Events,
17/64
1/43
2/25
60/119
46/157
12/100
34/173
224/2081
13/201
8/80
165/1528
34/234
16/90
1/55
7/31
59/553
21/78
23/443
4/39
9/41
10/135
Control
Events,
6/102
4/129
3/25
22/90
36/108
2/100
5/100
2.59 (1.76, 3.81)
0.84 (0.41, 1.74)
5.26 (2.37, 11.68)
2.18 (1.25, 3.79)
1.47 (0.84, 2.58)
1.05 (0.48, 2.29)
10.57 (1.37, 81.38)
3.86 (1.41, 10.54)
3.54 (2.47, 5.08)
3.18 (1.57, 6.43)
5.59 (3.17, 9.88)
1.91 (0.51, 7.16)
2.52 (0.96, 6.62)
4.90 (2.32, 10.32)
OR (95% CI)
5.79 (2.14, 15.64)
0.74 (0.08, 6.84)
0.64 (0.10, 4.19)
3.14 (1.72, 5.73)
0.83 (0.49, 1.40)
6.68 (1.46, 30.68)
4.65 (1.75, 12.31)
466/1982
19/346
59/160
269/1302
26/130
15/81
18/110
27/51
197/680
34/63
34/145
7/39
17/41
38/135
Treatment
Events,
17/64
1/43
2/25
60/119
46/157
12/100
34/173
1.0123 1 81.4
(excluding Groth-1989)
Shortness of breath by country income level
NOTE: Weights are from random effects analysis
.
.
Overall (I-squared = 70.2%, p = 0.000)
Wolf-1997
Keimig-1983
Mur-1985
38/55 years
Ozdemir-1995
Author-year
Hunnicutt-1964
Oxhoj-1979
Subtotal (I-squared = 54.5%, p = 0.052)
Jayawardana-2009
Sobaszek-1998
Anttipoika-1977
Sharifian-2011
Stoleski-2013
Fidan-2005
Pourtaghi-2009
Jafari-2004
Subtotal (I-squared = 73.4%, p = 0.000)
McMillan-1984
28/37 years
Austria
US
France
Turkey
Location
US
Sweden
Sri Lanka
France
Finland
Iran
Macedonia
Turkey
Iran
Iran
UK
2.43 (1.61, 3.66)
5.79 (2.14, 15.64)
1.05 (0.48, 2.29)
0.84 (0.41, 1.74)
10.57 (1.37, 81.38)
OR (95% CI)
6.68 (1.46, 30.68)
3.14 (1.72, 5.73)
3.17 (1.89, 5.31)
2.52 (0.96, 6.62)
1.47 (0.84, 2.58)
0.83 (0.49, 1.40)
0.74 (0.08, 6.84)
1.91 (0.51, 7.16)
3.86 (1.41, 10.54)
5.26 (2.37, 11.68)
3.18 (1.57, 6.43)
2.00 (1.12, 3.56)
4.90 (2.32, 10.32)
396/1639
17/64
15/81
19/346
18/110
Treatment
12/100
60/119
160/587
17/41
26/130
46/157
1/43
7/39
27/51
59/160
34/63
236/1052
38/135
Events,
193/1513
6/102
16/90
13/201
1/55
Control
2/100
22/90
78/700
9/41
34/234
36/108
4/129
4/39
7/31
8/80
21/78
115/813
10/135
Events,
2.43 (1.61, 3.66)
5.79 (2.14, 15.64)
1.05 (0.48, 2.29)
0.84 (0.41, 1.74)
10.57 (1.37, 81.38)
OR (95% CI)
6.68 (1.46, 30.68)
3.14 (1.72, 5.73)
3.17 (1.89, 5.31)
2.52 (0.96, 6.62)
1.47 (0.84, 2.58)
0.83 (0.49, 1.40)
0.74 (0.08, 6.84)
1.91 (0.51, 7.16)
3.86 (1.41, 10.54)
5.26 (2.37, 11.68)
3.18 (1.57, 6.43)
2.00 (1.12, 3.56)
4.90 (2.32, 10.32)
396/1639
17/64
15/81
19/346
18/110
Treatment
12/100
60/119
160/587
17/41
26/130
46/157
1/43
7/39
27/51
59/160
34/63
236/1052
38/135
Events,
1.0123 1 81.4
(excluding Groth-1989)
Shortness of breath by welder's age

157
NOTE: Weights are from random effects analysis
Overall (I-squared = 63.7%, p = 0.011)
McMillan-1979
McMillan-1984
Oxhoj-1979
Hunnicutt-1964
Kilburn-1989
Author-year
Barhad-1975
Sobaszek-1998
UK
UK
Sweden
US
US
Location
Romania
France
3.32 (1.99, 5.55)
0.64 (0.10, 4.19)
4.90 (2.32, 10.32)
3.14 (1.72, 5.73)
6.68 (1.46, 30.68)
5.59 (3.17, 9.88)
OR (95% CI)
4.65 (1.75, 12.31)
1.47 (0.84, 2.58)
206/827
2/25
38/135
60/119
12/100
34/145
Treatment
Events,
34/173
26/130
99/1127
3/25
10/135
22/90
2/100
23/443
Control
Events,
5/100
34/234
3.32 (1.99, 5.55)
0.64 (0.10, 4.19)
4.90 (2.32, 10.32)
3.14 (1.72, 5.73)
6.68 (1.46, 30.68)
5.59 (3.17, 9.88)
OR (95% CI)
4.65 (1.75, 12.31)
1.47 (0.84, 2.58)
206/827
2/25
38/135
60/119
12/100
34/145
Treatment
Events,
34/173
26/130
1.0326 1 30.7
(excluding Groth-1989)
Shortness of breath in Ship-building/repair industry
NOTE: Weights are from random effects analysis
Overall (I-squared = 86.1%, p = 0.000)
Wolf-1997
Groth-1989
Barhad-1975
Keimig-1983
Fidan-2005
Jafari-2004
Pourtaghi-2009
Kilburn-1989
Author-year
Anttipoika-1977
Sobaszek-1998
Oxhoj-1979
Stoleski-2013
Hunnicutt-1964
Sharifian-2011
Ozdemir-1995
Austria
Denmark
Romania
US
Turkey
Iran
Iran
US
Location
Finland
France
Sweden
Macedonia
US
Iran
Turkey
3.00 (1.73, 5.19)
1.62 (0.72, 3.64)
4.94 (3.93, 6.20)
2.46 (1.03, 5.87)
0.98 (0.46, 2.09)
9.23 (1.14, 74.99)
1.00 (0.19, 5.30)
4.21 (1.42, 12.42)
30.11 (16.87, 53.75)
OR (95% CI)
1.34 (0.77, 2.30)
1.59 (0.84, 3.01)
2.90 (1.30, 6.49)
1.76 (0.39, 7.96)
7.32 (1.61, 33.36)
1.99 (0.61, 6.45)
9.20 (0.52, 162.48)
1244/3748
14/64
879/2313
27/173
16/81
12/51
7/63
29/160
Events,
130/145
Treatment
50/157
20/130
29/119
5/39
13/100
5/43
8/110
316/2488
15/102
96/869
7/100
18/90
1/31
2/18
4/80
Events,
99/443
Control
28/108
24/234
9/90
3/39
2/100
8/129
0/55
3.00 (1.73, 5.19)
1.62 (0.72, 3.64)
4.94 (3.93, 6.20)
2.46 (1.03, 5.87)
0.98 (0.46, 2.09)
9.23 (1.14, 74.99)
1.00 (0.19, 5.30)
4.21 (1.42, 12.42)
30.11 (16.87, 53.75)
OR (95% CI)
1.34 (0.77, 2.30)
1.59 (0.84, 3.01)
2.90 (1.30, 6.49)
1.76 (0.39, 7.96)
7.32 (1.61, 33.36)
1.99 (0.61, 6.45)
9.20 (0.52, 162.48)
1244/3748
14/64
879/2313
27/173
16/81
12/51
7/63
29/160
Events,
130/145
Treatment
50/157
20/130
29/119
5/39
13/100
5/43
8/110
1.00615 1 162
Wheezing

158
NOTE: Weights are from random effects analysis
Overall (I-squared = 85.9%, p = 0.000)
Author-year
Anttipoika-1977
Kilburn-1989
Oxhoj-1979
Sharifian-2011
Keimig-1983
Sobaszek-1998
Fidan-2005
Barhad-1975
Ozdemir-1995
Pourtaghi-2009
Jafari-2004
Wolf-1997
Hunnicutt-1964
Stoleski-2013
Location
Finland
US
Sweden
Iran
US
France
Turkey
Romania
Turkey
Iran
Iran
Austria
US
Macedonia
2.88 (1.47, 5.66)
OR (95% CI)
1.34 (0.77, 2.30)
30.11 (16.87, 53.75)
2.90 (1.30, 6.49)
1.99 (0.61, 6.45)
0.98 (0.46, 2.09)
1.59 (0.84, 3.01)
9.23 (1.14, 74.99)
2.46 (1.03, 5.87)
9.20 (0.52, 162.48)
4.21 (1.42, 12.42)
1.00 (0.19, 5.30)
1.62 (0.72, 3.64)
7.32 (1.61, 33.36)
1.76 (0.39, 7.96)
365/1435
Treatment
50/157
130/145
29/119
5/43
16/81
20/130
12/51
27/173
8/110
Events,
29/160
7/63
14/64
13/100
5/39
220/1619
Control
28/108
99/443
9/90
8/129
18/90
24/234
1/31
7/100
0/55
Events,
4/80
2/18
15/102
2/100
3/39
2.88 (1.47, 5.66)
OR (95% CI)
1.34 (0.77, 2.30)
30.11 (16.87, 53.75)
2.90 (1.30, 6.49)
1.99 (0.61, 6.45)
0.98 (0.46, 2.09)
1.59 (0.84, 3.01)
9.23 (1.14, 74.99)
2.46 (1.03, 5.87)
9.20 (0.52, 162.48)
4.21 (1.42, 12.42)
1.00 (0.19, 5.30)
1.62 (0.72, 3.64)
7.32 (1.61, 33.36)
1.76 (0.39, 7.96)
365/1435
Treatment
50/157
130/145
29/119
5/43
16/81
20/130
12/51
27/173
8/110
Events,
29/160
7/63
14/64
13/100
5/39
1.00615 1 162
(excluding Groth-1989)
Wheezing
NOTE: Weights are from random effects analysis
Overall (I-squared = 76.8%, p = 0.002)
Kilburn-1989
Keimig-1983
Hunnicutt-1964
Oxhoj-1979
Jafari-2004
Author-year
US
US
US
Sweden
Iran
Location
1.67 (0.59, 4.74)
2.86 (1.42, 5.77)
0.28 (0.10, 0.75)
5.80 (1.24, 27.05)
1.80 (0.63, 5.12)
2.11 (0.36, 12.35)
OR (95% CI)
74/241
17/57
27/45
12/71
13/44
Events,
5/24
Treatment
75/360
26/201
38/45
2/59
7/37
Events,
2/18
Control
1.67 (0.59, 4.74)
2.86 (1.42, 5.77)
0.28 (0.10, 0.75)
5.80 (1.24, 27.05)
1.80 (0.63, 5.12)
2.11 (0.36, 12.35)
OR (95% CI)
74/241
17/57
27/45
12/71
13/44
Events,
5/24
Treatment
1.037 1 27.1
Wheezing among smokers

159
NOTE: Weights are from random effects analysis
Overall (I-squared = 0.0%, p = 0.515)
Hunnicutt-1964
Kilburn-1989
Author-year
Oxhoj-1979
Jafari-2004
Keimig-1983
US
US
Location
Sweden
Iran
US
9.06 (3.75, 21.92)
4.37 (0.17, 111.09)
25.96 (5.86, 115.00)
OR (95% CI)
5.85 (1.27, 26.96)
8.07 (0.38, 172.66)
3.24 (0.35, 30.34)
41/261
1/29
20/72
Treatment
14/75
2/39
4/46
Events,
5/326
0/41
2/137
Control
2/53
0/60
1/35
Events,
9.06 (3.75, 21.92)
4.37 (0.17, 111.09)
25.96 (5.86, 115.00)
OR (95% CI)
5.85 (1.27, 26.96)
8.07 (0.38, 172.66)
3.24 (0.35, 30.34)
41/261
1/29
20/72
Treatment
14/75
2/39
4/46
Events,
1.00579 1 173
Wheezing among non-smokers
NOTE: Weights are from random effects analysis
.
.
Overall (I-squared = 85.9%, p = 0.000)
Fidan-2005
Medium/Low
Author-year
Keimig-1983
Pourtaghi-2009
Subtotal (I-squared = 93.1%, p = 0.000)
Sobaszek-1998
Ozdemir-1995
Stoleski-2013
Jafari-2004
Sharifian-2011
Barhad-1975
Wolf-1997
Hunnicutt-1964
Oxhoj-1979
Anttipoika-1977
Subtotal (I-squared = 0.0%, p = 0.569)
High
Kilburn-1989
Turkey
Location
US
Iran
France
Turkey
Macedonia
Iran
Iran
Romania
Austria
US
Sweden
Finland
US
2.88 (1.47, 5.66)
9.23 (1.14, 74.99)
OR (95% CI)
0.98 (0.46, 2.09)
4.21 (1.42, 12.42)
2.94 (1.03, 8.36)
1.59 (0.84, 3.01)
9.20 (0.52, 162.48)
1.76 (0.39, 7.96)
1.00 (0.19, 5.30)
1.99 (0.61, 6.45)
2.46 (1.03, 5.87)
1.62 (0.72, 3.64)
7.32 (1.61, 33.36)
2.90 (1.30, 6.49)
1.34 (0.77, 2.30)
2.65 (1.61, 4.35)
30.11 (16.87, 53.75)
365/1435
12/51
Events,
Treatment
16/81
29/160
272/796
20/130
8/110
5/39
7/63
5/43
27/173
14/64
13/100
29/119
50/157
93/639
130/145
220/1619
1/31
Events,
Control
18/90
4/80
195/1167
24/234
0/55
3/39
2/18
8/129
7/100
15/102
2/100
9/90
28/108
25/452
99/443
2.88 (1.47, 5.66)
9.23 (1.14, 74.99)
OR (95% CI)
0.98 (0.46, 2.09)
4.21 (1.42, 12.42)
2.94 (1.03, 8.36)
1.59 (0.84, 3.01)
9.20 (0.52, 162.48)
1.76 (0.39, 7.96)
1.00 (0.19, 5.30)
1.99 (0.61, 6.45)
2.46 (1.03, 5.87)
1.62 (0.72, 3.64)
7.32 (1.61, 33.36)
2.90 (1.30, 6.49)
1.34 (0.77, 2.30)
2.65 (1.61, 4.35)
30.11 (16.87, 53.75)
365/1435
12/51
Events,
Treatment
16/81
29/160
272/796
20/130
8/110
5/39
7/63
5/43
27/173
14/64
13/100
29/119
50/157
93/639
130/145
1.00615 1 162
(excluding Groth-1989)
Wheezing by country income level

160
NOTE: Weights are from random effects analysis
.
.
Overall (I-squared = 27.9%, p = 0.171)
Sharifian-2011
Hunnicutt-1964
Oxhoj-1979
Anttipoika-1977
Wolf-1997
Keimig-1983
Jafari-2004
Fidan-2005
Stoleski-2013
38/55 years
Ozdemir-1995
Subtotal (I-squared = 39.9%, p = 0.125)
Pourtaghi-2009
Author-year
Subtotal (I-squared = 10.2%, p = 0.348)
Sobaszek-1998
28/37 years
Iran
US
Sweden
Finland
Austria
US
Iran
Turkey
Macedonia
Turkey
Iran
Location
France
1.93 (1.37, 2.71)
1.99 (0.61, 6.45)
7.32 (1.61, 33.36)
2.90 (1.30, 6.49)
1.34 (0.77, 2.30)
1.62 (0.72, 3.64)
0.98 (0.46, 2.09)
1.00 (0.19, 5.30)
9.23 (1.14, 74.99)
1.76 (0.39, 7.96)
9.20 (0.52, 162.48)
1.84 (1.06, 3.20)
4.21 (1.42, 12.42)
OR (95% CI)
2.09 (1.37, 3.21)
1.59 (0.84, 3.01)
208/1117
5/43
13/100
29/119
50/157
14/64
16/81
7/63
12/51
5/39
8/110
127/665
29/160
Events,
Treatment
81/452
20/130
114/1076
8/129
2/100
9/90
28/108
15/102
18/90
2/18
1/31
3/39
0/55
61/511
4/80
Events,
Control
53/565
24/234
1.93 (1.37, 2.71)
1.99 (0.61, 6.45)
7.32 (1.61, 33.36)
2.90 (1.30, 6.49)
1.34 (0.77, 2.30)
1.62 (0.72, 3.64)
0.98 (0.46, 2.09)
1.00 (0.19, 5.30)
9.23 (1.14, 74.99)
1.76 (0.39, 7.96)
9.20 (0.52, 162.48)
1.84 (1.06, 3.20)
4.21 (1.42, 12.42)
OR (95% CI)
2.09 (1.37, 3.21)
1.59 (0.84, 3.01)
208/1117
5/43
13/100
29/119
50/157
14/64
16/81
7/63
12/51
5/39
8/110
127/665
29/160
Events,
Treatment
81/452
20/130
1.00615 1 162
(excluding Groth-1989)
Wheezing by welders' age
NOTE: Weights are from random effects analysis
Overall (I-squared = 92.6%, p = 0.000)
Author-year
Sobaszek-1998
Kilburn-1989
Barhad-1975
Oxhoj-1979
Hunnicutt-1964
Location
France
US
Romania
Sweden
US
4.76 (1.29, 17.51)
OR (95% CI)
1.59 (0.84, 3.01)
30.11 (16.87, 53.75)
2.46 (1.03, 5.87)
2.90 (1.30, 6.49)
7.32 (1.61, 33.36)
219/667
Treatment
20/130
130/145
27/173
29/119
13/100
Events,
141/967
Control
24/234
99/443
7/100
9/90
2/100
Events,
4.76 (1.29, 17.51)
OR (95% CI)
1.59 (0.84, 3.01)
30.11 (16.87, 53.75)
2.46 (1.03, 5.87)
2.90 (1.30, 6.49)
7.32 (1.61, 33.36)
219/667
Treatment
20/130
130/145
27/173
29/119
13/100
Events,
1.0186 1 53.7
(excluding Groth-1989)
Wheezing in Ship-building/repair industry

161
A.2.4 Additional funnel plots for lung function measures and respiratory symptoms with pseudo 95% confidence limits and asymmetry testing
By smoking, country income level, welders’ age and shipbuilding and repair industry subgroups FEV1
0.1
.2.3
.4
Sta
nda
rd e
rro
r o
f S
MD
-1 -.5 0 .5 1SMD for FEV1
Egger's test p-value=0.343
(excluding Stepnewski-2003)
Overall
0.1
.2.3
.4
Sta
nda
rd e
rro
r o
f S
MD
-1.5 -1 -.5 0 .5SMD for FEV1
Egger's test was not performed because only 6 studies were included
Smokers
0.1
.2.3
.4
Sta
nda
rd e
rro
r o
f S
MD
-1 -.5 0 .5SMD for FEV1
Egger's test was not performed because only 7 studies were included
Non-smokers
0.1
.2.3
.4
Sta
nda
rd e
rro
r o
f S
MD
-1 -.5 0 .5 1SMD for FEV1
Egger's test p-value=0.816
High income countries
0
.05
.1.1
5.2
.25
Sta
nda
rd e
rro
r o
f S
MD
-1 -.5 0 .5SMD for FEV1
Egger's test p-value=0.269
(excluding Stepnewski-2003)
Medium/Low income countries
0
.05
.1.1
5.2
.25
Sta
nda
rd e
rro
r o
f S
MD
-1 -.5 0 .5SMD for FEV1
Egger's test p-value=0.433
Welders' age 28/37

162
FVC
0.1
.2.3
.4
Sta
nda
rd e
rro
r o
f S
MD
-1 -.5 0 .5 1SMD for FEV1
Egger's test was not performed because only 6 studies were included
(excluding Stepnewski-2003)
Welders' age 37/58
0.1
.2.3
.4
Sta
nda
rd e
rro
r o
f S
MD
-1 -.5 0 .5 1SMD for FEV1
Egger's test was not performed because only 5 studies were included
Shipbuilding & repair industry
0
.05
.1.1
5.2
.25
Sta
nda
rd e
rro
r o
f S
MD
-.6 -.4 -.2 0 .2 .4SMD for FVC
Egger's test p-value=0.326
(excluding Stepnewski-2003)
Overall
0.1
.2.3
.4
Sta
nda
rd e
rro
r o
f S
MD
-1 -.5 0 .5SMD for FVC
Egger's test not performed because only 5 studies were included
Smokers
0.1
.2.3
.4
Sta
nda
rd e
rro
r o
f S
MD
-1.5 -1 -.5 0 .5SMD for FVC
Egger's test not performed because only 6 studies were included
Non-smokers
0
.05
.1.1
5.2
Sta
nda
rd e
rro
r o
f S
MD
-.4 -.2 0 .2 .4SMD for FVC
Egger's test was not performed because only 6 studies were included
(excluding Stepnewski-2003)
High income countries
0
.05
.1.1
5.2
.25
Sta
nda
rd e
rro
r o
f S
MD
-1 -.5 0 .5SMD for FVC
Egger's test not performed because only 8 studies were included
(excluding Stepnewski-2003)
Medium/Low income countries
0
.05
.1.1
5.2
.25
Sta
nda
rd e
rro
r o
f S
MD
-.6 -.4 -.2 0 .2 .4SMD for FVC
Egger's test not performed because only 9 studies were included
Welders' age 28/37 years
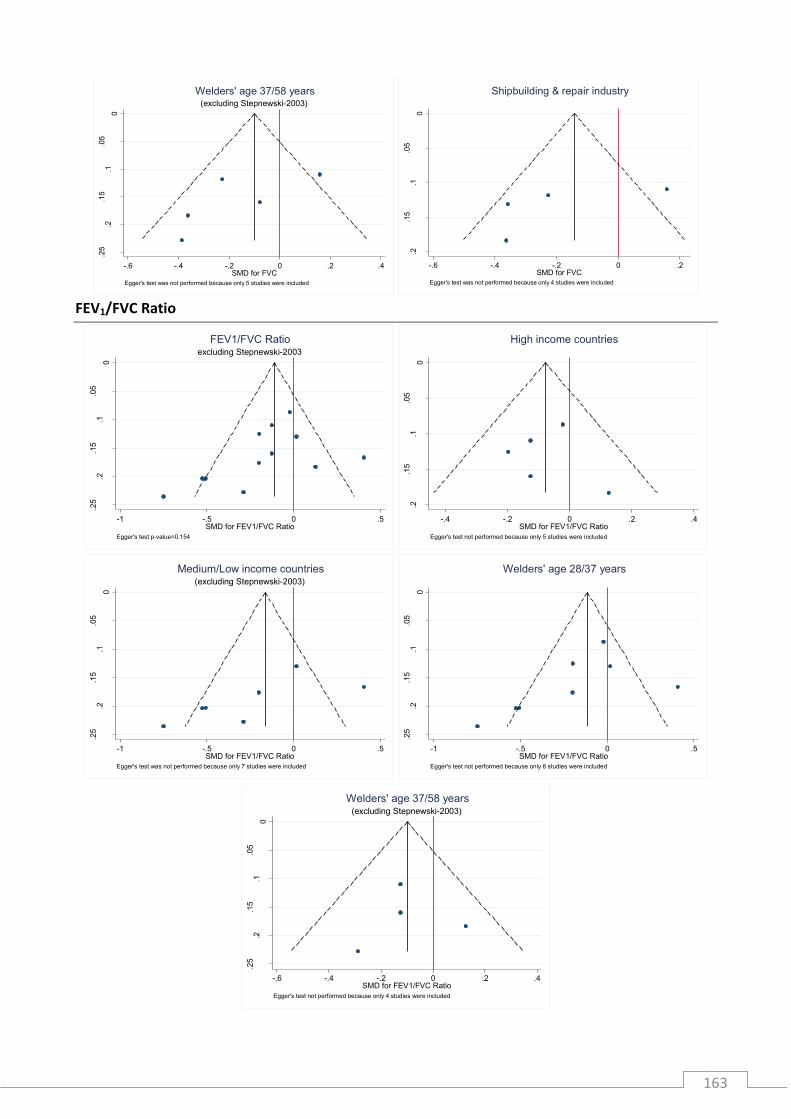
163
FEV1/FVC Ratio
0
.05
.1.1
5.2
.25
Sta
nda
rd e
rro
r o
f S
MD
-.6 -.4 -.2 0 .2 .4SMD for FVC
Egger's test was not performed because only 5 studies were included
(excluding Stepnewski-2003)
Welders' age 37/58 years
0
.05
.1.1
5.2
Sta
nda
rd e
rro
r o
f S
MD
-.6 -.4 -.2 0 .2SMD for FVC
Egger's test was not performed because only 4 studies were included
Shipbuilding & repair industry
0
.05
.1.1
5.2
.25
Sta
nda
rd e
rro
r o
f S
MD
-1 -.5 0 .5SMD for FEV1/FVC Ratio
Egger's test p-value=0.154
excluding Stepnewski-2003
FEV1/FVC Ratio
0
.05
.1.1
5.2
Sta
nda
rd e
rro
r o
f S
MD
-.4 -.2 0 .2 .4SMD for FEV1/FVC Ratio
Egger's test not performed because only 5 studies were included
High income countries
0
.05
.1.1
5.2
.25
Sta
nda
rd e
rro
r o
f S
MD
-1 -.5 0 .5SMD for FEV1/FVC Ratio
Egger's test was not performed because only 7 studies were included
(excluding Stepnewski-2003)
Medium/Low income countries
0
.05
.1.1
5.2
.25
Sta
nda
rd e
rro
r o
f S
MD
-1 -.5 0 .5SMD for FEV1/FVC Ratio
Egger's test not performed because only 8 studies were included
Welders' age 28/37 years
0
.05
.1.1
5.2
.25
Sta
nda
rd e
rro
r o
f S
MD
-.6 -.4 -.2 0 .2 .4SMD for FEV1/FVC Ratio
Egger's test not performed because only 4 studies were included
(excluding Stepnewski-2003)
Welders' age 37/58 years

164
Chronic bronchitis
0.5
11
.5
Sta
nda
rd e
rro
r o
f lo
g O
R
-2 0 2 4Log-ORs for Chronic bronchitis
Peters' test not performed because only 9 studies were included
Smokers
0.5
11
.5
Sta
nda
rd e
rro
r o
f lo
g O
R-2 0 2 4 6
Log-ORs for Chronic bronchitis
Peters' test not performed because only 8 studies were included
Non-smokers
0.5
11
.5
Sta
nda
rd e
rro
r o
f lo
g O
R
-2 0 2 4Log-ORs for Chronic bronchitis
Peters' test p-value=0.050
High income countries
0.2
.4.6
.8
Sta
nda
rd e
rro
r o
f lo
g O
R
-1 0 1 2 3Log-ORs for Chronic bronchitis
Peters' test not performed because only 5 studies were included
Medium/Low income countries
0.2
.4.6
.8
Sta
nda
rd e
rro
r o
f lo
g O
R
-1 0 1 2Log-ORs for Chronic bronchitis
Peters' test not performed because only 7 studies were included
Welder's age 28/37 years
0.2
.4.6
.8
Sta
nda
rd e
rro
r o
f lo
g O
R
-1 0 1 2Log-ORs for Chronic bronchitis
Peters' test not performed because only 7 studies were included
Welder's age 38/55 years
0.5
11
.5
Sta
nda
rd e
rro
r o
f lo
g O
R
-2 0 2 4Log-ORs for Chronic bronchitis
Peters' test p-value=0.079
Ship-building & repair industry

165
Shortness of breath
0.2
.4.6
.8
Sta
nda
rd e
rro
r o
f lo
g O
R
-2 -1 0 1 2Log-ORs for Shortness of breath
Peters' test was not performed because only 7 studies were included
Smokers
0.5
11
.5
Sta
nda
rd e
rro
r o
f lo
g O
R-2 0 2 4 6
Log-ORs for Shortness of breath
Peters' test was not performed because only 7 studies were included
Non-smokers
0.2
.4.6
.81
Sta
nda
rd e
rro
r o
f lo
g O
R
-1 0 1 2 3Log-ORs for Shortness of breath
Peters' test p-value=0.745
High income
0.5
1
Sta
nda
rd e
rro
r o
f lo
g O
R
-1 0 1 2 3 4Log-ORs for Shortness of breath
Peters' test was not performed because only 8 studies were included
Medium/Low income
0.5
1
Sta
nda
rd e
rro
r o
f lo
g O
R
-2 -1 0 1 2 3Log-ORs for Shortness of breath
Peters' test was not performed because only 9 studies were included
Welder's age 28/37 years
0.2
.4.6
.8
Sta
nda
rd e
rro
r o
f lo
g O
R
-1 0 1 2 3Log-ORs for Shortness of breath
Peters' test was not performed because only 6 studies were included
Welder's age 38/55 years
0.2
.4.6
.81
Sta
nda
rd e
rro
r o
f lo
g O
R
-1 0 1 2 3Log-ORs for Shortness of breath
Peters' test was not performed because only 8 studies were included
Shortness of breath in Ship-building/repair industry

166
Wheezing
0.2
.4.6
.81
Sta
nda
rd e
rro
r o
f lo
g O
R
-1 0 1 2 3Log-ORs for Wheezing
Peters' test was not performed because only 5 studies were included
Smokers
0.5
11
.52
Sta
nda
rd e
rro
r o
f lo
g O
R-2 0 2 4 6
Log-ORs for Wheezing
Peters' test was not performed because only 5 studies were included
Non-smokers
0.2
.4.6
.8
Sta
nda
rd e
rro
r o
f lo
g O
R
0 1 2 3 4Log-ORs for Wheezing
Peters' test was not performed because only 8 studies were included
High income
0.5
11
.5
Sta
nda
rd e
rro
r o
f lo
g O
R
-2 0 2 4Log-ORs for Wheezing
Peters' test was not performed because only 7 studies were included
Medium/Low income
0.5
11
.5
Sta
nda
rd e
rro
r o
f lo
g O
R
-2 0 2 4Log-ORs for Wheezing
Peters' test was not performed because only 7 studies were included
Welder's age 28/37 years
0.2
.4.6
.8
Sta
nda
rd e
rro
r o
f lo
g O
R
-1 0 1 2Log-ORs for Wheezing
Peters' test was not performed because only 5 studies were included
Welder's age 38/55 years
0.2
.4.6
.8
Sta
nda
rd e
rro
r o
f lo
g O
R
0 1 2 3 4Log-ORs for Wheezing
Peters' test was not performed because only 6 studies were included
Ship-building/repair industry

167
A.3.1 Cross-sectional survey documents and questionnaire

168
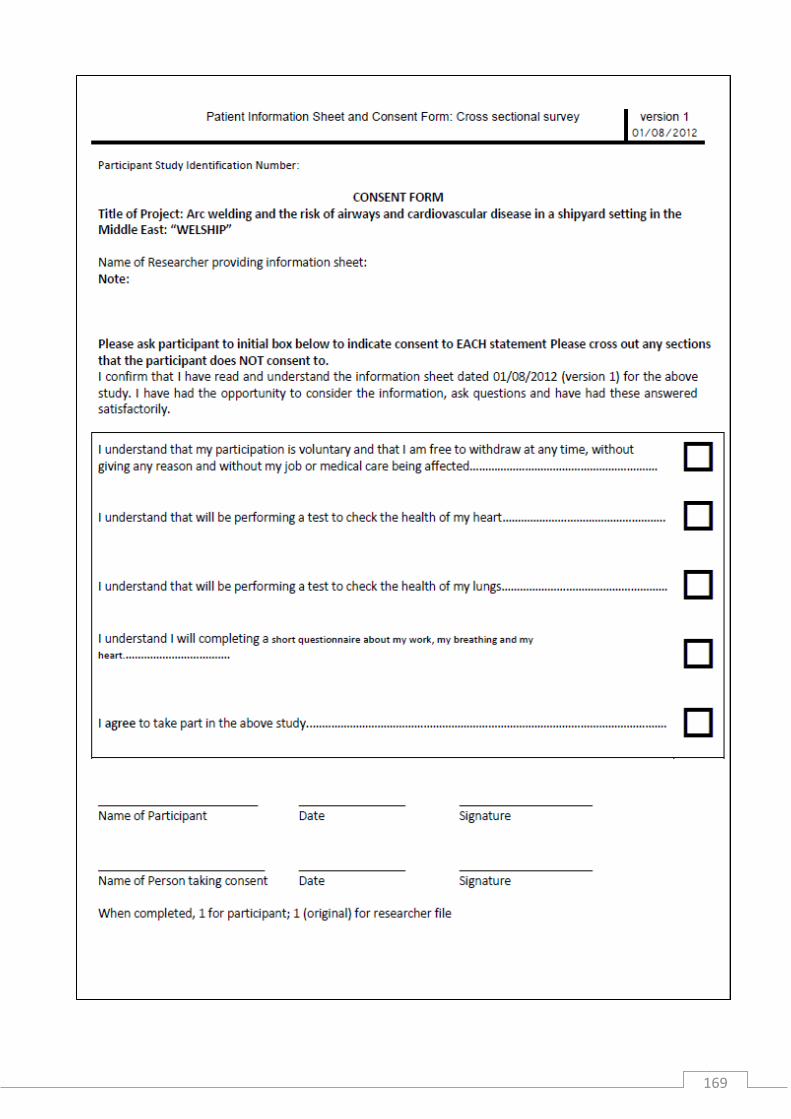
169
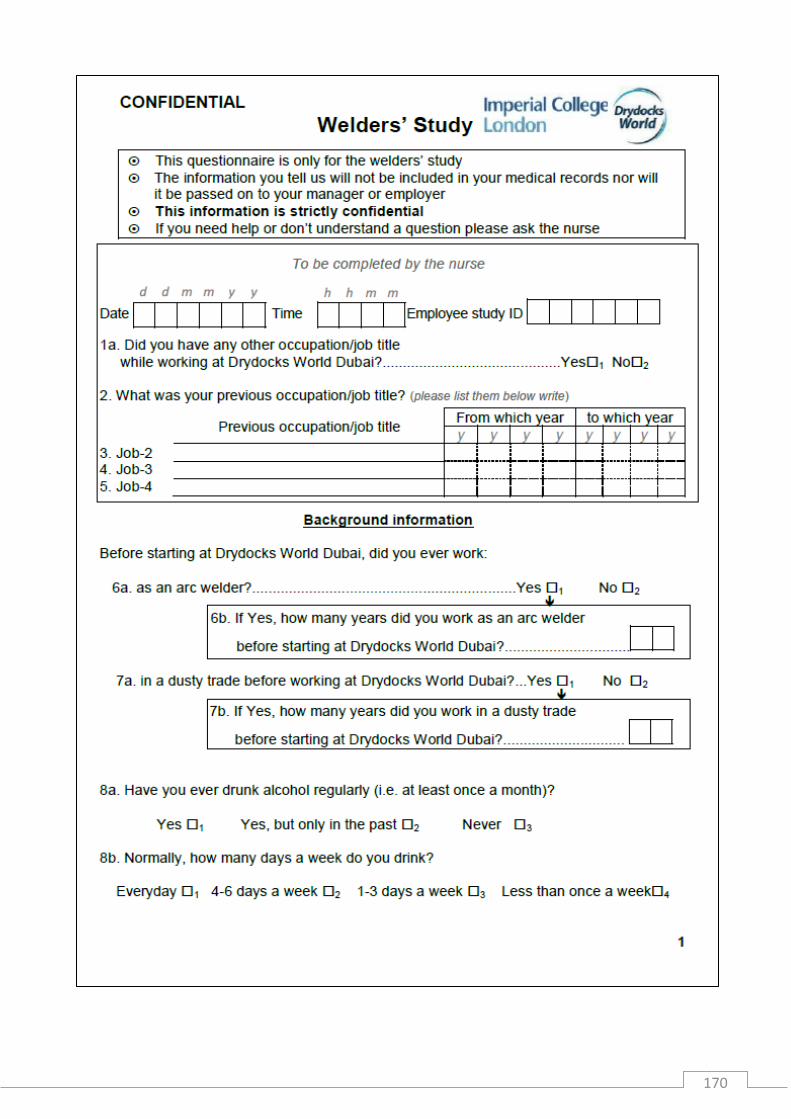
170

171

172

173

174
A.3.2 Cross-sectional survey frequency matching
Frequency matching 3 age groups and ethnicities excluding the "other" ethnic grp and those whose quit date is in November and December 2012
Age groups
Ban
glad
esh
i
<35 35-44 44>
Total N % n N % n N % n
High 812 189 23% 34.9 125 15% 23.1 81 10% 15
Medium 1,082 93 23% 34.9 56 15% 23.1 24 10% 15
Low 516 62 23% 34.9 41 15% 23.1 21 10% 15
Non exposed 2,261 121 23% 34.9 87 15% 23.1 64 10% 15
4671 140 92.4 59.9
Ind
ian
<35 35-44 44>
Exposure groups Total N % n N % n N % n
High 812 140 17% 25.9 71 9% 13.1 60 7% 11.1
Medium 1082 176 17% 25.9 122 9% 13.1 47 7% 11.1
Low 516 114 17% 25.9 70 9% 13.1 17 7% 11.1
Non exposed 2261 302 17% 25.9 249 9% 13.1 237 7% 11.1
103
52.5
44.3
Pak
ista
ni
<35 35-44 44>
Total N % n N % n N % n
High 812 15 2% 2.77 17 2% 3.14 18 2% 3.33
Medium 1082 28 2% 2.77 10 2% 3.14 15 2% 3.33
Low 516 17 2% 2.77 9 2% 3.14 8 2% 3.33
Non exposed 2261 160 2% 2.77 106 2% 3.14 92 2% 3.33
11.1 12.6 13.3
Filip
ino
<35 35-44 44>
Total N % n N % n N % n
High 812 14 2% 2.59 38 5% 7.02 33 4% 6.1
Medium 1082 135 2% 2.59 170 5% 7.02 176 4% 6.1
Low 516 29 2% 2.59 48 5% 7.02 62 4% 6.1
Non exposed 2261 111 2% 2.59 170 5% 7.02 271 4% 6.1
10.3
28.1
24.4
n
Tota
l
High 147.97 Medium 147.97 Low 147.97 Non exposed 147.97 N: 592

175
A.3.3 Cross-sectional survey diagram

176
A.3.4 Sensitivity analysis additional tables
Welders' characteristics by years of welding exposure 2/9 years
welding experience
10/36 years welding
experience Total P-value
N: 153 N: 121 N: : 274
Age - median (IQR) 33.3 (7) 44.5 (10) 37.6 (12) <0.001 Nationality - no. (%)
Bangladeshi 94 (61) 52 (43) 146 (53)
Indian 43 (28) 43 (36) 86 (31)
Filipino 13 (9) 17 (14) 30 (11)
Pakistani 3 (2) 9 (7) 12 (4) 0.007 Height - mean (SD) 165 (8) 163 (6) 164 (7) 0.455 Weight - median (IQR) 65 (12) 67 (11) 66 (11) 0.100
Waist/Hip Ratio - mean (SD) 0.93 (0.05) 0.95 (0.05) 0.94 (0.05) <0.001 Smoking - no. (%)
Current 37 (24) 30 (25) 67 (24)
Past 12 (8) 22 (18) 34 (12)
Never 104 (68) 69 (57) 173 (63) 0.029 Pack-years current smokers- median
(IQR) 2.8 (5) 6.2 (5) 4.5 (6) 0.012
Pack-years past smokers - median (IQR) 2.3 (3) 2.8 (5) 2.6 (4)
0.264
Alcohol intake - no. (%) Current 33 (22) 25 (21) 58 (21)
In the past 5 (3) 12 (10) 17 (6) Never 114 (75) 83 (69) 197 (72) 0.126
Frequncy of current alcohol intake Less than once a week 28 (85) 25 (100) 53 (91)
1-3 days a week 3 (9) - - 3 (5) 4-6 days a week 2 (6) - - 2 (3) 0.126
Tenure in years - median (IQR) 5.0 (2) 7.0 (5) 5.7 (3) <0.001 Years of welding at the shipyard -
median (IQR) 4.9 (2) 7.0 (5) 5.7 (3) <0.001
Past welding - no. (%) 77 (50) 115 (95) 192 (70) <0.001 Years of past welding - median (IQR) 2 (2) 7 (7) 5 (6) <0.001
Total years of welding experience - median (IQR) 6 (3) 15 (9) 9 (9) <0.001 Daily hours of arc welding - median (IQR) 2 (6) 6 (5) 4 (5) 0.023 Arc welding process used - no. (%)
MMA 124 (82) 95 (79) 219 (80) MIG/MAG 22 (14) 21 (17) 43 (16) TIG 6 (4) 5 (4) 11 (4) 0.803
Breathing mask worn during arc welding - no. (%)
Always 103 (68) 90 (74) 193 (71) Most of the time 37 (24) 21 (17) 58 (21) Sometimes 11 (7) 8 (7) 19 (7)

177
Respiratory symptoms in welders by years of welding exposure stratified by seasons
Summer Winter
2/9 years welding
experience
10/36 years welding
experience P-value
2/9 years welding
experience
10/36 years welding
experience P-value
Respiratory health - n (%) N: 96 N: 71 N: 57 N: 50
Lower respiratory tract symptoms
7 (7) 10 (14) 0.151 13 (23) 14 (28) 0.537
Respiratory symptoms work related
6 (6) 9 (13) 0.151 15 (9) 9 (6) 0.324
Upper & lower respiratory tract symptoms
7 (7) 12 (17) 0.053 14 (25) 14 (28) 0.686
Never 1 (1) 2 (2) 3 (1) 0.456 Handkerchief/scarf worn while welding - no. (%)
Always 35 (23) 27 (22) 62 (23) Most of the time 16 (11) 14 (12) 30 (11) Sometimes 38 (25) 30 (25) 68 (25) Never 63 (41) 50 (41) 113 (41) 0.994
Satisfactory level of ventilation - no. (%) Always 58 (38) 47 (39) 105 (38)
Most of the time 56 (37) 36 (30) 92 (34) Sometimes 38 (25) 37 (31) 75 (27) Never - - 1 (1) 1 (0.4) 0.387
Cutting & grinding - no. (%) 133 (87) 97 (81) 230 (84) 0.130 Daily hours of cutting & grinding -
median (IQR) 3 (3) 2 (4) 3 (4) 0.055 Past dusty work exposure - no. (%) 34 (22) 53 (44) 87 (32) <0.001
Years of past dusty work - median (IQR) 3 (3) 6 (6) 5 (4) <0.001

178
A.4.1 Complete list of all diagnosis and diagnostic codes
Diagnosis Code Diagnosis Type
r169 Abcess Back Repeatable
D134 Abdominal Pain Repeatable
D034 Abscess Repeatable
r308 Abscess Repeatable
D221 Acne Not repeatable
D274 Acute Appendicitis Not repeatable
D365 Acute Nasopharyngitis. Repeatable
r211 Alcohol Detoxification Repeatable
D017 Alcohol intoxication - on duty Repeatable
D261 Allergic Reaction Repeatable
D349 Allergic Rhinitis Not repeatable
r295 Allopacia Repeatable
r015 Alopecia Repeatable
D010 Anaemia Not repeatable
D203 Anorexia Not repeatable
r316 Anorexia Not repeatable
r092 Arm Pain Repeatable
D037 Arthritis Not repeatable
D344 Arthroscopy Repeatable
r279 Ascariasis Repeatable
D200 Asthmatic Bronchitis Not repeatable
D394 Audiometry Test Repeatable
D067 Back Pain Repeatable
D353 Back Pain - Occupational Cause Repeatable
D324 Bell'S Palsy Not repeatable
D341 Benign Tumour. Not repeatable
D370 Bilateral Pulmonary Tb. Repeatable
r252 Blister Shoe Repeatable
D395 Blood Lead Level Test. Repeatable
r288 Blunt Trauma Lt Chest Wall Repeatable
r225 Blunt Trauma To Rt Arm Repeatable
D338 Brain Tumor Not repeatable
D114 Breathing Difficulty Repeatable
D300 Bronchitis Not repeatable
r198 Burn Finger Repeatable
r175 Burn Lt Hand & Arm Repeatable
r173 Burn Lt Lower Leg Repeatable
r240 Burn Lt Thigh Repeatable
r085 Burn Lt. Foot Repeatable
r275 Burn Lt. Hand Repeatable
r311 Burn Neck Repeatable
r174 Burn Rt Thigh Repeatable
r125 Burn Rt.Foot Repeatable
r206 Burn Rt.Leg Repeatable
D055 Burns of external body surface Repeatable
D328 C.O.A.D - Non Occupational Not repeatable
D327 C.O.A.D - Occupational Not repeatable
r246 Cat Bite On Lt. Lower Leg Repeatable
D330 Cataract Not repeatable
D109 Cellulitis Repeatable
r215 Cellulitis Lt.Index Finger Repeatable
r182 Cellulitis Lt.Knee Repeatable

179
r147 Cellulitis Lt.Ring Finger Repeatable
r154 Cellulitis Neck Repeatable
r205 Cellulitis Nose Repeatable
r172 Cellulitis Rt Thumb Repeatable
r272 Cellulitis Rt. Axilla Repeatable
r181 Cellulitis Rt.Knee Repeatable
r228 Cellulitis Rt.Shoulder Repeatable
D262 Cerebral Vascular Accident Repeatable
D400 Chalazion Os Repeatable
r187 Chest Myalgia Repeatable
D070 Chest Pain Repeatable
D005 Chicken Pox Not repeatable
r227 Chiken Pox Vacc Not repeatable
D377 Cholelithiasis Repeatable
D346 Chronic Kidney Disease Not repeatable
D029 Chronic lung disease Not repeatable
D360 Chronic Renal Failure Not repeatable
r188 Chronic Sinositis Repeatable
D018 Conjunctivitis Repeatable
D004 Constipation Repeatable
r185 Contusion Head Repeatable
D336 Corn Repeatable
r107 Corn Lt Foot Repeatable
r108 Corn Rt Foot Repeatable
r283 Crushed Injury To Lt. Little Finger Repeatable
r310 Cut Injury Repeatable
r266 Cut Injury Both Hand Repeatable
r035 Cut Injury Lower Abdomen Repeatable
r278 Cut Injury Lt Index Finger Repeatable
r263 Cut Injury Lt Middle Finger Repeatable
r249 Cut Injury Lt Ring Finger Repeatable
r256 Cut Injury Lt. Forearm Repeatable
r287 Cut Injury Lt. Knee Repeatable
r267 Cut Injury Lt.Thumb Repeatable
r138 Cut Injury Rt Thumb /Little Finger Repeatable
r286 Cut Injury Rt. Index Finger Repeatable
r270 Cut Injury Rt. Little Finger Repeatable
r224 Cut Injury Upper Lip Repeatable
r103 Cyst Repeatable
D032 Dermatitis - Occupational Not repeatable
D033 Dermatitis - Unknown cause Not repeatable
D014 Diabetes Mellitus - complications Not repeatable
D013 Diabetes Mellitus - no complications Not repeatable
D089 Diarrhoea Repeatable
r281 Dismenorrhoea Repeatable
D133 Dizziness Repeatable
r239 Dry Skin Repeatable
D318 Dyslipideamia Not repeatable
D289 Dysmenorrhea Repeatable
D364 Dyspepsia Repeatable
D362 Dysuria Repeatable
D068 Ear Pain Repeatable
r293 Enlarge Postate Not repeatable
D333 Enlarged Prostate Not repeatable
D371 Enteric Fever Repeatable
D099 Epistexis Repeatable
r060 Exposure to animate mechanical forces Repeatable

180
r061 Exposure to electrical current Repeatable
r059 Exposure to inanimate mechanical forces Repeatable
D066 Exposure to smoke / fumes Repeatable
D088 Eye Irritation Repeatable
r236 Eye Irritation/Pain Repeatable
D191 F/B In Throat ( Fish Bone ) Repeatable
D374 F/B Lt Ear. Repeatable
D076 F/B Lt. Eye Repeatable
r238 F/B Lt.Little Finger Repeatable
D375 F/B Rt Ear. Repeatable
D075 F/B Rt. Eye Repeatable
r314 F-Body Lt Thumb Repeatable
r251 Fighting Case Repeatable
r093 Foot Pain Repeatable
D039 Fracture Repeatable
r148 Fracture Lt.Ankle Repeatable
r101 Fracture Rt.Metacarpal Bone Repeatable
D058 Frozen Shoulder Repeatable
D192 Fungal Infection Repeatable
D112 Gastritis Repeatable
D001 Gastroenteritis - infectious Repeatable
D002 Gastroenteritis - non infectious Repeatable
r242 Glositis Repeatable
D389 Gonorrhea Repeatable
D348 Gout Not repeatable
r217 Groin Pain Repeatable
r290 Groin Rash Repeatable
r298 Growth In The Back. Repeatable
D399 Gynaecomastia Repeatable
D386 H.A.V Surveillance Repeatable
D302 Haematuria Repeatable
r186 Haemoptysis Repeatable
D073 Haemorrhoids Repeatable
r292 Hand Pain Repeatable
D135 Headache Repeatable
D350 Hearing Loss – Occupational Not repeatable
D062 Heat effect Repeatable
D063 Heat exhaustion Repeatable
D064 Heat stroke Repeatable
r090 Heel Pain Repeatable
r229 Heel Pain Repeatable
D008 Hepatitis - viral Repeatable
D356 Hepatitis A (Vaccination) Repeatable
D357 Hepatitis B (Vaccination) Repeatable
D072 Hernia Repeatable
D006 Herpes Simplex Repeatable
D366 Herpes Zoster Not repeatable
r123 Htn / Dm Repeatable
D285 Hydrocele Repeatable
D363 Hyperemesis Repeatable
D329 Hyperglyceamia Repeatable
D315 Hyperlipidemia Not repeatable
D022 Hypertension - no treatment Not repeatable
D023 Hypertension - treatment Not repeatable
D011 Hyperthyroidism Not repeatable
r223 Hypotension Acute Mi Not repeatable
D012 Hypothyroidism Not repeatable

181
D027 Influenza Repeatable
r214 Ingrowing Finger Nail Repeatable
D087 Ingrowing Nail Repeatable
D339 Inguinal Hernia Repeatable
r303 Inguinal Pain Repeatable
r204 Inj . T.T.Vacination. Repeatable
r226 Inj Hepa A & B Repeatable
r046 Injury to Abdomen, lumber spine, pelvis Repeatable
r046 Injury to Abdomen, lumber spine, pelvis Repeatable
r052 Injury to ankle and foot Repeatable
r048 Injury to elbow and forearm Repeatable
r053 Injury to eye Repeatable
r043 Injury to head Repeatable
r050 Injury to hip and thigh Repeatable
r051 Injury to knee and lower leg Repeatable
r044 Injury to neck Repeatable
r047 Injury to shoulder and upper arm Repeatable
r049 Injury to wrist and hand Repeatable
D199 Insect Bite Repeatable
D323 Insomnia Not repeatable
D003 Intestinal parasites Repeatable
D024 Ischemic heart disease Not repeatable
D332 Jaundice Repeatable
r218 Joint Pain / Swelling Repeatable
D388 Knee Cellulitis. Repeatable
D387 Knee Effusion Repeatable
r210 Knee Pain Repeatable
r273 Left Zygoma Fracture Repeatable
r095 Leg Pain Repeatable
D367 Leprosy Repeatable
D391 Lipoma Repeatable
r305 Liposuction Rt Gynacomastia Not repeatable
r119 Loose Motion Repeatable
r208 Loose Of Appetite Repeatable
r254 Lt Inquinal Pain Repeatable
r151 Lt Knee Swelling Repeatable
r141 Lt.Elbow Pain Repeatable
r157 Lt.Eye Pain Repeatable
D030 Lung disease due to occupational exposure Repeatable
D373 Lymphadenitis Repeatable
D331 Malaria Repeatable
D359 Male Infertility Not repeatable
D009 Malignant neoplasms stated or presumed to be primary Not repeatable
D351 Manual Handling Related Disorders Repeatable
D128 Melaena Repeatable
D319 Meningitis Repeatable
D397 Menorrhagia Repeatable
D383 Menstruation Repeatable
D343 Metal Fume Fever Repeatable
r280 Microdicectomy Repeatable
D115 Migraine Repeatable
r265 Minor Burn Abdomen Repeatable
r176 Minor Burn On Lt.Arm Repeatable
r258 Minor Burn Rt. Eye Repeatable
r126 Minor Cut Injury Lt Foot Repeatable
r207 Minor Head Injury Repeatable

182
D398 Mumps Not repeatable
D335 Muscular Skeletal Pain - Non Occupational Cause Repeatable
D334 Muscular Skeletal Pain - Occupational Cause Repeatable
D094 Myalgia Repeatable
D378 Myocardial Infarction Repeatable
D382 Nasal Septum Repeatable
r091 Neck Pain Repeatable
D390 Nephrolithiasis
D369 Nephrotic Syndrome Repeatable
r117 Nesal Polyp Repeatable
r291 Niddm Not repeatable
r307 Numbness Repeatable
D358 Ob - Gyne Repeatable
D345 Oedema Repeatable
D139 Oral Ulcer. Repeatable
D096 Orchitis Repeatable
25 Other Repeatable
D097 Otitis Externa Repeatable
D021 Otitis media Repeatable
r132 Pain Both Knees Repeatable
r235 Pain In Rif Repeatable
r180 Pain Lt Wrist Repeatable
r184 Pain Lt.Ankle Repeatable
r194 Pain Lt.Hand Repeatable
r178 Pain Lt.Knee Repeatable
r196 Pain Lt.Leg Repeatable
r105 Pain Rt Thumb Repeatable
r179 Pain Rt Wrist Repeatable
r183 Pain Rt.Ankle Repeatable
r193 Pain Rt.Hand Repeatable
r177 Pain Rt.Knee Repeatable
r197 Pain Rt.Leg Repeatable
D396 Palpatation Repeatable
D337 Paraplegia Not repeatable
D392 Parkinson,S Disease. Not repeatable
r111 Parotide Gland Swelling Repeatable
D368 Perianal Abscess. Repeatable
D347 Pericarditis Repeatable
r230 Perineal Abscess Repeatable
D361 Pharyngitis. Repeatable
D312 Phymosis Not repeatable
D384 Pilonidal Sinus Repeatable
D028 Pneumonia Repeatable
D057 Poisoning - known cause Repeatable
D056 Poisoning unknown cause Repeatable
D016 Psychological disturbances Repeatable
D212 Pterygium Not repeatable
r025 Pulmonary Heart Disease Not repeatable
r294 Puncture Wound. Repeatable
D042 Pyrexia unknown origin Repeatable
D081 Renal Colic Not repeatable
r209 Renal Colic Not repeatable
D354 Respiratory Health Surveillance Repeatable
D325 Retinopathy Repeatable
D340 Reynaulds Syndrome Not repeatable
D118 Rhynitis Not repeatable
D352 Routine Eye Testing Repeatable
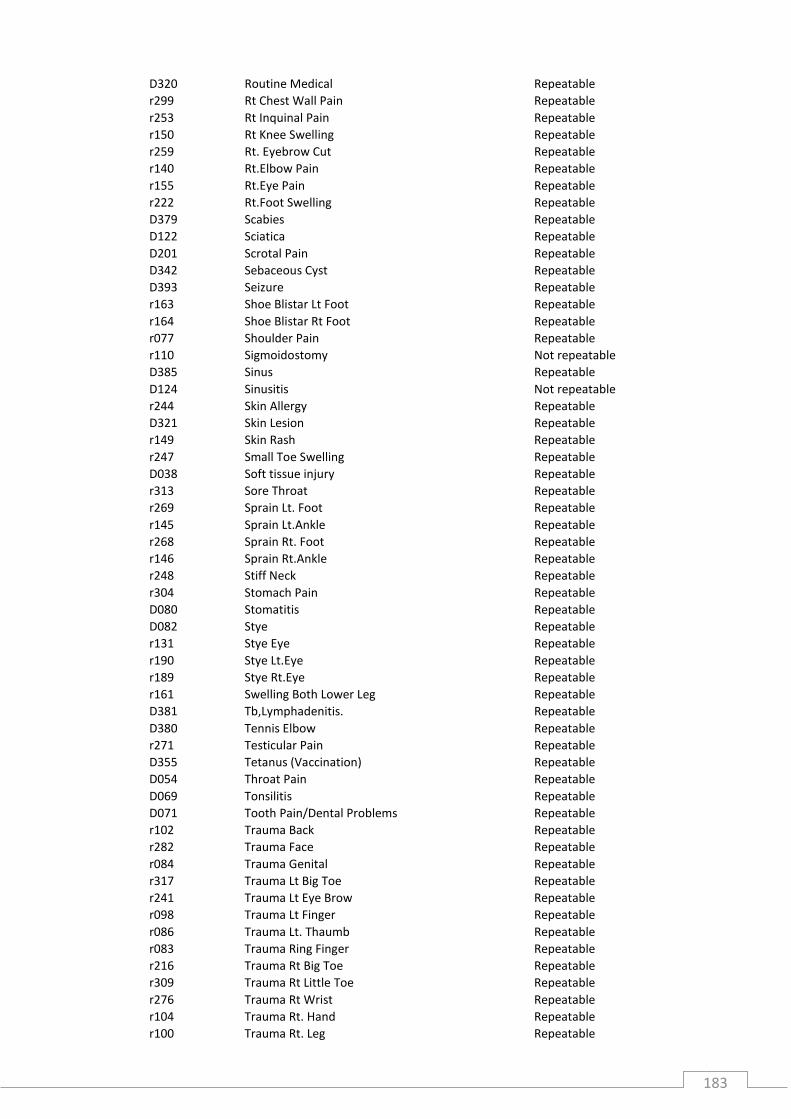
183
D320 Routine Medical Repeatable
r299 Rt Chest Wall Pain Repeatable
r253 Rt Inquinal Pain Repeatable
r150 Rt Knee Swelling Repeatable
r259 Rt. Eyebrow Cut Repeatable
r140 Rt.Elbow Pain Repeatable
r155 Rt.Eye Pain Repeatable
r222 Rt.Foot Swelling Repeatable
D379 Scabies Repeatable
D122 Sciatica Repeatable
D201 Scrotal Pain Repeatable
D342 Sebaceous Cyst Repeatable
D393 Seizure Repeatable
r163 Shoe Blistar Lt Foot Repeatable
r164 Shoe Blistar Rt Foot Repeatable
r077 Shoulder Pain Repeatable
r110 Sigmoidostomy Not repeatable
D385 Sinus Repeatable
D124 Sinusitis Not repeatable
r244 Skin Allergy Repeatable
D321 Skin Lesion Repeatable
r149 Skin Rash Repeatable
r247 Small Toe Swelling Repeatable
D038 Soft tissue injury Repeatable
r313 Sore Throat Repeatable
r269 Sprain Lt. Foot Repeatable
r145 Sprain Lt.Ankle Repeatable
r268 Sprain Rt. Foot Repeatable
r146 Sprain Rt.Ankle Repeatable
r248 Stiff Neck Repeatable
r304 Stomach Pain Repeatable
D080 Stomatitis Repeatable
D082 Stye Repeatable
r131 Stye Eye Repeatable
r190 Stye Lt.Eye Repeatable
r189 Stye Rt.Eye Repeatable
r161 Swelling Both Lower Leg Repeatable
D381 Tb,Lymphadenitis. Repeatable
D380 Tennis Elbow Repeatable
r271 Testicular Pain Repeatable
D355 Tetanus (Vaccination) Repeatable
D054 Throat Pain Repeatable
D069 Tonsilitis Repeatable
D071 Tooth Pain/Dental Problems Repeatable
r102 Trauma Back Repeatable
r282 Trauma Face Repeatable
r084 Trauma Genital Repeatable
r317 Trauma Lt Big Toe Repeatable
r241 Trauma Lt Eye Brow Repeatable
r098 Trauma Lt Finger Repeatable
r086 Trauma Lt. Thaumb Repeatable
r083 Trauma Ring Finger Repeatable
r216 Trauma Rt Big Toe Repeatable
r309 Trauma Rt Little Toe Repeatable
r276 Trauma Rt Wrist Repeatable
r104 Trauma Rt. Hand Repeatable
r100 Trauma Rt. Leg Repeatable

184
r297 Trauma Rt. Side Of Lower Abdomen Repeatable
r231 Trauma To Back Repeatable
r260 Trauma To Both Hands Repeatable
r137 Trauma To Both Knees Repeatable
r233 Trauma To Chest Repeatable
r152 Trauma To Chin Repeatable
r160 Trauma To Face. Repeatable
r250 Trauma To Forehead Repeatable
r234 Trauma To Forehead/Face Repeatable
r159 Trauma To Lt Ankle Repeatable
r301 Trauma To Lt Elbow Repeatable
r284 Trauma To Lt Index Finger Repeatable
r257 Trauma To Lt Shoulder Repeatable
r296 Trauma To Lt. Index Finger Repeatable
r079 Trauma To Lt. Knee Repeatable
r219 Trauma To Lt. Middle Finger Repeatable
r144 Trauma To Lt.Foot Repeatable
r130 Trauma To Lt.Hand Repeatable
r245 Trauma To Lt.Hand Repeatable
r106 Trauma To Lt.Knee Repeatable
r153 Trauma To Lt.Leg Repeatable
r195 Trauma To Lt.Little Finger Repeatable
r264 Trauma To Lt.Ring & Middle Fingers Repeatable
r121 Trauma To Lt.Ring Finger Repeatable
r220 Trauma To Lt.Shoulder & Chest Repeatable
r165 Trauma To Lt.Thumb Repeatable
r127 Trauma To Lt.Wrist Repeatable
r306 Trauma To Ribs Repeatable
r113 Trauma To Rt Index/Finger Repeatable
r158 Trauma To Rt Leg Repeatable
r136 Trauma To Rt Middle Finger Repeatable
r237 Trauma To Rt Thumb Repeatable
r277 Trauma To Rt. Hand Repeatable
r120 Trauma To Rt.Elbow Repeatable
r143 Trauma To Rt.Foot Repeatable
r116 Trauma To Rt.Knee Repeatable
r142 Trauma To Rt.Thumb Repeatable
r166 Trauma To Rt.Thumb Repeatable
r078 Truama Rt Thumb Repeatable
D007 Tuberculosis Repeatable
r167 Tumer Lt Hand Not repeatable
r168 Tumer Rt Hand Not repeatable
D372 Typhoid Fever. Repeatable
D065 Unconscious - unknown cause Repeatable
D074 Under Influence Of Alcohol Repeatable
r026 Upper respiratory tract infection Repeatable
D040 Urinary Tract Infection Repeatable
r129 Urine Problems Repeatable
D041 Urolithiasis Repeatable
D000 Urti Repeatable
D031 Urticaria Not repeatable
D170 Uti Repeatable
D376 Varicocele Repeatable
D322 Varicose Veins Repeatable
D162 Vertigo Repeatable
D020 Visual disturbances Repeatable
D171 Vomiting Repeatable

185
D255 Weakness Repeatable
D019 Welding flash Repeatable
D232 Welding Smoke Inhalation Repeatable
D202 Worm Infestation Repeatable
D036 Wound - Secondary healing Repeatable
r243 Wrist Pain Repeatable

186
A.4.2 Example of recoded diagnosis for the second index list: 2000-2004 medical records
Diagnosis
Diagnosis
Code Diagnosis manually allocated
AALLERGIC BRONCHITIS R001 Allergic Bronchitis
ALLERGIC BRONCHITIS R001 Allergic Bronchitis
ALLERGIC BRONCHITIS DDC R001 Allergic Bronchitis
ALLERGIC CONJUNCTIVITIS E002 Allergic Conjuntivitis
ALLERGIC CONJUNCTIVITIS- BOTH EYES E002 Allergic Conjuntivitis
F.B. RT EYE/ALLERGIC CONJUNCTIVITIS E002 Allergic Conjuntivitis
PRE-SEPTAL ALLERGIC REACTION/ACUTE ALLERGIC CONJUNCTIVITISE002 Allergic Conjuntivitis
ALEERGIC CONJUNCTIVITIS E002 Allergic Conjuntivitis
URTI ALLERGIC RHINITIS D349 Allergic Rhinitis
ALLERGICAL RHYNITIS. D349 Allergic Rhinitis
ALLERGIC RHINITIS ACUTE PHARYNGITIS DDC D349 Allergic Rhinitis
ALLERGIC RHINITIS DDC D349 Allergic Rhinitis
ALLERGIC RHINITIS-DDC D349 Allergic Rhinitis
COLD,BODYACHE ALLERGIC RHINITIS-DDC D349 Allergic Rhinitis
ASTHMATIC R015 Asthma
ASTHMATIC BRONCHITIS DDC D200 Asthmatic Bronchitis
ASTHMATIC BRONCHITIS, D200 Asthmatic Bronchitis
ASTHMATIC BRONCHITIS. D200 Asthmatic Bronchitis
ASTHMATIC BRONCHITIS-DDC D200 Asthmatic Bronchitis
ASTHMATIC BRONCHITIS-DDC SEVERE ACUTE ASTHMA-RH A/E BY AMBULANCE PNEUMONIA AMHD200 Asthmatic Bronchitis
COLD,COUGH THROAT PAIN-PRC ASTHMATIC BRONCHITIS-DDC] D200 Asthmatic Bronchitis
FEVER 99.3F,BODYACHE ASTHMATIC BRONCHITIS IN ACUTE ATTACK-DDC ABD PAIN,HEADACHE,RUNNING NOSE-PRC,VOMITTING R/H BY AMBULANCE ASTHMATIC BRONCHITIS-DDC FRONTAL HEADACHE-PRCD200 Asthmatic Bronchitis
FEVER,COUGH,BODYACHE ASTHMATIC BRONCHITIS DDC PRC ,A/E RHD200 Asthmatic Bronchitis
PRODUCTIVE COUGH PRC ASTHMATIC BRONCHITIS D200 Asthmatic Bronchitis
THROAT IRRITATION NOT IMPROVE RH A/E ASTHMATIC BRONCHITISD200 Asthmatic Bronchitis
THROAT PAIN ACUTE BRONCHITIS DDC ASTHMATIC BRONCHITIS-DDCD200 Asthmatic Bronchitis
ASMATIC BRONCHITIS, D200 Asthmatic Bronchitis
ASTHAMATIC BRONCHITIS D200 Asthmatic Bronchitis
ASTHMA BRONCHITIS, D200 Asthmatic Bronchitis
COUGH ASTHAMATIC BRONCHITIS DDC D200 Asthmatic Bronchitis
URTI DDC ASTHMATIC BRONCHITIS DDC D200 Asthmatic Bronchitis
URTI@BRONCHIAL ASTHMA DDC ASTHMATIC BRONCHITIS D200 Asthmatic Bronchitis
ALLERGIC BRONCHIAL ASTHMA D200 Asthmatic Bronchitis
BRONCHIAL ASTHAMA. D200 Asthmatic Bronchitis
BRONCHIAL ASTHAMA-DDC D200 Asthmatic Bronchitis
BRONCHIAL ASTHMA D200 Asthmatic Bronchitis
BRONCHIAL ASTHMA . D200 Asthmatic Bronchitis
BRONCHIAL ASTHMA, D200 Asthmatic Bronchitis
BRONCHIAL ASTHMA. D200 Asthmatic Bronchitis
BRONCHIL ASTHMA D200 Asthmatic Bronchitis
CHRONIC ASTHMATIC BRONCHI TIS D200 Asthmatic Bronchitis
DIFICALTY IN BREATHING, ?BRONCHIAL ASTHMA. D200 Asthmatic Bronchitis
PAIN IN NECK ,DIFFICULTY IN BREATHING,DIZZINESS A/E RH BY AMBULANCE BRONCHEIL ASTHMA DDC NOT IMPROVE PRC SEVERE WHEEZING RH A/E BY AMB PRC APPT PRCD200 Asthmatic Bronchitis
BELL,S PALSY D324 Bell'S Palsy
BELLS PALSY D324 Bell'S Palsy
NUMBNESS RT SIDE FACE REF TO PRC FOR SHORT GTT BELLS PALSY DDC B/P CHECK PRC REF TO A/E RH BY AMBD324 Bell'S Palsy
BILATERAL PULMONARY TB WITH PERICARDIAL EFFUSION RT PLEURAL,D370 Bilateral Pulmonary Tb.
BILATERAL PULMONARY KOCKS D370 Bilateral Pulmonary Tb.
URTI BILATERAL PNEUMONIA D370 Bilateral Pulmonary Tb.
URTI/BREATHING DIFFICULTY D114 Breathing Difficulty
BREATHING DIFFICULTY ?ASTHMATIC D114 Breathing Difficulty

187
A.5.1 Panel study documents and questionnaire

188

189

190

191

192

193

194
A.5.2 Panel study sampling frame
Study ID Department Smoking status
Exposure group Welding years
Age
Panel Survey
WSP001 WSX118 Plate Shop Never FT welder 3.0 31.9 WSP002 WSX248 Plate Shop Never FT welder 3.2 35.2 WSP003 WSX255 Pipe Shop Never FT welder 3.7 30.0 WSP004 WSX134 Plate Shop Never FT welder 4.6 40.3 WSP005 WSX576 Pipe Shop Never FT welder 4.6 32.3 WSP006 WSX281 Plate Shop Never FT welder 5.7 28.0 WSP007 WSX353 Fabrication Department Never FT welder 6.2 31.2 WSP008 WSX553 Plate Shop Never FT welder 7.2 30.8 WSP009 WSX374 Plate Shop Never FT welder 7.4 31.5 WSP010 WSX139 Plate Shop Never FT welder 7.4 33.0 WSP011 WSX341 Plate Shop (Training) Never FT welder 8.1 40.1 WSP012 WSX259 Outfitting Department Never FT welder 8.7 36.2 WSP013 WSX028 Pipe Shop Never FT welder 9.0 34.9 WSP014 WSX560 Plate Shop Never FT welder 9.2 33.8 WSP015 WSX379 Fabrication Department Never FT welder 9.2 35.3 WSP016 WSX109 Outfitting Department Never FT welder 9.7 44.1 WSP017 WSX157 Fabrication Department Never FT welder 10.0 42.9 WSP018 WSX336 Fabrication Department Never FT welder 11.6 46.4 WSP019 WSX104 Plate Shop Never FT welder 14.5 44.2 WSP020 WSX251 Plate Shop Never FT welder 17.0 38.1 WSP021 WSX444 Plate Shop Never FT welder 17.0 42.5 WSP022 WSX426 Plate Shop Never FT welder 17.6 45.3 WSP023 WSX081 Fabrication Department Never FT welder 21.6 44.0 WSP024 WSX330 Plate Shop Never FT welder 23.9 46.4 WSP025 WSX600 Plate Shop Never FT welder 24.2 46.6 WSP026 WSX563 Plate Shop Never FT welder 26.4 48.1 WSP027 WSX297 Fabrication Department Never FT welder 7.8 33.0 WSP028 WSX326 Plate Shop Never PT welder 4.3 34.9 WSP029 WSX527 Plate Shop Never PT welder 5.7 33.7 WSP030 WSX451 Pipe Shop (Outfitting Department) Never PT welder 6.8 30.9 WSP031 WSX246 Plate Shop Never PT welder 10.0 40.3 WSP032 WSX415 Fabrication Department Never PT welder 13.2 41.2 WSP033 WSX309 Services Never Non-welder 25.6 WSP034 WSX217 Docks & Staging Never Non-welder 28.1 WSP035 WSX057 Outfitting Department Never Non-welder 28.1 WSP036 WSX032 Services Never Non-welder 29.1 WSP037 WSX585 Mobile Plant, Transport & Cranes Never Non-welder 29.4 WSP038 WSX542 Docks & Staging (Riggers) Never Non-welder 29.6 WSP039 WSX358 Mechanical Never Non-welder 29.8 WSP040 WSX511 Mechanical (Riggers) Never Non-welder 30.0 WSP041 WSX244 Docks & Staging Never Non-welder 30.0 WSP042 WSX216 Infrastructure Maintenance &
Development Never Non-welder 32.1
WSP043 WSX206 Docks & Staging Never Non-welder 33.0 WSP044 WSX540 Mechanical Never Non-welder 33.6 WSP045 WSX513 Electrical (Outfitting Department) Never Non-welder 33.9 WSP046 WSX257 Docks & Staging Never Non-welder 34.0 WSP047 WSX218 Docks & Staging Never Non-welder 36.0 WSP048 WSX384 Carpentry (Docks & Staging) Never Non-welder 36.6 WSP049 WSX512 Environment Never Non-welder 37.2 WSP050 WSX567 Services Never Non-welder 37.3 WSP051 WSX125 Docks & Staging Never Non-welder 38.4 WSP052 WSX596 Mechanical Never Non-welder 38.6 WSP053 WSX252 Services Never Non-welder 39.6

195
WSP054 WSX323 Plate Shop (Riggers) Never Non-welder 40.2 WSP055 WSX060 Docks & Staging Never Non-welder 40.9 WSP056 WSX062 Mechanical Never Non-welder 41.3 WSP057 WSX288 Docks & Staging Never Non-welder 44.8 WSP058 WSX250 Mechanical Never Non-welder 44.9 WSP059 WSX410 Plate Shop (Riggers) Never Non-welder 45.4 WSP060 WSX245 Mechanical Never Non-welder 45.7 WSP061 WSX086 Mechanical Never Non-welder 46.2 WSP062 WSX357 Electrical W/Shop Never Non-welder 48.3 WSP063 WSX137 Services Never Non-welder 49.2 WSP064 WSX074 Mechanical Never Non-welder 51.2 WSP065 WSX462 Mobile Plant, Transport & Cranes Never Non-welder 52.5 WSP066 WSX052 Electrical W/Shop Never Non-welder 54.0

196
A.5.3 Panel study diagram
197
A.5.4 SOP for handling blood samples
1. Setup blood collection area Set up the collection area with an absorbent sheet to create a clear and clean collection area. Label the sets of Vacutainers and cryovials needed per participant and put them in collection order in a rack. Set up all needed supplies. 2. Venepuncture Ask participants to sit down on a chair for blood collection. Always wear gloves when collecting or handling biological sample. The tourniquet is released during venepuncture. Should the tourniquet be needed throughout blood draw, this information needs to be recorded in the case report form. Collect fresh blood from a suitable vein in the following order. Do not alter the order of blood drawing. 1. 4 ml of blood with Vacutainer for serum (Tube 1) 2. ~10 ml of blood with EDTA Vacutainer for EDTA whole blood; for EDTA plasma; for buffy coat (Tube 2) After collection of blood into Vacutainers gently invert each 6-8 times to mix the additive with the blood. Dispose of the needle & holder into the sharp waste; do not recap the needle or remove it from the holder. Log time of venepuncture in the blood form. Keep the Vacutainers with the collected blood cool. The temperature of the samples should be around 4°C until work-up (put collection tubes into refrigerator or in a cooling bag with cooling elements or on crushed ice in a Styrofoam box). If the blood is being collected outside the laboratory, put the blood sample into a cooling bag or box on cooling elements or crushed ice for transport to the laboratory (NO dry ice - avoid freezing). 3. Blood Work Up and Storage (at the lab) The time elapsed between blood collection and storage of aliquots at -80° C should not exceed 2 hours. All bio-specimen aliquots are stored at -80° C. Make sure to tightly screw and close the cryovials. Make sure to use a new pipette tip every time you process blood from a new person. Make sure to use a new pipette tip for every blood-processing step on blood from the same person. Tube 1 Blood in tube 1 is allowed to clot for a minimum of 1 h at 4 °C on ice or in refrigerator or in cooling bag. The clotting time should be recorded. The serum fraction is prepared by centrifugation of the blood collection tube at 2,500g for 15 min at 4 °C. Place aliquots in a rack on crushed ice.

198
Samples are then immediately divided into aliquots (3x 500 µl for adductomics; 3x 500 µL for metabolomics analyses); all in 0.5 ml Sarstedt PP-screw cap cryovials. Transfer aliquots immediately to storage boxes and storage freezers (-80°C). Tube 2 For miRNA & mRNA in EDTA whole blood + RNAlater: Work at 4 ºC (Place aliquots in a rack of crushed ice). Prepare RNA Later in 3 Sarstedt PP-screw cap cryovials 2 ml: 1.2 ml RNAlater / cryovial (for 400 µl of EDTA blood). Transfer 3x 0.4 ml of EDTA blood into the 2 ml cryovials already containing 1.2 ml of RNAlater. Gently invert to mix the EDTA blood with RNA later. Put into -80°C storage immediately. For plasma and buffy coat: Work at 4 ºC (Place aliquots in a rack of crushed ice). Separate the remaining ~8 ml of EDTA whole blood into two secondary tubes for a first centrifugation (4 ml each to obtain two comparable buffy coat aliquots – for centrifugation use 5 ml PP cryovials Sarstedt 55.475.001). Centrifuge at 1600g for 10 min at 4 ºC. Carefully collect plasma supernatant from each of the 2 centrifugation tubes. Leave a very small amount of plasma on top of the buffy coat layer, so that the buffy coat is not being disturbed and no cells are contaminating the plasma. Pool plasma supernatant from each of the 2 centrifugation tubes in a new tube (~3ml of EDTA-plasma) for a second centrifugation. Centrifuge again at 14,000 to 16,000g for 10 min, at 4 ºC. Place aliquots in a rack on crushed ice. - 3x transfer 0.5 ml plasma supernatant into two 2ml new PP cryovials and tightly cap them. - Put into -80°C storage immediately. During the second centrifugation, transfer buffy coat (greyish layer and a small amount of the RBC) from the first centrifugation round, the two centrifugation tubes, each into a separate 2ml PP cryovial. Be sure you get the entire buffy coat. The small amount of plasma left in the Vacutainer may be taken as well as the buffy coat. Place the aliquots in a rack on crushed ice. Put into -80°C storage immediately.
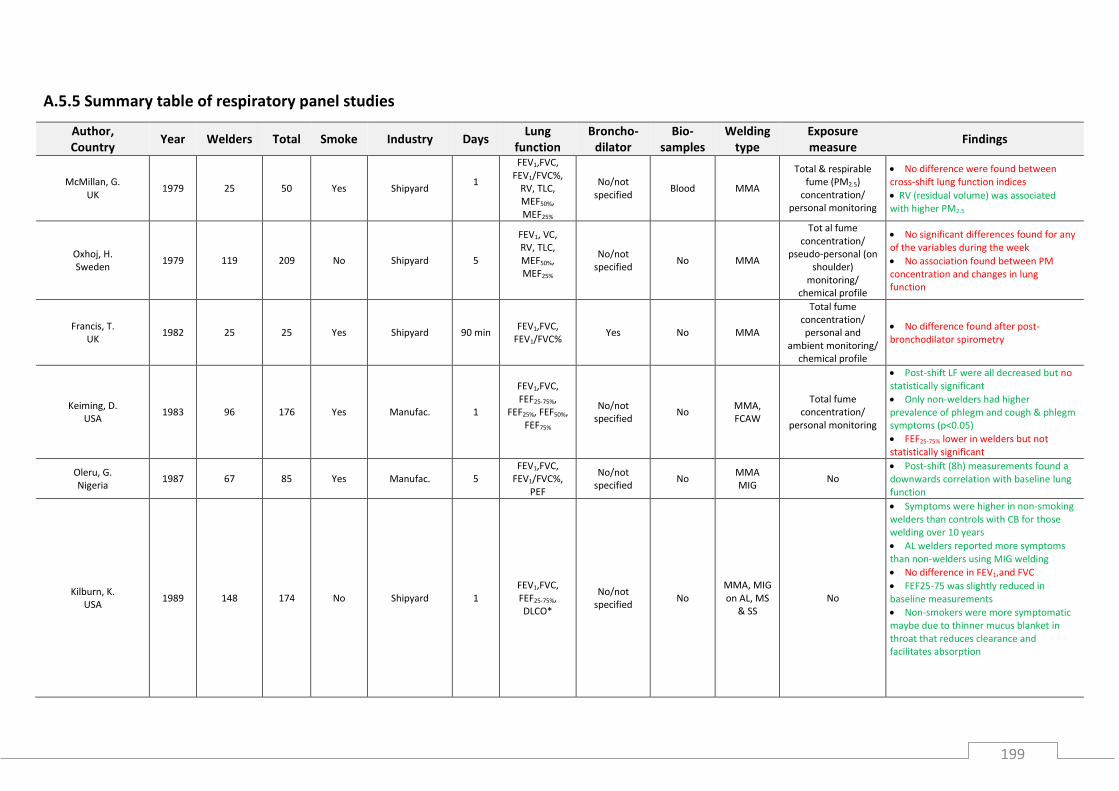
199
A.5.5 Summary table of respiratory panel studies
Author, Country
Year Welders Total Smoke Industry Days Lung
function Broncho-
dilator Bio-
samples Welding
type Exposure measure
Findings
McMillan, G. UK
1979 25 50 Yes Shipyard 1
FEV1,FVC, FEV1/FVC%,
RV, TLC, MEF50%, MEF25%
No/not specified
Blood MMA
Total & respirable fume (PM2.5)
concentration/ personal monitoring
No difference were found between cross-shift lung function indices
RV (residual volume) was associated with higher PM2.5
Oxhoj, H. Sweden
1979 119 209 No Shipyard 5
FEV1, VC, RV, TLC, MEF50%, MEF25%
No/not specified
No MMA
Tot al fume concentration/
pseudo-personal (on shoulder)
monitoring/ chemical profile
No significant differences found for any of the variables during the week
No association found between PM concentration and changes in lung function
Francis, T. UK
1982 25 25 Yes Shipyard 90 min FEV1,FVC,
FEV1/FVC% Yes No MMA
Total fume concentration/ personal and
ambient monitoring/ chemical profile
No difference found after post- bronchodilator spirometry
Keiming, D. USA
1983 96 176 Yes Manufac. 1
FEV1,FVC, FEF25-75%,
FEF25%, FEF50%, FEF75%
No/not specified
No MMA, FCAW
Total fume concentration/
personal monitoring
Post-shift LF were all decreased but no statistically significant
Only non-welders had higher prevalence of phlegm and cough & phlegm symptoms (p<0.05)
FEF25-75% lower in welders but not statistically significant
Oleru, G. Nigeria
1987 67 85 Yes Manufac. 5 FEV1,FVC,
FEV1/FVC%, PEF
No/not specified
No MMA MIG
No Post-shift (8h) measurements found a downwards correlation with baseline lung function
Kilburn, K. USA
1989 148 174 No Shipyard 1 FEV1,FVC, FEF25-75%, DLCO*
No/not specified
No MMA, MIG on AL, MS
& SS No
Symptoms were higher in non-smoking welders than controls with CB for those welding over 10 years
AL welders reported more symptoms than non-welders using MIG welding
No difference in FEV1,and FVC
FEF25-75 was slightly reduced in baseline measurements
Non-smokers were more symptomatic maybe due to thinner mucus blanket in throat that reduces clearance and facilitates absorption

200
Marquart, H. USA
1989 10 25 Yes Vehicles
manufac. plant 5
FEV1,FVC, FEV1/FVC%, PEF, MEF50%,
MEF25%
No/not specified
No MAG Inhalable dust (PM10)
concentration/ personal monitoring
Changes over the week were not associated with either PM concentration nor Zinc exposure measurements
An increase in welding years correlated with a decrease in lung function; FEV1 borderline significant
Kilburn, K. USA
1990 31 31 Yes Fabricating
plant 1
FEV1/FVC%, FEFR75-85% FEF25-75%,
No/not specified
Blood and urine
MMA, MIG
No
No change in lung function
Increased levels of Cr and in urine and blood
Akbar-Khanzadeh, F. UK
1993 209 318 Yes Shipyard 1 FEV1,FVC,
TL No/not
specified No
Not specified
MMA, MIG
on MS likely
Total fume concentration/
personal monitoring/
chemical profile
Paired t-test of pre/post-shift LF showed that they were all statistically significant different but welders experienced greater decrease than non-welders
Welders who did not use LEV showed maximum reduction in TL values (lung transfer factor for CO
No association between daily amounts of exposure to fume concentration found only…
…FEV1 reduction was positively correlated with FEOx concentration from welding
Donaghue, A. NZ
1994 20 40 No Engineering 1 PEF No/not
specified No
MMA, MIG & TIG
No
On Asthma
PEF changed in welders more than non-welders with a fall after 15 min
50% of welders had a decrease over 5% in first 14mins
Results suggest that welding fume leads to an immediate type of reaction similar but not as severe as occupational asthma
Fishwick, D. NZ
1997 65 140 Yes Various 1 FEV1,FVC, PEF No/not
specified No
MIG/TIG on MS, SS
No
No difference in the LF at baseline
5% cut-off in LF used
Smoking shows that FEV1 decrease was stat significant and showed that welders had a 6.5% decrease (maximum only thought!)
FEF25-75 7 hours after measurement was -2.5% and max. decrease was -9.7% both stat signf
FEV1 decrease after 15 min was associated, after correction for age, ethnicity smoking and base-line LF with no using LEV

201
Sobaszek, A. France
2000 144 367 Yes Various 1
FEV1,FVC, FEV1/FVC%PE
F, MMEF, MEF50%, MEF25%
No/not specified
No MMA, MIG
& TIG on MS, SS
No
Controls only used to assess circadian variations
SS welders had a significant decrease -1.2% in FVC and -1% in FEV1 compared to MS welding
Higher decrements due to MMA other than MIG for FEV1 FVC and PEF
Welding experience had an effect on LF decrease in relation to SS welding.
SS welders with 20 years’ experience had more LF decrease than MS welder FEV1-2.7%, PEF -3.8% and MMEF-3.5%
Sjogren, B. Sweden
2004 63 63 Yes Railroad track 1 Asthma N/A Urine MMA No Higher prevalence of asthma symptoms with increasing levels of fluoride in urine
Gube, M. Germany
2009 45 69 Yes Different industries
1
FEV1,FVC, PEF, MEF75%,
MEF50%, MEF25%, CO2
concent., and ISO measures:
Rc, Rp;
No/not specified
No MMA,
MIG, MAG & TIG
Inhalable and respirable fume (PM10 & PM2.5) concentration/
personal monitoring
Long- and short-term pulmonary effect due to welding exposure could be measured
Welding years were associated with decreased flow-volume and airway resistance
Capnovolumetry parameters indicating airway narrowing were associated with cross-shift welding fume exposure
Brand, P. Germany
2010 6 6 Yes Not specified 1
FEV1,FVC, PEF, MEF75%,
MEF50%, MEF25%
No/not specified
EBC
MMA, MIG on alloyed
and unalloyed
base metal
No
Welding led to significant increase of Cr and Ni in blood and urine particularly after MMA
Decrease in LF with FEV1 and FVC decreased after 3 h and MEF25 after 6h
MEF25 highest decrease was measured after 3h of MMAa and lowest after MMAu
Brand, P. Germany
2013 12 12 Not
specified Not specified 1
FEV1,FVC, PEF, MEF75%,
MEF50%, MEF25%
No/not specified
EBC MAG on alloyed
steel
Total fume concentration/
controlled conditions with constant fume
concentration/ chemical profile
No difference on lung function and biomarkers observed between pre- and post-shift/exposure measurements
Golbabaei, F. Iran
2013 91 116 Yes Pipelines 1 FEV1,FVC,
FEV1/FVC% FEF25-75%
No/not specified
No MMA
Total & inhalable fume (PM10)
concentration/ personal monitoring
5% cut-off in LF used
LF in welders was reduced more than in non-welders: FVC: -4% vs -3%. FEV1: -5% vs 3%; FEV1/FVC: -2% vs +0.06 FEF25-75: -4% vs -0.8%

202


![Andrea Marongiu (andrea.marongiu@unimore.it) Paolo Valentealgo.ing.unimo.it/people/andrea/SlidesPDF/Slides/15. Array statici.pdf · Tipi di dato struct array [] Riferimenti Scalari,](https://static.fdocuments.net/doc/165x107/5c663e7609d3f2d12a8bffb9/andrea-marongiu-unimoreit-paolo-valentealgoingunimoitpeopleandreaslidespdfslides15.jpg)