BUSINESS UPDATE MARCH 2021 - Chemtrade Logistics Inc.
20
1 BUSINESS UPDATE MARCH 2021 20 21
Transcript of BUSINESS UPDATE MARCH 2021 - Chemtrade Logistics Inc.

1
BUSINESS UPDATEMARCH 202120 21

2
Certain statements contained in this presentation constitute forward-looking statements within the meaning of certain securities laws, including the Securities Act (Ontario). Forward-looking statements can be generally identified by the use of words such as “anticipate”, “continue”, “estimate”, “expect”, “expected”, “intend”, “may”, “will”, “project”, “plan”, “should”, “believe” and similar expressions. Forward-looking statements in this presentation describe the expectations of Chemtrade Logistics Income Fund (“Chemtrade”) and its subsidiaries as of the date hereof. These statements involve known and unknown risks, uncertainties and other factors that may cause actual results or events to differ materially from those anticipated in such forward-looking statements for a variety of reasons, including without limitation the risks and uncertainties detailed under the “RISK FACTORS” section of Chemtrade’s latest Annual Information Form and the “RISKS AND UNCERTAINTIES” section of Chemtrade’s most recent Management’s Discussion & Analysis. Although Chemtrade believes the expectations reflected in these forward-looking statements and the assumptions upon which they are based are reasonable, no assurance can be given that actual results will be consistent with such forward-looking statements, and they should not be unduly relied upon. Except as required by law, Chemtrade does not undertake to update or revise any forward-looking statements, whether as a result of new information, future events or for any other reason. The forward-looking statements contained herein are expressly qualified in their entirety by this cautionary statement. Further information can be found in the disclosure documents filed by Chemtrade with the securities regulatory authorities, available on www.sedar.com.
One of the non-IFRS measures referred to in this presentation is Adjusted EBITDA, which is EBITDA modified to exclude only non-cash items such as unrealized foreign exchange gains and losses. For simplicity, the presentation will just refer to it as EBITDA as opposed to Adjusted EBITDA. Both these terms are fully defined in our MD&A.
CAUTION REGARDING FORWARD-LOOKING STATEMENTS

3
Operational Excellence
Maintain financial flexibility & balance sheet strength with sound capital management
Financial Prudence
Increased size, scale and diversity of earnings (acquisitions and organic growth)
1 Growth
Mitigates Commodity Risks2 Business Model
Ensures sustainable earnings through improved operations focussed on productivity improvement, assets and people3
4
4 PRONGED STRATEGY

4
WATER SOLUTIONS AND SPECIALTY CHEMICALS (WSSC)
ELECTROCHEMICALS (EC)SULPHUR PRODUCTSAND PERFORMANCE CHEMICALS (SPPC)
Approx 60% of revenue based on risk shared contracts
Wide diversity of sources of earnings
Includes specialty chemicals with distinct barriers to entry
Three sources of earnings: NA sodium chlorate SA sodium chlorate
and chlor-alkali NA chlor-alkali
BUSINESS MODEL FIT
4

5
2020 RESULTS
115.9
124.9
102.5
EBITDA
EC SPPC WSSC
C$ MILLIONSAdjusted EBITDA 265.3
Maintenance Capex 74.4Lease Expense 56.0Cash Interest 68.6Cash Taxes 7.3
Distributable Cash 59.0DCPU $0.64
5

6
2020 RESULTS
SPPC 2020 EBITDA was $35.8 million lower than 2019: Regen affected by travel restrictions and reduced driven miles (resulting
from COVID-19 Pandemic) Merchant acid affected by lower economic activity
EC 2020 EBITDA was $55.5 million lower than 2019: NE Asia caustic remained low as increased Chlorine demand HCl demand affected by reduced oil demand and lower fracking
Partially Offset by WSSC, which had a $24.6 million improvementover 2019 (Water Solutions margins expanded – stable volume,higher prices and lower costs)
6

7
2020 GUIDANCEWas Suspended in April 2020
Adjusted EBITDA $300 - $350 million 2019 actual EBITDA was $335.6 million* Major differences from 2019:
Lower caustic and HCL pricing
Vancouver biennial turnaround
Major turnaround of material refinery customer
COVID-19 impact on Regen, Merchant and Sodium Chlorate*Excluding the $40.0 million legal provision.
7

8
2020 GUIDANCEKEY ASSUMPTIONS
8
Key Assumptions – Electrochemicals (EC) Segment Original Actual
Approximate North American MECU production volume ~190KT ~140KT
2020 average IHS NE Asia Caustic price index being lower per tonne than the 2019 average; and US$15 US$80
North American production volume of sodium chlorate ~420KT ~375KT

9
2021 GUIDANCEKEY ASSUMPTIONS
9
Key Assumptions – Electrochemicals (EC) Segment 2021 Assumption
2020 Actuals
Approximate North American MECU production volume ~175K ~140K
2021 average IHS NE Asia Caustic price index being lower per tonne than the 2020 average; and US$40 N/A
North American production volume of sodium chlorate ~375KT ~375KT
None of the principal manufacturing facilities (as set out in Chemtrade’s AIF) incurs significant unplanned downtime

10
Maintenance Capex - $80-$85 million
Lease Expense - $55-$60 million
Cash Interest - $70-$75 million
Cash Taxes - $5-$10 million
2021 GUIDANCE
11
LONG-TERM OUTLOOK20 21

12
LONG-TERM OUTLOOK
12
2020 was a challenging year on all fronts Priority was to operate safely as we are an essential service Some parts of the business were significantly affected: Regen – reduced driving, but started to recover as year progressed HCl demand from reduced fracking Sodium chlorate – reduced demand due to printing paper Asia – where downstream chlorine products demand was strong, but
caustic demand was not as strong, so depressed caustic pricing Generally reduced economic activity
H1 2021 looks weak, but H2 should start to improve Well positioned for post-COVID-19 recovery

13
LONG-TERM OUTLOOKSPPC
13
Merchant Acid: One of the widely used chemicals and expected to recover: Industrial activity recovery Base metals and fertilizer
Regen Acid: As travel restrictions are lifted, expect recovery in refinery utilization rates and
miles driven Ultrapure Sulphuric Acid: Short-term headwinds due to a shift in customer mix Expect to regain lost volume in 18-24 months Long term fundamentals are very strong All major semi-conductors manufactures have announced US expansions New US administration focused on increasing chip manufacturing in the US US Ultrapure acid demand exceeds domestic supply

14
LONG-TERM OUTLOOKWATER PRODUCTS
14
Water demand is stable
Margins should remain stable Short-term higher raw materials, but offset with higher prices
Organic growth opportunities: New applications Specialized products
Could consider smaller acquisitions at some point in the future

15
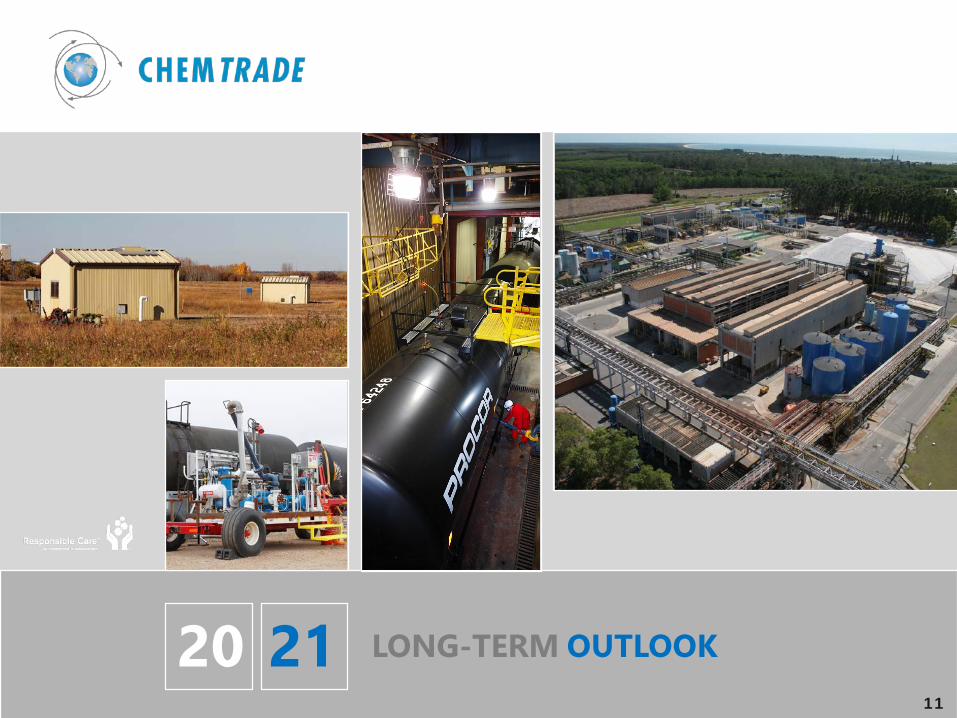
Caustic Soda: A Key Improvement Driver We believe the ‘trough’ is behind us and market
fundamentals will improve for next several years
Market analysts are bullish mid to long-term
Demand continues to grow, minimal new supply
Movements in Taiwan contract price are indicative of movements in NE Asia spot pricing
EC SEGMENTCAUSTIC SODA
16
LONG TERM OUTLOOKCAUSTIC SODA
Source – IHS Markit – Jan 2021
16
200
300
400
500
600
700
800
2019 2020 2021 2022 2023 2024 2025
Taiwan Forecast Delivered Price - Caustic Soda (US$/DMT)
Jan-21 Jan-20

17
EC SEGMENTHCl/CHLORINE & SODIUM CHLORATE
17
HCl: Demand and pricing should improve from extremely weak in 2020 as oil
recovers and additional fracking activity picks up – particularly Western Canada
Chlorine: Demand and pricing should improve Strong demand for PVC and bleach and there has been capacity
rationalization in the US Sodium Chlorate: As schools and offices open, printing paper and demand for sodium
chlorate should recover Sodium Chlorate industry is concentrated and excess capacity tends to
be rationalized over the longer term to balance with demand

18
EC SEGMENTHYDROGEN
18
Sodium Chlorate and to a lesser extent, chlor-alkali manufacturing process generates hydrogen
Our manufacturing sites use hydro-electric power – so we generate Green Hydrogen
Announced a deal for one of our small Chlorate Plants in Prince George, BC – limited returns for first five years and then more significant
Big opportunity for the Brandon, Manitoba facility as that’s five times the size of the Prince George facility
Important from an ESG perspective and financial return

19
CONCLUSION
19
We will improve our Balance Sheet and deliver future growth in earnings driven by: Market / COVID-19 Recovery Targeted Divestitures
Organic growth, until ready for acquisitions: Ultrapure acid Water Hydrogen
Focused efforts on Productivity, Reliability, and Cost Control

20
CONCLUDING REMARKS