Business Results for Nine Months (April-December, 2017) of ... · Construction, Mining & Utility...
36
1 January 31, 2018 Business Results for Nine Months (April-December, 2017) of FY2017 【Telephone conference】 Executive Vice President and CFO Senior Executive Officer and General Manager of Business Coordination Department Mikio Fujitsuka Yasuhiro Inagaki Presented by
Transcript of Business Results for Nine Months (April-December, 2017) of ... · Construction, Mining & Utility...

1
January 31, 2018
Business Results for Nine Months (April-December, 2017) of FY2017
【Telephone conference】
Executive Vice President and CFOSenior Executive Officer andGeneral Manager of Business Coordination Department
Mikio FujitsukaYasuhiro Inagaki
Presented by

2
Projection for FY2017 ending March 31, 2018: Outline and Segment Sales and ProfitConstruction, Mining & Utility Equipment: Demand for 7 Major Products and Projection (Global and By Region) Construction, Mining & Utility Equipment: Demand for and Sales of Mining Equipment and ProjectionsConstruction, Mining & Utility Equipment: Sales of Parts and Projection
Ⅰ. Business Results for Nine Months (April – December, 2017) of FY2017<PP4-14>
Ⅱ. Outlook of FY2017 Business Results <PP16-25>
PP4-6:PP7-8:PP9-11:
P12: P13:P14:
Contents
Appendix <PP27-34>PP27-31:PP32-34:
PP16:PP17-22:PP23-24:P25:
Highlights of Business Results for the Third Quarter (Oct- Dec, 2017)Highlights of Business Results for Nine Months (Apr- Dec, 2017)Construction, Mining & Utility Equipment: Results for Nine Months (Apr- Dec, 2017)KMC’s Business Results for Nine Months (Apr- Dec, 2017)*Retail Finance: Assets and Revenues for Nine Months (Apr- Dec, 2017)Industrial Machinery & Others: Results for Nine Months (Apr- Dec, 2017)Consolidated Balance Sheets
Quarterly ResultsBook-to-Bill Ratio [Orders Received / Sales (6 Months)]
*KMC stands for Komatsu Mining Corp

3
Ⅰ. Business Results for Nine Months(April – December, 2017) of FY2017
NoteOn April 5, 2017, we completed the acquisition of Joy Global Inc. On April 19, Joy Global Inc. changed its trade name to Komatsu Mining Corp. (hereafter “KMC”). From the first 3-month period of FY2017, our consolidated business results include those of KMC as a consolidated subsidiary.

4
Oct.-Dec.,2016 Oct.-Dec.,2017 Changes
Komatsuconventional
KMC Increase(decrease)
Change %
Net sales 430.5 646.8 561.4 85.3 +216.2 +50.2%Segment profit (loss) 43.6 87.1 82.4 4.6 +43.5 +99.9%Other operating income (expenses) (0.7) (11.5) (11.7) 0.1 (10.8) -Operating income (loss) 42.8 75.5 70.7 4.8 +32.6 +76.1%
Profit ratio (loss ratio) 10.0% 11.7% 12.6% 5.7% +1.7pts. -Other income (expenses) 2.2 (4.3) (6.6) -Income before income taxes 45.1 71.2 +26.0 +57.7%Net income 30.8 53.3 +22.4 +73.0%
¥106.9/USD¥116.7/EUR¥15.7/RMB
¥113.0/USD¥133.2/EUR¥17.0/RMB
Highlights of Business Results for Third Quarter (Oct – Dec, 2017) of FY2017
Billions of yen
・Consolidated net sales increased by 50.2% from the corresponding period a year ago, to JPY646.8 billion.・Operating income advanced by 76.1% to JPY75.5 billion. Operating income ratio increased by 1.7 points to 11.7%.・Net income attributable to Komatsu Ltd. improved by 73.0% to JPY53.3 billion.
Depreciation after PPA (3.6)
Start-up expenses, etc. (0.4)
Total (4.1)
*2
*1
Note: PPA stands for Purchase Price Allocation.It is an accounting process of valuating and allocating acquired assets and liabilities to fair prices.
*2
*3
Notes 1) Figures represent those which KMC’s business results are excluded.
2) KMC’s segment and operating losses include temporary expenses in the table on the right.
3) Upon adoption of ASC 810, “Net income” is equivalent to “Net income attributable to Komatsu Ltd.”
*

5
Review of three business segments■ Construction, Mining & Utility Equipment:
Both sales and profit expanded, supported by advanced sales, especially in North America, China, Asia and Oceania, as well as the benefits of the new addition of KMC to consolidated accounting.
■ Retail Finance:Both revenues and profit increased, mainly reflecting increased assets in North America.
■ Industrial Machinery & OthersSales remained about flat from the corresponding period a year ago. Profit expanded, mainly supported by increased sales of machine tools to the automobile manufacturing industry.
Oct.-Dec.,2016 Oct.-Dec.,2017Changes
Komatsuconventional KMC Increase
(decrease) % Change
Net sales 430.5 646.8 561.4 85.3 +216.2 +50.2%
Construction, mining & utility equipmentRetail financeIndustrial machinery & others
[376.6] 379.0[12.0] 12.6[41.9] 42.2
[591.7] 594.5[13.0] 14.7[41.9] 42.3
[506.4] 509.1[13.0] 14.7[41.9] 42.3
[85.3] 85.3--
[+215.1] +215.4[+1.0] +2.0[(0.0)] +0.0
[+57.1%] +56.8%[+8.9%] +16.6%[(0.0)%] +0.2%
Elimination (3.3) (4.7) (4.7) - (1.3) -
Segment profit 43.6 87.1 82.4 4.6 +43.5 +99.9%
Construction, mining & utility equipmentRetail financeIndustrial machinery & others
38.92.52.3
80.13.04.3
75.53.04.3
4.6--
+41.2+0.4+1.9
+106.0%+19.3%+79.9%
Corporate & elimination (0.2) (0.4) (0.4) - (0.1) -
13.5% 20.6%
13.5%
10.3% 20.2%
10.1%
5.7% 10.2%
Segment Sales and Profit for Third Quarter (Oct – Dec, 2017) of FY2017
Billions of yen
% [ ]: Sales after elimination of inter-segment transactions: Profit ratio
・Construction, Mining & Utility Equipment: Sales advanced by 56.8% from the corresponding period a year ago, to JPY594.5 billion.Segment profit expanded by 106.0% to JPY80.1 billion. Segment profit ratio improved by 3.2 points to 13.5%.
・Retail Finance: Revenues increased by 16.6% to JPY14.7 billion. Segment profit improved by 19.3% to JPY3.0 billion. ・Industrial Machinery & Others: Sales amounted toJPY42.3 billion, remaining about flat from the corresponding period a year ago. Segment
profit expanded by 79.9% to JPY4.3 billion.
14.8%
14.7%
20.6%10.2%
5.5%
5.5%

6
Japan Japan Japan
North America
North America
North America
Europe
Europe
Europe
Latin America
Latin America
Latin America
CIS
CIS
CIS
China
China
China
Asia
Asia
Asia
Oceania
Oceania
Oceania
Middle East
Middle East
Middle East
Africa
Africa
Africa
0
50
100
150
200
250
300
350
400
450
500
550
600
Oct.-Dec., 2016 Oct.-Dec., 2017(Conventional)
Oct.-Dec., 2017(including KMC)
Billions of yen Japan North America Europe Latin
America CIS China Asia Oceania Middle East Africa Total
Oct.-Dec.,2016 79.1 80.2 26.2 51.0 18.2 21.7 50.5 25.8 6.9 16.5 376.6Komatsu
Conventional 78.6 117.0 35.6 61.9 24.2 38.1 75.8 41.4 9.4 23.7 506.4Increase
(decrease) (0.4) +36.8 +9.4 +10.8 +6.0 +16.4 +25.3 +15.5 +2.5 +7.1 +129.7
KMC 0.0 35.0 4.0 20.1 1.9 5.7 1.1 10.0 0.0 7.1 85.3
Oct.-Dec.,2017 78.7 152.1 39.7 82.0 26.2 43.8 76.9 51.5 9.5 30.9 591.7
・Sales to outside customers advanced by 57.1% from the corresponding period a year ago, to JPY591.7 billion. When KMC’s sales areexcluded, sales increased by 34.5% to JPY506.4 billion.
・Excluding those of KMC, sales improved in all regions except for Japan. Sales expanded sharply, especially in North America, China, Asia and Oceania.
・The ratio of sales in Strategic Markets increased to 54% of total sales. (The ratio of Strategic Market was also 54%, when KMC’s sales were included.)
506.4
376.6
PlusMinus
Oct.-Dec.,2017
Oct.-Dec.,2016
YoY Comparison (Conventional)
Traditional Markets Strategic Markets
376.6
21%
21%
7%14%
13%
7%2%4%
23%
16%
Strategic Markets51%
Billions of yen
Construction, Mining & Utility Equipment : Sales by Region (To Outside Customers) for Third Quarter (Oct – Dec, 2017) of FY2017
7%
14%
12%
TraditionalMarkets46%
Strategic Markets54%
Strategic Markets54%
506.4
591.7
6%
13%
15%
13%
9%
7%
26%
(Conventional)
5%
5%2%8%
8%5%
4%7%
2%5%
TraditionalMarkets49%
TraditionalMarkets46%
+129.7[+34.5%]
(0.4)〔(0.5)%〕
+36.8〔+45.9%〕
+9.4〔+35.9%〕
+10.8〔+21.2%〕
+6.0〔+33.4%〕
+16.4〔+75.4%〕
+25.3〔+50.1%〕
+15.5〔+60.3%〕
+2.5〔+37.2%〕
+7.1〔+43.3%〕

7
Apr.-Dec.,2016 Apr.-Dec.,2017 Y-O-Y
Komatsuconventional
KMC Increase(decrease)
Change %
Net sales 1,226.7 1,805.8 1,569.4 236.3 +579.0 +47.2 %Segment profit (loss) 107.8 200.8 216.0 (15.2) +93.0 +86.3 %Other operating income (expenses) (0.8) (12.6) (12.7) 0.0 (11.8) -Operating income (loss) 107.0 188.1 203.3 (15.1) +81.1 +75.8%Profit ratio (loss ratio) 8.7% 10.4% 13.0% (6.4)% +1.7pts. -Other income (expenses) (3.7) 27.1 +30.9 -Income before income taxes 103.2 215.3 +112.0 +108.5%Net income *3 68.3 155.0 +86.7 +126.9%
Billions of yen
Highlights of Business Results for Nine Months (Apr – Dec, 2017) of FY2017
¥111.7/USD¥128.2/EUR¥16.6/RMB
¥106.5/USD¥118.5/EUR¥16.0/RMB
*3 Upon adoption of ASC 810, “Net income” is equivalent to “Net income attributable to Komatsu Ltd.
*2
Depreciation after PPA (36.7)
Start-up cost etc. (4.1)
Total (40.8)
*1 Figures represent those which KMC’s business results are excluded.
*2 KMC's segment loss and operating loss include the effects of temporary expenses shown on the right.
Billions of yen
*1
*2
・Consolidated net sales increased by 47.2% from the corresponding period a year ago, to JPY1,805.8 billion.・Operating income advanced by 75.8% to JPY188.1 billion. Operating income ratio was 10.4%, up 1.7 percentage points.・Net income attributable to Komatsu Ltd. expanded by 126.9% to JPY155.0 billion.
Note: PPA stands for Purchase Price Allocation.It is an accounting process of valuating and allocating acquired assets and liabilities to fair prices.

8
Review of three business segments■ Construction, Mining & Utility Equipment:
Sales expanded, supported by increased sales of construction equipment, centering on North America, China and Asia as well as the benefits of the new addition of KMC to consolidated accounting. With respect to profits, while KMC recorded an operating loss, impacted by its temporary expenses, Komatsu (excluding KMC) expanded profit. As a result, segment profit increased sharply as a whole from the corresponding period a year ago.
■ Retail Finance:Revenues increased, mainly supported by increased assets in North America. Segment profit also improved, reflecting no more adverse effects of allowance for doubtful accounts recorded in China for the corresponding period a year ago.
■ Industrial Machinery & Others:Sales remained about flat from corresponding period a year ago. Profit improved, supported by increased sales of machine tools to the automobile manufacturing industry.
Apr.-Dec.,2016 Apr.-Dec.,2017 Changes
Komatsuconventional KMC Increase
(decrease) % Change
Net sales 1,226.7 1,805.8 1,569.4 236.3 +579.0 +47.2%
Construction, mining & utility equipmentRetail financeIndustrial machinery & others
[1,071.9] 1,077.7[34.3] 36.1
[120.4] 121.2
[1,648.6] 1,658.9[36.7] 45.9
[120.4] 121.4
[1,412.3] 1,422.6[36.7] 45.9[120.4] 121.4
[236.3] 236.3--
[+576.7] +581.2[+2.4] +9.8[(0.0)] +0.2
[+53.8%] +53.9%[+7.2%] +27.3%[(0.1)%] +0.2%
Elimination (8.3) (20.6) (20.6) - (12.2) -
Segment profit 107.8 200.8 216.0 (15.2) +93.0 +86.3%
Construction, mining & utility equipmentRetail financeIndustrial machinery & others
96.56.76.4
183.98.99.1
199.18.99.1
(15.2)--
+87.4+2.1+2.6
+90.5%+32.3%+41.7%
Corporate & elimination (1.9) (1.1) (1.1) - +0.7 -
11.1% 19.5%
11.1%
9.0% 18.7%
8.8%
5.3% 7.5%
Segment Sales and Profits for Nine Months (Apr-Dec, 2017) of FY2017
Billions of yen
% [ ]: Sales after elimination of inter-segment transactions: Profit ratio
・Construction, Mining & Utility Equipment: Sales advanced by 53.9% from the corresponding period a year ago, to JPY1,658.9 billion. Segment profit expanded by 90.5% to JPY183.9 billion. Segment profit ratio improved by 2.1 points to 11.1%.
・Retail Finance: Revenues advanced by 27.3% to JPY45.9 billion. Segment profit expanded by 32.3% to JPY8.9 billion. ・Industrial Machinery & Others: Sales amounted to JPY121.4 billion, remaining about flat from the corresponding period a year ago. Segment
profit improved by 41.7% to JPY9.1 billion.
14.0%
13.8%
19.5%7.5%
(6.4)%
(6.4)%

9
Japan Japan Japan
North America
North America
North America
Europe
Europe
Europe
Latin America
Latin America
Latin America
CIS
CIS
CIS
China
China
China
Asia
Asia
Asia
Oceania
Oceania
Oceania
Middle East
Middle East
Middle East
Africa
Africa
Africa
0
100
200
300
400
500
600
700
800
900
1,000
1,100
1,200
1,300
1,400
1,500
1,600
1,700
1,800
Apr.-Dec., 2016 Apr.-Dec., 2017(Conventional)
Apr.-Dec., 2017(including KMC)
Billions of yen Japan North America Europe Latin
America CIS China Asia Oceania Middle East Africa Total
Apr.-Dec.,2016 216.5 235.7 91.5 146.1 48.5 57.9 131.0 74.0 23.2 47.0 1,071.9Komatsu
Conventional 235.2 300.5 113.2 177.6 75.8 101.7 207.1 105.9 26.9 67.9 1,412.3Increase
(decrease) +18.7 +64.7 +21.6 +31.5 +27.2 +43.8 +76.0 +31.8 +3.6 +20.9 +340.4
KMC 0.0 99.0 11.1 54.4 3.7 12.1 2.9 30.7 0.1 21.9 236.3
Apr.-Dec.,2017 235.2 399.6 124.4 232.1 79.5 113.9 210.0 136.6 27.0 89.9 1,648.6
・Sales to outside customers advanced by 53.8% from the corresponding period a year ago, to JPY1,648.6 billion. When KMC’s sales are excluded, sales increased by 31.8% to JPY1,412.3 billion.
・Excluding those of KMC, sales improved in all regions. Sales expanded sharply, especially in North America, China and Asia. ・The ratio of sales in Strategic Markets increased to 54% of total sales. (The ratio of Strategic Market was also 54%, when KMC’s sales were
included.)
1,412.3
1,071.9
PlusMinus
Apr.-Dec.,2017
Apr.-Dec.,2016
YoY Comparison (Conventional)
Traditional Markets Strategic Markets
1,071.9
20%
22%
9%
14%
12%
7%2%4%
21%
17%
7%
5%
TraditionalMarkets51%
Strategic Markets49%
Billions of yen
Construction, Mining & Utility Equipment : Sales by Region (To Outside Customers) for Nine Months (Apr-Dec, 2017) of FY2017
8%
2%
13%
14%
13%
TraditionalMarkets46%
Strategic Markets54%
Strategic Markets54%
1,412.3
1,648.6
14%
15%
8%
5%
8%
8%
24%
(Conventional)
5%5%
7%
5%
2%5%
TraditionalMarkets46%
+340.4[+31.8%]
+18.7〔+8.7%〕
+64.7〔+27.5%〕
+21.6〔+23.7%〕
+31.5〔+21.6%〕
+27.2〔+56.3 %〕
+43.8〔+75.8%〕
+76.0〔+58.0%〕
+31.8〔+43.0%〕
+3.6〔+15.6%〕
+20.9〔+44.5%〕
10
96.5
183.9
020406080
100120140160180200
Apr.-Dec.,2016
Apr.-Dec.,2017
1,077.7
1,658.9
300
500
700
900
1,100
1,300
1,500
1,700
Apr.-Dec.,2016
Apr.-Dec.,2017
+581.2 billion yen
11.1%9.0%
+87.4 billion yen
¥106.5/USD¥118.5/EUR¥16.0/RMB
¥111.7/USD¥128.2/EUR¥16.6/RMB
SalesApr.-Dec., 2016 vs. Apr.-Dec., 2017
Segment profitApr.-Dec., 2016 vs. Apr.-Dec., 2017
Billions of yen
Billions of yen
Positive factorsNegative factor
Positive factorsNegative factor
Volume+265.2
Selling price+5.6
Foreign exchange
rate+66.9
Volume, product mix,
etc. +95.2
Fixed costs(1.5)
Selling price+5.6
Foreign exchange
rate+3.0
Segment profit ratio
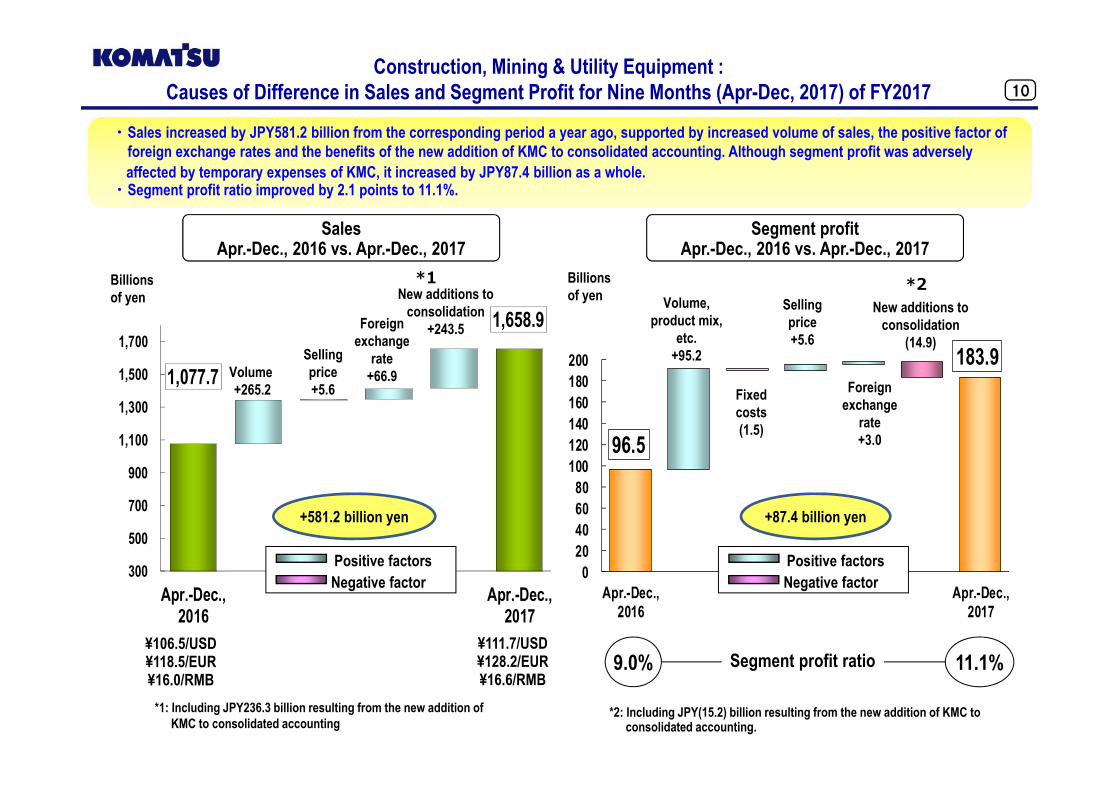
・Sales increased by JPY581.2 billion from the corresponding period a year ago, supported by increased volume of sales, the positive factor of foreign exchange rates and the benefits of the new addition of KMC to consolidated accounting. Although segment profit was adversely affected by temporary expenses of KMC, it increased by JPY87.4 billion as a whole.
・Segment profit ratio improved by 2.1 points to 11.1%.
*1 *2
*1: Including JPY236.3 billion resulting from the new addition of KMC to consolidated accounting
Construction, Mining & Utility Equipment : Causes of Difference in Sales and Segment Profit for Nine Months (Apr-Dec, 2017) of FY2017
New additions to consolidation
+243.5
*2: Including JPY(15.2) billion resulting from the new addition of KMC to consolidated accounting.
New additions to consolidation
(14.9)

11
North America
42%
Europe5%
Latin America
23%CIS2%
China5%
Asia1%
Oceania13%
Africa9%
49
%51
%露天掘り
坑内掘り785 936 665 764 387 415
1,838 2,117 5.4%
10.9%5.4%
10.9%
-50.0%0500
1,0001,5002,0002,5003,0003,500
Apr-Dec
FY16
Apr-Dec
FY17
Apr-Dec
FY16
Apr-Dec
FY17
Equipment
Parts
Service etc.
Operating income
ratio(excluding
temporary expense)83.6
70.885.4
104.4
41.346.4
Construction, Mining & Utility Equipment:KMC’s Business Results for Nine Months (Apr-Dec, 2017) of FY2017
Sales & Operating Income Ratio
・Sales increased by 20.7% from the corresponding period a year ago, to JPY236.3 billion.・Excluding temporary expenses, operating income was JPY25.6 billion. When the temporary expenses of JPY40.8 billion were included, KMC
recorded an operating loss of JPY15.1 billion.
Apr.-Dec.,2016 (Reference)
¥106.5/USD
Apr.-Dec.,2017
¥111.7/USD
Changes (Reference)
Increase(decrease) % Change
Net sales 195.8 236.3 +40.4 +20.7%
Equipment 41.3 46.4 +5.1 +12.4%
Parts 70.8 85.4 +14.6 +20.6%
Service etc. 83.6 104.4 +20.8 +24.9%
Operating income (loss) <excluding Temporary Expenses> 10.4 25.6 +15.2 +145.6%
Temporary Expenses (negative figure) (9.3) (40.8) (31.4) -
Depreciation after PPA - (36.7) (36.7) -
Start-up expenses etc. (9.3) (4.1) +5.2 -
Operating income (loss) <including Temporary Expenses> 1.0 (15.1) (16.2) -
Billions of JPY
0.6%
5.4% 10.9%
(6.4)%
Sales by regions(To Outside Customers)Apr.-Dec.,2017
Billions of yen
Millions of USD
Sales by segments
Apr.-Dec.,2016
236.3Billions of yen
*2 *3
*1
* 1: Figures for the corresponding period a year ago (April - Dec 2016) are rearranged for Komatsu’s fiscal year for your reference.* 2: PPA stands for Purchase Price Allocation. It is an accounting process of valuating and allocating acquired assets and liabilities to fair prices. * 3: Including JPY(25.8) billion for inventories after PPA. KMC wrote off all inventories in the first half period.
KMC
195.8236.3
Apr.-Dec.,2017
50%50%
Surface
Underground

12
36.1
45.9
6.7 8.9
05
10152025303540455055
SalesSegment profit
Japan JapanEurope EuropeChina ChinaOceania OceaniaOthers Others
North America
North America
0
100
200
300
400
500
600
700
800
¥112.2/USD¥119.8/EUR¥16.3/RMB
746.5
Billions of yen Billions of yen
Mar 31, 2017 Dec 31, 2017
Billions of yen 2017/3E 2017/12E Changes
Interest-bearing debt 506.0 566.7 +60.7
Interest-bearing debt, net 501.2 559.7 +58.4
Net D/E ratio 3.65 3.77 +0.12pts.
・Assets increased, mainly due to increased financing contracts, centering on North America.・Segment profit improved, mainly supported by no more adverse effects of allowance for doubtful accounts
recorded in China for the corresponding period a year ago.
¥113.0/USD¥134.9/EUR¥17.3/RMB
¥106.5/USD¥118.5/EUR¥16.0/RMB
¥111.7/USD¥128.2/EUR¥16.6/RMB
RevenuesApr.-Dec., 2016 vs. Apr.-Dec., 2017
AssetsMar 31, 2017 vs. Dec 31, 2017
Retail Finance: Assets, Revenues and Segment Profit for Nine Months (Apr-Dec, 2017) of FY2017
671.5
Apr.-Dec., 2017Apr.-Dec., 2016

13
・Sales remained about flat at JPY121.4 billion from the corresponding period a year ago.・ Segment profit increased, mainly due to increased sales of machine tools to the automobile manufacturing industry. Segment
profit ratio was 7.5%.
(%)
Apr.-Dec., 2016 Apr.-Dec., 2017Changes
Increase(decrease) % change
Komatsu Industries Corp., etc.[total of press and sheet-metal machines] 36.5 32.7 (3.7) (10.3)%
Komatsu NTC Ltd.[represented by wire saws]
33.5[8.6]
43.2[4.8]
+9.7[(3.7)]
+29.1%[(43.6)%]
Gigaphoton 23.3 27.2 +3.8 +16.3%
Others 27.8 18.3 (9.5) (34.4)%
Total 121.2 121.4 +0.2 +0.2%
Industrial Machinery & Others: Sales and Segment Profit for Nine Months (Apr-Dec, 2017) of FY2017
Sales Segment profitBillions of yen
Billions of yen
Breakdown of sales
Billions of yen
:Segment profit ratio
121.2121.4
0
50
100
150
Apr.-Dec., 2016 Apr.-Dec., 2017
6.49.1
7.5% 5.3%
-15-10-50510
0
5
10
15
Apr.-Dec., 2016 Apr.-Dec., 2017

14Consolidated Balance Sheets・Total assets grew by JPY803.5 billion from the previous fiscal year-end, affected by the new addition of KMC to consolidated accounting and
increased inventories. ・Interest-bearing debt increased by JPY476.0 billion to JPY884.7 billion, mainly affected by the acquisition of KMC.
Komatsu Ltd. shareholders’ equity ratio declined by 10.7 points to 48.7%.
Mar. 31, 2017 Dec. 31, 2017Increase
(decrease)
Cash & deposits (incl. time deposits) [a] 122.1 167.7 +45.6Accounts receivable (incl. long-term trade receivables) 933.2 1,139.0 +205.8Inventories 533.8 757.4 +223.5Tangible fixed assets 679.0 767.8 +88.8Other assets 388.1 627.8 +239.6Total assets 2,656.4 3,459.9 +803.5Accounts payable 240.1 303.3 +63.2Interest-bearing debt [b] 408.7 884.7 +476.0Other liabilities 359.1 505.3 +146.2Total liabilities 1,007.9 1,693.4 +685.4[Shareholders’ equity ratio] [59.4%] [48.7%] [ (10.7)pts. ]Komatsu Ltd. shareholders’ equity 1,576.6 1,684.9 +108.2Non-controlling interests 71.8 81.5 +9.7Liabilities & Equity 2,656.4 3,459.9 +803.5
Interest-bearing debt, net [b-a] 286.5 716.4 +430.4
Net D/E ratio 0.18 0.43
Dec 31, 2017Affect of new
addition of KMC to consolidation
23.585.8
114.484.8
278.6587.231.9
128.3108.0268.2
Billions of yen¥112.2/USD¥119.8/EUR¥16.3/RMB
¥113.0/USD¥134.9/EUR¥ 17.3/RMB

15
Ⅱ. Outlook of FY2017 Business Results

16
FY2016 Results(A)
FY2017 Projection
(B) (Current)
FY2017 Projection(C) (Initial)
Changes (B-A)
Komatsuconventional
KMC Komatsuconventional
KMC Increase(decrease)
Change %
Net sales 1,802.9 2,328.0 2,037.0 291.0 2,135.0 1,880.0 256.0 +525.0 +29.1%Segment profit (loss) 176.5 236.0 256.0 (20.0) 164.0 203.0 (39.0) +59.4 +33.7%Other operating income (expenses) (2.4) (20.0) (20.0) - (8.0) (8.0) - (17.5) -
Operating income (loss) 174.0 216.0 236.0 (20.0) 156.0 195.0 (39.0) +41.9 +24.1%
Profit ratio (loss ratio) 9.7% 9.3% 11.6% (6.9)% 7.3% 10.4% (15.2)% (0.4)pts. -Other income (expenses) (7.6) 21.0 (15.0) +28.6 -
Income before income taxes 166.4 237.0 141.0 +70.5 +42.4%
Net income *3 113.3 159.0 92.0 +45.6 +40.2%
Billions of yen
ROE 7.3% 10.1% 5.9% +2.8pts.
Outline of Projection for FY2017
¥108.6/USD¥119.3/EUR¥16.2/RMB
Cash dividends per share 58yen 72yen 58yen +14yen
Consolidated payout ratio 48.2% 42.7% 59.5%
・For the nine-month period of FY2017, consolidated net sales and profits are better than our projection of October 2017, and we believe this condition will continue in the fourth quarter. However, we are not changing the projection for full-year business results, as we consider such factors as foreign exchange rates and the post-Chinese New Year demand.
(See below for the projection of October.)
*2
FY2017 Projection(Current)
FY2017 Projection(Initial)
Depreciation after PPA * (40.0) (39.0)
Start-up expenses, etc. (6.0) (9.0)
Total (46.0) (48.0)
Billions of yen
*1
*2
Note: PPA stands for Purchase Price Allocation.It is an accounting process of valuating and allocating acquired assets and liabilities to fair prices.
Notes 1) Figures represent those which KMC’s business results are excluded
2) KMC’s segment and operating losses include temporary expenses in the table on the right.
3) Upon adoption of ASC 810, “Net income” is equivalent to “Net income attributable to Komatsu Ltd.”
¥105.0/USD¥115.0/EUR¥15.0/RMB
¥108.0/USD¥124.4/EUR¥16.0/RMB *1
*2 *2

17
+13%+15%
-20%-20%
+45%
+5%
-7%
+3%
-9% -14%
+4%
-60%
-40%
-20%
0%
20%
40%
60%
0
100,000
200,000
300,000
400,000
500,000
600,000
FY06 FY07 FY08 FY09 FY10 FY11 FY12 FY13 FY14 FY15 FY16 FY17 FY17
Japan N.AmericaEurope ChinaOthers Y-O-Y growth rate
-3%+2%
+8%+7%
-5%
-4%-9%-19%-16% -18%-11%
-8%
-7% -1%
+3%
+24%+27%
+28%
+27%
-180%
-150%
-120%
-90%
-60%
-30%
0%
30%
60%
90%
120%
0
30,000
60,000
90,000
120,000
150,000
FY13/1QFY13/2QFY13/3QFY13/4QFY14/1QFY14/2QFY14/3QFY14/4QFY15/1QFY15/2QFY15/3QFY15/4QFY16/1QFY16/2QFY16/3QFY16/4QFY17/1QFY17/2QFY17/3Q
Japan N.AmericaEurope ChinaOthers Y-O-Y growth rate
100 80
64
9297
90
93
8472
Quarterly demand for 7 major productsAnnual demand for 7 major productsUnits
UnitsGrowth rate Growth rate
Note: Estimated by Komatsu
FY16: +4%FY17:+8%〜+13% (Projection of Oct. 2017)FY17:+/-0%〜+5% (Initial Projection)
:FY07=100Index
・In the third quarter and nine-month period, demand increased by 27% each from the corresponding period a year ago.・Quarterly demand has been increasing year on year . We anticipate that this trend will continue in North America and other regions
in the fourth quarter. With respect to full-year demand, we are not changing our projection of October last year.
76
Construction, Mining & Utility Equipment: Actual and Projected Demand for 7 Major ProductsKomatsu (Conventional)
3Q: +27%Apr.-Dec: +27%
Projection(Initial)(As of Oct.2017)

18
-16,000
-12,000
-8,000
-4,000
0
4,000
8,000
12,000
16,000
-100%
-75%
-50%
-25%
0%
25%
50%
75%
100%
FY13/1Q
2Q 3Q 4Q FY14/1Q
2Q 3Q 4Q FY15/1Q
2Q 3Q 4Q FY16/1Q
2Q 3Q 4Q FY17/1Q
2Q 3Q
Demand (units) Y-o-Y change (%)
0
4,000
8,000
12,000
FY13/1Q2Q 3Q 4Q FY14/1Q2Q 3Q 4Q FY15/1Q2Q 3Q 4Q FY16/1Q2Q 3Q 4Q FY17/1Q2Q 3Q
Rental companiesRegular customers
100000
80000
60000
40000
20000
0
20000
40000
60000
80000
0
10
20
30
40
50
60
70
80
90
100
FY98
FY99
FY00
FY01
FY02
FY03
FY04
FY05
FY06
FY07
FY08
FY09
FY10
FY11
FY12
FY13
FY14
FY15
FY16
FY17
⺠間⾮住宅
⺠間住宅
政府
・For the third quarter period of FY2017, demand decreased by 3% from the corresponding period a year ago . ・Demand for new equipment declined, mainly due to the reactionary drop of pre-buy demand triggered by Japanese emission controls
(effective September 2017).
104
:FY07/3Q=100Index
+3%
+3%
Demand for new equipment (7 major products) and construction investment
Construction investmentTrillion of yen
Demand for new equipment/Export of used equipment (Units)
Exports of used equipment
Demand for new equipment
Government constructionPrivate-sector non-residential
[Sources]Construction investment by the Ministry of Land, Infrastructure, Transport & Tourism, and Research Institute of Construction and Economy Demand for 7 major products and No. of exported used equipment estimated by Komatsu
Quarterly demand for 7 major products
Quarterly demand for hydraulic excavators (Rental & regular uses)
Y-O-Y growth rate
↓
Rental
Regular
Y-O-Ygrowth rate Units
Units
82 7990128
Projection
Private-sector residential
Construction, Mining & Utility Equipment : Demand in Major Markets (1) JapanKomatsu (Conventional)
FY16: -4%FY17:+/-0%〜+5% (Projection of Oct. 2017)FY17:+/-0%〜+5% (Initial Projection)
3Q: -3%Apr.-Dec: +20%

19
0%
20%
40%
60%
80%
100%FY07
FY08
FY09
FY10
FY11
FY12
FY13
FY14
FY15
FY16
FY16/4-12
FY17/4-12
Rental-distributor(DORF)
Rental-Regular
Mining & energy Road Construction Others
-30,000
-20,000
-10,000
0
10,000
20,000
30,000
-60%
-40%
-20%
0%
20%
40%
60%
FY13/1Q
2Q 3Q 4Q FY14/1Q
2Q 3Q 4Q FY15/1Q
2Q 3Q 4Q FY16/1Q
2Q 3Q 4Q FY17/1Q
2Q 3Q
Demand (units) Y-o-Y change (%)
0
20,000
40,000
60,000
80,000
FY04
FY05
FY06
FY07
FY08
FY09
FY10
FY11
FY12
FY13
FY14
FY15
FY16
FY17
FY17
・In the third quarter period of FY2017, demand increased by 24% from the corresponding period a year ago.・ In the United States, demand remained steady, centering on the infrastructure development and energy-related sectors. In the rental industry,
demand increased after having been sluggish. ・ Quarterly demand has been increasing year-on-year. We anticipate that this trend will continue in the fourth quarter.
99 112 107 93
Index :FY07/3Q=100
114
+12%
+13%
+27%
[Source]: Demand for 7 major products estimated by Komatsu
USACanada
Demand for 7 major products(Units)
Demand for 7 major products and US housing starts
Housing starts
Housing starts in ten thousands
Quarterly demand for 7 major products
Breakdown of demand by segment (Unit basis)
Y-O-Ygrowth rate Units
Rental
Mining & energy
Others
Y-O-Y growth rate
Construction, Mining & Utility Equipment : Demand in Major Markets (2) North AmericaConventional: w/o KMC
FY16: -11%FY17:+/-0%〜+5% (Projection of Oct. 2017)FY17:+/-0%〜+5% (Initial Projection)
Komatsu (Conventional)
3Q: +24%Apr.-Dec: +14%
050100150200250
Projection(Initial)(As of Oct.2017)

20
(10,000)
(5,000)
0
5,000
10,000
15,000
-40%
-20%
0%
20%
40%
60%
FY13/1Q
2Q 3Q 4Q FY14/1Q
2Q 3Q 4Q FY15/1Q
2Q 3Q 4Q FY16/1Q
2Q 3Q 4Q FY17/1Q
2Q 3Q
Demand (units) Y-o-Y change (%)
0
10,000
20,000
30,000
40,000
50,000
60,000
70,000
80,000
FY07
FY08
FY09
FY10
FY11
FY12
FY13
FY14
FY15
FY16
FY17
FY17
45 5248
Index :FY07/3Q=100
59
Annual demand for 7 major products Quarterly demand for 7 major products
Region demand for 7 major products (Excl. 6t class)
Y-O-Ygrowth rate Units
Units
Units
[Source]: Demand for 7 major products estimated by Komatsu
・In the third quarter period of FY2017, European demand increased by 3% from the corresponding period a year ago. ・Demand remained steady, centering on a major market of Germany.
57
Construction, Mining Equipment and Utility : Demand in Major Markets (3) EuropeConventional: w/o KMC
FY16: +11%FY17:+/-0%〜+5% (Projection of Oct. 2017)FY17:+/-0%〜+5% (Initial Projection)
Komatsu (Conventional)
3Q: +3%Apr.-Dec: +6%
0
10,000
20,000
30,000
40,000
50,000
FY08 FY09 FY10 FY11 FY12 FY13 FY14 FY15 FY16
SouthernEasternOther Western CountriesNorthernThe UK., France, and Germany
0
5,000
10,000
15,000
20,000
25,000
30,000
FY16(Apr.-Nov.)
FY17(Apr.-Nov.)
Projection(Initial)(As of Oct.2017)
21
0
5,000
10,000
15,000
4 5 6 7 8 9 10 11 12 1 2 3
FY2013FY2014FY2015FY2016FY2017
-20,000
-10,000
0
10,000
20,000
30,000
-100%
-50%
0%
50%
100%
150%
FY13/1Q
2Q 3Q 4Q FY14/1Q
2Q 3Q 4Q FY15/1Q
2Q 3Q 4Q FY16/1Q
2Q 3Q 4Q FY17/1Q
2Q 3Q
Demand (units) Y-O-Y growth rate
-13%-16%-15%-8%
-10%-8%-8%
-10%-7%
-14%3%
29%
1%6% 10%6%10%12%
-2%
17%9%
-25%
83%
6%
14%
7%3%
6%
-2%2%
0%8%
2%
-80%-60%-40%-20%0%20%40%60%80%
0
50
100
150
200 Operating hours (left scale)Y-o-Y (right scale)
0
20,000
40,000
60,000
80,000
100,000
120,000
FY03
FY04
FY05
FY06
FY07
FY08
FY09
FY10
FY11
FY12
FY13
FY14
FY15
FY16
FY17
FY17
KOMTRAX in China : Average operating hours per month
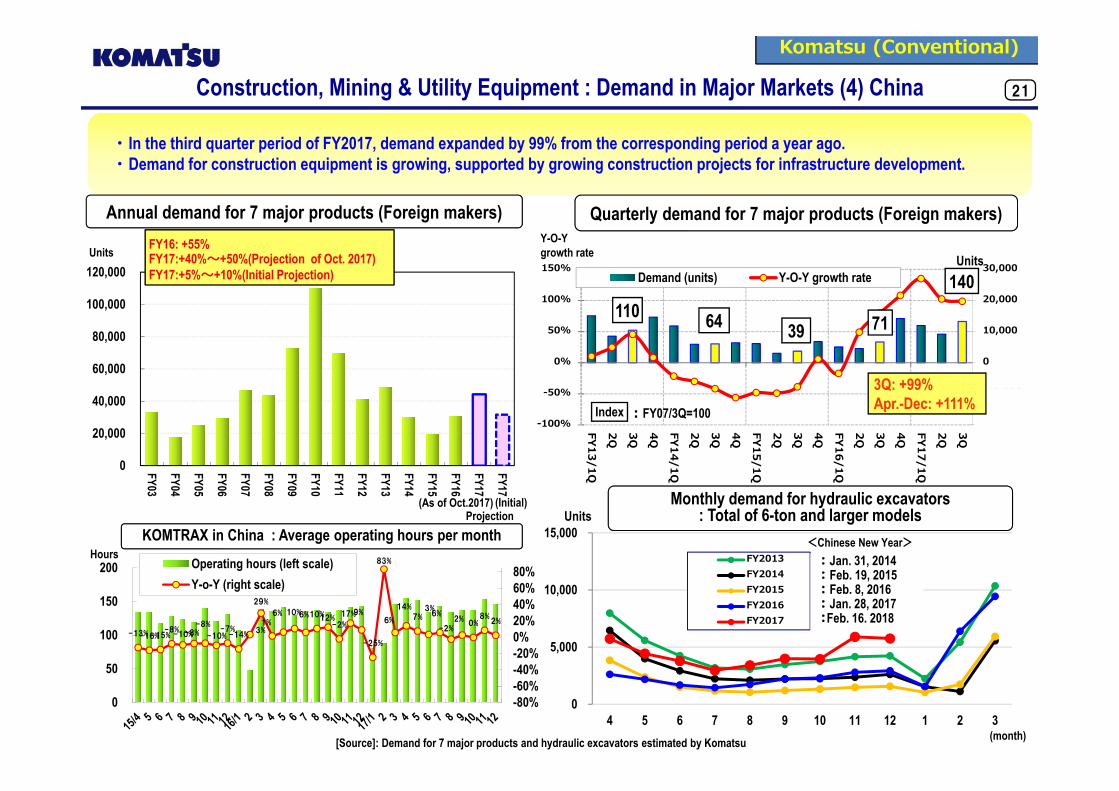
・In the third quarter period of FY2017, demand expanded by 99% from the corresponding period a year ago.・Demand for construction equipment is growing, supported by growing construction projects for infrastructure development.
110 7139
Index :FY07/3Q=100
140
64
Quarterly demand for 7 major products (Foreign makers)
UnitsY-O-Ygrowth rate Units
Monthly demand for hydraulic excavators: Total of 6-ton and larger models
[Source]: Demand for 7 major products and hydraulic excavators estimated by Komatsu
Hours
Units
<Chinese New Year>: Jan. 31, 2014: Feb. 19, 2015: Feb. 8, 2016: Jan. 28, 2017:Feb. 16. 2018
(month)
Annual demand for 7 major products (Foreign makers)
Construction, Mining & Utility Equipment : Demand in Major Markets (4) ChinaConventional: w/o KMC
FY16: +55%FY17:+40%〜+50%(Projection of Oct. 2017)FY17:+5%〜+10%(Initial Projection)
Komatsu (Conventional)
3Q: +99%Apr.-Dec: +111%
Projection(Initial)(As of Oct.2017)

22
0
10,000
20,000
30,000
40,000
FY04FY05FY06FY07FY08FY09FY10FY11FY12FY13FY14FY15FY16FY17FY17
Indonesia
Others
Malaysia
Thailand
0
1000
2000
3000
4000
5000
6000FY12/1Q2Q 3Q 4Q FY13/1Q2Q 3Q 4Q FY14/1Q2Q 3Q 4Q FY15/1Q2Q 3Q 4Q FY16/1Q2Q 3Q 4Q FY171Q2Q 3Q
ForestryAgricultureConstructionMining
-6,000
-3,000
0
3,000
6,000
9,000
-80%
-40%
0%
40%
80%
120%
FY13/1Q
2Q 3Q 4Q FY14/1Q
2Q 3Q 4Q FY15/1Q
2Q 3Q 4Q FY16/1Q
2Q 3Q 4Q FY17/1Q
2Q 3Q
Indonesia Others MalaysiaThailand Y-o-Y change (%)
:
151107 123
Index : FY07/3Q=100
156123
Annual demand for 7 major products Quarterly demand for 7 major products
[Source]: Demand for 7 major products estimated by Komatsu
UnitsUnitsY-O-Y
growth rate
Indonesia: Demand for construction & mining equipment by industrial sector
Units
・In the third quarter period of FY2017, demand advanced by 27% from the corresponding period a year ago. ・Especially, demand for mining equipment has increased sharply in Indonesia, the largest market of Southeast Asia.
Construction, Mining & Utility Equipment : Demand in Major Markets (5) Southeast AsiaKomatsu (Conventional)
3Q: +63%Apr.-Dec: +71%
3Q: +27%Apr.-Dec: +28%
FY16: +10%FY17:+15%〜+20% (Projection of Oct. 2017)FY17:+/-0%〜+5%(Initial Projection)
Projection(Initial)(As of Oct.2017)

23
-55%
-54%
-49%
-45%-33%
-22%
-26%
-15%-2%
-24%
-12%-20%
-33%
-7%
+17%
+12%
+96%
+59%
+50%
-250%
-200%
-150%
-100%
-50%
0%
50%
100%
0
500
1,000
1,500
2,000
FY13/1Q2Q 3Q 4Q FY14/1Q2Q 3Q 4Q FY15/1Q2Q 3Q 4Q FY16/1Q2Q 3Q 4Q FY17/1Q2Q 3Q
Middle East &
AfricaOceania
Asia
Japan&China
Europe&CIS
Latin America
N. America
Y-o-Y change
+6%
+15%
-34%
+39%+51%
-5%
-51%
-25%-15%-3%
-400%
-350%
-300%
-250%
-200%
-150%
-100%
-50%
0%
50%
100%
0
2,000
4,000
6,000
8,000
10,000
FY07
FY08
FY09
FY10
FY11
FY12
FY13
FY14
FY15
FY16
FY17
FY17
Middle East &AfricaOceania
Asia
Japan&China
Europe&CIS
Latin America
N. America
Y-o-Y change
Annual demand for mining equipment Quarterly demand for mining equipment
Units Y-o-Y change
・Dump trucks: 75 tons (HD785) and larger・Bulldozers: 525HP (D375) and larger・Excavators: 200 tons (PC2000) and larger Units Y-o-Y change
・Wheel loaders: 810HP (WA800) and larger ・Motor graders: 280HP (GD825) and larger
Note: Demand estimated by Komatsu
・In the third quarter period of FY2017, global demand increased by 50% from the corresponding period a year ago. ・Demand continues to advance, centering on Indonesia.・Concerning full-year demand, we are not changing our projection of October last year.
Construction, Mining Equipment and Utility : Actual and Projected Demand for Mining Equipment Komatsu (Conventional)
FY16: -2%FY17:+40%〜+50% (Projection of Oct. 2017)FY17:+10%〜+20% (Initial Projection)
3Q: +50%Apr.-Dec: +65%
Projection(Initial)(As of Oct.2017)

24
19.418.3
23.825.1
31.026.2
27.645.7 45.8
50.760.2
58.865.8
65.933.226.634.4
50.447.4
53.473.3
33.135.4
35.826.828.9
29.614.1
12.5
19.8
120.9118.7
128.8130.8
115.9110.1
113.7107.5
98.390.7
108.9
135.8
211.1222.3
252.2
-7%
-0%+20%
-13%
-4%
-7%
-12%
-18%
-15%
-18%
-4%
+26%
+115%+145%
+132%
+40%+60%
+53%
-400%
-350%
-300%
-250%
-200%
-150%
-100%
-50%
0%
50%
100%
150%
0
50
100
150
200
250
300
FY14/1Q2Q 3Q 4Q FY15/1Q2Q 3Q 4Q FY16/1Q2Q 3Q 4Q FY17/1Q2Q 3Q FY16/1Q2Q 3Q 4Q FY17/1Q2Q 3Q
KMC Middle East & AfricaOceania AsiaJapan & China Europe & CISLatin America N. America
Y-o-Y change(including KMC)Y-o-Y change(Conventional)
96.391.7
86.6 98.381.3
196.1214.9
202.4234.6
216.2
206.8140.6
144.6
222.2178.2
129.5
110.4
105.1
93.2
361.5
417.0
554.0
614.5
506.3499.3
447.3433.6
731.656.4
52.5
-14%
+15%+33%
+11%
-18%
-1%
-10%
-3%
+95%
+69%
+28%
+10%
-300%
-250%
-200%
-150%
-100%
-50%
0%
50%
100%
0
200
400
600
800
1,000
1,200
FY09FY10FY11FY12FY13FY14FY15FY16FY17FY17
FY14FY15FY16FY17FY17
KMC Middle East & AfricaOceania AsiaJapan & China Europe & CISLatin America N. AmericaY-o-Y change(including KMC) Y-o-Y change(Conventional)
475.6
555.0
846.0
Annual sales of mining equipment (incl. parts and service, etc.) Quarterly sales of mining equipment (incl. parts and service, etc.)
Y-o-Y change
Billions of yenBillions of yen
Y-o-Y change
137.2145.3
Equipment(KMC)
Parts(conventional)
Equipment(conventional)
Service, etc(conventional)
Service, etc(KMC)
Parts(KMC)
Equipment(KMC)
Parts(conventional)
Equipment(conventional)
Service, etc(conventional)
Service, etc(KMC)
Parts(KMC)
Projection(Initial)
Projection(Initial)
Construction, Mining & Utility Equipment : Sales of Mining Equipment・For the third quarter period of FY2017, sales expanded by 132% from the corresponding period a year ago, to JPY252.2 billion. When
KMC’s sales are excluded, sales advanced by 53% to JPY166.9 billion. ・When the effects of KMC are excluded, sales of equipment, parts and service advanced, supported by growing demand in Indonesia
and some other countries.
166.9
(As of Oct.2017) (As of Oct.2017)

25
45.846.4
50.853.1
54.952.7
56.950.445.7
45.850.7
60.258.8
65.865.9
45.746.4
49.249.8
47.246.1
44.444.9
42.142.0
43.0
49.3
49.4
50.950.6
26.828.9
29.6
91.6 92.8 100.0
102.9 102.1
98.8 101.3
95.3 87.8 87.8 93.8
109.5
135.0 145.7 146.1
-3%
+5%+14%+11% +11% +7%+1%
-7%-14% -11%
-7%
+15%
+54%+66%
+56%
+23%+33%
+24%
-180%
-160%
-140%
-120%
-100%
-80%
-60%
-40%
-20%
0%
20%
40%
60%
80%
0
20
40
60
80
100
120
140
160
180
200
FY14/1Q
2Q 3Q 4Q FY15/1Q
2Q 3Q 4Q FY16/1Q
2Q 3Q 4Q FY17/1Q
2Q 3Q
KMCConstruction equipmentMining equipmentYonY(including KMC)YonY(conventional Komatsu)
105.0 113.0 118.0 138.5 158.0
171.5 187.4
196.1 214.9
202.4 234.6 216.2
154.5 152.0 120.0 141.5
159.0 148.0 176.3 191.1 182.6 176.5
193.2 180.8
105.193.2
+2%
-10%
+18%+13%
+1%
+14% +6%+3%
-5%
+41%
+29%
+13%+5%
-120%
-100%
-80%
-60%
-40%
-20%
0%
20%
40%
0
100
200
300
400
500
600
700
800
FY07 FY08 FY09 FY10 FY11 FY12 FY13 FY14 FY15 FY16 FY17 FY17
KMCConstruction equipmentMining equipmentYonY(including KMC)YonY(conventional Komatsu)
238.0280.0
317.0
265.0
319.5363.7
259.5
387.2 397.5378.8
Construction, Mining & Utility Equipment : Sales of Parts
Annual sales of parts Quarterly sales of partsBillions of yen Y-o-Y change (%)
Y-o-Y change (%)
490.2
427.8
532.9
397.0
Billions of yen
108.2
116.7
・For the third quarter period of 2017, sales of parts increased by 56% to JPY146.1 billion from the corresponding period a year ago.When KMC’s sales are excluded, sales of parts advanced by 24% to JPY116.5 billion.
・Sales advanced as a result of capturing demand for aftermarket products.
116.5
Projection(Initial)(As of Oct.2017)

26
Appendix

27
63.4 62.156.2 60.1 49.7 49.3 55.6 53.9
29.7 34.342.8
67.0
13.8%12.9%
11.4% 11.1% 11.1% 11.0% 11.6% 11.1%
7.7% 8.4%10.0%
11.6%
9.3% 10.1% 11.7%
13.4% 12.9% 12.6%
-50
0
50
100
150
FY14/1Q 2Q 3Q 4Q FY15/1Q 2Q 3Q 4Q FY16/1Q 2Q 3Q 4Q FY17/1Q 2Q 3Q 4Q
Operating profit (KMC) Operating profit (Komatsu conventional)Operating profit ratio (including KMC) Operating profit ratio (Komatsu conventional)
-10.2 -5.2 -6.2 -4.5 -4.8 -3.6 -6.5 -6.1 -2.5 -2.4 -3.3 -5.3 -10.0 -5.8 -4.7
411.8 416.7 433.8 467.3 392.3 380.5 417.4 411.6 345.1 353.4 379.0
498.8 441.0 472.4 509.1
15.2 11.7 12.9 13.6 13.8 13.5
13.4 13.1 11.8 11.6 12.6
12.9 17.5
13.6 14.7
43.3 59.0 53.565.6
44.7 56.0 53.6 65.734.7 44.2 42.2
69.738.6 40.5
42.373.9 76.985.3
-100
0
100
200
300
400
500
600
700
800
FY14/1Q 2Q 3Q 4Q FY15/1Q 2Q 3Q 4Q FY16/1Q 2Q 3Q 4Q FY17/1Q 2Q 3Q 4Q
KMCIndustrial Machinery & OthersRetail FinanceConstruction, Mining & Utility Equipment(Komatsu conventional)Elimination
¥/USD
¥/EUR
¥/RMB
14/1Q 14/2Q 14/3Q 14/4Q102.5 102.8 114.1 119.2140.9 137.7 142.8 136.916.4 16.6 18.5 19.0
16/1Q 16/2Q 16/3Q 16/4Q109.8 102.9 106.9 114.7124.3 114.6 116.7 121.416.9 15.4 15.7 16.7
460.2
15/1Q 15/2Q 15/3Q 15/4Q121.3 122.6 121.2 118.0133.0 136.2 132.3 128.019.6 19.5 19.0 17.9
482.3 494.0542.0
446.1 446.3 478.0 484.4389.2
<Appendix> Quarterly Sales and Operating Income
Quarterly sales (since FY2014)
Quarterly operating income(Since FY2014)
Billions of yen
Billions of yen
Exchange rates 17/1Q 17/2Q 17/3Q 17/4Q
111.2 110.9 113.0121.6 129.9 133.216.3 16.6 17.0
406.8430.5
576.2 561.2
52.4 60.2
597.7646.8
75.5

28
17% 21% 21% 24% 22% 23% 23% 29% 23% 25% 22% 25% 18% 21% 19%22% 18% 16% 17% 15% 13% 13% 14% 15% 15% 15% 19%
13% 12% 12%
13% 12% 12% 11% 10% 9% 8% 9% 10% 8% 9% 10%12% 12% 16%
48% 49% 51% 48% 53% 55% 55% 48% 52% 52% 53% 45% 57% 55% 53%
0%
20%
40%
60%
80%
100%
FY14/1Q 2Q 3Q 4Q FY15/1Q 2Q 3Q 4Q FY16/1Q 2Q 3Q 4Q FY17/1Q 2Q 3Q 4Q
Parts, etc Mining equipment Construction equipment(Stragegic Markets) Construction equipment(Traditional Markets)
53.2 55.1 51.0 51.6 42.4 40.7 41.4 44.3 26.3 31.2 38.965.1
12.9% 13.2% 11.8% 11.0% 10.8% 10.7% 9.9% 10.8% 7.6% 8.8% 10.3% 13.1% 9.3% 10.2% 13.5%
13.8% 13.3% 14.8%
60% 55% 53% 51% 54% 48% 47% 45% 50% 47% 51% 53% 55% 52% 54%
(50)
0
50
100
FY14/1Q 2Q 3Q 4Q FY15/1Q 2Q 3Q 4Q FY16/1Q 2Q 3Q 4Q FY17/1Q 2Q 3Q 4Q
Segment profit (KMC) Segment profit (Komatsu conventional) Segment profit ratio (including KMC)
Segment profit ratio (Komatsu conventional) Percentage of sales in Strategic Markets
47.9
411.8 416.7 433.8 467.3392.3 380.5 417.4 411.6 345.1 353.4 379.0
498.8
441.0 472.4 509.1
73.9 76.9 85.3
0100200300400500600
FY14/1Q 2Q 3Q 4Q FY15/1Q 2Q 3Q 4Q FY16/1Q 2Q 3Q 4Q FY17/1Q 2Q 3Q 4Q
KMC Komatsu conventional 515.0 549.3Quarterly Sales
Quarterly segment profit
Billions of yen
Billions of yen
¥/USD
¥/EUR
¥/RMB
14/1Q 14/2Q 14/3Q 14/4Q
102.5 102.8 114.1 119.2
140.9 137.7 142.8 136.9
16.4 16.6 18.5 19.0
16/1Q 16/2Q 16/3Q 16/4Q
109.8 102.9 106.9 114.7
124.3 114.6 116.7 121.4
16.9 15.4 15.7 16.7
15/1Q 15/2Q 15/3Q 15/4Q
121.3 122.6 121.2 118.0
133.0 136.2 132.3 128.0
19.6 19.5 19.0 17.9
Exchange rates 17/1Q 17/2Q 17/3Q 17/4Q
111.2 110.9 113.0
121.6 129.9 133.2
16.3 16.6 17.0
<Appendix>Construction, Mining & Utility Equipment: Quarterly Sales and Segment Profit
Breakdown of sales(%)
594.5
55.7 80.1

29
65.3 85.2 92.3 85.2 67.5 80.0 81.2 78.8 59.6 77.7 79.1 84.9 69.1 87.4 78.7
56.8 68.6 76.6 100.7
75.8 82.9
105.1 106.2
75.6 79.8 80.2
102.6 116.0 131.4 152.1
39.333.7
32.240.4
37.532.7
30.7 38.4
35.829.5 26.2
43.9 43.0
41.6 39.7
60.164.7
68.570.3
58.4 48.358.2 50.0
49.046 51
56.8 72.2
77.882.0
14.3 13.6
14.3 11.9
11.5 11.7
13.1 11.2
15.6 14.7 18.2
22.0 27.6
25.6 26.2
33.4 25.2
22.6 21.6
18.6 13.1
16.4 21.4
18.7 17.3 21.7
39.4 38.3
31.7 43.8
54.9 48.0
51.3 56.3
52.6 46.5
47.9 42.4
40.2 40.3 50.5
75.5 64.1
68.9
76.9
34.734.1
31.529.3
25.6 28.1
26.9 26.2
24.0 24.125.8
31.5 45.1
40.0
51.5
15.714.8
11.318.8
17.2 14.0
14.6 12.7
9.1 7.16.9
12.57.4
10.1
9.5
29.3 25.028.3
29.1
23.7 20.3
17.5 20.8
15.4 14.916.5
24.827.8
31.0
30.9
0
100
200
300
400
500
600
FY14/1Q 2Q 3Q 4Q FY15/1Q 2Q 3Q 4Q FY16/1Q 2Q 3Q 4Q FY17/1Q 2Q 3Q 4Q
*1
404.1 413.5 429.4
464.2
388.9 378.0412.1 408.4
343.4
Billions of yen
Africa
Middle East
Oceania
Asia
China
CIS
Latin America
Europe
North America
Japan
¥/USD
¥/EUR
¥/RMB
14/1Q 14/2Q 14/3Q 14/4Q
102.5 102.8 114.1 119.2
140.9 137.7 142.8 136.9
16.4 16.6 18.5 19.0
16/1Q 16/2Q 16/3Q 16/4Q
109.8 102.9 106.9 114.7
124.3 114.6 116.7 121.4
16.9 15.4 15.7 16.7
15/1Q 15/2Q 15/3Q 15/4Q
121.3 122.6 121.2 118.0
133.0 136.2 132.3 128.0
19.6 19.5 19.0 17.9
Exchange rates 17/1Q 17/2Q 17/3Q 17/4Q
111.2 110.9 113.0
121.6 129.9 133.2
16.3 16.6 17.0
351.8376.6
494.4
<Appendix>Construction, Mining & Utility Equipment: Quarterly Sales by Region (To Outside Customers)
510.9
*1 including KMC
545.8*1
591.7*1

30
4.23.3 3.7 3.2
3.7 3.7 3.2 2.5 1.8 2.3 2.5-2.3
3.3 2.5 3.0
28.0% 28.8% 29.2%24.2% 27.3% 28.0%
24.0%19.3%
15.9%20.1% 20.2%
-17.8%
18.9% 18.9% 20.6%
-5
0
5
10
15
FY14/1Q 2Q 3Q 4Q FY15/1Q 2Q 3Q 4Q FY16/1Q 2Q 3Q 4Q FY17/1Q 2Q 3Q 4Q
Segment profit Segment profit ratio
15.2
11.7 12.9 13.6 13.8 13.5 13.4 13.1 11.8 11.6
12.6 12.9
17.5
13.6 14.7
02468
101214161820
FY14/1Q 2Q 3Q 4Q FY15/1Q 2Q 3Q 4Q FY16/1Q 2Q 3Q 4Q FY17/1Q 2Q 3Q 4Q
Quarterly sales
Quarterly segment profitBillions of yen
Billions of yen
¥/USD
¥/EUR
¥/RMB
14/1Q 14/2Q 14/3Q 14/4Q
102.5 102.8 114.1 119.2
140.9 137.7 142.8 136.9
16.4 16.6 18.5 19.0
16/1Q 16/2Q 16/3Q 16/4Q
109.8 102.9 106.9 114.7
124.3 114.6 116.7 121.4
16.9 15.4 15.7 16.7
15/1Q 15/2Q 15/3Q 15/4Q
121.3 122.6 121.2 118.0
133.0 136.2 132.3 128.0
19.6 19.5 19.0 17.9
Exchange rates 17/1Q 17/2Q 17/3Q 17/4Q
111.2 110.9 113.0
121.6 129.9 133.2
16.3 16.6 17.0
<Appendix>Retail Finance: Quarterly Sales and Segment Profit
*1*1
*1 *1
*1 I Including allowances for bad doubtful accounts in China (FY16/1Q: JPY-1.0 bn, 2Q: JPY -0.5bn bn, 3Q: JPY-0.2:bn, 4Q:JPY-4.9bn)

31
43.3
59.0 53.5
65.6
44.7
56.0 53.6
65.7
34.7 44.2 42.2
69.7
38.6 40.5 42.3
0
25
50
75
100
FY14/1Q 2Q 3Q 4Q FY15/1Q 2Q 3Q 4Q FY16/1Q 2Q 3Q 4Q FY17/1Q 2Q 3Q 4Q
3.14.6 3.8 4.5
3.24.2 4.4
7.3
1.7 2.3 2.3
6.0
2.3 2.44.3
7.3% 7.9% 7.2% 7.0% 7.3% 7.6% 8.3%11.3%
4.9% 5.3% 5.7%8.6%
6.1% 6.1%
10.2%
-5
0
5
10
15
FY14/1Q 2Q 3Q 4Q FY15/1Q 2Q 3Q 4Q FY16/1Q 2Q 3Q 4Q FY17/1Q 2Q 3Q 4Q
Segment profit Segment profit ratio
<Appendix>Industrial Machinery & Others: Quarterly Sales and Segment Profit
Quarterly sales
Quarterly segment profit
Billions of yen
Exchange rates
Billions of yen
¥/USD
¥/EUR
¥/RMB
14/1Q 14/2Q 14/3Q 14/4Q
102.5 102.8 114.1 119.2
140.9 137.7 142.8 136.9
16.4 16.6 18.5 19.0
16/1Q 16/2Q 16/3Q 16/4Q
109.8 102.9 106.9 114.7
124.3 114.6 116.7 121.4
16.9 15.4 15.7 16.7
15/1Q 15/2Q 15/3Q 15/4Q
121.3 122.6 121.2 118.0
133.0 136.2 132.3 128.0
19.6 19.5 19.0 17.9
17/1Q 17/2Q 17/3Q 17/4Q
111.2 110.9 113.0
121.6 129.9 133.2
16.3 16.6 17.0

32
0%
50%
100%
150%
200%
250%
0%
50%
100%
150%
200%
Komatsu America(Mining eqpt)
Komatsu Germany(Mining eqpt)
PC3000, PC4000PC5500, PC7000PC8000
Komatsu Ltd.(Mining eqpt)
HD785, HD1500 PC2000,PC3000 PC4000WA800 upD375A upGD825A up
730E, 830E, 860E930E, 960E, 980E
Avg. orders in value for 6 months/Avg. factory shipment in value for 6 months)
<Appendix> Book-to-Bill Ratio of Mining Equipment (6 Months)
0%
50%
100%
150%
200%
Orders received/Sales Index

33
0%
50%
100%
150%
200%
250%
Orders received/Sales Index
0%
50%
100%
150%
200%
250%
Avg. orders in value for 6 months/Avg. factory shipment in value for 6 months)
KMC(Surface)
KMC(Underground)
Rope shovelsBlast hole drillsDraglines, etc.
Continuous minersShearersLoad haul dumpsJumbo drills, etc.
<Appendix> Book-to-Bill Ratio of KMC Mining Equipment (6 Months)

34
0%
50%
100%
150%
200%
14/03 14/06 14/09 14/12 15/03 15/06 15/09 15/12 16/03 16/06 16/09 16/12 17/03 17/06 17/09 17/12
Orders received/Sales Index
0%
50%
100%
150%
200%
14/03 14/06 14/09 14/12 15/03 15/06 15/09 15/12 16/03 16/06 16/09 16/12 17/03 17/06 17/09 17/12
Komatsu Industries
Komatsu NTC(Excl. wire saws)
Avg. orders in value for 6 months/Avg. factory shipment in value for 6 months)
<Appendix>Book-to-Bill Ratio of Industrial Machinery (6 Months)
35
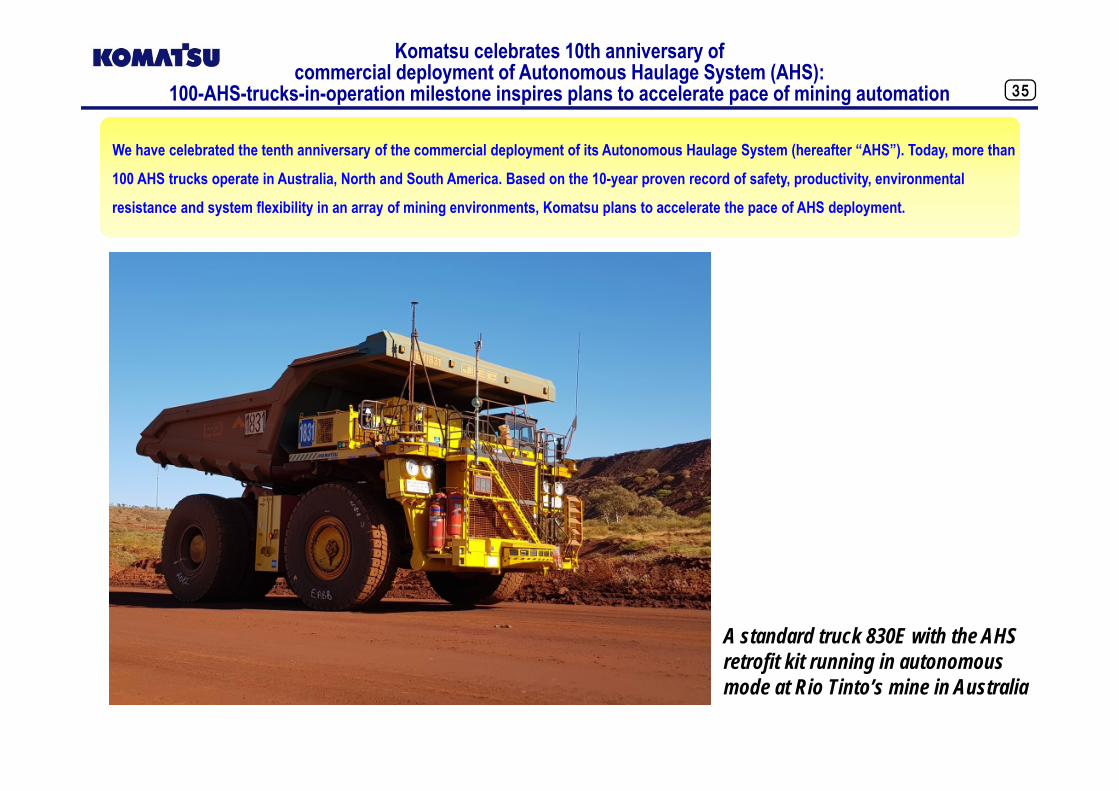
Komatsu celebrates 10th anniversary of commercial deployment of Autonomous Haulage System (AHS):
100-AHS-trucks-in-operation milestone inspires plans to accelerate pace of mining automation
A standard truck 830E with the AHS retrofit kit running in autonomous mode at Rio Tinto’s mine in Australia
We have celebrated the tenth anniversary of the commercial deployment of its Autonomous Haulage System (hereafter “AHS”). Today, more than
100 AHS trucks operate in Australia, North and South America. Based on the 10-year proven record of safety, productivity, environmental
resistance and system flexibility in an array of mining environments, Komatsu plans to accelerate the pace of AHS deployment.

36
We have signed an agreement to acquire from Prenbec Equipment (CEO: Charles MacLennan) based in Quebec, Canada, the attachment business,
namely, the Quadco and Southstar brands, owned by Prenbec Equipment and its subsidiaries. We plan to complete the acquisition by the end of
February.
Komatsu to acquire Quadco & Southstar operations
【Quadco-brand felling head】
【Southstar-brand harvester head】Komatsu’s forest machine with Quadco’s felling head
<Attachments owned by Prenbec Equipment>
Cautionary StatementThe announcement set forth herein contains forward-looking statements which reflect management's current views with respect to certain future events, including expected financial position, operating results, and business strategies. These statements can be identified by the use of terms such as "will," "believes," "should," "projects" and similar terms and expressions that identify future events or expectations. Actual results may differ materially from those projected, and the events and results of such forward-looking assumptions cannot be assured.Factors that may cause actual results to differ materially from those predicted by such forward-looking statements include, but are not limited to, unanticipated changes in demand for the Company's principal products, owing to changes in the economic conditions in the Company’s principal markets; changes in exchange rates or the impact of increased competition; unanticipated cost or delays encountered in achieving the Company's objectives with respect to globalized product sourcing and new Information Technology tools; uncertainties as to the results of the Company's research and development efforts and its ability to access and protect certain intellectual property rights; and, the impact of regulatory changes and accounting principles and practices.
Business Coordination Department, KOMATSU LTD.TEL: +81-3-5561-2687 FAX: +81-3-3582-8332 https://home.komatsu/en/