Bullying, Violence, and Perception of Safety Alabama Students – Grades 6-12 2003 – 2005.
24
Bullying, Violence, and Bullying, Violence, and Perception of Safety Perception of Safety Alabama Students – Grades 6-12 Alabama Students – Grades 6-12 2003 – 2005 2003 – 2005
-
Upload
laurel-goodman -
Category
Documents
-
view
213 -
download
0
Transcript of Bullying, Violence, and Perception of Safety Alabama Students – Grades 6-12 2003 – 2005.

Bullying, Violence, and Perception Bullying, Violence, and Perception of Safetyof Safety
Alabama Students – Grades 6-12Alabama Students – Grades 6-12 2003 – 2005 2003 – 2005

The presentation will be based The presentation will be based on the following populationson the following populations
Survey YearSurvey Year Survey Survey PopulationPopulation
WhiteWhite BlackBlack HispanicHispanic
20052005 263,944263,944 159,674159,674 79,88279,882 6,1316,131
20042004 262,050262,050 160,072160,072 79,10479,104 5,4685,468
20032003 247,237247,237 149,389149,389 79,88279,882 4,3024,302
Source: Pride Surveys Alabama Statewide Survey

Key VariablesKey Variables
Gang participationGang participation Students carrying guns at school vs Students carrying guns at school vs
outside of schooloutside of school Threatening behavior toward other Threatening behavior toward other
studentsstudents Fear of being hurt at school by a Fear of being hurt at school by a
studentstudent Incidence of being hurt at school by a Incidence of being hurt at school by a
studentstudent

Percentage of StudentsPercentage of StudentsReporting Gang ActivityReporting Gang Activity
11.0 11.312.312.1
11.211.8
2003 2004 2005
Alabama Nat'l Pride
Source: Pride Surveys

Alabama Gang ActivityAlabama Gang Activityby Ethnicityby Ethnicity
7.8 8.1 8.6
15.1 15.316.9
20.9 20.8 21.4
2003 2004 2005
White Black Hispanic
Source: Pride Surveys Alabama Statewide Survey
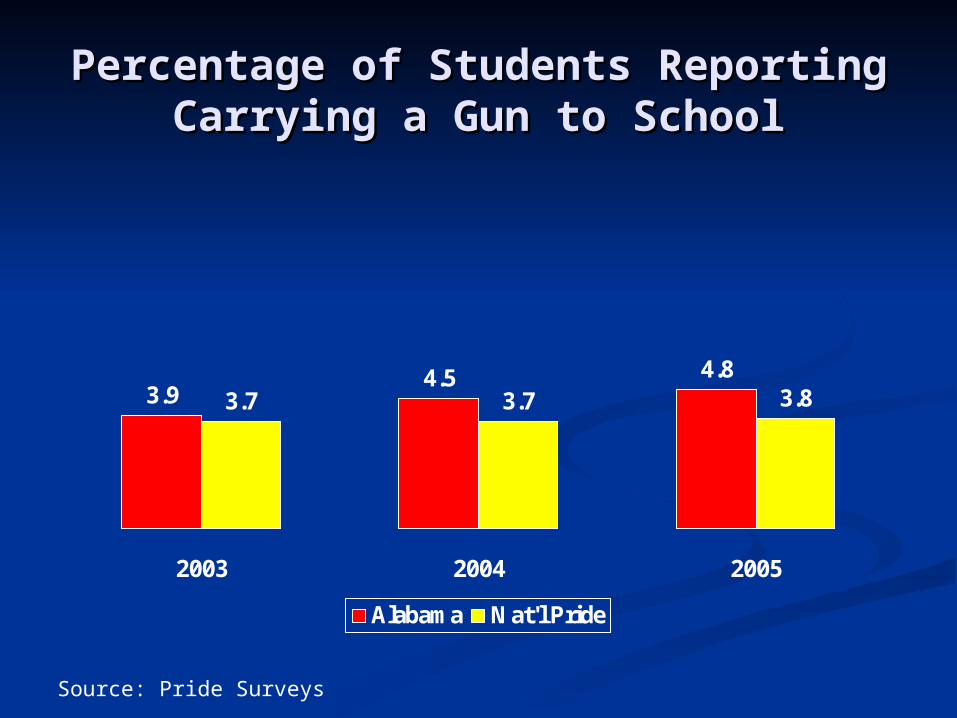
Percentage of Students Reporting Percentage of Students Reporting Carrying a Gun to SchoolCarrying a Gun to School
3.94.5 4.8
3.7 3.7 3.8
2003 2004 2005
Alabama Nat'l Pride
Source: Pride Surveys

Alabama Guns at SchoolAlabama Guns at Schoolby Ethnicityby Ethnicity
2.73.2 3.4
5.25.9 6.3
7.2
8.5 8.5
2003 2004 2005
White Black Hispanic
Source: Pride Surveys Alabama Statewide Survey

Carrying a Gun when NOT at SchoolCarrying a Gun when NOT at SchoolCompared to Carrying a Gun AT SchoolCompared to Carrying a Gun AT School
14.316.0 16.4
3.9 4.5 4.8
2003 2004 2005
Not At School At School
Source: Pride Surveys Alabama Statewide Survey

Percentage of Students Reporting Percentage of Students Reporting Carrying a Gun Outside of SchoolCarrying a Gun Outside of School
14.316.0 16.4
13.0 13.3 13.7
2003 2004 2005
Alabama Nat'l Pride
Source: Pride Surveys

Alabama Guns Alabama Guns notnot at School at Schoolby Ethnicityby Ethnicity
14.3
16.4 16.5
13.5 13.914.8
16.4 17.0 17.1
2003 2004 2005
White Black Hispanic
Source: Pride Surveys

Percentage of Students Reporting Percentage of Students Reporting Threatening to Harm Fellow StudentsThreatening to Harm Fellow Students
41.0 39.1 37.937.9 36.6 35.6
2003 2004 2005
Alabama Nat'l Pride
Source: Pride Surveys

Alabama Threatening BehaviorAlabama Threatening Behaviorby Ethnicityby Ethnicity
38.5 36.6 35.1
45.7 43.7 42.9
35.7 34.2 35.5
2003 2004 2005
White Black Hispanic
Source: Pride Surveys Alabama Statewide Survey

Percentage of Students ReportingPercentage of Students ReportingFear of Being Hurt at SchoolFear of Being Hurt at School
23.722.0 21.7
23.7 23.4 23.4
2003 2004 2005
Alabama Nat'l Pride
Source: Pride Surveys

Alabama Fear of Being Hurt at SchoolAlabama Fear of Being Hurt at Schoolby Ethnicityby Ethnicity
27.625.2 24.7
15.7 14.6 14.5
25.0 25.023.3
2003 2004 2005
White Black Hispanic
Source: Pride Surveys Alabama Statewide Survey

Percentage of Students ReportingPercentage of Students ReportingBeing Hurt at SchoolBeing Hurt at School
22.720.5 20.8
22.621.0 21.3
2003 2004 2005
Alabama Nat'l Pride
Source: Pride Surveys

Alabama Have Been Hurt at SchoolAlabama Have Been Hurt at Schoolby Ethnicityby Ethnicity
24.321.6 21.8
18.216.8 17.0
25.223.7 22.8
2003 2004 2005
White Black Hispanic
Source: Pride Surveys Alabama Statewide Survey

In My School, I Feel In My School, I Feel Safe…Safe…
NeverNever SeldomSeldom SometimSometim
eses OftenOften A LotA Lot

Feeling Unsafe At School – Feeling Unsafe At School – In The ClassroomIn The Classroom
12.213.4
14.4
10.2 10.0 10.3
2003 2004 2005
Alabama Nat'l Pride
Source: Pride Surveys

Alabama Feeling Unsafe in the ClassroomAlabama Feeling Unsafe in the Classroomby Ethnicityby Ethnicity
8.0 8.9 9.6
19.121.1
22.3
17.0 17.9 18.6
2003 2004 2005
White Black Hispanic
Source: Pride Surveys Alabama Statewide Survey

Feeling Unsafe At School – Feeling Unsafe At School – In The Parking LotIn The Parking Lot
22.4 22.623.7
18.2 17.5 17.8
2003 2004 2005
Alabama Nat'l Pride
Source: Pride Surveys

Alabama Feeling Unsafe in the Parking LotAlabama Feeling Unsafe in the Parking Lotby Ethnicityby Ethnicity
15.8 15.9 16.9
33.9 34.5 35.8
30.4 30.031.9
2003 2004 2005
White Black Hispanic
Source: Pride Surveys Alabama Statewide Survey

Feeling Unsafe At School – Feeling Unsafe At School – On The School BusOn The School Bus
21.8 21.9 22.4
17.4 16.5 16.6
2003 2004 2005
Alabama Nat'l Pride
Source: Pride Surveys

Alabama Feeling Unsafe on the School BusAlabama Feeling Unsafe on the School Busby Ethnicityby Ethnicity
16.3 16.2 16.5
31.4 32.0 32.7
27.3 26.428.3
2003 2004 2005
White Black Hispanic
Source: Pride Surveys Alabama Statewide Survey

Pride SurveysPride Surveys160 Vanderbilt Court160 Vanderbilt Court
Bowling Green, KY 42103Bowling Green, KY 42103(800) 279-6361(800) 279-6361
www.pridesurveys.comwww.pridesurveys.com