Building science 2 arc3413uyiyuiy 2
133
1 BUILDING SCIENCE 2 ARC3413 PROJECT 1 LIGHTING AND ACOUSTIC PERFORMANCE EVALUATION AND DESIGN GREYSKYMORNING CAFE TEAM MEMBERS BRYAN LUM ZI YANG 0314959 KAN JIA WEI ADRIAN 0319384 HONG SANG WON 0314661 JOSHUA LEE YEE KAI 0315820 KEN WONG CHUN THIM 0315334 KENNETH CHANG WEI JIAN 0318252 TUTOR MR AZIM SULAIMAN
-
Upload
ken-wong -
Category
Art & Photos
-
view
154 -
download
5
Transcript of Building science 2 arc3413uyiyuiy 2

1
BUILDING SCIENCE 2 ARC3413
PROJECT 1
LIGHTING AND ACOUSTIC PERFORMANCE
EVALUATION AND DESIGN
GREYSKYMORNING CAFE
TEAM MEMBERS
BRYAN LUM ZI YANG 0314959
KAN JIA WEI ADRIAN 0319384
HONG SANG WON 0314661
JOSHUA LEE YEE KAI 0315820
KEN WONG CHUN THIM 0315334
KENNETH CHANG WEI JIAN 0318252
TUTOR
MR AZIM SULAIMAN

2
DECLARATION OF SUBMISSION
This is to certify that:
1) The Report comprises our original work towards the course work on Building
Science 2 (ARC3413),
2) Due acknowledgements have been made in the text to all other material used.
Signed by:
STUDENT NAME
BRYAN LUM ZI YANG
KAN JIA WEI ADRIAN
HONG SANG WON
JOSHUA LEE YEE KAI
KEN WONG CHUN THIM
KENNETH CHANG WEI JIAN

3
ACKNOWLEDGEMENT
We would like to express our sincere thanks and gratification to our tutor, Mr Azim
Sulaiman for guiding us throughout the entire working and study process and going
out of his way to ensure that the group stays on the right track throughout the progress
of the project. We would also like to extend our thanks to the manager and staff on
duty at Greyskymorning Cafe on our multiple for their willingness to help and
cooperate with the advancement of our assignment, providing invaluable information
and also taking the extra step of guiding us around the building to explain and show
all of the systems. Finally, we give thanks to each and every one of our very own group
members whom participated flawlessly and were quick and efficient in conducting and
executing their respective parts of the project with contributed to a successful
completion of the project.

4
LIST OF FIGURES, PLATES, ILLUSTRATIONS
Figure 1.01 Exterior View of Greyskymorning Café.
Figure 1.02 Exterior Panorama View.
Figure 1.03 Interior Entrance Panorama View.
Figure 1.04 Interior Cashier Counter Panorama View.
Figure 1.05 Interior Back Panorama View.
Figure 2.01 Lux Meter.
Figure 2.02 Lux Meter General Specification Table
Figure 2.03 Lux Meter Electrical Specification Table.
Figure 2.04 Sound Level Meter.
Figure 2.05 Sound Meter General Specification Table.
Figure 2.06 Measuring Tape.
Figure 2.07 DSLR Camera.
Figure 2.08 Bryan measuring the dimensions of building.
Figure 2.09 Joshua converting raw data into hard data onsite.
Figure 2.10 Adrian obtaining the lighting and acoustic data.
Figure 2.11 Sang Won Conducting Preliminary Investigations and Sketches.

5
Figure 3.01 The External South Facing Side of Duke University School of Nursing.
Figure 3.02 Site Plan of the University Marked On The Map.
Figure 3.03 Exterior of the Café Duson in 2010.
Figure 3.04 Site Boundary Highlighted on A Site Plan of the Café Duson.
Figure 3.05 Squares Showing Lights Whilst Triangles Indicate Lights That Are Not Shown
Figure 3.06 Lights Being Pointed Through the Use of An Elevation Drawing.
Figure 3.07 Courtyard Luminaire Schedule.
Figure 3.08 Ground Floor Plan with Gridline of Greyskymorning Cafe.
Figure 3.09 Zoning Spaces of Greyskymorning Cafe.
Figure 3.10 Non-peak Lux Reading at 1.5m According to Gridline.
Figure 3.11 Peak Lux Reading at 1.5m According to Gridline.
Figure 3.12 Non-peak Lux Reading at 1.0m According to Gridline.
Figure 3.13 Peak Lux Reading at 1.0m According to Gridline.
Figure 3.14 Lux Reading at 1.5m. (Standing)
Figure 3.15 Lux Reading at 1.0m. (Sitting)
Figure 3.16 Non-peak Hour (11.30AM) Zone Dining Space.
Figure 3.17 Image of Zone A Dining Space.
Figure 3.18 Daylight (11.30AM) Calculation for Zone A.
Figure 3.19 Daylight (11.30AM) Factor Calculation for Zone A.
Figure 3.20 Daylight Factors and Distribution Table.
Figure 3.21 Non-Peak Hour (11.30AM) Zone Kitchen Space.
Figure 3.22 Panorama Image of Zone B Kitchen Space.
Figure 3.23 Daylight (11.30AM) Calculation for Zone B.
Figure 3.24 Daylight (11.30AM) Factor Calculation for Zone B.

6
Figure 3.25 Daylight Factors and Distribution Table.
Figure 3.26 Non-Peak Hour (11.30AM) Zone Service Area.
Figure 3.27 Image of Zone C Service Area.
Figure 3.28 Daylight (11.30AM) Calculation for Zone C.
Figure 3.29 Daylight (11.30AM) Factor Calculation for Zone C.
Figure 3.30 Daylight Factors and Distribution Table.
Figure 3.31 Plan and Light Analysis Diagram obtained via Revit.
Figure 3.32 Plan and Light Analysis Diagram obtained via Revit.
Figure 3.33 Plan and Light Analysis Diagram obtained via Revit.
Figure 3.34 Plan and Light Analysis Diagram obtained via Revit.
Figure 3.35 Plan and Light Analysis Diagram obtained via Revit.
Figure 3.36 Plan and Light Analysis Diagram obtained via Revit.
Figure 3.37 Plan and Light Analysis Diagram obtained via Revit.
Figure 3.38 Plan and Light Analysis Diagram obtained via Revit.
Figure 3.39 Dining Area Facing the West Sun.
Figure 3.40 Kitchen Space Facing the West Sun.
Figure 3.41 Service Area Facing the Morning Sun.
Figure 3.42 Natural Skylight Illuminates The Interior Spaces.
Figure 3.43 Kitchen Area Illuminated with Warm Spotlights.
Figure 3.44 Dining Spaces Illuminated with Warm Spotlights.
Figure 3.45 Warm Mood Created by Artificial Lightings.
Figure 4.01 Sky City and the Auckland Skyline.
Figure 4.02 Site of Sky City in Auckland.
Figure 4.03 Hotel Layout.
Figure 4.04 Lightweight Drywall.

7
Figure 4.05 Perforated Acoustic Ceiling Tiles.
Figure 4.06 Pre-Renovation Measured Noise Levels.
Figure 4.07 Commissioning Measured Noise Levels.
Figure 4.08 Gridlines Which Are Used to Collect Acoustic Data.
Figure 4.09 Non-Peak Acoustic Reading.
Figure 4.10 Non-Peak Acoustic Reading.
Figure 4.11 Peak Acoustic Reading.
Figure 4.12 Peak Acoustic Reading.
Figure 4.13 Non-Peak Sum Intensity and Sound Intensity Levels
Figure 4.14 Non-Peak Sum Intensity and Sound Intensity Levels
Figure 4.15 Noise Criteria for Acoustic Environment in Building Interiors.
Figure 4.16 Sound Decibel Table.
Figure 4.17 Plan with Indications for SRI Calculations.
Figure 4.18 Plan with Indications of The Measured Outdoor Acoustic Levels.

8
TABLE OF CONTENTS
SUBJECT PAGE
Cover Page
Declaration of Submission
Acknowledgement
List of Figures, Plates, Illustrations
Table of Contents
Abstract
1.0 INTRODUCTION
1.1 Aim and Objectives
1.2 Site Introduction
2.0 METHODOLOGY
2.1 Equipment and Specifications
2.1.1 Lux Meter
2.1.2 Sound Level Meter
2.1.3 Measuring Tape
2.1.4 Camera
2.2 Data Collection Method
2.2.1 Site Study
2.2.2 Procedure
3.0 LIGHTING
3.1 Precedent Studies
3.1.1 Introduction
3.1.2 Methodology

9
3.1.3 Analysis
3.2 Case Study
3.2.1 Site and Zoning
3.2.2 Data Tabulation and Analysis
3.2.3 Material Specification
3.2.4 Artificial Lighting Fixtures and Specifications
3.2.5 Daylight Factor Analysis
3.2.6 Artificial Light Analysis
3.2.7 Daylight and Lighting Diagrams
3.2.8 Lighting Analysis
4.0 ACOUSTICS
4.1 Precedent Studies
4.1.1 Introduction
4.1.2 Objectives and Issues
4.1.3 Existing Construction
4.1.4 Pre-Renovation Measurements
4.1.5 Design Standard
4.1.6 Final Treatment
4.1.7 Commissioning Measurements
4.1.8 Discussion and Conclusion
4.2 Case Study
4.2.1 Site and Zoning
4.2.2 Data Tabulation and Analysis
4.2.3 Material Specification
4.2.4 Fixtures and Specifications
4.2.5 Sound Reduction Index Calculation

10
4.2.6 Reverberation Time
4.2.7 Acoustic Analysis and Evaluation
5.0 CONCLUSION
APPENDIX
REFERENCES

11
ABSTRACT
This research report aims to look into the lighting and acoustic properties of a chosen
commercial building, Greyskymorning Café in SS13 Subang Jaya. The services and
parts of the building include: the cashier counter, the kitchen, the seating location, the
porch, and the back area connecting to the service area as well as the adjacent shoplot
to the toilets. Throughout the findings and analysis of lighting and acoustics, the
functions and any information of the systems will be studied extensively in conjunction
with the building to further understand the importance of the system in a building’s
properties operation. Findings and conclusions that are made as a result of this study
will be made through our understanding of these said services. Not least forth these
services will be adjudged to and by the Malaysian Standard 1525 (MS1525) and
requirements as well as other relevant rules and regulations stipulated by relevant
authorities and organisations.

12
1.0 INTRODUCTION
1.1 AIM AND OBJECTIVES
The aim of the assignment is to gain a better understanding in the lighting and acoustic
systems as well as their properties in a given space or building. Furthermore, from the
experience gained from this study the aim would be to compile and record the data
and provide critical analysis in the form of a written report.
The objectives of this assignment include and procurement of a complete written
report with data gained through documentation from the site visits on the building. The
criteria of the analysis of the space in relation to the lighting and acoustic and how
these properties work together is also to be made an objective. At the end of the
assignment students should have a better understanding on lighting and acoustics, as
well as all its relevant associates that come with it, including better understanding of
calculations of light and acoustic (Lumen and PSALI), as well as how different
materials and building layout all correspond with lighting and acoustic performance

13
1.2 SITE INTRODUCTION
Figure 1.01 Exterior View of Greyskymorning Café. (Wong,2016)
Greyskymorning Café, the site chosen for this case study is an infill building that is sandwiched in
between a church, City Harvest Church, and a restaurant, Food Industrie. The café also serves as an
access point and circulation between these areas, as well as to more points of the building on the
second floor, as well as a saloon that is only accessible via entering Greskymorning. All these
commercial and service buildings form an entire structure formally known as EX8, with its own
compound dictated by a fence as well as parking lots in and around the structure. EX8 is located in
SS13 Subang Jaya where it is predominantly surrounded by factories and manufacturing plants.
However, within the vicinity also lies an International School, and a football stadium.
The entire building, including Greyskymorning is covered in black paint and uses glass and windows
exponentially to take advantage of the large amounts of sunlight that Malaysia gets everyday. Natural
lighting is used extensively as a result, and the building is cooled with a mixture of air conditioning
systems and natural ventilation. The building also uses a heavy amount of steel and bricks that is left
as it is to provide a more modern feel and look, a movement which is getting more and more popular in
this region.
Greyskymorning Café has many doors and exits with links to and around other portions of EX8, and the
café was chosen as our site of our study as our initial analysis revealed that due to the heavy reliance
on natural lighting and interesting use of materials the data gained would provide very different results
from analysis from different parts of the day. The site is also located in a factory heavy location which
we feel would provide different acoustic performance results on different parts of the day as well.

14
Figure 1.02 Exterior Panorama View. (Hong,2016)
Figure 1.03 Interior Entrance Panorama View. (Hong,2016)
Figure 1.04 Interior Cashier Counter Panorama View. (Hong,2016)
Figure 1.05 Interior Back Panorama View. (Hong,2016)

15
2.0 METHODOLOGY
2.1 EQUIPMENT AND SPECIFICATIONS
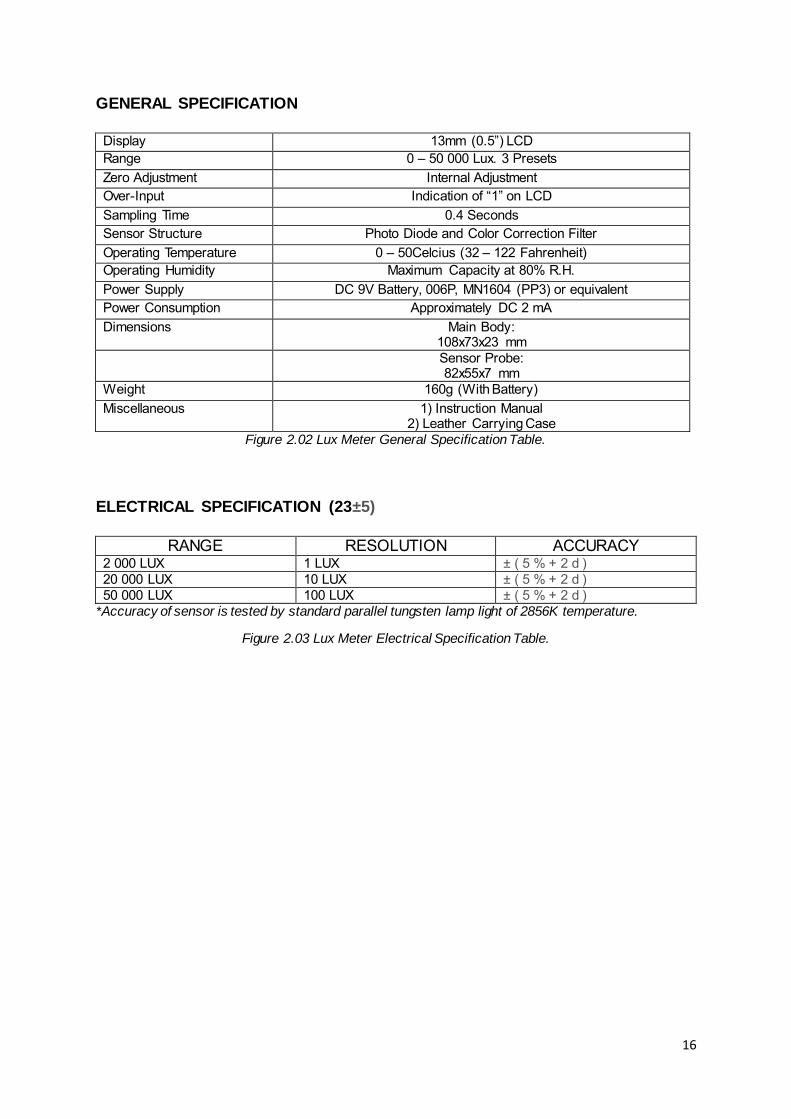
2.1.1 LUX METER
Figure 2.01 Lux Meter. (http://www.bsktech.com/lutron.html)
The lux meter is a digital light meter manufactured by Lutron Electronic Enterprise Co.
Ltd and functions to measure the luminous flux unit and illuminance level. This device
is highly accurate, using photo diodes and multi-colour correction filter with spectrums
that meet the C.I.E’s international code of standards. This lux meter is used as our
source for lighting data collected on site and is sourced from the University. The
specifications of the device are listed below.
16
GENERAL SPECIFICATION
Display 13mm (0.5”) LCD
Range 0 – 50 000 Lux. 3 Presets
Zero Adjustment Internal Adjustment
Over-Input Indication of “1” on LCD
Sampling Time 0.4 Seconds
Sensor Structure Photo Diode and Color Correction Filter
Operating Temperature 0 – 50Celcius (32 – 122 Fahrenheit)
Operating Humidity Maximum Capacity at 80% R.H.
Power Supply DC 9V Battery, 006P, MN1604 (PP3) or equivalent
Power Consumption Approximately DC 2 mA
Dimensions Main Body: 108x73x23 mm
Sensor Probe: 82x55x7 mm
Weight 160g (With Battery)
Miscellaneous 1) Instruction Manual 2) Leather Carrying Case
Figure 2.02 Lux Meter General Specification Table.
ELECTRICAL SPECIFICATION (23±5)
RANGE RESOLUTION ACCURACY 2 000 LUX 1 LUX ± ( 5 % + 2 d )
20 000 LUX 10 LUX ± ( 5 % + 2 d )
50 000 LUX 100 LUX ± ( 5 % + 2 d )
*Accuracy of sensor is tested by standard parallel tungsten lamp light of 2856K temperature.
Figure 2.03 Lux Meter Electrical Specification Table.

17
2.1.2 SOUND LEVEL METER
Figure 2.04 Sound Level Meter. (http://www.bsktech.com/lutron.html)
The sound level meter is a digital sound meter manufactured by Lutron Electronic
Enterprise Co. Ltd and functions to measure the acoustic levels and decibel levels.
This device is highly accurate and picks up any minute sound if pointed at the source
in the correct manner. This sound meter is used as our source for acoustic data
collected on site and is sourced from the University. The specifications of the device
are listed below.

18
GENERAL SPECIFICATION
Function dB ( A & C Frequency Weighting ), Time Weighting ( Fast, Slow ),
Hold, Memory ( Max. & Min. ), Peak Hold, AC Output RS232
Output.
Meter Default Function Range Set to Auto Range.
Frequency Weighting Set to A Weighting.
Time Weighting Set to Fast.
Measurement Range 30 – 130 dB
Resolution 0.1 dB
Range Selector Auto Range: 30 – 130 dB.
Manual Range: 3 Ranges, 30 – 80 dB, 50 – 100 dB,
80 – 130 dB, 50 dB On Each
Step with Over & Under
Range Indicating.
Frequency 31.5 – 8 000 Hz
Microphone Type Electric Condenser Microphone
Microphone Size 12.7 mm DIA ( 0.5 inch )
Frequency
Weighting Network
Characteristics of A & C
* A Weighting
The Characteristics Is Simulated As “Human Ear Listening”
Response. If Making the Environmental Sound Level
Measurement, Always Select to A Weighting.
Time Weighting
(Fast and Slow)
Fast – t=200 ms, Slow – t=500 ms
* FAST Range Is the Simulated Human Ear Response Time.
* SLOW Range Is Easier to Get the Average
Calibrator B & K ( Bruel & kjaer ), MULTIFUNCTION ACOUSTIC CALIBRATOR
4226
Output Signal *AC Output: AC 0.5 Vrms Corresponding to Each Range Step. Out
Put Impedance - 600 ohm
*RS232 Output
Output Terminal Terminal 1: RS232 Computer Interface Terminal, Photo Couple
Isolated.
Terminal 2: AC Output Terminal
Terminal Socket Size: 3.5mm dia. Phone Socket.
Calibration VR Built in External Calibration VR, Easy to Calibrate on 94 dB Level by
Screw Driver
Figure 2.05 Sound Meter General Specification Table.

19
2.1.3 MEASURING TAPE
Figure 2.06 Measuring Tape.
(https://www.amazon.com/Stanley-33-716-16-Foot-4-Inch-FatMax/dp/B00009OYGJ)
The measuring tape is used to measure a variety of items and specifications in and
around the building and site during the study period, including measurement of the
dimensions of the building, walls and stairs. It is also used to measure height,
especially the height of light and acoustic sources. Finally the tape is also used to
ensure the constant height that the acoustic and light reading are taken from are
constant and consistent.
2.1.4 CAMERA
Figure 2.07 DSLR Camera.
(https://www.bhphotovideo.com/c/buy/SLR-Digital-Cameras/ci/6222/N/4288586280)
20
The DSLR camera is used as the primary equipment to record and capture pictures of
the building, lighting and acoustic conditions, and the appliances that are deemed
necessary to the study. Multiple cameras belonging to fellow members were used. In
some instances cameras from mobile phones were used when DSLR cameras were
not readily available.
2.2 DATA COLLETION METHOD
2.2.1 SITE STUDY
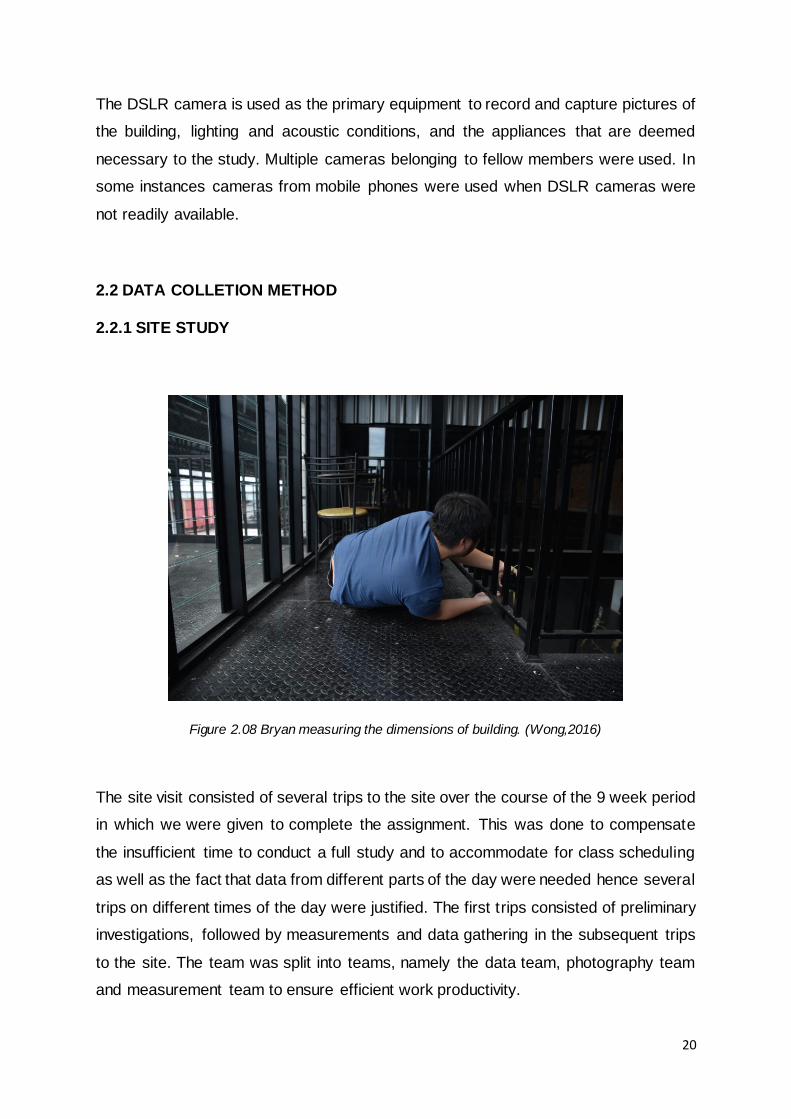
Figure 2.08 Bryan measuring the dimensions of building. (Wong,2016)
The site visit consisted of several trips to the site over the course of the 9 week period
in which we were given to complete the assignment. This was done to compensate
the insufficient time to conduct a full study and to accommodate for class scheduling
as well as the fact that data from different parts of the day were needed hence several
trips on different times of the day were justified. The first trips consisted of preliminary
investigations, followed by measurements and data gathering in the subsequent trips
to the site. The team was split into teams, namely the data team, photography team
and measurement team to ensure efficient work productivity.
21
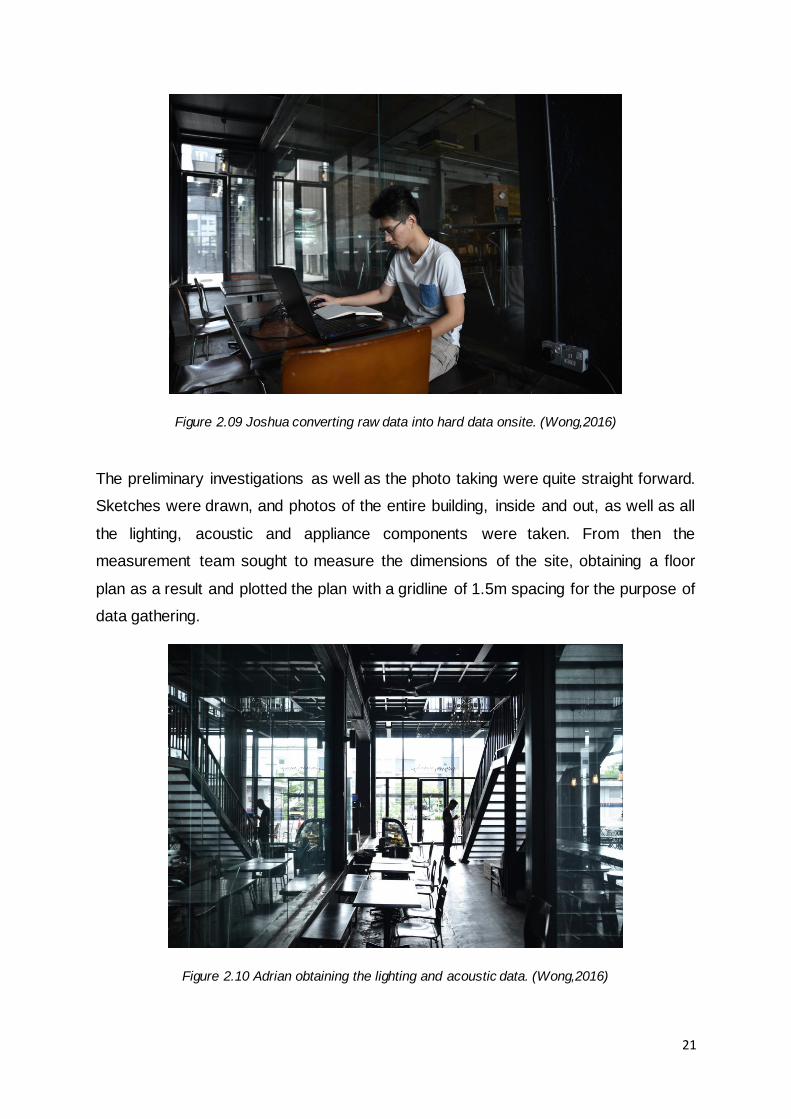
Figure 2.09 Joshua converting raw data into hard data onsite. (Wong,2016)
The preliminary investigations as well as the photo taking were quite straight forward.
Sketches were drawn, and photos of the entire building, inside and out, as well as all
the lighting, acoustic and appliance components were taken. From then the
measurement team sought to measure the dimensions of the site, obtaining a floor
plan as a result and plotted the plan with a gridline of 1.5m spacing for the purpose of
data gathering.
Figure 2.10 Adrian obtaining the lighting and acoustic data. (Wong,2016)

22
Once the gridline has been established, the data team took on the task of obtaining
the data for both the lighting and acoustics from a height of 1m and 1.5m from the
floor. In addition to obtaining data indoors, the data for outdoor areas immediately
surrounding the building were also gathered, albeit in less quantities. Only the ground
floor of the building was used for the study and the building was categorised into
different zones for further analysis.
2.2.2 PROCEDURE
Figure 2.11 Sang Won Conducting Preliminary Investigations and Sketches. (Kan,2016)
Below is the procedure list of the entire study process:
1. Preliminary investigation and photo survey, indication of light types and sources.
2. Measurement and production of floor plans, gridlines.
3. Data gathering for light and acoustic using proper equipment at heights of 1m and
1.5m
4. Analysis of data and production of report.
23
3.0 LIGHTING
3.1 PRECEDENT STUDY
3.1.1 INTRODUCTION
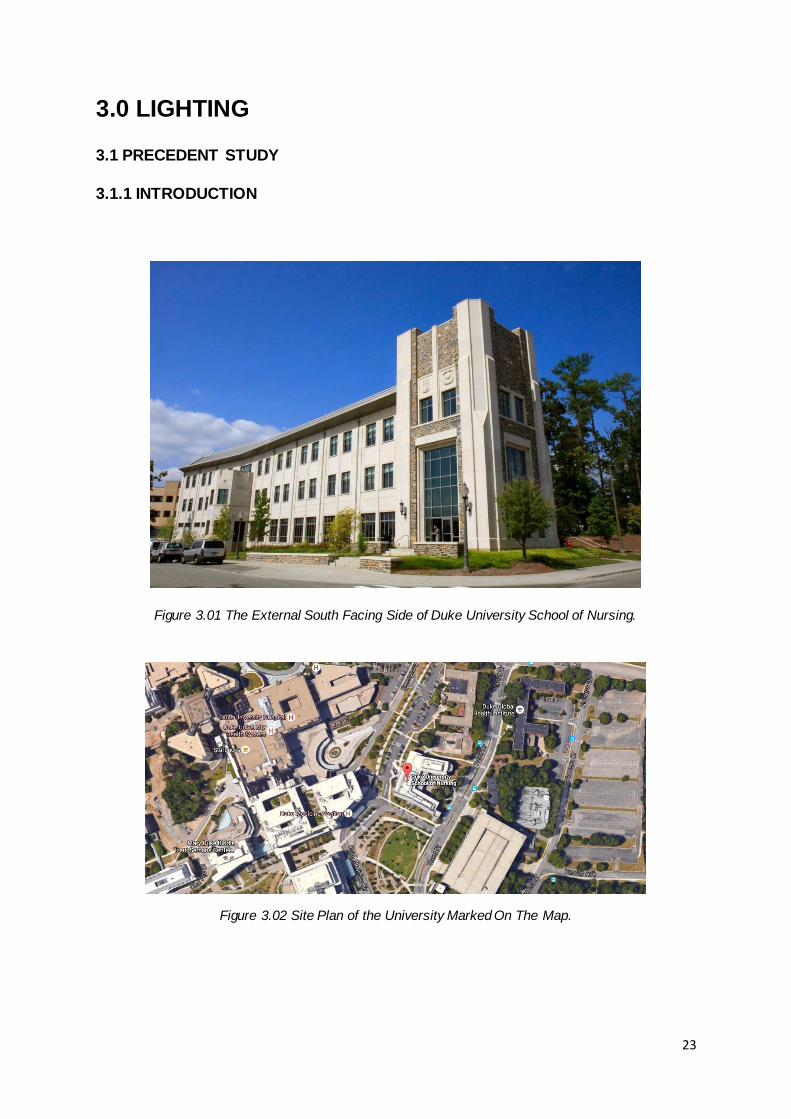
Figure 3.01 The External South Facing Side of Duke University School of Nursing.
Figure 3.02 Site Plan of the University Marked On The Map.

24
Located in Durham, North Carolina, along Trent Drive, sits Duke University School of
Nursing. Established in 1931 on January 2nd, it is currently ranked as 6th among the
best nursing schools in the U.S. as of 2016. However, for our particular precedent
studies, we are looking more in depth into the Cafe Duson located in the courtyard
which is located in the East facing side of the university.
Figure 3.03 Exterior of the Café Duson in 2010.
The main reason that this building and site was chosen as our focus for lighting
precedents was due to the similar layout as well as similarity of the facade of the
overall cafe with the floor to ceiling height glass curtain walls. This provides us a
platform in which we could get a good initial understanding on the properties and
materials that we would face in our study later on.

25
3.1.2 METHODOLODY
Figure 3.04 Site Boundary Highlighted on A Site Plan of the Café Duson.

26
Figure 3.05 Squares Showing Lights Whilst Triangles Indicate Lights That Are Not Shown On The
Plan.
The research started by looking at the exterior of the courtyard and how did the lighting
coming from the outside would eventually affect the lighting located inside the Cafe
Duson. The boundary line was set up and the materiality of the overall courtyard was
identified. Three types of surfaces were identified and their reflectance was also noted,
which were the following:
1. Natural Cleft Bluestone Walkway and Courtyard at 15% reflectance
2. Duke Stone Retaining Walls at 20% reflectance

27
3. Gray Painted Aluminum Mullions at 25% reflectance
Following that, other existing conditions of the exterior were identified and noted down
as well, including glazing, specifications of the existing site lighting as well as any of
the other existing lighting features as well.
Figure 3.06 Lights Being Pointed Through the Use of An Elevation Drawing.
Specifications and glazing values of the two identified types of glass are noted as
below:
1. 1” Insulated Glass Curtain Wall System of Café DUSON with U-Value of 0.57,
Transmittance of 0.55 and Shading Coefficient of 0.45
2. 1” Insulated Glass – Laminated (door glass) with U-Value of 0.57,
Transmittance of 0.55 and Shading Coefficient of 0.45

28
The specifications for the two types of lighting fixtures noted down below:
Figure 3.07 Courtyard Luminaire Schedule.
3.1.3 ANALYSIS
Through the research gathered as well as observations conducted on site, the exterior
does not seem to directly affect the interior as the spacing of the light as well as the
strength do not seem to contribute or affect the ambient luminosity of the interior of the
cafe. The surrounding landscape also provides sufficient shading that can help solve
any glares issues that may occur with the massive glass curtain walls that make up
the facade of the Cafe Duson.

29
3.2 CASE STUDY
3.2.1 SITE AND ZONING
Figure 3.08 Ground Floor Plan with Gridline of Greyskymorning Cafe.
Figure 3.09 Zoning Spaces of Greyskymorning Cafe.

30
3.2.2 DATA TABULATION AND ANALYSIS
*The lightings were recorded and measured at 1.0m and 1.5m respectively.
LIGHTING DATA
UNIT: LUX (lx)
HEIGHT: 1.5M (STANDING)
Figure 3.10 Non-peak Lux Reading at 1.5m According to Gridline.
1.5METER (LUX) PEAK HOURS 6.00PM - 6.15PM
GRID A B C D E F G H I J K
1 47 17 13 11 3 3 2 2 0.7 2 39 23 16 9 3 3 3 2 0.9 3 18 22 11 7 5 5 4 1 3 3 14
4 41 17 9 2 5 5 1 1 0.9 0.8 3
5 64 63 63 6 64 34 64 7 64 38 64
Figure 3.11 Peak Lux Reading at 1.5m According to Gridline.
LEGEND
A DINING RED
B KITCHEN YELLOW
C SERVICE BLUE
1.5METER (LUX) NON PEAK HOURS 11.30AM - 12.00PM
GRID A B C D E F G H I J K
1 255 85 60 62 33 21 12 15 7 2 252 148 93 32 15 12 10 12 11 3 192 144 83 55 43 45 44 31 15 12 34
4 75 61 53 33 10 15 11 12 8 11 16
5 195 193 55 6 230 225 33 7 221 218 45

31
LIGHTING DATA
UNIT: LUX (lx)
HEIGHT: 1.0M (SITTING)
Figure 3.12 Non-peak Lux Reading at 1.0m According to Gridline.
1.0METER (LUX) PEAK HOURS 6.00PM - 6.15PM
GRID A B C D E F G H I J K
1 42 15 10 10 3 3 2 1 0.3 2 58 23 12 11 2 2 1 1 0.5 3 21 24 15 11 4 4 3 3 4 3 15
4 51 20 11 15 4 4 2 2 1 1 4
5 23 22 22 6 32 32 32 7 36 36 36
Figure 3.13 Peak Lux Reading at 1.0m According to Gridline.
LEGEND
A DINING RED
B KITCHEN YELLOW
C SERVICE BLUE
1.0METER (LUX) NON PEAK HOURS 11.30AM - 12.00PM
GRID A B C D E F G H I J K
1 283 122 35 37 17 17 15 12 6 2 272 194 90 38 16 15 5 6 8 3 288 149 76 67 34 29 41 28 14 12 37
4 155 82 45 30 18 26 8 8 13 17 37
5 270 162 42 6 272 161 64 7 273 275 40

32
GRID NON PEAK HOURS 11.30AM - 12.00PM PEAK HOURS 6.00PM-6.15PM
A1 255 47
A2 252 39
A3 192 18
A4 75 41
A5 195 64
A6 230 64
A7 221 64
B1 85 17
B2 148 23
B3 144 22
B4 61 17
B5 193 63
B6 225 34
B7 218 38
C1 60 13
C2 93 16
C3 83 11
C4 53 9
C5 55 63
C6 33 64
C7 45 64
D1 62 11
D2 32 9
D3 55 7
D4 33 2
E1 33 3
E2 15 3
E3 43 5
E4 10 5
F1 21 3
F2 12 3
F3 45 5
F4 15 5

33
GRID NON PEAK HOURS 11.30AM - 12.00PM PEAK HOURS 6.00PM-6.15PM
G1 12 2
G2 10 3
G3 44 4
G4 11 1
H1 15 2
H2 12 2
H3 31 1
H4 12 1
I1 7 0.7
I2 11 0.9
I3 15 3
I4 8 0.9
J3 12 3
J4 11 0.8
K3 34 14
K4 16 3
Figure 3.14 Lux Reading at 1.5m. (Standing)
LEGEND
A DINING RED
B KITCHEN YELLOW
C SERVICE BLUE

34
GRID NON PEAK HOURS 11.30AM - 12.00PM PEAK HOURS 6.00PM-6.15PM
A1 283 42
A2 272 58
A3 288 21
A4 155 51
A5 270 23
A6 272 32
A7 273 36
B1 122 15
B2 194 23
B3 149 24
B4 82 20
B5 162 22
B6 161 32
B7 275 36
C1 35 10
C2 90 12
C3 76 15
C4 45 11
C5 42 22
C6 64 32
C7 40 36
D1 37 10
D2 38 11
D3 67 11
D4 30 15
E1 17 3
E2 16 2
E3 34 4
E4 18 4
F1 17 3
F2 15 2
F3 29 4
F4 26 4

35
GRID NON PEAK HOURS 11.30AM - 12.00PM PEAK HOURS 6.00PM-6.15PM
G1 15 2
G2 5 1
G3 41 3
G4 8 2
H1 12 1
H2 6 1
H3 28 3
H4 8 2
I1 6 0.3
I2 8 0.5
I3 14 4
I4 13 1
J3 12 3
J4 17 1
K3 37 15
K4 37 4
Figure 3.15 Lux Reading at 1.0m. (Sitting)
LEGEND
A DINING RED
B KITCHEN YELLOW
C SERVICE BLUE

36
INTERPRETATION AND ANALYSIS
Observation 1
The data collected at the height of 1.5m are mostly higher than the data collected at
the height of 1m from the floor.
Discussion and Analysis 1
The data collected at the height of 1.5m are closer to the artificial lighting. Because
the surrounding walls of the café are mostly made out of glass material, daylighting
from the curtain walls also affects the interior. Also, due to the building being an infill
building, the adjacent buildings may have shades that affects the reading at the 1.5m
height, causing it to be lower in some cases.
Observation 2
The light data collected during the non-peak hour of 11.30am is significantly higher in
grid A and B, moderately high in grid C and D and lower in the vicinity of grid I.
Discussion and Analysis 2
The higher lux reading data collected at Grid A and B are due to the lights coming in
from the adjacent curtain walls of the entrance. Between grid A2 and A3 is the
entrance door, the light coming in from the entrance door affects the data significantly
till grid B2 and B3. Grid C and D being the middle part of the building has a moderately
high reading due to the light coming in from the entrance door between Grid A2 and
A3. The data collected in grid E4, F4, G4, H4 and I4 are relatively low as the building
is an infill building. Although the walls are of a curtain wall, the lux reading is low as
the adjacent space is a dimly lit restaurant. The readings in grid I1 is low as the walls
are constructed of concrete material.

37
Observation 3
The data collected during the peak hour of 6.00pm shows a lower lux reading due to
the sun setting around that time. All of Grid A can be seen showing a higher lux reading
when compared to the other Grid readings.
Discussion and Analysis 3
The higher lux reading collected at Grid A is due to the surrounding curtain walls and
it being near the entrance door. Grid A is also adjacent facing west, which is the
evening sun.

38
3.2.3 MATERIAL SPECIFICATION
ZONE A (DINING)
Component Material Colour Surface Finish
Reflective Value (%)
Surface Area (m²)
Reflective Index
Ceiling
Metal deck
Black Matte 20 68.0 1.519
Wall
Brick wall
Brown Matte 15 10.94 1.519
Painted Wall
Black Matte 15 9.05 1.519
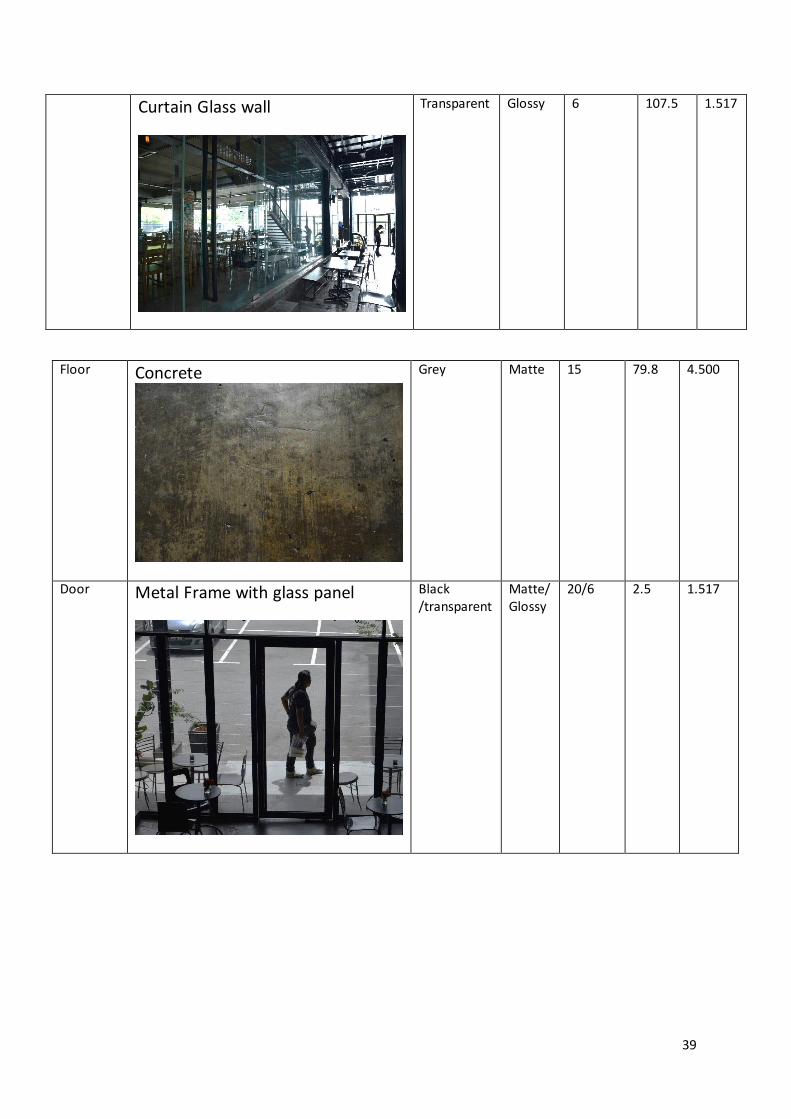
39
Curtain Glass wall
Transparent Glossy 6 107.5 1.517
Floor
Concrete
Grey Matte 15 79.8 4.500
Door
Metal Frame with glass panel
Black /transparent
Matte/ Glossy
20/6 2.5 1.517

40
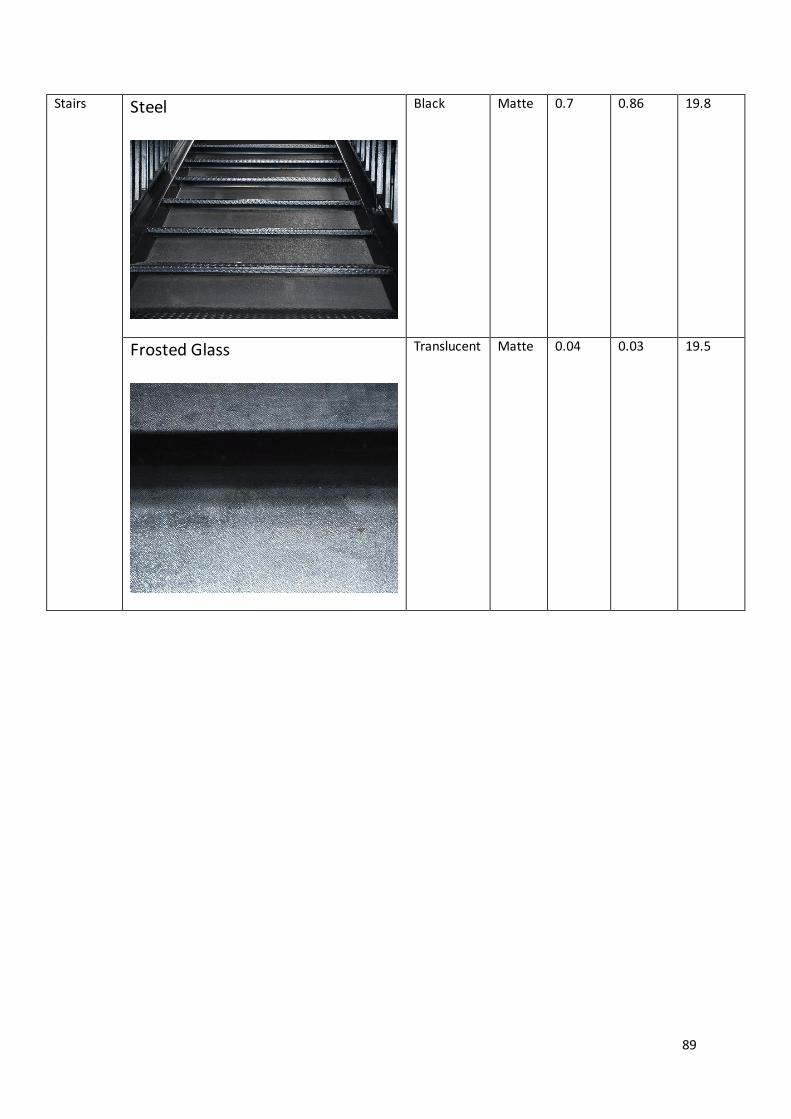
Stairs
Steel
Black Matte 20 19.8 1.519
Frosted Glass
Translucent Matte 8 19.5 1.517
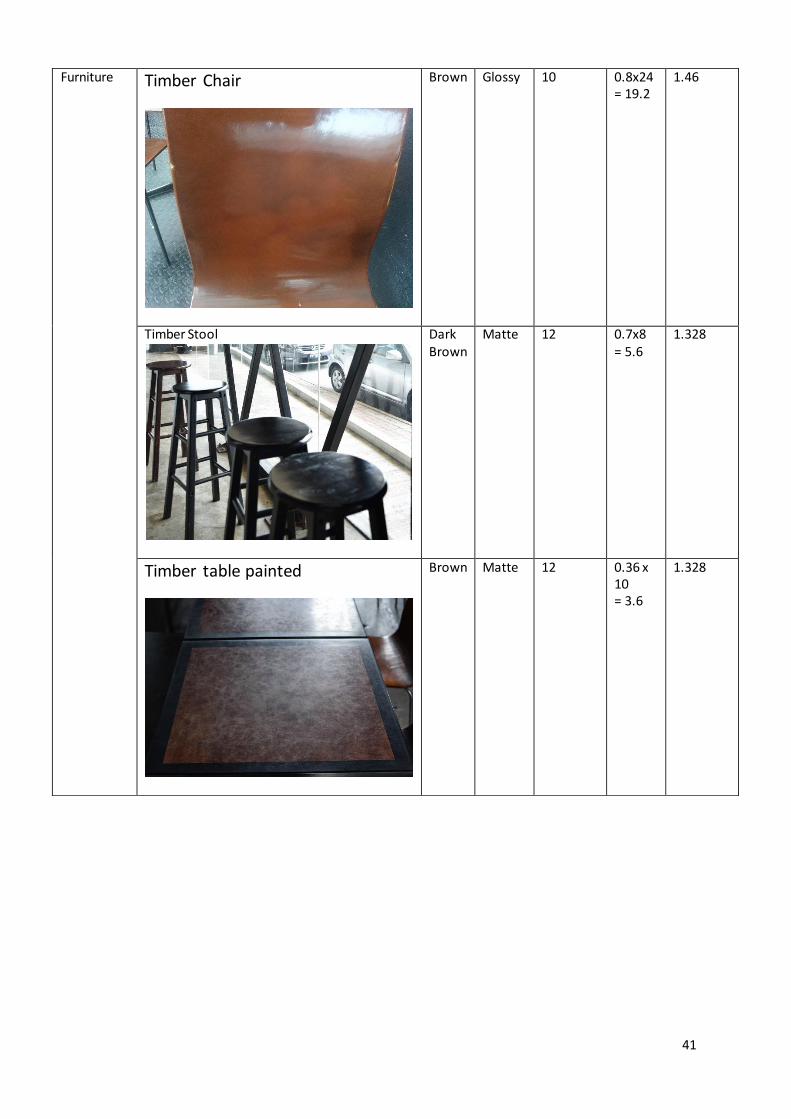
41
Furniture Timber Chair
Brown Glossy 10 0.8x24 = 19.2
1.46
Timber Stool
Dark Brown
Matte 12 0.7x8 = 5.6
1.328
Timber table painted
Brown Matte 12 0.36 x 10 = 3.6
1.328

42
Leather sofa
Black Matte 12 2.4 1.519
Reclaimed timber table
Brown Matte 12 1.1 1.328
Reclaimed palette coffee table
Brown Matte 12 0.9 1.328

43
ZONE B (KITCHEN)
Component
Material Colour Surface Finish
Reflective Value (%)
Surface Area (m²)
Reflective Index
Ceiling
Concrete
Grey Matte 15 22.5 4.500
Wall
Brick wall
Brown Matte 15 29.2 1.519
Floor
Concrete
Grey Matte 15 17.1 4.5

44
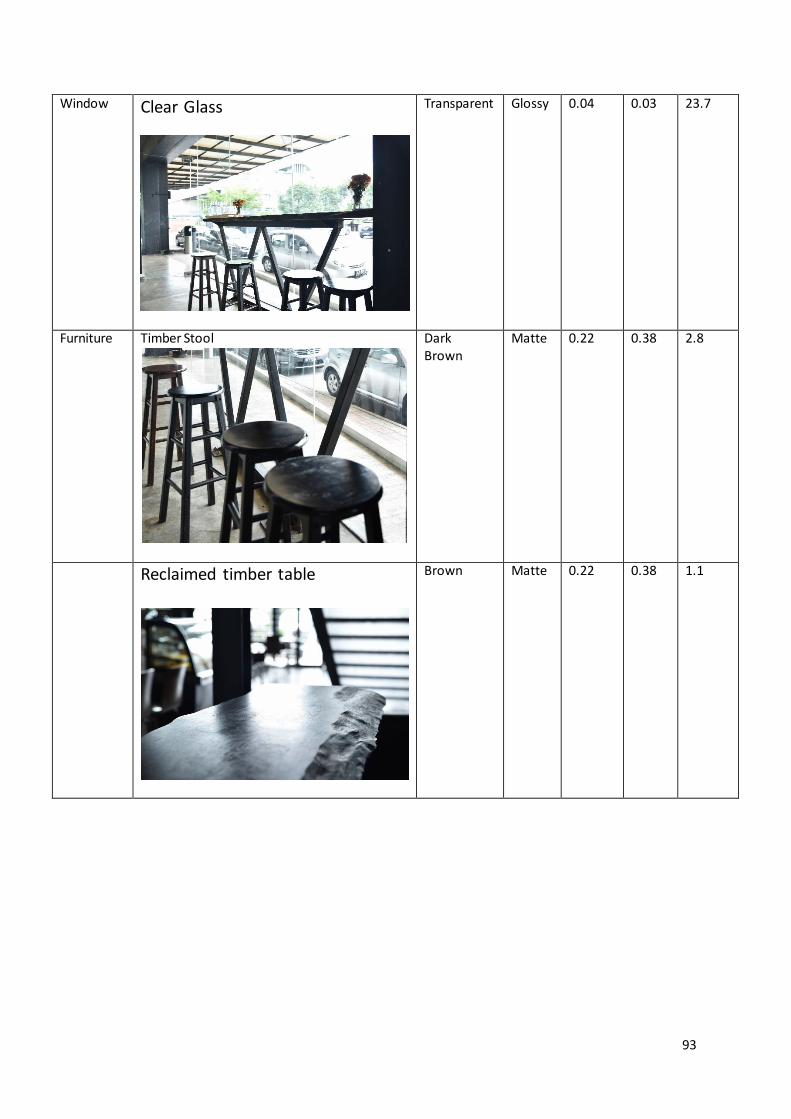
Window
Clear Glass
Transparent Glossy 6 23.7 1.517
Furniture Timber Stool
Dark Brown
Matte 12 0.7x4 = 2.8
1.328
Reclaimed timber table
Brown Matte 12 1.1 1.328

45
ZONE C (SERVICE)
Component
Material Colour Surface Finish
Reflective Value (%)
Surface Area (m²)
Reflective Index
Ceiling
Metal deck
Black Matte 20 6.65 1.519
Wall
Brick wall
Brown Matte 15 1.72 1.519
Curtain Glass wall
Transparent Glossy 6 31.3 1.517

46
Floor
Concrete
Grey Matte 15 8.4 4.5

47
3.2.4 ARTIFICIAL LIGHTING FIXTURES AND SPECIFICATIONS
Product Model Dowsing & Reynolds Vintage light bulb - squirrel cage filament (old fashioned Edison) E27 screw
Rated luminous flux 610 lm Colour rendering Index - Power 40 watts
Beam Angle - Function and Zone Placement Ceiling Lamp Dimmable - Colour Temperature 2200 Kelvin

48
Product Model LED bulb GU10 Rated luminous flux 400lm Colour rendering Index 90 Power 6W Beam Angle 36 degree Function and Zone Placement Spotlight beside entrance
Dimmable Yes Colour Temperature 2700K
49
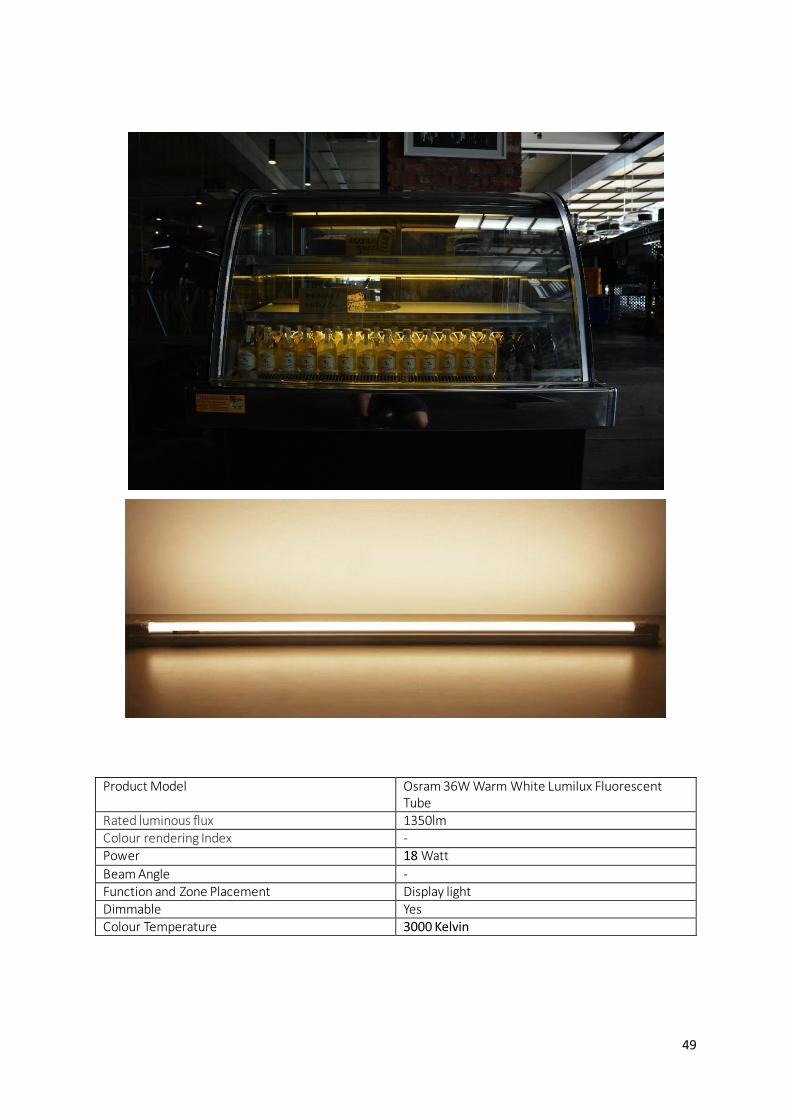
Product Model Osram 36W Warm White Lumilux Fluorescent Tube
Rated luminous flux 1350lm Colour rendering Index - Power 18 Watt
Beam Angle - Function and Zone Placement Display light Dimmable Yes Colour Temperature 3000 Kelvin

50
Product Model OSRAM Lumilux T8 Cool White
Rated luminous flux 1350lm Colour rendering Index - Power 36 Watt Beam Angle - Function and Zone Placement Display light
Dimmable Yes Colour Temperature 4000 Kelvin

51
3.2.5 DAYLIGHT FACTOR ANALYSIS
ZONE A (DINING)
Figure 3.16 Non-peak Hour (11.30AM) Zone Dining Space.
Figure 3.17 Image of Zone A Dining Space. (Lee,2016)

52
Daylight (11.30AM)
1.5m 157.25 1.0m 206.5 Average Flux 181.88
Figure 3.18 Daylight (11.30AM) Calculation for Zone A.
Zone Type Daylight Average Lux reading Daylight Factor, DF Performance based
level in based on collected on MS 1525
Malaysia E0 (Lx) data, Ex (Lx)
A Dining 12000 181.88
Fair
Figure 3.19 Daylight (11.30AM) Factor Calculation for Zone A.
Below is the daylight factors and distribution table obtained from the MS1525:
Figure 3.20 Daylight Factors and Distribution Table.
Based on MS1525, Zone A which is the dining area achieved an average lighting with
a daylight factor of 1.52%. With a daylight factor of 1.52% it can be considered dark,
however it is also a relaxing ambience for chilling and hanging out. Although the
surrounding walls are mostly curtain walls, light doesn’t really illuminate the interior
spaces. This is due to the surrounding buildings being dimly lit as well, therefore not
much lights are being transferred into the café dining spaces.
Zone DF (%) Distribution
Very bright > 6 Very large with thermal and glare problems
Bright 3 - 6 Good
Average 1 - 3 Fair
Dark 0 - 1 Poor
DF =181.88
12000x 100%
= 1.52%
DF =𝐸𝑥
𝐸𝑜x 100%
53
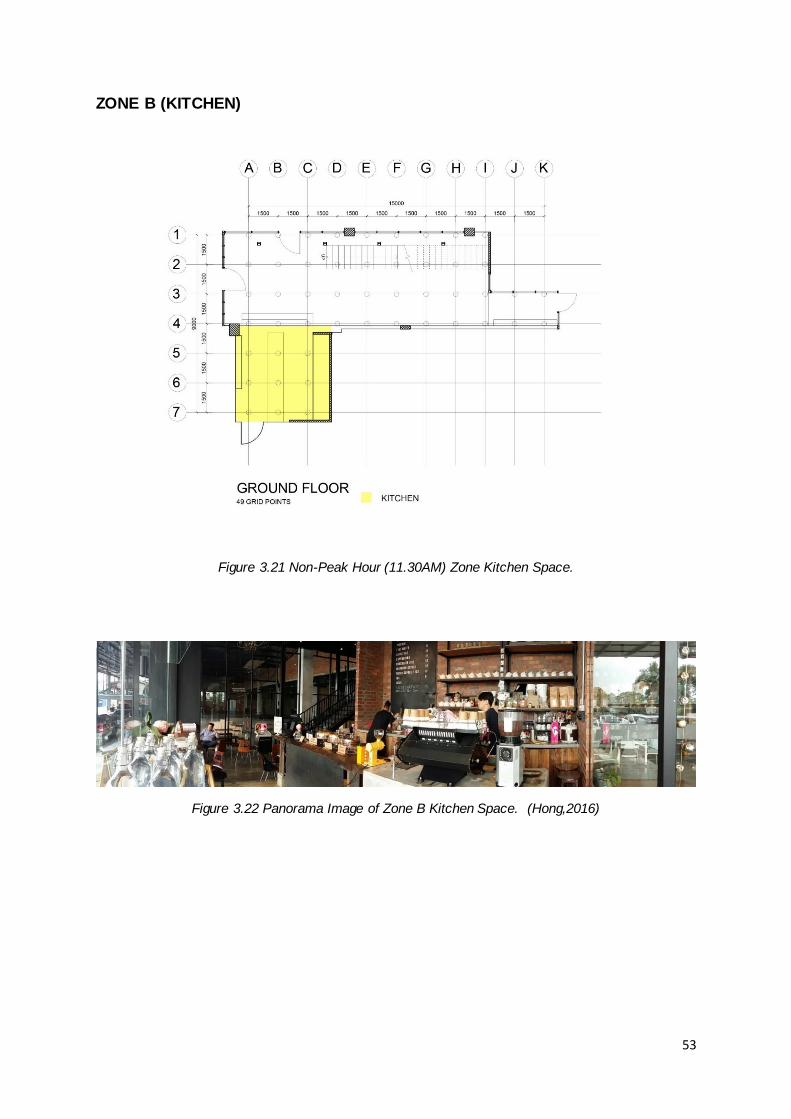
ZONE B (KITCHEN)
Figure 3.21 Non-Peak Hour (11.30AM) Zone Kitchen Space.
Figure 3.22 Panorama Image of Zone B Kitchen Space. (Hong,2016)

54
Daylight (11.30AM)
1.5m 123 1.0m 193.4 Average Flux 158.2
Figure 3.23 Daylight (11.30AM) Calculation for Zone B.
Figure 3.24 Daylight (11.30AM) Factor Calculation for Zone B.
Below is the daylight factors and distribution table obtained from the MS1525:
Figure 3.25 Daylight Factors and Distribution Table.
Based on MS1525, Zone B which is the kitchen space achieved an average lighting
with a daylight factor of 1.31%. The Kitchen space is located in front near the entrances
surrounded by curtain walls. The surrounding curtain walls help to illuminate the
spaces. However, it still resulted in an average lighting distribution. This is due to the
external overhang that helped to shelter the interior from the afternoon sun. The
façade is filled with overhangs that sheltered the ground floor from direct sun, providing
shade even for the outdoor sitting area.Thus, influencing the incoming light into the
kitchen space.
Zone Type Daylight
Average Lux
reading Daylight Factor, DF
Performance
based
level in based on collected
on MS 1525
Malaysia E0 (Lx) data, Ex (Lx)
B
Kitchen 12000 158.2
Fair
Zone DF (%) Distribution
Very bright > 6 Very large with thermal and glare problems
Bright 3 - 6 Good
Average 1 - 3 Fair
Dark 0 - 1 Poor
DF =158.2
12000x 100%
= 1.31%
DF =𝐸𝑥
𝐸𝑜x 100%

55
ZONE C (SERVICE AREA)
Figure 3.26 Non-Peak Hour (11.30AM) Zone Service Area.
Figure 3.27 Image of Zone C Service Area. (Wong,2016)

56
Figure 3.28 Daylight (11.30AM) Calculation for Zone C.
Zone Type Daylight
Average Lux
reading Daylight Factor, DF
Performance
based
level in based on collected on MS 1525
Malaysia E0 (Lx) data, Ex (Lx) C Service 12000 16.53
Poor
Figure 3.29 Daylight (11.30AM) Factor Calculation for Zone C.
Below is the daylight factors and distribution table obtained from the MS1525,
Figure 3.30 Daylight Factors and Distribution Table.
Based on MS1525, Zone C which is the Service Area achieved a daylight factor of
0.14%. It is considerably dark in the area with poor lighting distribution according to
MS1525. Being the service area, it does not require too much lighting as hardly anyone
goes there. The space is also not designed for any uses except to access outdoor
where the maintenance of air conditions are done. Although surrounded by curtain
walls, hardly any harsh lights penetrate the space. This is due to the surrounding tall
buildings outdoor that shields the spaces from direct sunlight.
Daylight (11.30AM)
1.5m 13.05 1.0m 20 Average Flux 16.53
Zone DF (%) Distribution
Very bright > 6 Very large with thermal and glare problems
Bright 3 - 6 Good
Average 1 - 3 Fair
Dark 0 - 1 Poor
DF =𝐸𝑥
𝐸𝑜x 100%
DF =16.53
12000x 100%
= 0.14%

57
3.2.6 ARTIFICIAL LIGHT ANALYSIS
ZONE A (DINING)
Dimension of room (L X
W)(m)
13.41m x
4.62m Total Floor Area, A (m²) 62m²
Type of Lighting Fixture LED bulb GU10
Dowsing & Reynolds Vintage light bulb
Number of Fixture, N 19 4 Lumen of Lighting Fixture, F (lm) 400 610 Height of Luminaire (m) 4.05 2.4 Height of work level (m) 0.8 0.8 Mounting height (m) 3.45 1.4 Reflection Factors
Ceiling- Concrete:3
Wall- Brick wall + Black Painted
Wall: 2.0
Floor- Concrete
Flooring: 3 Room Index, RI (K)
Utilisation Factor, UF 0.4 0.57 Maintenance Factor, MF 0.8 0.8 Illuminance Level - E (Lux)
Number of lamps required– N
*MS1525 Recommended Dining Illumination Level – 200 Lux
RI =13.41 x 4.62
(13.41 + 4.62) x 3.45
= 1.00
RI =13.41 x 4.62
(13.41 + 4.62) x 1.4
= 2.45
RI =L x W
(L + W) x H
E =19 (400 x 0.4 x 0.8)
62
= 39.22 E =
N x F x UF x MF
A
N =(200 − 39.22) x 62
( 610 x 0.57 x 0.8)
= 35.83 ⋍ 36
N =E x A
( F x UF x MF)
Analysis: The dining area of the café is under-lit and it requires another 32 Dowsing & Reynolds Vintage
light bulb to meet the requirements of MS1525. However, the cafe is surrounded by curtain walls which
allows light to brighten the interior during the day. Furthermore, the café only operates until 7pm,
therefore there is no need to worry for lighting issues during the night.

58
ZONE B (KITCHEN)
Dimension of room (L X W)(m) 4.88m x 4.89m
Total Floor Area, A (m²) 24m²
Type of Lighting Fixture LED bulb GU10
Number of Fixture, N 12
Lumen of Lighting Fixture, F (lm) 400
Height of Luminaire (m) 4.05
Height of work level (m) 0.8
Mounting height (m) 3.45
Reflection Factors Ceiling- Concrete : 3
Wall- Brick wall + Black Painted Wall : 2.0
Floor- Concrete Flooring : 3
Room Index, RI (K)
Utilisation Factor, UF 0.4
Maintenance Factor, MF 0.8
Number of lamps required – N
*MS1525 Recommended
Kitchen Illumination Level –
150 Lux
RI =L x W
(L + W) x H
RI =4.88 x 4.89
(4.88 + 4.89) x 3.45
= 0.71
N =E x A
( F x UF x MF)
N =150 x 24
( 400 x 0.4 x 0.8)
= 28.13 ⋍ 28
Analysis: The Counter/Kitchen area of the café is clearly under-lit. It would need another 16 bulbs to
meet the criteria of MS1525 Recommended Illumination level. By changing the bulbs to a higher lumen
can also be an alternative solution.

59
ZONE C (SERVICE)
Dimension of room (L X W)(m) 3.60m x1.67m
Total Floor Area, A (m²) 6m²
Type of Lighting Fixture Dowsing & Reynolds Vintage light bulb
Number of Fixture, N 1
Lumen of Lighting Fixture, F (lm) 610
Height of Luminaire (m) 2.4
Height of work level (m) 0.8
Mounting height (m) 1.4
Reflection Factors Ceiling: Concrete : 3
Wall: Brick wall + Black Painted Wall : 2.0
Floor: Concrete Flooring : 3
Room Index, RI (K)
Utilisation Factor, UF 0.57
Maintenance Factor, MF 0.8
Number of lamps required – N
*MS1525 Recommended Service Platform Illumination Level - 50 Lux
RI =L x W
(L + W) x H RI =
3.60 x 1.67
(3.60 + 1.67) x 1.4
= 0.81
N =E x A
( F x UF x MF)
N =50 x 6
( 610 x 0.57 x 0.8)
= 1.08 ⋍ 1
Analysis: The service area of the café is sufficiently lit as its illumination level meet the MS1525
Recommended illumination level of 50 Lux with the installed artificial lightings.
60
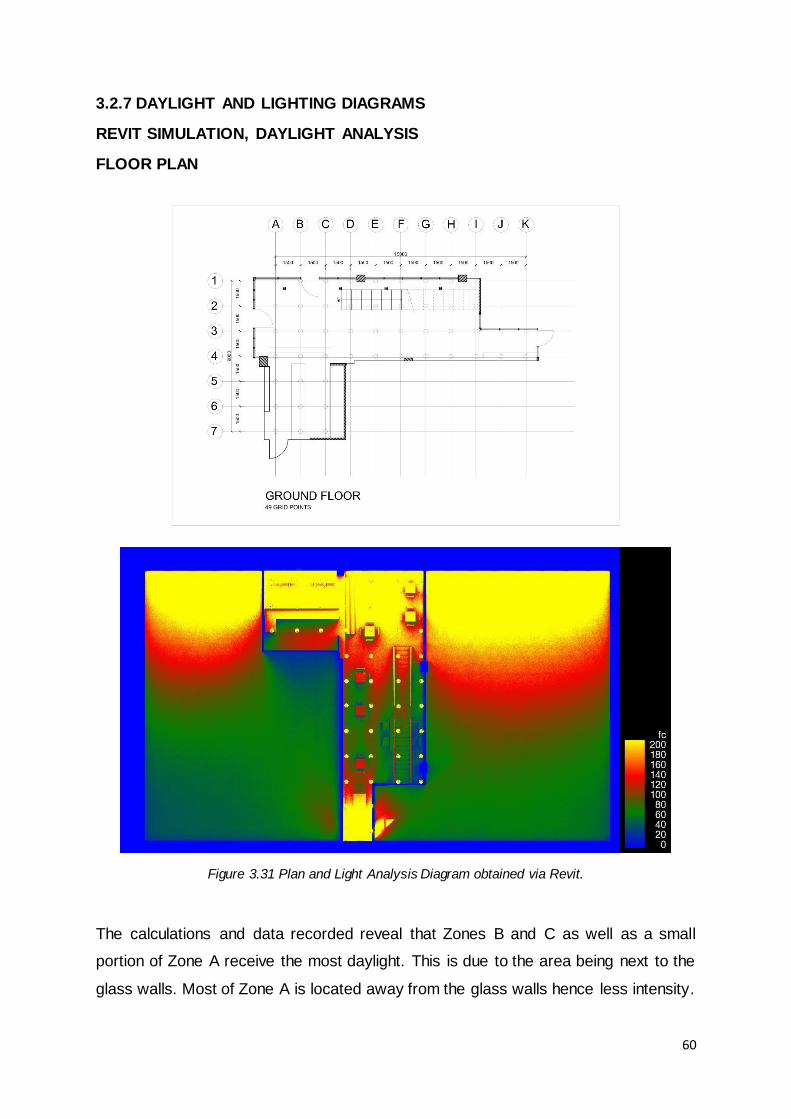
3.2.7 DAYLIGHT AND LIGHTING DIAGRAMS
REVIT SIMULATION, DAYLIGHT ANALYSIS
FLOOR PLAN
Figure 3.31 Plan and Light Analysis Diagram obtained via Revit.
The calculations and data recorded reveal that Zones B and C as well as a small
portion of Zone A receive the most daylight. This is due to the area being next to the
glass walls. Most of Zone A is located away from the glass walls hence less intensity.

61
DAYLIGHT ANALYSIS
ZONE A (DINING)
Figure 3.32 Plan and Light Analysis Diagram obtained via Revit.
Zone A is very well lit even though the intensity of the daylight reduces by quite a far
amount in the middle of the zone. The glass walls surrounding the zone allow for ample
daylight to enter the zone without the use of much artificial lighting needed, saving
costs.

62
DAYLIGHT ANALYSIS
ZONE B (KITCHEN)
Figure 3.33 Plan and Light Analysis Diagram obtained via Revit.
Zone B receives the most natural light among all the zones as it is nearest to the glass
walls. Furthermore, the zone is flanked by sides that allow for daylight to pass through
as well. This well-lit area means that throughout the day no artificial lighting is needed
to provide better illumination.

63
DAYLIGHT ANALYSIS
ZONE C (SERVICE)
Figure 3.34 Plan and Light Analysis Diagram obtained via Revit.
Zone C is situated at the rear of the building and also receives a substancial amount
of natural light as it is surrounded on 3 sides by glass walls. Little to no artificial lighting
is needed in this zone as well, except in the case of during evenings.
64
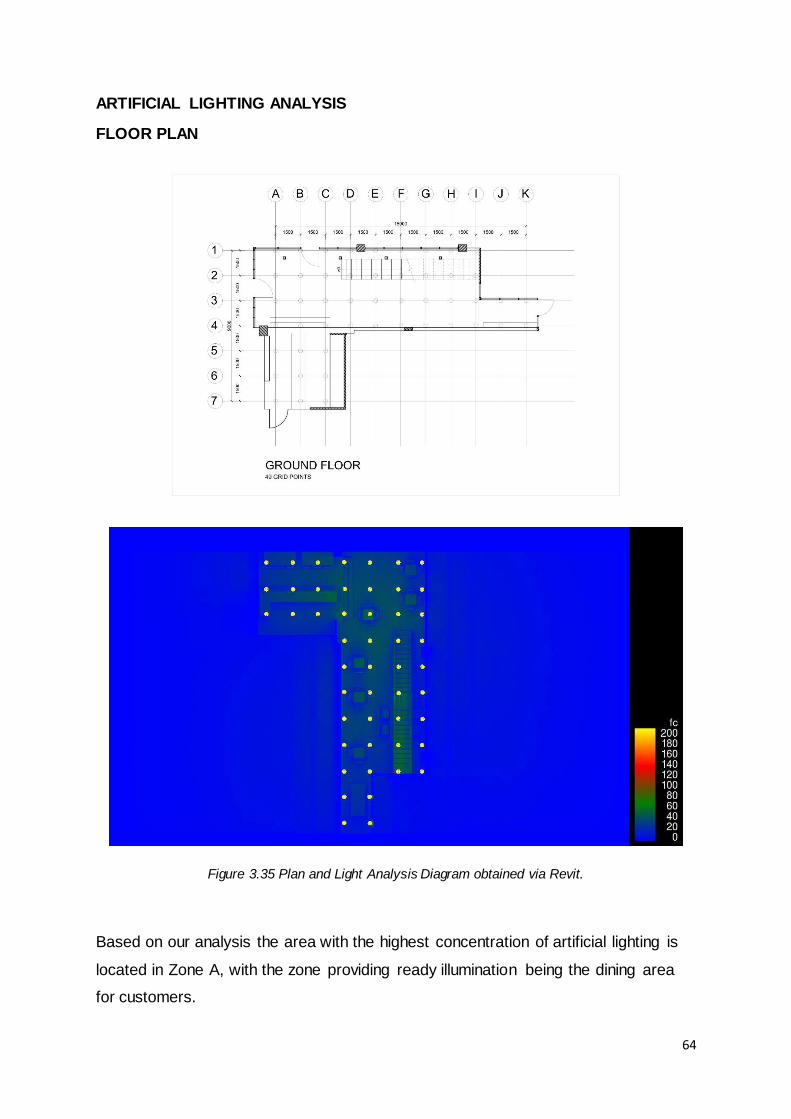
ARTIFICIAL LIGHTING ANALYSIS
FLOOR PLAN
Figure 3.35 Plan and Light Analysis Diagram obtained via Revit.
Based on our analysis the area with the highest concentration of artificial lighting is
located in Zone A, with the zone providing ready illumination being the dining area
for customers.

65
ARTIFICIAL LIGHTING ANALYSIS
ZONE A (DINING)
Figure 3.36 Plan and Light Analysis Diagram obtained via Revit.
Zone A is most commonly exposed to artificial lighting by the fact that it is the location
of space usage by the customers and hence extra lighting is needed when possible.
The lighting fixtures are located on the walls and ceilings.

66
ARTIFICIAL LIGHTING ANALYSIS
ZONE B (KITCHEN)
Figure 3.37 Plan and Light Analysis Diagram obtained via Revit.
Zone B receives the least amount of artificial lighting assistance due to the fact that
most of the time it isn’t needed as a result of exceptional use of natural lighting.
However, ceiling lights are installed in the event that artificial lighting is needed. Most
of the time, these lights are left off.

67
ARTIFICIAL LIGHTING ANALYSIS
ZONE C (SERVICE)
Figure 3.38 Plan and Light Analysis Diagram obtained via Revit.
Zone C also receives little to no artificial light assistance, with only a few lights in place
in the event that it is needed. Usually the natural daylight is sufficient to light the area.

68
3.2.8 LIGHTING ANALYSIS
Figure 3.39 Dining Area Facing the West Sun. (Wong,2016)
Having the front façade facing west, the evening sun lights up the interior spaces
during the evening. In the picture shown above, the entrance is seen allowing light into
the premise. With the curtain wall installation, lights illuminate the spaces allowing for
a natural light experience. Thus, also reducing the need and reliance on artificial
lighting throughout the day.
Figure 3.40 Kitchen Space Facing the West Sun. (Wong,2016)

69
The Kitchen space are also illuminated by natural light mostly. During the evening, the
west sun illuminates the interior spaces through the curtain wall. Thus, it fully optimizes
the daylighting of the evening sun in the space.
Figure 3.41 Service Area Facing the Morning Sun. (Wong,2016)
The back of the café has a service area which leads to the outdoor space for
maintenance of the air conditioner. Surrounded by curtain wall, natural light illuminates
the surrounding area, thus also reducing the reliance on artificial lightings. It can be
observed that the service area only requires a single light bulb to achieve sufficient
daylighting. Although it is considered a poor lighting distribution, however according to
MS1525, a service area is sufficiently lit to 50 Lux.

70
Figure 3.42 Natural Skylight Illuminates The Interior Spaces. (Wong,2016)
The front part of the dining spaces is also lit by natural skylight in the café. Thus,
allowing natural light from the roof top to illuminate all the way to the ground floor. With
the openings, it allows for the reduction and reliance on artificial lightings in the space.
Figure 3.43 Kitchen Area Illuminated with Warm Spotlights. (Hong,2016)
Even with all the natural lightings and transparencies, artificial lightings are also
installed to light up the interior spaces and aids the café in illuminating during the
morning or evening.

71
Although artificial lightings can provide certain aesthetic and mood to the spaces, it also
serves in a very practical manner. For instance, the kitchen area has several spotlights which
helps illuminates the menu items. It also helps the baristas to prepare the drinks in dimly lit
situations. The kitchen which also acts as a counter, needs to be brightly lit up to allow
customers to better view the menu and so on. Surrounded in conjunction with curtain wal ls,
the kitchen/counter area is brightly lit up by natural and artificial lightings to serve for both a
practical and aesthetic manner.
Figure 3.44 Dining Spaces Illuminated with Warm Spotlights. (Hong,2016)
The middle area of the café which houses the dining spaces are also lit up by artificial lightings
throughout most of the day. Although surrounded by curtain walls and having several
openings nearby like the stairs, it is still not enough to provide a fair daylighting distribution.
Though with artificial lights, it can achieve the desired daylighting results with a warm mood
as a bonus.
Figure 3.45 Warm Mood Created by Artificial Lightings. (Wong,2016)
72
To provide a better level of illumination, the interior finishes plays a huge role. For instan ce,
the slightly tinted glass of the curtain walls decreases the glaring issues when sunlight
penetrates the interior spaces of the building. Thus, helping the user feel more comfortable
gazing outside. Moreover, the natural skylight from the rooftop decreases the usage of
artificial lightings to achieve the sufficient daylight illumination of the interior spaces. With
the inclusion of minimal artificial lightings, the interior spaces can be illuminated to desired
levels and yet still achieve the mood and aesthetic that was aimed for. Thus, creating a warm,
natural and cozy feeling to the users.

73
4.0 ACOUSTICS
4.1 PRECEDENT STUDY
4.1.1 INTRODUCTION
Figure 4.01 Sky City and the Auckland Skyline. (http://vizts.com/901-2/)
Figure 4.02 Site of Sky City in Auckland. (Google Maps)

74
In this precedent study, the Sky City Casino and Conference Centre in Auckland was
undergoing a renovation, an existing conference room is to be converted into a bar/
nightclub. The Marshall Day Acoustics were engaged in order to design a sound
insulation device to mitigate the noise transmission from the bar to the hotel suites
which are located on level 4, one floor above the bar’s new location which is on level
3. Complaints were made previously from the hotel as noise can be heard from the
conference room when amplified music was being played. After performing noise
reduction measurements before and after the renovation, it was considered that the
concrete slab between the hotel rooms and conference space was the primary
medium for sound transmission and so design solutions will be focus on the medium.
4.1.2 OBJECTIVES AND ISSUES
Since that the concrete slab was the cause of the noise transmission between the two
floors, an acoustic ceiling is design in order to mitigate and minimize the noise
transmission that affects the concrete slab. This had to be achieved with a buildable
and affordable solution that could accommodate the services and architectural issues
that are existing. The existing structure of the building was remaining and as such
there is no leeway for structural changes. The immediate obvious solution is to achieve
a high degree of transmission loss at low frequencies from the planned acoustic ceiling
as any mid-high frequency components of the music would be attenuated through the
structure itself and hence it was merely a low frequency problem at 63 Hz - 125 Hz.
4.1.3 EXISTING CONSTRUCTION
Figure 4.03 Hotel Layout.

75
All of the hotel suites are located one floor above the converted conference space and
they all share the same floor slab. The shared ceiling floor is 120 Hibond which gives
an average concrete thickness of 90 mm. The ceilings in the conference room was a
perforated acoustic ceiling and the walls on both the hotel levels and the conference
room were made of lightweight drywall construction.
Figure 4.04 Lightweight Drywall.
Figure 4.05 Perforated Acoustic Ceiling Tiles.

76
4.1.4 PRE-RENOVATION MEASUREMENTS
Measurements were carried out in the conference room before renovation to
determine the sound insulation provided by the existing structure.
Audio equipment were used to generate the high noise levels required. Independently,
pink noise and a dance music sample were amplified to a reverberant level of L𝑒𝑞 95-
97 dBA in the conference room. Pink noise and dance music samples were used to
measure the level of noise received in the five hotel suites on Level 4.
Reverberant levels of the pink noise generated in the conference room were :
● L𝑒𝑞 105 dB @ 63 Hz
● L𝑒𝑞101 dB @ 125 Hz
In suite 5, the pink noise was barely audible above the ambient noise levels. In Fact
the bass beat of the dance music was barely detectable hence measurements in this
room were discarded.
All measurements here were slightly affected by the traffic from the surrounding
neighbourhood and nearby construction noise. The table below summarizes the
results obtained.
Figure 4.06 Pre-Renovation Measured Noise Levels.

77
4.1.5 DESIGN STANDARD
Sound received from dance music and live bands normally consist of a rhythmic low
frequency tone. When this noise is clearly identifiable from above the ambient noise
levels in a bedroom than it is likely to be a nuisance to the occupants. As such, the
ambient noise levels in the hotel suites were used as a benchmark for a design
criterion. It is clear that it would not be practically possible to achieve acceptable noises
in all the hotel suites from the previous measurement. Hence, the objective is to
mitigate as much of the noise as practically possible.
4.1.6 FINAL TREATMENT
An acoustic ceiling is to be incorporated into the architectural ceiling and would be
suspended 2 meters below the bottom of the slab in order to avoid the structural
steelwork with the construction as follow:
● 120 mm Hibond slab;
● 2000 mm air gap accommodating structural steelwork and services;
● 3 layers of R1.8, 75 mm Pink Batts insulation
● Ceiling consisting of 1 layer 21 mm plywood and 2 layers 13 mm Gib Noiseline
suspended on spring hangers
4.1.7 COMMISSIONING MEASUREMENTS
Sound insulation performance of the acoustic ceiling was measured in the same way
as the pre-renovation measurements once the refitting is complete. The table below
summarizes the results:

78
Figure 4.07 Commissioning Measured Noise Levels.
A comparison with the before and after measurements gives an indication that an
improved sound insulation has been achieved with the acoustic ceiling.
Low frequency noise level in the hotel room has a moderate increase from the noise
cause by the bar. However, there was no change to the A-weighted noise levels in the
rooms. Dance music was played at high levels in the bar and a moderately low level
of low frequency was detectable in the hotel suites.
4.1.8 DISCUSSION AND CONCLUSION
The sound insulation performance resulting from the measurement has an
improvement from the previous measurement due to the installation of the acoustic
ceiling but it was not as great as predicted theoretically. This shortcoming of
performance was already expected and most likely cause by the nature of the field
conditions, possible material variations in the building products and also some flanking
transmission through other paths.
The level of noise generated by the bar need to be limited to approximately 95 dB at
63 Hz and 92 dB at 125 Hz in order to control the transmission of low frequency noise
and this in turn would limit the number of complaints received. As a conclusion, the
bar/night club has now been undergoing operation successfully for several months
since the installation. As predicted, they were occasional complaints made by the
guest staying at the hotel in rooms above which are most affected by the bar. However,
the overall result is such that the acoustic ceiling design is considered to be successful
in being a sound insulation.

79
4.2 CASE STUDY
4.2.1 SITE AND ZONING
NOISE IDENTIFICATION
TYPE OF EXTERNAL SOUND SOURCE DESCRIPTION
The macro site is surrounded by main roads
which are heavily used by cars throughout the
day (highlighted red). However, due to the
location of the site noise factor from these main
roads are almost unnoticeable. As for the micro
site, the surrounding roads of the site is used
heavily by many types of vehicles including
lorries and trucks, and produce a high level of
noise. However, the noise is reduced as the site
is enclosed in an area, and the building
surrounded by other adjacent buildings
dampening outdoor noise and keeping noise
pollution to a minimum.
The neighboring buildings, although vary in
activities do not serve any real noise intrusion to
the building, as the operational hours do not
coincide with many of the activities. For instance,
church activities on one side is normally
conducted before or after the café operation
hours and the restaurant is always constantly low
on noise volume.
One area in which that the café receives external
noise is located at the back, where the air
condition condensers are located. Fully
functional during opening hours, they constantly
blare out bland humming tone at up to 54dB
which is most obvious at the back of the café.
Towards the front the sound is eliminated from
the brick wall.

80
SITE ZONING
Figure 4.08 Gridlines Which Are Used to Collect Acoustic Data.
The gridline, established together with the lighting data collection grid, is also used to
gather acoustic measurements in and around the building, with a 1.5m spacing in
between each grid point, forming a total of 49 grid points.

81
4.2.2 DATA TABULATION AND ANALYSIS
*The acoustics were recorded and measured at 1.5m.
ACOUSTIC DATA
UNIT: DECIBEL (dB)
HEIGHT: 1.5M (STANDING)
Figure 4.09 Non-Peak Acoustic Reading.
Figure 4.10 Non-Peak Acoustic Reading.
Non Peak Hour 11.30AM - 12.00PM GRID A B C D E F G H I J K
1 60.3 61.3 62.9 61.5 61.4 62.3 61.3 62.8 64.3
2 60.4 60.7 60.2 66.7 61.3 61.7 61.8 62.7 63.9
3 61.1 62 68.3 62 68.4 62.7 63.2 63.3 63.4 67.8 71.2
4 60.6 70.4 72 63.2 64.2 66.6 65.3 65.4 66.2 68.2 69.2
5 58 58.3 60.4 6 60 59 63.5
7 60 59.4 58.6
Non Peak Hour 11.30AM - 12.00PM GRI
D A B C D E F G H I J K
1 1.07E
-06 1.35E
-06 1.95E
-06 1.41E
-06 1.38E
-06 1.69E
-06 1.34E
-06 1.90E
-06 2.69E
-06
2
1.10E
-06
1.17E
-06
1.05E
-06
4.67E
-06
1.34E
-06
1.47E
-06
1.51E
-06
1.86E
-06
2.45E
-06
3 1.29E
-06 1.58E
-06 6.76E
-06 1.58E
-06 6.91E
-06 1.86E
-06 2.08E
-06 2.13E
-06 2.18E
-06 6.02E
-06 1.31E
-06
4 1.15E
-06 1.10E
-06 1.58E
-05 2.08E
-06 2.63E
-06 4.57E
-06 3.38E
-06 3.46E
-06 4.16E
-06 6.60E
-06 8.31E
-06
5 6.30E
-07 6.76E
-07 1.10E
-06
6 1.00E
-06 7.94E
-07 2.24E
-06
7
1.00E
-06
8.71E
-07
7.24E
-07

82
Figure 4.11 Peak Acoustic Reading.
Figure 4.12 Peak Acoustic Reading.
Peak Hour 5pm-5.15pm GRID A B C D E F G H I J K
1 65 63 67 69 69 68 67 67 65
2 65 64 66 71 71 67 64 66 64
3 66 68 65 66 66 65 69 66 65 69 75
4 68 70 67 71 70 68 67 68 67 74 78
5 70 71 77 6 72 73 76
7 64 65 75
Peak Hour 5pm-5.15pm GRID A B C D E F G H I J K
1
3.16E
-06
1.99E
-06
5.01E
-06
7.94E
-06
7.94E
-06
6.30E
-06
5.01E
-06
5.01E
-06
3.16E
-06
2 3.16E
-06 2.51E
-06 3.98E
-06 1.25E
-05 1.25E
-05 5.01E
-06 2.51E
-06 3.98E
-06 2.51E
-06
3
3.98E
-06
6.30E
-06
3.16E
-06
3.98E
-06
3.98E
-06
3.16E
-06
7.94E
-06
3.98E
-06
3.16E
-06
7.94E
-06
3.16E
-05
4 6.30E
-06 1.00E
-05 5.01E
-06 1.25E
-05 1.00E
-05 6.30E
-06 5.01E
-06 6.30E
-06 5.01E
-06 2.51E
-05 6.30E
-05
5 1.00E
-05 1.25E
-05 5.01E
-05
6
1.58E
-05
1.99E
-05
3.98E
-05
7 2.51E
-06 3.16E
-06 3.16E
-05
83
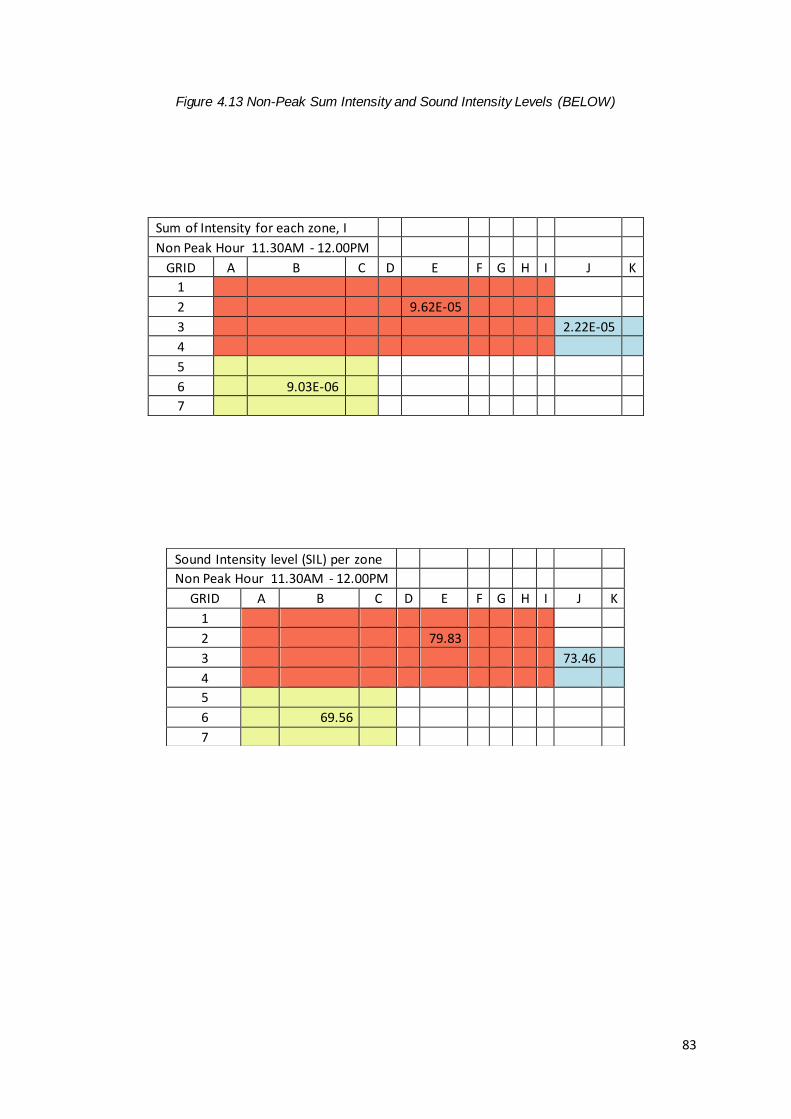
Figure 4.13 Non-Peak Sum Intensity and Sound Intensity Levels (BELOW)
Sum of Intensity for each zone, I
Non Peak Hour 11.30AM - 12.00PM
GRID A B C D E F G H I J K
1 2 9.62E-05 3 2.22E-05
4
5
6 9.03E-06 7
Sound Intensity level (SIL) per zone Non Peak Hour 11.30AM - 12.00PM
GRID A B C D E F G H I J K
1
2 79.83
3 73.46
4
5 6 69.56 7

84
Figure 4.14 Peak Sum Intensity and Sound Intensity Levels (BELOW)
Sum of Intensity for each zone, I Peak Hour 5pm-5.15pm
GRID A B C D E F G H I J K
1
2 2.00E-04
3 1.28E-04
4
5 6 1.86E-04 7
SIL Peak Hour 5pm-5.15pm GRID A B C D E F G H I J K
1 2 83.01
3 81.07
4
5 6 82.7 7

85
INTERPRETATION AND ANALYSIS
Observation 1
There is a peak of 70.4dB in grid B4.
Discussion and Analysis 1
Grid B4 is situated near the barista counter where the making of coffee and the
machinery sound are produced.
Observation 2
There is a significant rise in decibels in grid k3 and k4.
Discussion and Analysis 2
There is a backdoor adjacent between grid k3 and k4. Outside the perimeter are the
placement of the outdoor condensers which are required to operate the air conditioner
of the café and the nearby restaurant. The rise in decibels in grid k3 and k4 are due to
the sound coming from the outdoor spaces.
Observation 3
During the non-peak hour (11.30am), Grid B4 and C4 can be seen having a
significantly higher decibel when compared to the rest.
Discussion and Analysis 3
The reason it has a higher decibel reading could be due to the placement of the cake
display cabinet/fridge. Another reason could be during the time of measurement, the
Ice blender located in the kitchen area is being used.

86
Observation 4
During the peak hour (6.00pm), a rise of decibels in the collected data is observed.
Discussion and Analysis 4
The data collected shows a rise in decibels during the peak hour. Working adults and
university students hang out in the café after classes and work. There were more
people in the café at the time, chatting, talking and discussing on things. Thus, the
higher reading. Moreover, during the peak hour, music was even played in the
background. No music was playing in the background during the non-peak hour visit.
Observation 5
During the peak hour (6.00pm), a rise of decibels in Grid B5, B6, C5, C6 and C7 are
collected and measured.
Discussion and Analysis 5
The higher decibels in Grid B5, B6, C5, C6 and C7 are due to the coffee machines,
grinders and etc. working to meet the demand of the customers during the peak hour
of 6pm.

87
4.2.3 MATERIAL SPECIFICATION
ZONE A (DINING)
Component Material Colour Surface Finish
Absorpti
on Coefficie
nt (500 Hz)
Abso
rption
Coefficient (200
0 Hz)
Surface Area (m²)
Ceiling
Metal deck
Black Matte 0.7 0.86 68.0
Wall
Brick wall
Brown Matte 0.02 0.02 10.94
Painted Wall
Black Matte 0.02 0.02 9.05

88
Curtain Glass wall
Transparent Glossy 0.04 0.03 107.5
Floor
Concrete
Grey Matte 0.05 0.05 79.8
Door
Metal Frame with glass panel
Black /transparent
Matte/ Glossy
0.04 0.03 2.5
89
Stairs
Steel
Black Matte 0.7 0.86 19.8
Frosted Glass
Translucent Matte 0.04 0.03 19.5

90
Furniture Timber Chair
Brown Glossy 0.22 0.38 0.8x24 = 19.2
Timber Stool
Dark Brown
Matte 0.22 0.38 0.7x8 = 5.6
Timber table painted
Brown Matte 0.22 0.38 0.36 x 10 = 3.6

91
Leather sofa
Black Matte 0.28 0.28 2.4
Reclaimed timber table
Brown Matte 0.22 0.38 1.1
Reclaimed palette coffee table
Brown Matte 0.22 0.38 0.9

92
ZONE B (KITCHEN)
Ceiling
Concrete
Grey Matte 0.05 0.05 22.5
Wall
Brick wall
Brown Matte 0.02 0.02 29.2
Floor
Concrete
Grey Matte 0.05 0.05 17.1
93
Window
Clear Glass
Transparent Glossy 0.04 0.03 23.7
Furniture Timber Stool
Dark Brown
Matte 0.22 0.38 2.8
Reclaimed timber table
Brown Matte 0.22 0.38 1.1

94
ZONE C (SERVICE)
Ceiling
Metal deck
Black Matte 0.7 0.86 6.65
Wall
Brick wall
Brown Matte 0.02 0.02 1.72
Curtain Glass wall
Transparent Glossy 0.04 0.03 31.3

95
Floor
Concrete
Grey Matte 0.05 0.05 8.4

96
4.2.4 FIXTURES AND SPECIFICATIONS
Type of Sound Source Product Model
Units and zone Placement
Wattage Voltage Noise Level
Acson Wall
Mounted Split G series R22 Model
1 unit at Zone B 880 220 52dB
York Floor Ceiling Convertible
Deluxe R410A
1 unit at Zone C 1130 220 55dB
JAMAJKA 1.3W
1 unit at Zone A 1300 220 52dB
Xs-160yx Glass Top Deep
Freezers Mini Ice Cream
Display Freezer
1 unit at Zone A - 220 50dB
Berjaya Counter
Chiller CC2100-S
1 unit at Zone B 618 220 50dB

97
KDK Ceiling Fan
KY14X8MC
-3 units at Zone A
-1 unit at Zone B
760 230 45dB
Phillips Rice Cooker HD3027
1 unit at Zone B 650 220 49dB
Anfim
Caimano Coffee Grinder
1 unit at Zone B 450 220 80dB
Sharp Countertop
Microwave Oven 0.9 CU.
FT. 900W
1 unit at Zone B 900 120 58dB

98
Keesvanderwestern Mirage
1 unit at Zone B 3600 220 85dB
APPLIANCES INTENSITY CALCULATION
Source Noise Level (dB) Intensity, I
Acson Wall Mounted Split G
series R22 Model
52 1.5849E-07
York Floor Ceiling Convertible Deluxe R410A
55 3.1623E-07
JAMAJKA 1.3W 52 1.5849E-07
Xs-160yx Glass Top Deep Freezers Mini Ice Cream
Display Freezer
50 0.0000001
Berjaya Counter Chiller CC2100-S
50 0.0000001
KDK Ceiling Fan KY14X8MC 45 3.1623E-08
Phillips Rice Cooker HD3027 49 7.9433E-08
Anfim Caimano Coffee Grinder 80 8.71E-07
Sharp Countertop Microwave
Oven 0.9 CU. FT. 900W
58 0.0004
Keesvanderwestern Mirage 85 3.1623E-04
99
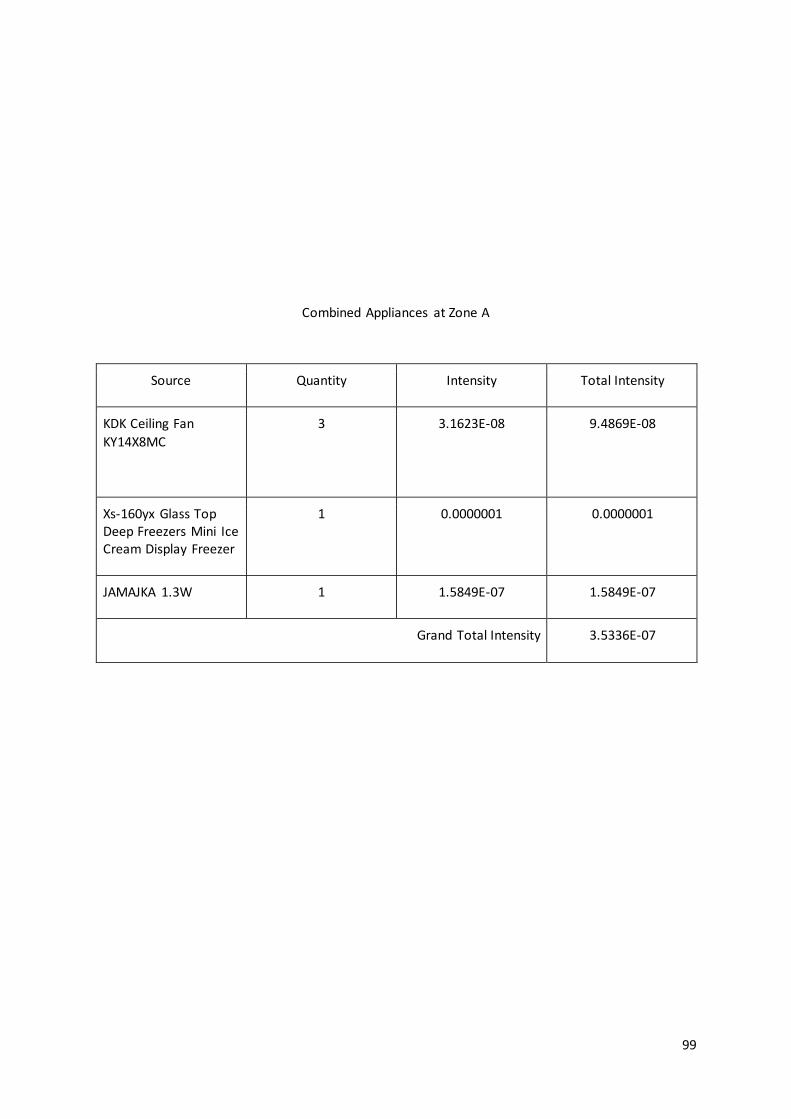
Combined Appliances at Zone A
Source Quantity Intensity Total Intensity
KDK Ceiling Fan
KY14X8MC
3 3.1623E-08 9.4869E-08
Xs-160yx Glass Top Deep Freezers Mini Ice Cream Display Freezer
1 0.0000001 0.0000001
JAMAJKA 1.3W 1 1.5849E-07 1.5849E-07
Grand Total Intensity 3.5336E-07

100
Combined Appliances at Zone B
Source Quantity Intensity Total Intensity
Acson Wall Mounted
Split G series R22 Model
1 1.5849E-07 1.5849E-07
Berjaya Counter
Chiller CC2100-S
1 0.0000001 0.0000001
Phillips Rice Cooker HD3027
1 7.9433E-08 7.9433E-08
Anfim Caimano Coffee
Grinder
1 8.71E-07 8.71E-07
Sharp Countertop Microwave Oven 0.9 CU. FT. 900W
1 0.0004 0.0004
Keesvanderwestern
Mirage
1 3.1623E-04 3.1623E-04
Grand Total Intensity 7.1745E-04

101
Combined Appliances at Zone C
Source Quantity Intensity Total Intensity
York Floor Ceiling Convertible Deluxe
R410A
1 3.1623E-07 3.1623E-07
Grand Total Intensity 3.1623E-07

102
APPLIANCES SIL CALCULATION
Sound Intensity Level (SIL) by Zone
Zone Intensity, I Sound Intensity, SIL
A 3.5336E-07 55.48
B 7.1745E-04 88.56
C 3.1623E-07 55
Sound Intensity Level (SIL) of entire space
Zone Intensity, I
A 3.5336E-07
B 7.1745E-04
C 3.1623E-07
Entire Space 7.1813E-04
𝑆𝐼𝐿 = 10 𝐿𝑜𝑔 (𝐼
1𝑥10−12)
𝑆𝐼𝐿 = 10 𝐿𝑜𝑔 (7.1813𝑥10−4
1𝑥10−12)
𝑆𝐼𝐿 = 88.56𝑑
Hence, the total SIL of the space is 88.56 dB

103
ANALYSIS
Figure 4.15 Noise Criteria for Acoustic Environment in Building Interiors.
Figure 4.16 Sound Decibel Table.

104
According to Academic Resource Centre of Illinois Institute of Technology, restaurants
or cafes have a noise criteria ranging from 48-52 dB. Greyskymorning cafe has a total
Sound Intensity of 88.56 dB, which almost doubles the amount of acceptable sound
intensity in the build environment probably due to the machinery being used in the
cafe. As a comparison, Noise that exceeds 80dB is considered as too loud for normal
conversation to be held and would be a nuisance to users.

105
4.2.5 SOUND REDUCTION INDEX (SRI) CALCULATION
CEILING
Component Material Colour Surface Finish
Surface Area(m2)
SRI Transmission Coefficient, T
ST
Ceiling Metal deck
Black Matte 74.7 50 0.00001 0.000747
Concrete Grey Matte 22.5 43 0.00005 0.001125
Total Surface Area 97.2 Total ST 0.001872
T = 1
𝑎𝑛𝑡𝑖𝑙𝑜𝑔 (𝑆𝑅𝐼
10)
Tav = 𝑆1𝑇1+𝑆2𝑇2+𝑆𝑛𝑇𝑛
𝑇𝑜𝑡𝑎𝑙 𝑆𝑢𝑟𝑓𝑎𝑐𝑒 𝐴𝑟𝑒𝑎
= 0.001872
97.2
= 0.00002
SRI = 10 Log10 1
𝑇𝑎𝑣
= 10 Log10 1
0.00002
= 47 dB

106
FLOOR
Component Material Colour Surface Finish
Surface Area(m2)
SRI Transmission Coefficient, T
ST
Floor Concrete Black Matte
105.3 50 0.00001 0.001053
Total Surface Area 105.3 Total ST 0.001053
T = 1
𝑎𝑛𝑡𝑖𝑙𝑜𝑔 (𝑆𝑅𝐼
10)
Tav = 𝑆1𝑇1+𝑆2𝑇2+𝑆𝑛𝑇𝑛
𝑇𝑜𝑡𝑎𝑙 𝑆𝑢𝑟𝑓𝑎𝑐𝑒 𝐴𝑟𝑒𝑎
= 0.001053
105.3
= 0.00001
SRI = 10 Log10 1
𝑇𝑎𝑣
= 10 Log10 1
0.00001
= 50 dB
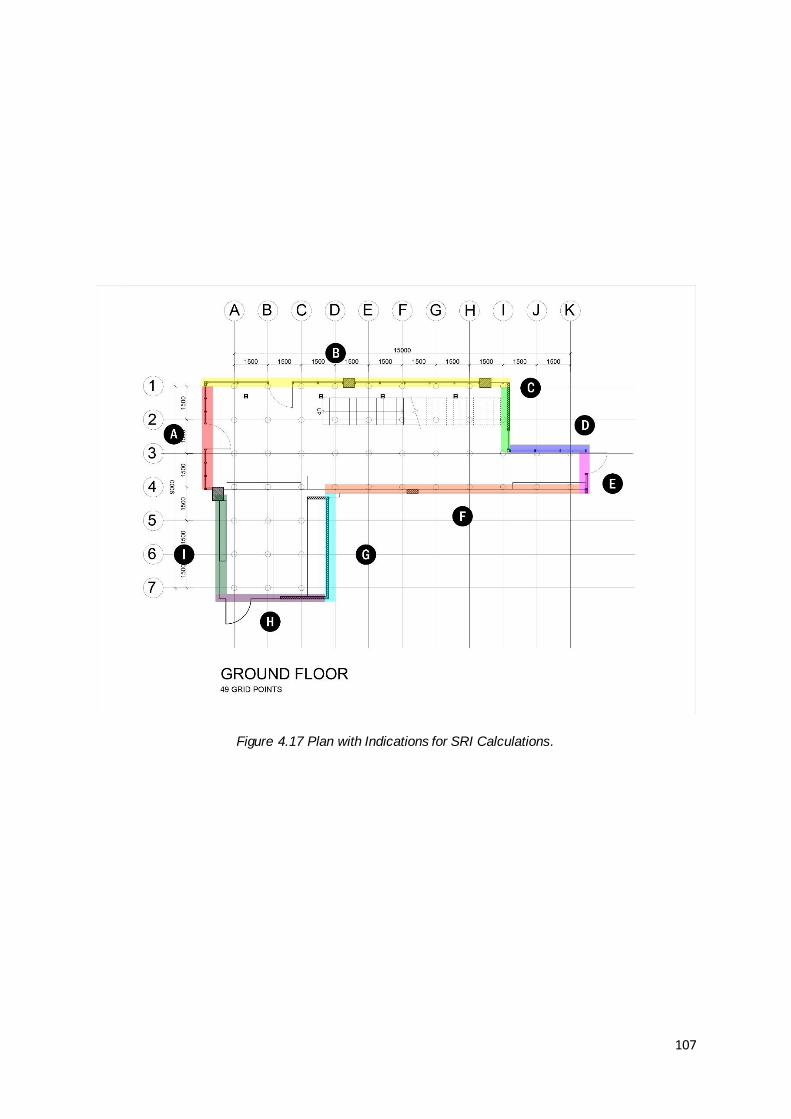
107
Figure 4.17 Plan with Indications for SRI Calculations.

108
WALL A
Component Material Colour Surface Finish
Surface Area (m2)
SRI Transmission Coefficient, T
ST
Wall Curtain Glass Wall
Transparent Glossy 19.2 37 0.0002 0.00384
Door Metal Frame w/ Glass Panel
Black/ Transparent
Matte/ Glossy
2.8 37 0.0002 0.00056
Total Surface Area 22 Total ST 0.0044
T = 1
𝑎𝑛𝑡𝑖𝑙𝑜𝑔 (𝑆𝑅𝐼
10)
Tav = 𝑆1𝑇1+𝑆2𝑇2+𝑆𝑛𝑇𝑛
𝑇𝑜𝑡𝑎𝑙 𝑆𝑢𝑟𝑓𝑎𝑐𝑒 𝐴𝑟𝑒𝑎
= 0.0044
22
= 0.0002
SRI = 10 Log10 1
𝑇𝑎𝑣
= 10 Log10 1
0.0002
= 37 dB

109
WALL B
Component Material Colour Surface Finish
Surface Area (m2)
SRI Transmission Coefficient, T
ST
Wall Curtain Glass Wall
Transparent Glossy 52.2 37 0.0002 0.01044
Concrete Grey Matte 3.4 43 0.00005 0.0002
Door Metal Frame w/ Glass Panel
Black/ Transparent
Matte/ Glossy
2.8 37 0.0002 0.00056
Column Concrete Grey Matte 4.8 43 0.00005 0.00024 Total Surface Area 63.2 Total ST 0.01144
T = 1
𝑎𝑛𝑡𝑖𝑙𝑜𝑔 (𝑆𝑅𝐼
10)
Tav = 𝑆1𝑇1+𝑆2𝑇2+𝑆𝑛𝑇𝑛
𝑇𝑜𝑡𝑎𝑙 𝑆𝑢𝑟𝑓𝑎𝑐𝑒 𝐴𝑟𝑒𝑎
= 0.01144
63.2
= 0.00018
SRI = 10 Log10 1
𝑇𝑎𝑣
= 10 Log10 1
0.00018
= 37 dB

110
WALL C
Component Material Colour Surface Finish
Surface Area (m2)
SRI Transmission Coefficient, T
ST
Wall Brick Wall Brown Matte 11.57 45 0.00003 0.00035 Window Clear
Glass Transparent Glossy 3 37 0.0002 0.0006
Total Surface Area 14.57 Total ST 0.00095
T = 1
𝑎𝑛𝑡𝑖𝑙𝑜𝑔 (𝑆𝑅𝐼
10)
Tav = 𝑆1𝑇1+𝑆2𝑇2+𝑆𝑛𝑇𝑛
𝑇𝑜𝑡𝑎𝑙 𝑆𝑢𝑟𝑓𝑎𝑐𝑒 𝐴𝑟𝑒𝑎
= 0.00095
14.57
= 0.00007
SRI = 10 Log10 1
𝑇𝑎𝑣
= 10 Log10 1
0.00007
= 42 dB

111
WALL D
Component Material Colour Surface Finish
Surface Area (m2)
SRI Transmission Coefficient, T
ST
Wall Brick Wall Brown Matte 5.1 45 0.00003 0.00015 Window Clear
Glass Transparent Glossy 10.5 37 0.0002 0.0021
Total Surface Area 15.6 Total ST 0.00225
T = 1
𝑎𝑛𝑡𝑖𝑙𝑜𝑔 (𝑆𝑅𝐼
10)
Tav = 𝑆1𝑇1+𝑆2𝑇2+𝑆𝑛𝑇𝑛
𝑇𝑜𝑡𝑎𝑙 𝑆𝑢𝑟𝑓𝑎𝑐𝑒 𝐴𝑟𝑒𝑎
= 0.00225
15.6
= 0.00014
SRI = 10 Log10 1
𝑇𝑎𝑣
= 10 Log10 1
0.00014
= 39 dB

112
WALL E
Component Material Colour Surface Finish
Surface Area (m2)
SRI Transmission Coefficient, T
ST
Wall Brick Wall Brown Matte 1.8 45 0.00003 0.00005 Window Clear
Glass Transparent Glossy 3 37 0.0002 0.0006
Door Metal Frame w/ Glass Panel
Black/ Transparent
Matte/ Glossy
2.8 37 0.0002 0.00056
Total Surface Area 7.6 Total ST 0.00121
T = 1
𝑎𝑛𝑡𝑖𝑙𝑜𝑔 (𝑆𝑅𝐼
10)
Tav = 𝑆1𝑇1+𝑆2𝑇2+𝑆𝑛𝑇𝑛
𝑇𝑜𝑡𝑎𝑙 𝑆𝑢𝑟𝑓𝑎𝑐𝑒 𝐴𝑟𝑒𝑎
= 0.00121
7.6
= 0.000159
SRI = 10 Log10 1
𝑇𝑎𝑣
= 10 Log10 1
0.000159
= 38 dB

113
WALL F
Component Material Colour Surface Finish
Surface Area (m2)
SRI Transmission Coefficient, T
ST
Wall Glass Curtain Wall
Transparent Glossy 43.9 37 0.0002 0.00878
Brick Wall Brown Matte 3.9 45 0.00003 0.00012 Column Concrete Grey Matte 2 43 0.00005 0.0001 Total Surface Area 49.8 Total ST 0.009
T = 1
𝑎𝑛𝑡𝑖𝑙𝑜𝑔 (𝑆𝑅𝐼
10)
Tav = 𝑆1𝑇1+𝑆2𝑇2+𝑆𝑛𝑇𝑛
𝑇𝑜𝑡𝑎𝑙 𝑆𝑢𝑟𝑓𝑎𝑐𝑒 𝐴𝑟𝑒𝑎
= 0.009
49.8
= 0.00018
SRI = 10 Log10 1
𝑇𝑎𝑣
= 10 Log10 1
0.00018
= 37 dB

114
WALL G
Component Material Colour Surface Finish
Surface Area(m2)
SRI Transmission Coefficient, T
ST
Wall Brick Wall Brown Matte
17.9 45 0.00003 0.000537
Total Surface Area 17.9 Total ST 0.000537
T = 1
𝑎𝑛𝑡𝑖𝑙𝑜𝑔 (𝑆𝑅𝐼
10)
Tav = 𝑆1𝑇1+𝑆2𝑇2+𝑆𝑛𝑇𝑛
𝑇𝑜𝑡𝑎𝑙 𝑆𝑢𝑟𝑓𝑎𝑐𝑒 𝐴𝑟𝑒𝑎
= 0.000537
17.9
= 0.00003
SRI = 10 Log10 1
𝑇𝑎𝑣
= 10 Log10 1
0.00003
= 45 dB

115
WALL H
Component Material Colour Surface Finish
Surface Area (m2)
SRI Transmission Coefficient, T
ST
Wall Glass Curtain Wall
Transparent Glossy 7 37 0.0002 0.0014
Brick Wall Brown Matte 10.1 45 0.00003 0.0003 Door Metal
Frame w/ Glass Panel
Black/ Transparent
Matte/ Glossy
2.8 37 0.0002 0.00056
Total Surface Area 19.9 Total ST 0.00226
T = 1
𝑎𝑛𝑡𝑖𝑙𝑜𝑔 (𝑆𝑅𝐼
10)
Tav = 𝑆1𝑇1+𝑆2𝑇2+𝑆𝑛𝑇𝑛
𝑇𝑜𝑡𝑎𝑙 𝑆𝑢𝑟𝑓𝑎𝑐𝑒 𝐴𝑟𝑒𝑎
= 0.00226
19.9
= 0.000114
SRI = 10 Log10 1
𝑇𝑎𝑣
= 10 Log10 1
0.000114
= 39 dB

116
WALL I
Component Material Colour Surface Finish
Surface Area(m2)
SRI Transmission Coefficient, T
ST
Wall Glass Curtain Wall
Transparent Glossy
15.4 37 0.0002 0.003
Brick Wall Brown Matte 2.2 45 0.00003 0.000066
Total Surface Area 17.6 Total ST 0.003066
T = 1
𝑎𝑛𝑡𝑖𝑙𝑜𝑔 (𝑆𝑅𝐼
10)
Tav = 𝑆1𝑇1+𝑆2𝑇2+𝑆𝑛𝑇𝑛
𝑇𝑜𝑡𝑎𝑙 𝑆𝑢𝑟𝑓𝑎𝑐𝑒 𝐴𝑟𝑒𝑎
= 0.003066
17.6
= 0.000174
SRI = 10 Log10 1
𝑇𝑎𝑣
= 10 Log10 1
0.000174
= 38 dB

117
SOUND TRANSMISSION BETWEEN INTERIOR AND EXTERIOR
Due to the nature of our site, certain areas were inaccessible. Therefore, we only
managed to obtain the Exterior sound levels of certain outdoor spaces.
Using the formula:
Exterior sound levels – SRI of the respective surface = Sound Transmission of
respective surface
Through this formula, we are able to obtain the Sound Transmission of the given
surfaces so that we may identify its percentage in which it transmits.
Figure 4.18 Plan with Indications of The Measured Outdoor Acoustic Levels.

118
Wall A
Exterior sound levels – SRI of the respective surface = Sound Transmission of respective surface
54 dB – 37 dB = 17 dB
17𝑑𝐵
54𝑑𝐵 x 100% = 31%
Wall E
73 dB – 38 dB = 35 dB
35𝑑𝐵
73𝑑𝐵 x 100% = 48%
Wall F
62 dB – 37 dB = 25 dB
25𝑑𝐵
62𝑑𝐵 x 100% = 40%
Average of Percentages
31+48+40
3 = 39.7%
ANALYSIS
Without the remaining measurements for the other surfaces, it’s quite hard to draw a
proper conclusion. However, due to the similarity in the types of spaces outside as
well as the materiality of the which create a very uniform Sound Reduction Index
throughout the overall building, it is safe to assume that the average of the percentages
would be roughly the same. Overall the buildings surface allows more than 50 percent
of the exterior sound found on the site. This is most likely due to the large amounts of
glass found throughout the site.

119
4.2.6 REVERBERATION TIME
1

120
2

121
4.2.7 ACOUSTIC ANALYSIS AND EVALUATION
The recommended Noise Criteria for a café, referring to AS/NZS 2107:2000, is in the
region of 45-50dBA. The recommended reverberation time for a café should also be
in the proximity of 0.4-0.6s, as stated by AS/NZS 2107:2000. However, during our
testing and analysis the sound levels consistently breach the 70-80 dBA readings. To
put that into perspective, the human ear works optimally at the 48-72 dBA range.
Acoustic comfort in a building or space is very important for the users to feel
comfortable and be able to work and play efficiently in that space. Acoustic levels also
play a very important role in the balance and effect on the psychological and
physiological well-being of the user.
Thankfully, the building does not suffer from major acoustical disturbances from the
exterior as the road networks and isolation of the site work in favour to dampen
acoustic levels. The café does, however, receive some noise at the back portion in via
the noise generated by the air conditioning systems. In the interiors of the café, the
main acoustical noises are generated from the usage of Coffee Machines as well as
Kitchen Appliances that are all important to serve customers. The café tackles these
situations by placing the kitchen in a corner, away from the users and sound direction
and not placing any seats or usage space within close proximity of the back portion of
the café.
The material usage, namely steel, bricks and wood also help in reducing the acoustical
levels, with acoustic absorption characteristics that ensure acoustic acceptability of
space. The café may improve its acoustic absorption characteristics further by using
more soft materials which aid in absorbing sound.

122
5.0 CONCLUSION
After conducting a detailed analysis on the site and gaining a newfound understanding
on lighting and acoustic properties and functions, many conclusions may be made.
Starting with the lighting design, our observations as well as calculations came to the
conclusion that the building is able to receive sufficient amounts of light via natural
lighting with little extra aid from artificial lights throughout all zones studied as
stipulated by MS 1525. Although it may be recommended that the café adopt some
shading properties in the form of shading devices as at times during our analysis we
have come to find that the building, especially the areas close to the walls may receive
too much light and heat, causing discomfort to the users.
As for the acoustic properties, the building is exceptional in that it takes advantage of
it’s infill nature to reduce acoustic disturbance from the outdoors. The relative isolation
of the café and entire building itself also contributes heavily to the reduction or
prevention of major acoustic hazards from penetrating anywhere close to the café.
Internally the café suffers from slight acoustic hazards especially in and around the
kitchen area and the back part of the café. As the noise origins are unavoidable it can
be recommended that the café implement the usage of more soft materials such as
pillows or carpets around the café to improve noise absorption as well as maybe even
purchasing and using sound masking speakers that not only serve to absorb noise,
but also play any form of music that may aid to the acoustical comfort of the customers.
An example of such a product is the XOUNT 360, widely used and available in the
market.
Overall, this is a project that has brought us, all the members, new and improved
knowledge about lighting and acoustics that are related to a building. Through this
project we are also able to improve our bond from working together which will help
propel us to improve ourselves as well. Finally the lessons learnt from this assignment
would be crucial and important to the application and design of subsequent
assignments relating to architecture that any of us may partake in the future.

123
APPENDIX

124

125

126

127

128

129

130

131

132

133
REFERENCES
1) "Best Nursing Schools In The US | Collegeatlas.Org". Collegeatlas.org. N.p., 2016. Web. 6 Nov. 2016.
2) "Room Acoustic Measurements 101 - Acoustic Frontiers". Acousticfrontiers.com. N.p., 2016. Web.
7 Nov. 2016.
3) "Audio & Acoustic Measurement Instruments". Nti-audio.com. N.p., 2016. Web. 7 Nov. 2016.
4) "LUTRON ELECTRONIC ENTERPRISE CO., LTD.". Lutron.com.tw. N.p., 2016. Web. 7 Nov. 2016.
5) "Measuring Light Levels | Sustainability Workshop". Sustainabilityworkshop.autodesk.com. N.p.,
2016. Web. 7 Nov. 2016.
6) "Daylight Saving Time Dates For Malaysia – Kuala Lumpur Between 2010 And 2019".
Timeanddate.com. N.p., 2016. Web. 7 Nov. 2016.
7) "Definitions Of Lux, Lumens & Watts For Lighting | GREEN BUSINESS LIGHT".
Greenbusinesslight.com. N.p., 2016. Web. 7 Nov. 2016.
8) "Daylight Factor | Daylighting Pattern Guide". Patternguide.advancedbuildings.net. N.p., 2016.
Web. 7 Nov. 2016.
9) "Sound Absorption". Acoustical Surfaces. N.p., 2016. Web. 7 Nov. 2016.
10) "Sound Absorption Materials | Soundproof Cow". Soundproof Cow. N.p., 2016. Web. 7 Nov. 2016.
11) "Soundproofing Vs Sound Absorbing - What's The Difference? - Acoustical Surfaces". Acoustical
Surfaces. N.p., 2016. Web. 7 Nov. 2016.
12) "The Daylight Factor - Designing Buildings Wiki". Designingbuildings.co.uk. N.p., 2016. Web. 7 Nov.
2016.


![BUILDING SCIENCE THEORY AID SHEET - bssb.ca · building science theory aid sheet 𝜎=5.67𝑥10−8 𝑄=𝐶𝐴[2 𝜌 ( 1− 2] 1/2 =𝑆𝐶𝑥𝑆 𝑥𝐶 ∓ (𝑡𝑖−𝑡](https://static.fdocuments.net/doc/165x107/6032a26489ec6b2ede20d9ff/building-science-theory-aid-sheet-bssbca-building-science-theory-aid-sheet-oe56710a8.jpg)