Building QSAR Models to Guide Drug Design · PDF fileOlga Obrezanova, PhD ... Exercise 3...
45
© 2009 Optibrium Ltd. Optibrium™, StarDrop™, Auto-Modeler™ and Glowing Molecule™ are trademarks of Optibrium Ltd. Building QSAR Models to Guide Drug Design Olga Obrezanova, PhD
Transcript of Building QSAR Models to Guide Drug Design · PDF fileOlga Obrezanova, PhD ... Exercise 3...
© 2009 Optibrium Ltd.Optibrium™, StarDrop™, Auto-Modeler™ and Glowing Molecule™ are trademarks of Optibrium Ltd.
Building QSAR Models to Guide Drug Design
Olga Obrezanova, PhD
© 2009 Optibrium Ltd. 2
Workshop Objectives
• Building predictive models
− Automatic model building tool
• Using in silico and experimental data to make decisions
− Compound prioritisation
− Visualisation tools
© 2009 Optibrium Ltd. 3
Workshop Program
• Automatic model generation process
Exercise 1 – Building category model of BBB penetration
Exercise 2 – Building continuous model of ion-channel affinity
• Compound prioritisation
− Using scoring to identify compounds with a balance of properties
• Interactive redesign
− Making the link between structure and predicted property
Exercise 3 – Prioritising compounds and using predictive models for compound redesign
• Balancing diversity and quality
Exercise 4 – Chemical space: Selecting diverse compounds with a good balance of properties

© 2009 Optibrium Ltd.Optibrium™, StarDrop™, Auto-Modeler™ and Glowing Molecule™ are trademarks of Optibrium Ltd.
Automatic Model Generation
Auto-Modeler

© 2009 Optibrium Ltd. 5
Automatic Model Generation
• Splitting data into training, validation and test sets
− cluster analysis by structural similarity at certain Tanimoto level
− Y based
− random
− manual split
• Descriptor calculation and filtering
− 2D SMARTS, logP, TPSA, charge...
− user defined SMARTS
− imported descriptor values, e.g. experimental data
Data set
trn val test

© 2009 Optibrium Ltd. 6
Automatic Model Generation
• Modelling techniques applied to training set
− Partial Least Squares (PLS)
− Radial Basis Functions with Genetic Algorithm
− Gaussian Processes
− Decision Trees (category models)
• Selection of the best model by performance on the validation set
− R², RMSE for continuous models
− Accuracy, kappa-statistic for category models
• Test set is an independent set
Data set
trn val test
Buildmodels
PLS
RBF
GPs
Bestmodel
Evaluate multiple models
Test the best model

© 2009 Optibrium Ltd. 7
Automatic Model Generation
Data set
trn val test
Buildmodels
PLS
RBF
GPs
Bestmodel
Evaluate multiple models
Test the best model
New compounds
Prediction Confidence
Estimation of uncertainty with each prediction

© 2009 Optibrium Ltd. 8
Modelling Techniques: Gaussian Processes
• A machine learning method based on Bayesian approach
• Advantages:
− Does not require a priori determination of model parameters
− Nonlinear relationship modelling
− Built-in tool to prevent overtraining - no need for cross-validation
− Inherent ability to select important descriptors
− Provides uncertainty estimate for each prediction
• Sufficiently robust to enable automatic model generation
© 2009 Optibrium Ltd. 9
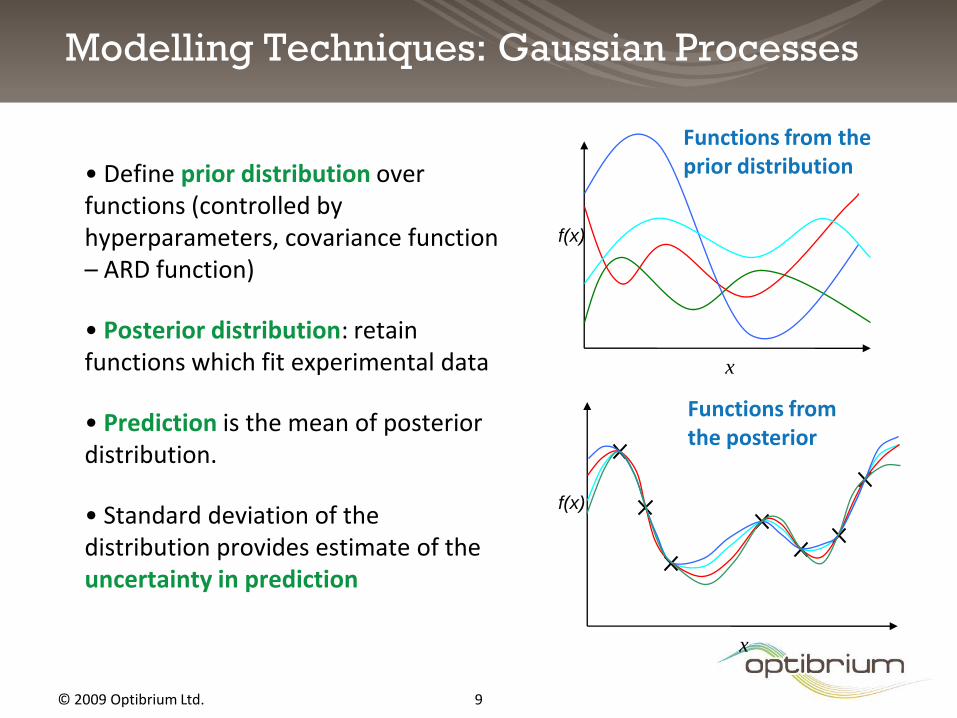
Modelling Techniques: Gaussian Processes
• Define prior distribution over functions (controlled by hyperparameters, covariance function – ARD function)
• Posterior distribution: retain functions which fit experimental data
• Prediction is the mean of posterior distribution.
• Standard deviation of the distribution provides estimate of the uncertainty in prediction
f(x)
x
Functions from the prior distribution
f(x)
x
Functions from the posterior

© 2009 Optibrium Ltd. 10
Modelling techniques. Gaussian Processes
• Learning the Gaussian Process equivalent to finding hyperparameters
− Length scale parameters (one for each descriptor) identification of relevant descriptors
− Noise parameter
• Find hyperparameters by optimizing the marginal log-likelihood
− It controls the trade-off between the model complexity and fit to the data no need for cross-validation, prevents overfitting, does not require user intervention
Length scale =0.6
Length scale =1.2
© 2009 Optibrium Ltd. 11
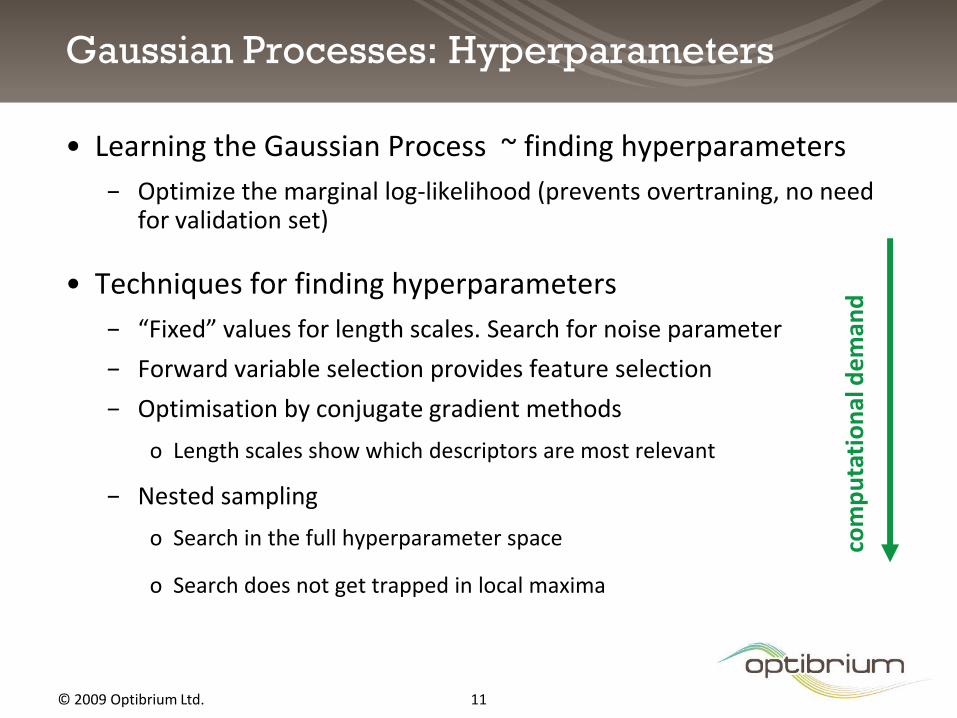
Gaussian Processes: Hyperparameters
• Learning the Gaussian Process ~ finding hyperparameters
− Optimize the marginal log-likelihood (prevents overtraning, no need for validation set)
• Techniques for finding hyperparameters
− “Fixed” values for length scales. Search for noise parameter
− Forward variable selection provides feature selection
− Optimisation by conjugate gradient methods
o Length scales show which descriptors are most relevant
− Nested sampling
o Search in the full hyperparameter space
o Search does not get trapped in local maxima
com
pu
tati
on
al d
em
and

© 2009 Optibrium Ltd. 12
Gaussian Processes: Nested Sampling
• 2 variables.
• Find maximum of likelihood:
variable 1
vari
able
2

© 2009 Optibrium Ltd. 13
Exercise 1
Building a classification model of blood-
brain barrier penetration
Objectives
− Familiarity with StarDrop and the Auto-Modeler
− Building classification models
− Familiarity with performance measures for category models
© 2009 Optibrium Ltd. 14
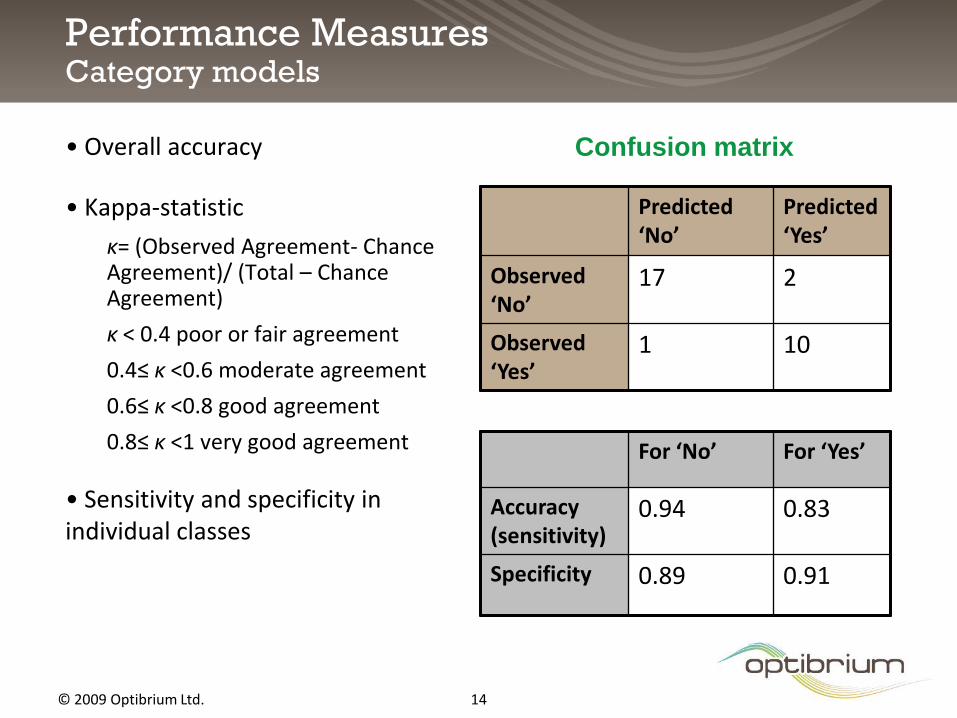
Performance MeasuresCategory models
• Overall accuracy
• Kappa-statistic
κ= (Observed Agreement- Chance Agreement)/ (Total – Chance Agreement)
κ < 0.4 poor or fair agreement
0.4≤ κ <0.6 moderate agreement
0.6≤ κ <0.8 good agreement
0.8≤ κ <1 very good agreement
• Sensitivity and specificity in individual classes
Predicted ‘No’
Predicted ‘Yes’
Observed ‘No’
17 2
Observed ‘Yes’
1 10
Confusion matrix
For ‘No’ For ‘Yes’
Accuracy (sensitivity)
0.94 0.83
Specificity 0.89 0.91

© 2009 Optibrium Ltd.Optibrium™, StarDrop™, Auto-Modeler™ and Glowing Molecule™ are trademarks of Optibrium Ltd.
Automatic Models Versus Manual
Experiment
© 2009 Optibrium Ltd. 16
Automatic Models versus Manual
• Model built ‘manually’ by computational chemists
• Model from the automatic model generation process (apply
to all compounds in a dataset)
• Compare ‘automatic’ and ‘manual’ models by testing on external data set
• Two data sets:
− Blood-brain barrier penetration (151 compounds with logBB values)
− Intrinsic aqueous solubility ( 3313 compounds with logS values from PHYSPROP database)

© 2009 Optibrium Ltd. 17
Blood-Brain Barrier Penetration
• ‘Manual’ model
− 2D SMARTS descriptors reduced by FVS, various modelling techniques (PLS, RBF, MLR) –performance supervised on test set
− Final model is built by RBF on 7 descriptors (logP, flexibility, charge, hydrogen bonding…)
• ‘Automatic’ model built by Gaussian Processes with nested sampling on 162 descriptors
• External set: 143 compounds from ‘Abraham’ set
− Abraham et al. J.Pharm. Sci., 2006, 95
Test set
R² 0.73
RMSE 0.36
Val+Test set
R² val 0.72
R² test 0.66
RMSE 0.44
manual
automatic

© 2009 Optibrium Ltd. 18
Blood-Brain Barrier Penetration Performance on external ‘Abraham’ test set
Model RMSE pred
% pred within ±0.4 log unit
% pred within ±0.8 log unit
R² r²corr RMSE
manual 0.36 62.9 93.0 0.39 0.44 0.44
automatic 0.44 63.6 90.9 0.27 0.36 0.49
manual automatic
© 2009 Optibrium Ltd. 19
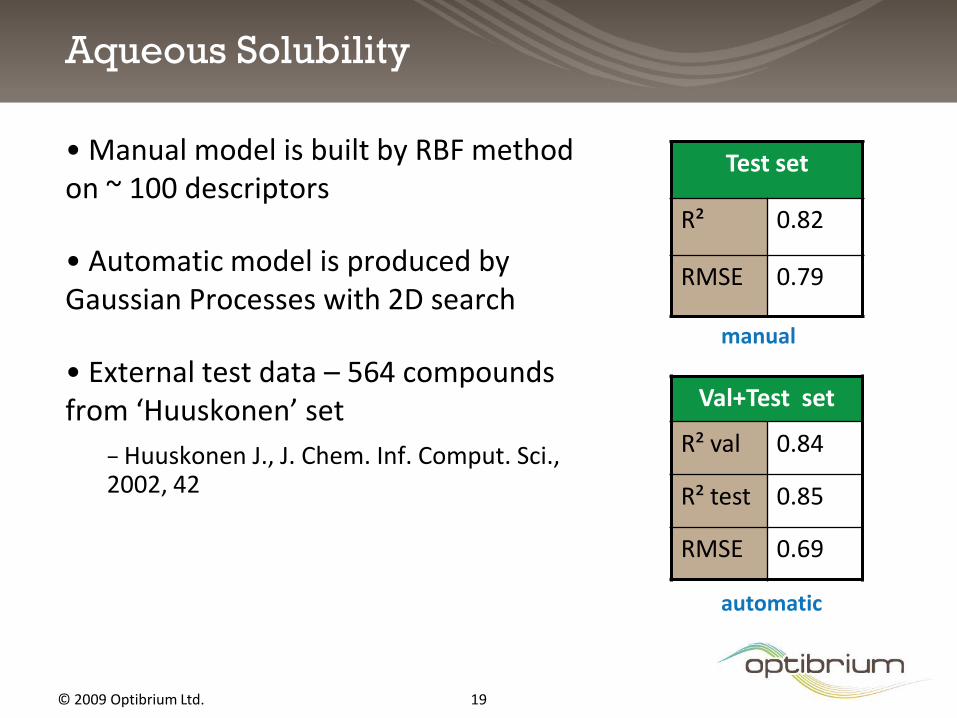
Aqueous Solubility
• Manual model is built by RBF method on ~ 100 descriptors
• Automatic model is produced by Gaussian Processes with 2D search
• External test data – 564 compounds from ‘Huuskonen’ set
− Huuskonen J., J. Chem. Inf. Comput. Sci., 2002, 42
Test set
R² 0.82
RMSE 0.79
Val+Test set
R² val 0.84
R² test 0.85
RMSE 0.69
manual
automatic

© 2009 Optibrium Ltd. 20
Aqueous SolubilityPerformance on external ‘Huuskonen’ test set
manual automatic
Model Desc % pred within ±0.7 log unit
% pred within ±1.4 log unit
R² r²corr RMSE
manual 108 39.9 70.9 0.68 0.80 1.28
automatic 166 54.1 85.9 0.82 0.86 0.96
pre
dic
ted
pre
dic
ted
observed observed
© 2009 Optibrium Ltd. 21
Exercise 2
Building a continuous model of ion-
channel affinity
Objectives
− Building continuous models
− Familiarity with performance measures for continuous models
− Using the model to predict new compounds

© 2009 Optibrium Ltd. 22
Performance MeasuresContinuous models
• Root-mean-square error
• Coefficient of determination
− R² is different from Pearson’s squared correlation coefficient
− R² measures the fit around the identity line
− Pearson’s r²corr measures fit around regression line between yobs and ypred
− R² > 0.5 at least!
N
i
obs
i
pred
i yyN
RMSE1
2)(1
i
obsobs
i
i
obs
i
pred
i
yy
yy
R2
2
2
)(
)(
1
Predicted versus observed

© 2009 Optibrium Ltd.Optibrium™, StarDrop™, Auto-Modeler™ and Glowing Molecule™ are trademarks of Optibrium Ltd.
Compound Prioritisation
Probabilistic Scoring
© 2009 Optibrium Ltd. 24
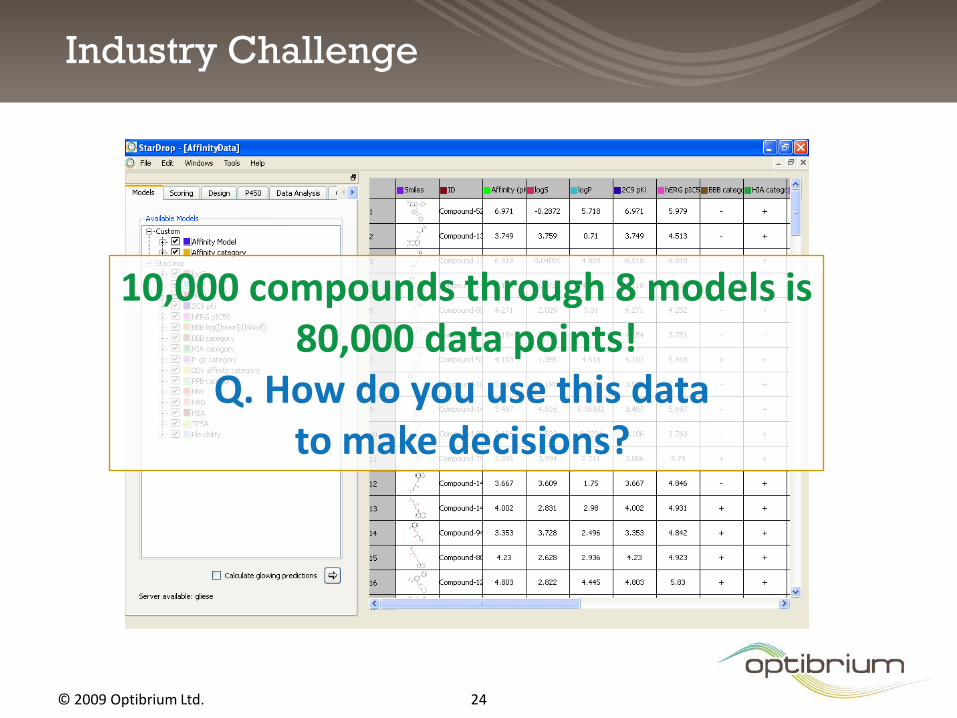
10,000 compounds through 8 models is80,000 data points!
Q. How do you use this data to make decisions?
Industry Challenge
© 2009 Optibrium Ltd. 25
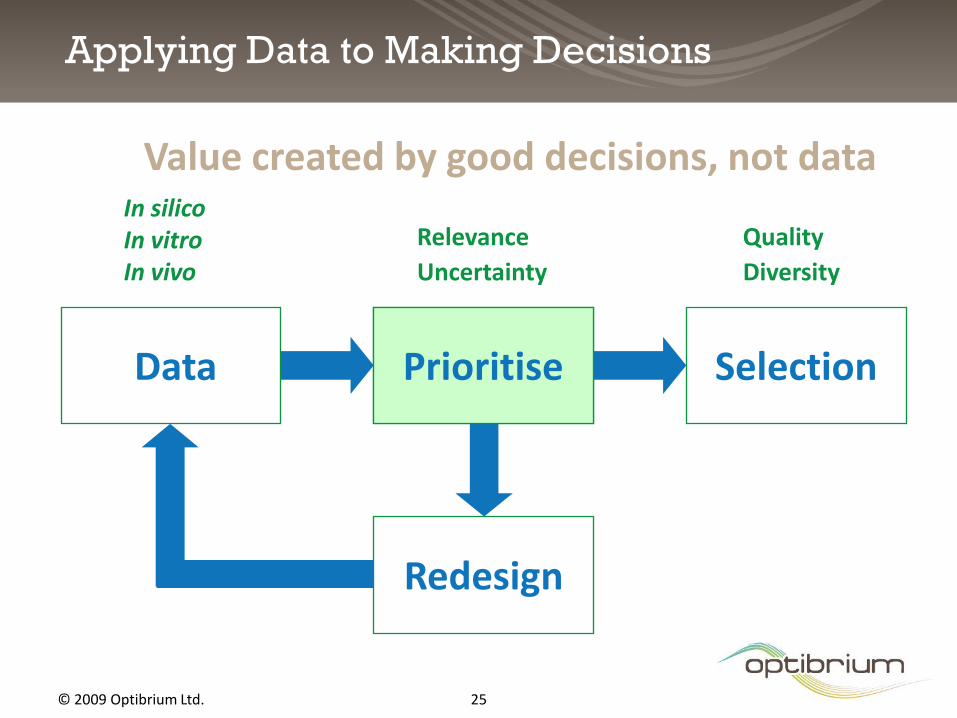
Applying Data to Making Decisions
PrioritiseData Selection
Redesign
In silico In vitro In vivo
Relevance
Uncertainty
Quality
Diversity
Value created by good decisions, not data
Prioritise

© 2009 Optibrium Ltd. 26
Prioritisation:Dangers of Filtering Approach
Absorption
Metabolic Stability
Potency

© 2009 Optibrium Ltd. 27
Prioritisation:Dangers of Filtering Approach
Absorption
Metabolic Stability
Potency

© 2009 Optibrium Ltd. 28
Property Y
100 10 1 0.1
Desired value > Threshold
A B C
UNDESIRABLE DESIRABLE
Importance of Uncertainty
X X
Filtering approach
No uncertainty
© 2009 Optibrium Ltd. 29
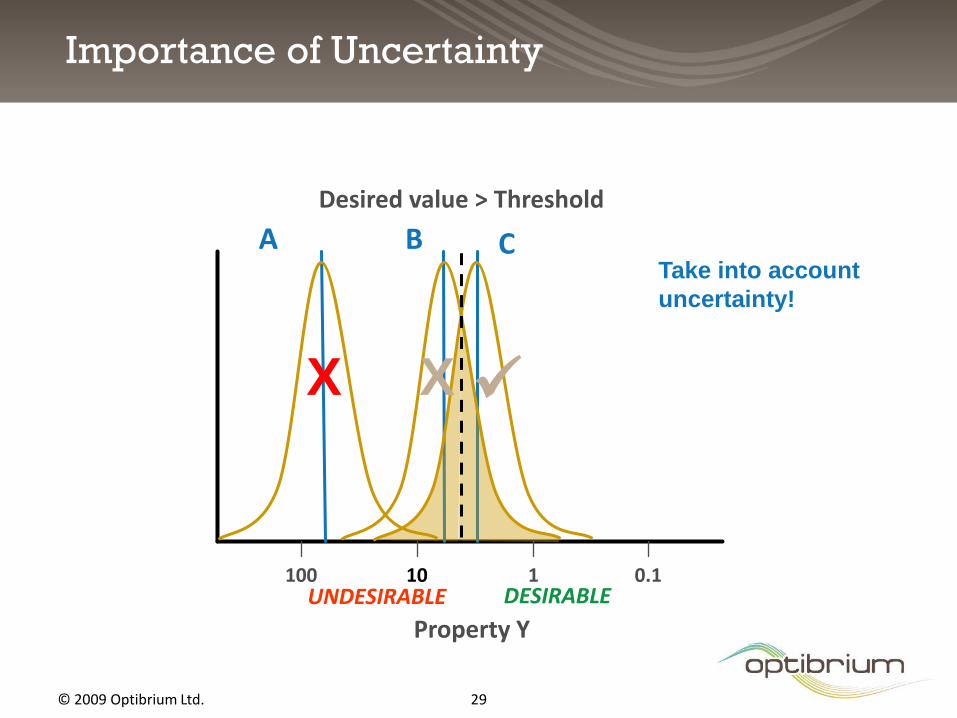
Property Y
100 10 1 0.1
Desired value > Threshold
A B C
UNDESIRABLE DESIRABLE
Importance of Uncertainty
X X
Take into account
uncertainty!

© 2009 Optibrium Ltd. 30
Importance of Uncertainty
100 10 1 0.1
Desired value > Threshold
D E
UNDESIRABLE DESIRABLE
Property Z
Compound D has
more chances to
succeed than
compound E
© 2009 Optibrium Ltd. 31
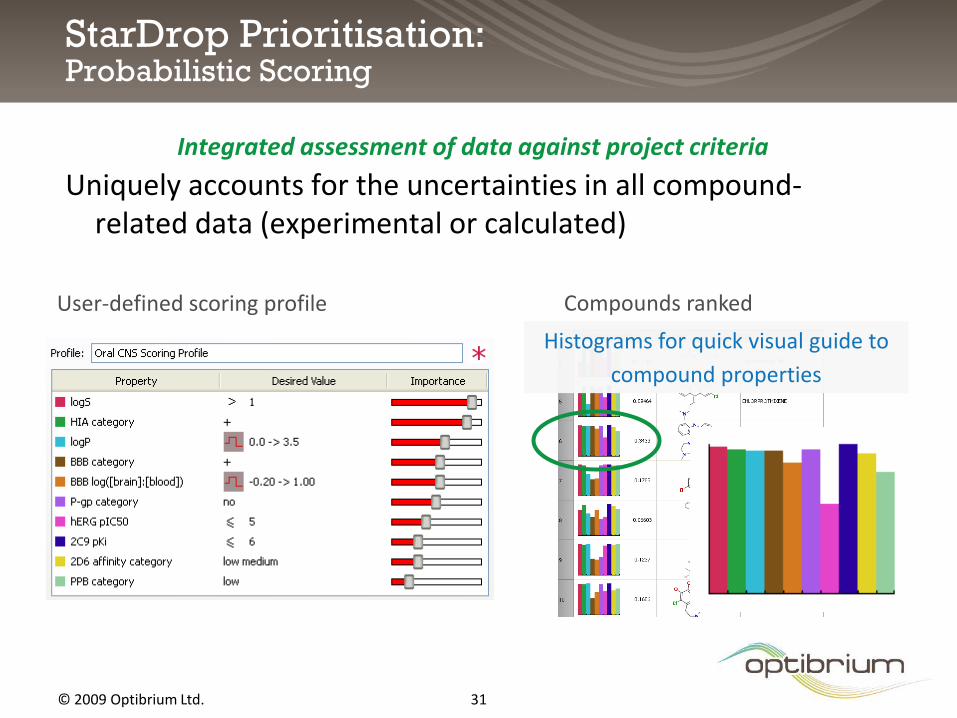
StarDrop Prioritisation:Probabilistic Scoring
Integrated assessment of data against project criteria
Uniquely accounts for the uncertainties in all compound-related data (experimental or calculated)
User-defined scoring profile Compounds ranked
Histograms for quick visual guide to
compound properties
© 2009 Optibrium Ltd. 32
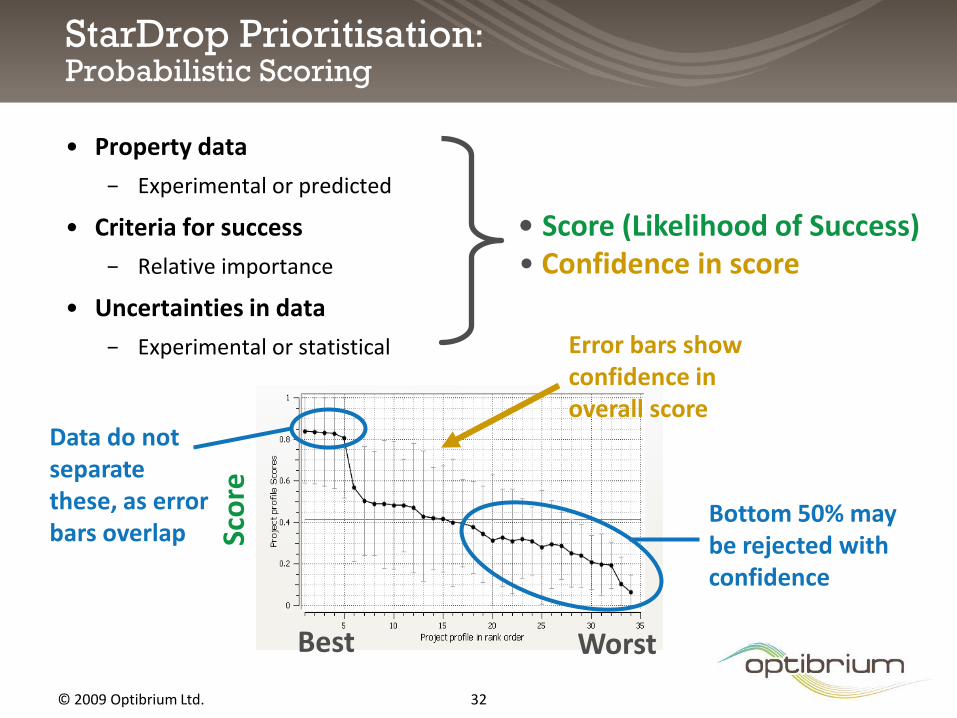
StarDrop Prioritisation:Probabilistic Scoring
• Property data
− Experimental or predicted
• Criteria for success
− Relative importance
• Uncertainties in data
− Experimental or statistical
• Score (Likelihood of Success)• Confidence in score
Sco
re
Best Worst
Error bars show confidence in overall score
Data do not separate these, as error bars overlap
Bottom 50% may be rejected with confidence

© 2009 Optibrium Ltd. 33
Example of a Scoring Profile
Models Desired values Importance
Aqueous solubility >10µM
Absorption (HIA) + (> 30%)BBB classification +
Log ([brain]:[blood]) >-0.5
P-gp transport non substratehERG Affinity (pIC50) <6.0
CYP2D6 affinity low or medium
CYP2C9 affinity (pKi) <6.0
Plasma protein binding low
© 2009 Optibrium Ltd.Optibrium™, StarDrop™, Auto-Modeler™ and Glowing Molecule™ are trademarks of Optibrium Ltd.
Interactive Redesign
‘Glowing Molecule’

© 2009 Optibrium Ltd. 35
Applying Data to Making Decisions
PrioritiseData Selection
Redesign
In silico In vitro In vivo
Relevance
Uncertainty
Quality
Diversity

© 2009 Optibrium Ltd. 36
The ‘Glowing Molecule’Visualisation tool
• Makes a link between predicted property and compound’s structure
−“Why is a property value predicted?”
−“Where can I change this property?”
−Interpret SAR
−Guide efficient redesign of molecules
• No-more ‘black box’ models!
logP property

© 2009 Optibrium Ltd. 37
Exercise 3
Prioritising compounds and using
predictive models for compound redesign
Objectives
− Identifying and prioritising compounds with a good balance of ADME properties and the affinity
− Identifying chemical groups which have a positive influence on the affinity
− Designing a new compound with improved affinity and good balance of other properties

© 2009 Optibrium Ltd.Optibrium™, StarDrop™, Auto-Modeler™ and Glowing Molecule™ are trademarks of Optibrium Ltd.
Balancing Diversity and Likelihood of Success
Chemical Space and Selection

© 2009 Optibrium Ltd. 39
Applying Data to Making Decisions
PrioritiseData Selection
Redesign
In silico In vitro In vivo
Relevance
Uncertainty
Quality
Diversity
© 2009 Optibrium Ltd. 40
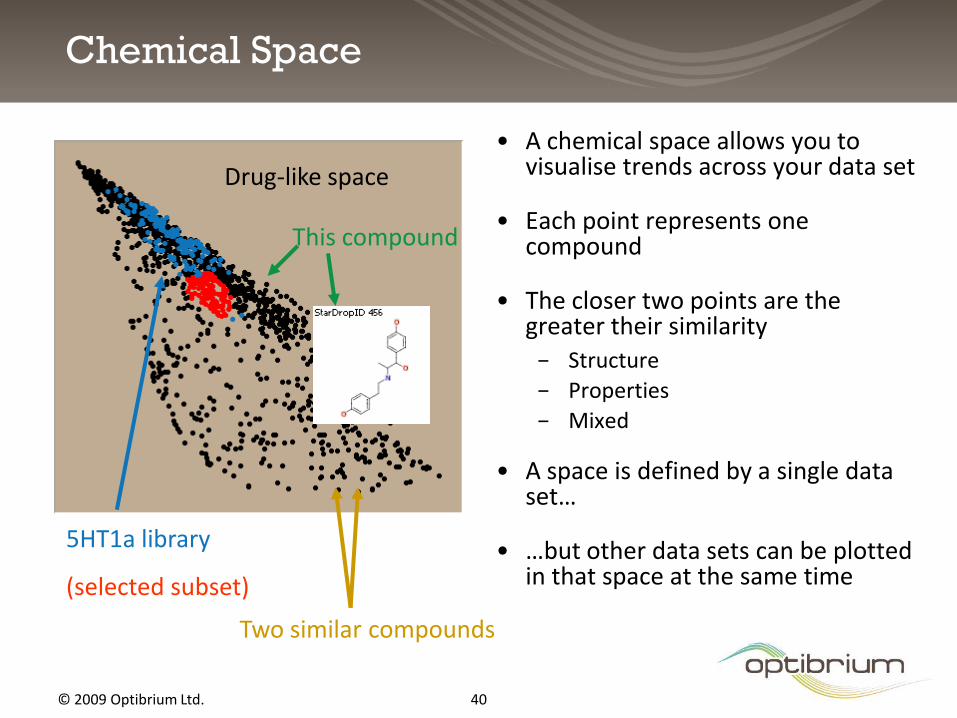
Chemical Space
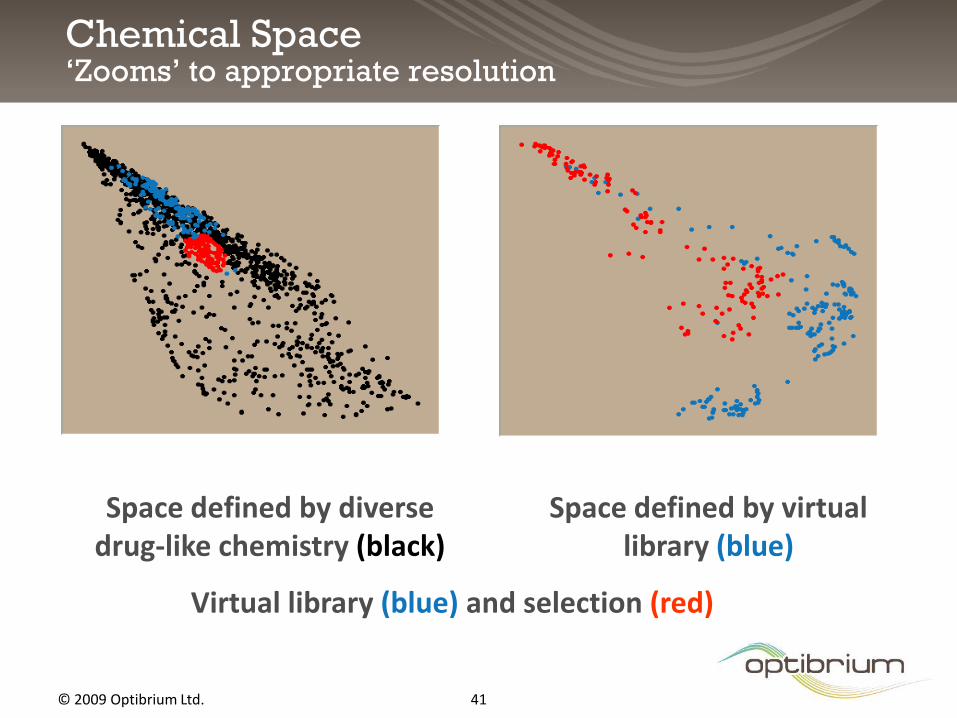
• A chemical space allows you to visualise trends across your data set
• Each point represents one compound
• The closer two points are the greater their similarity
− Structure
− Properties
− Mixed
• A space is defined by a single data set…
• …but other data sets can be plotted in that space at the same time
Drug-like space
5HT1a library
(selected subset)
Two similar compounds
This compound
© 2009 Optibrium Ltd. 41
Chemical Space‘Zooms’ to appropriate resolution
Space defined by diverse drug-like chemistry (black)
Space defined by virtual library (blue)
Virtual library (blue) and selection (red)
© 2009 Optibrium Ltd. 42
Selection:Balance Quality Against Diversity
• It may not be optimal to select only the highest ranked compounds
− Making many almost identical compounds may not be the best use of resources
• Often a small sacrifice in quality can significantly increase the diversity of compounds selected
− Spread risk across greater diversity of chemistry
− Gather additional data on SAR
• Compound selection provides ability to explore the trade-off between quality and diversity

© 2009 Optibrium Ltd. 43
Exercise 4
Chemical space and selection of diverse
compounds with balance of properties
Objectives
− Exploring chemical space map
− Selecting a subset of compounds with a good chance of success against the target product profile and a good coverage of chemical diversity
© 2009 Optibrium Ltd. 44
Conclusions
• The automatic model generation process is robust, much quicker than manual building and can be applied by non-experts. Automatic models compare well to ones built manually.
• Models can guide the design of new molecules through interpretation of SAR.
• When selecting compounds, models may be used to bias the odds of success by focussing on areas of chemistry most likely to yield a successful drug, rather than on an individual property of molecules.

© 2009 Optibrium Ltd. 45
Acknowledgements
• Matthew Segall
• Ed Champness
• Chris Leeding
www.optibrium.com