Building profitable relationships with multichannel consumers
18
Building Profitable Relationships with Multichannel Consumers February 2011
-
Upload
paul-mcadam -
Category
Economy & Finance
-
view
376 -
download
1
Transcript of Building profitable relationships with multichannel consumers

Building Profitable Relationships with Multichannel Consumers February 2011

The days of barbell profitability in retail banking are ending
Fee Income Spread Income
- 1 2 3 4 5 6 7 8 9 10
The forgotten 80%
The small pool of high-end customers and extreme NSF-paying customers
will no longer subsidize the mass market Fee Income Spread Income
Illustrative Customer Profitability Deciles
Channel Rationalization
Fee Income Generation
Wallet Consolidation
Reduce branch network operating expense while increasing investments in self-service delivery channels
Make up for lost NSF and debit card interchange revenues by increasing fee pricing
Encourage consumers to consolidate deposit, payment and credit relationships
2

Channel Rationalization Online banking, bank-owned ATMs and branches are used most frequently
3 n = 1,808 Source: FIS Enterprise Strategy, September 2010
Percent of consumers reporting use of each channel in the past 30 days
3
30%
33%
35%
47%
65%
67%
75%
Automated phone/IVR
Live phone rep
Foreign ATM
Debit card cash back at POS
Branch lobby transaction
Bank owned ATM
Online Banking
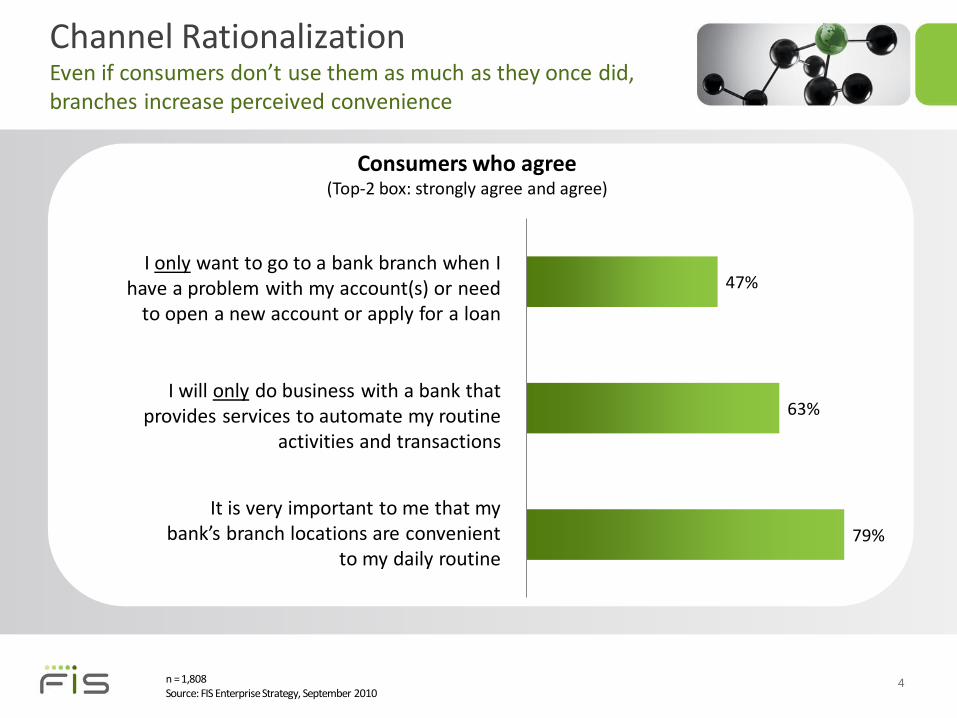
Channel Rationalization Even if consumers don’t use them as much as they once did, branches increase perceived convenience
Consumers who agree (Top-2 box: strongly agree and agree)
n = 1,808 Source: FIS Enterprise Strategy, September 2010
47%
63%
79%
It is very important to me that my bank’s branch locations are convenient
to my daily routine
I will only do business with a bank that provides services to automate my routine
activities and transactions
I only want to go to a bank branch when I have a problem with my account(s) or need
to open a new account or apply for a loan
4

In-person 23%
Mixed
Channel 57%
Self-service 20%
Channel Rationalization The majority of consumers are multi-channel and use a mix of in-person and self-service banking channels
n = 1,808 Source: FIS Enterprise Strategy, September 2010
Heavily In-person customers
• Conducted primarily in-person branch or telephone transactions
• Conducted no online or mobile interactions in past 30 days
• May use the ATM
Heavily Self-service customers
• Used only online, mobile and remote channel transactions
• Conducted no in-person branch transactions or phone calls to live service reps in past 30 days
• Used the ATM
Multi-channel customers
• Have used both in-person and online/self-service channels within the past 30 days
• Used ATM
5

Channel Rationalization The majority of consumers use 2 – 4 banking channels
n = 1,808 Source: FIS Enterprise Strategy, September 2010
4%
13%
22% 22%
17%
10%
4% 3%
7%
0 1 2 3 4 5 6 7 8
Number of channels used in past 30 days The eight channels included in this analysis
• Branch
• Bank-owned ATM
• Foreign ATM
• Call to live phone rep
• Call to automated phone/IVR
• Online banking
• Mobile banking
• Remote deposit of check with mobile phone
6

0%
5%
10%
15%
20%
25%
30%
0 1 2 3 4 5 6 7 8
Gen Y
Gen X
Baby Boomers
Mature
n = 1,808 Source: FIS Enterprise Strategy, September 2010
Number of channels used in past 30 days by generation
More than five channels used in the past 30 days
41%
28%
15%
9%
More than five channels
7
Channel Rationalization Younger generations (especially Gen Y) are driving the increase in number of channels used

n = 1,808 Source: FIS Enterprise Strategy, September 2010
3.8
3.1
2.4
2.5
18.1 *
15.5
9.6
7.6
Gen Y
Gen X
Baby Boomers
Mature
Average number of transactions/interactions in past 30 days
In Person
Self Service
Percent of transactions/
interactions that are in-person
17%
17%
20%
25%
8
Channel Rationalization Younger generations fuel the growth of self-service channels, but still heavily use in-person channels
Fee Income Generation Consumers have been trained not to expect to pay monthly fees
n = 1,808 Source: FIS Enterprise Strategy, September 2010
20%
82%
Consumers who agree (top-2 box: strongly agree/agree)
I believe the fees that banks charge for their services are fair
I do not expect to pay any fees for my checking account
Large National
Bank Customers
Regional Bank
Customers
Community Bank
Customers Credit Union
Members
I do not expect to pay any fees for my checking account 80% 88% 81% 83%
I believe that the fees banks charge for their services are fair 19% 19% 27% 19%
9

n = 1,808 Source: FIS Enterprise Strategy, September 2010
3%
3%
3%
9%
35%
42%
$30.00 or more
$20.00 - $29.99
$10.00 - $19.99
$5.00 - $9.99
Less than $5.00
I don’t pay any fees
Amount of fees for primary checking account in typical month
18%
Fees paid include:
• Monthly maintenance
• ATM
• Transaction or per-item fees
• NSF/OD
• Other
10
Fee Income Generation Most consumers pay minimal (if any) fees for their primary checking account

n = 1,808 Source: FIS Enterprise Strategy, September 2010
17%
23%
27%
33%
$10.00 or more
$5.00 - $9.99
$1.00 to $4.99
Less than $1.00
Amount of monthly fee increase that could motivate switching consideration
40%
60%
11
Fee Income Generation Even a modest monthly fee increase could motivate switching consideration among a majority of consumers

Wallet Consolidation Consumers are willing to consolidate their bank products and services to benefit from one-stop shopping
n = 1,808 Source: FIS Enterprise Strategy, September 2010
54%
56%
60%
71%
Strongly Agree/Agree (Top-2 Box)
I am willing to consolidate all of my money with one financial institution as long as it can provide all the
products and services I need
I would trust my bank for all my financial needs
I would be very interested in having all of my bank accounts, from checking accounts to loans to
investment products, all from one financial institution
I would consider moving all or most of my bank accounts to a financial institution that rewards me
for the amount of business I conduct with them
12

Source: FIS Enterprise Strategy, September 2010
14% Neither Likely
or Unlikely
2% Not too likely
2% Not at all likely
Likelihood of Bringing More Business to Current Provider to Avoid Fees
35%
Very Likely
48%
Somewhat
Likely
7%
11%
13%
28%
41%
$25,000 or more
$10,000 to $24,999
$5,000 to $9,999
$1,000 to $4,999
Less than $1,000
Deposit Balances Could Consolidate to Avoid Fees
(among those very/somewhat likely)
18%
n = 1,808 n = 1,396
13
Wallet Consolidation Although consumers are motivated to consolidate, only a small portion can bring meaningful deposit balances

Wallet Consolidation There is substantial opportunity for the primary checking account provider to gain wallet share
Where product relationships reside (for those consumers who own the product)
68%
51% 51%
35% 26%
51%
35% 33% 28%
23%
18%
14% 11%
4%
5%
3%
21%
2% 3%
2%
14%
35% 39%
60% 69%
46% 44%
65% 69% 75%
Savings CD MoneyMarketAccount
MoneyMarket
Mutual Fund
IRA HomeEquityLoan
CreditCard
Mortgage AutoLoan
StudentLoan
Own product withanother financialinstitution
Own product withprimary checkingaccount providerand another FI
Own product withprimary checkingaccount provider
n = 1,808 Source: FIS Enterprise Strategy, September 2010 14

Wallet Consolidation Relationship-based product packaging is an essential tool to escape product commoditization
Deposits
Payments
Loans
Loyalty Program
Source: FIS Enterprise Strategy
Benefits of Product Packages
• More cost-effective than cross-selling the same product mix over time
• More difficult for competitors to copy
• More difficult for customers to comparison/price shop
• Improve customer longevity
• More profitable
15

Wallet Consolidation Several variables can be configured to optimize a package’s profitability and customer appeal
Source: FIS Enterprise Strategy 16
Monthly maintenance fees
Minimum balance threshold
Consumer credit included in package
Consumer assets included in package
“Free” channel access included in package
Loyalty program benefits
High
Low
Short-term credit (e.g., credit card)
Short term assets (e.g., deposits)
Self service only
None or modest
Low or none
High
Long-term credit (e.g., mortgages)
Long-term assets (e.g., investments)
All channels
Significant & relationship based
Mass-market Package Relationship Package

Wallet Consolidation Matching logical consumer segments with packaged opportunities will optimize revenue
Source: FIS Enterprise Strategy 17
Age
Saving Families
Borrowing
Families Students &
Gen Y
Upwardly
Mobile
Gen X &Y Mature Bank Loyalists
Inc
om
e /
We
alt
h
Self-directed Mass Affluent
Survivors
Young, Tech Savvy
Account
~ 25% of population
Prepaid Debit
Account
~ 10% of population
Mass Market,
Loyalty Account
~ 40% of population
Retirement Income
Account
~ 10% of population
Tech Savvy, Emerging
Affluent Account
~ 15% of population

Contact information
FIS delivers banking and payments technologies to more than 14,000 financial institutions and businesses in over 100 countries worldwide. FIS provides financial institution core processing, and card issuer and transaction processing services, including the NYCE® Network. FIS maintains processing and technology relationships with 40 of the top 50 global banks, including 9 of the top 10. FIS is a member of Standard and Poor's (S&P) 500® Index and consistently holds a leading ranking in the annual FinTech 100 rankings. Headquartered in Jacksonville, Florida, FIS employs more than 30,000 on a global basis. FIS is listed on the New York Stock Exchange under the “FIS” ticker symbol. For more information about FIS see www.fisglobal.com.
This research was conducted by FIS Research and Thought Leadership, a key function of FIS’ Enterprise Strategy department. The FIS Research & Thought Leadership team proactively manages market and client perceptions of FIS as a thought-leader and thought-partner by conducting high-quality primary research on critical industry issues and delivering interpretation and recommendations to client organizations.
The research team for this project include:
Paul McAdam Mandy Putnam Senior Vice President Director Ph: 708-449-7742 Ph: 614-414-4207 [email protected] [email protected] James Gamble Chris Nay Director Senior Strategic Researcher Ph: 614-414-4213 Ph: 614-414-4218 [email protected] [email protected]
18