Buechi Kjeldahl Guide
26
Kjeldahl Guide
-
Upload
ria-doloking-situru -
Category
Documents
-
view
58 -
download
7
Transcript of Buechi Kjeldahl Guide

KjeldahlGuide


KjeldahlGuide

Impressum
Author Dr. Huldrych Egli
Publisher Büchi Labortechnik AG, CH-9230 Flawil Switzerland
Layout Cavelti AG, Druck und Media, CH-9201 Gossau
CTP and Printing by Cavelti AG, Druck und Media, CH-9201 Gossau
Bound by Brülisauer Buchbinderei AG, CH-9201 Gossau
Copyright © 2008 by Büchi Labortechnik AG, CH-9230 Flawil
All rights reserved. No part of this book may be reprinted, or reproduced, or utilized in any form or by any electronic or mechanical means, now known or hereafter invented, including photocopying and recording, or in any information storage and retrieval system, without permission in writing from the publisher.
First editionPrinted in Switzerland
ISBN 978-3-033-01688-0
Acknowledgment
The author expresses his gratitude to Dr. Matthias Wüst, University of Applied Sciences Western Switzerland, for his conscientious examination and comple-mentation of the references to the scientific literature and the careful reviewing of the manuscript. I owe thanks to my colleagues at work with Buchi Labortech-nik Flawil and I would like to convey my appreciation to Dr. Claudia Blum, Mr. Thomas Ziolko, Ms. Michaela Buffler and Mr. Jürgen Müller for their invaluable proof-reading. Last but not least Mr. Darvin Martin and Dr. Susanna Shaw from Buchi UK deserve citation for their linguistic checking of the English text.
Dr. Huldrych Egli
Foreword
In the past 200 years the techniques supporting chemical analysis have made tremendous progress from the invention of the Bunsen-burner and its use for flame tests to the atomic force microscope sent to Mars for the exploration of martian soil. At the time when Johan Kjeldahl published his method for the de-termination of nitrogen in 1883 the electric lamp was just patented and the tech-nical age in its childhood. Seldom in human history has an invention remained basically unchanged for such a long time as Kjeldahl’s method for nitrogen deter-mination. As in 1883 a Kjeldahl nitrogen determination starts with sample prepa-ration, proceeds to the mineralization followed by separation using distillation and subsequent volumetric determination of the amount of ammonia formed in the process. Kjeldahl’s visionary idea of providing a simple method for nitrogen and protein determinations, which also can be carried out by non academic lab personnel, has been put into practice by Büchi’s Kjeldahl systems since 1961.The Büchi Kjeldahl Guide you have in your hands is addressed to laboratory personnel, laboratory supervisors, students and teachers. It is our intention to revive the basic knowledge needed to understand the chemical and physical background associated with nitrogen determinations according to Kjeldahl and provide clear instructions in a wide area of Kjeldahl applications. The first theo-retical part of the Kjeldahl Guide contains basic knowledge and the second half consists of a selection of Büchi Application Notes describing successful nitrogen determinations.With this Kjeldahl Guide Büchi would like to live up to its company slogan
«Quality in your hands»and support you in your daily work by not only providing high quality instrumen-tation but also offering comprehensible theoretical background information and showcase applications.
Dr. Huldrych Egli

Table of Contents
1 Introduction . . . . . . . . . . . . . . . . . . . . . . . . . . . . . . . . . . . . . . . . . . . 7 1.1 History of the Kjeldahl Method . . . . . . . . . . . . . . . . . . . . . . . . . . . . . . . 7 1.2 Product Classes Amenable to the Kjeldahl Method . . . . . . . . . . . . . . . 8 1.3 Procedures for Kjeldahl Nitrogen Determinations . . . . . . . . . . . . . . . . . 10 1.3.1 Digestion . . . . . . . . . . . . . . . . . . . . . . . . . . . . . . . . . . . . . . . . . . . . . . . 10 1.3.2 Distillation . . . . . . . . . . . . . . . . . . . . . . . . . . . . . . . . . . . . . . . . . . . . . . 11 1.3.3 Titration . . . . . . . . . . . . . . . . . . . . . . . . . . . . . . . . . . . . . . . . . . . . . . . . 12 1.4 Blanks . . . . . . . . . . . . . . . . . . . . . . . . . . . . . . . . . . . . . . . . . . . . . . . . . 13
2 Determination of Nitrogen by the Kjeldahl Method . . . . . . . 15 2.1 Sample Preparation . . . . . . . . . . . . . . . . . . . . . . . . . . . . . . . . . . . . . . . 17 2.1.1 Amount of Sample . . . . . . . . . . . . . . . . . . . . . . . . . . . . . . . . . . . . . . . . 18 2.1.2 Mincing and Homogenization . . . . . . . . . . . . . . . . . . . . . . . . . . . . . . . 19 2.1.3 Drying of Samples . . . . . . . . . . . . . . . . . . . . . . . . . . . . . . . . . . . . . . . . 19 2.1.4 Aqueous Samples . . . . . . . . . . . . . . . . . . . . . . . . . . . . . . . . . . . . . . . . 20 2.2 Digestion . . . . . . . . . . . . . . . . . . . . . . . . . . . . . . . . . . . . . . . . . . . . . . . 20 2.2.1 Acid Consumption per Sample . . . . . . . . . . . . . . . . . . . . . . . . . . . . . . 20 2.2.2 Ideal Ratio of Salt to Sulfuric Acid . . . . . . . . . . . . . . . . . . . . . . . . . . . . 21 2.2.3 Acid Mixtures . . . . . . . . . . . . . . . . . . . . . . . . . . . . . . . . . . . . . . . . . . . 21 2.2.4 Catalyst Used for Digestion . . . . . . . . . . . . . . . . . . . . . . . . . . . . . . . . . 22 2.2.5 Selecting the correct catalyst . . . . . . . . . . . . . . . . . . . . . . . . . . . . . . . . 23 2.2.6 Digestion by Hydrogen Peroxide . . . . . . . . . . . . . . . . . . . . . . . . . . . . . 23 2.2.7 The Chemical Process of the Kjeldahl Digestion Reaction . . . . . . . . . . 24 2.2.8 Parameters for Digestion . . . . . . . . . . . . . . . . . . . . . . . . . . . . . . . . . . . 24 2.2.9 Temperature . . . . . . . . . . . . . . . . . . . . . . . . . . . . . . . . . . . . . . . . . . . . 24 2.2.10 Optimization of the Digestion . . . . . . . . . . . . . . . . . . . . . . . . . . . . . . . . 25 2.2.11 IR-Digestion versus Block-Digestion . . . . . . . . . . . . . . . . . . . . . . . . . . 26 2.2.12 Limits of the Kjeldahl Method . . . . . . . . . . . . . . . . . . . . . . . . . . . . . . . . 27 2.2.13 Suction Manifold . . . . . . . . . . . . . . . . . . . . . . . . . . . . . . . . . . . . . . . . . 27 2.3 Distillation . . . . . . . . . . . . . . . . . . . . . . . . . . . . . . . . . . . . . . . . . . . . . . 28 2.3.1 Diluting the Digestion Solution . . . . . . . . . . . . . . . . . . . . . . . . . . . . . . . 28 2.3.2 Neutralizing the Digestion Solution . . . . . . . . . . . . . . . . . . . . . . . . . . . . 29 2.3.3 Steam Distillation . . . . . . . . . . . . . . . . . . . . . . . . . . . . . . . . . . . . . . . . . 29 2.3.4 Receiving Vessel of Distillate . . . . . . . . . . . . . . . . . . . . . . . . . . . . . . . . 29 2.3.5 Distillation Time . . . . . . . . . . . . . . . . . . . . . . . . . . . . . . . . . . . . . . . . . . 30 2.3.6 Steam Power . . . . . . . . . . . . . . . . . . . . . . . . . . . . . . . . . . . . . . . . . . . 30 2.4 Titration . . . . . . . . . . . . . . . . . . . . . . . . . . . . . . . . . . . . . . . . . . . . . . . . 30 2.4.1 Boric Acid Titration . . . . . . . . . . . . . . . . . . . . . . . . . . . . . . . . . . . . . . . 31 2.4.2 Back Titration . . . . . . . . . . . . . . . . . . . . . . . . . . . . . . . . . . . . . . . . . . . 32 2.5 Calculations . . . . . . . . . . . . . . . . . . . . . . . . . . . . . . . . . . . . . . . . . . . . . 33 2.5.1 Calculation for Boric Acid Titration . . . . . . . . . . . . . . . . . . . . . . . . . . . . 34 2.5.2 Calculation for Back Titration . . . . . . . . . . . . . . . . . . . . . . . . . . . . . . . . 34 2.5.3 Protein Content . . . . . . . . . . . . . . . . . . . . . . . . . . . . . . . . . . . . . . . . . . 35 2.6 Limit of Detection and Limit of Quantification . . . . . . . . . . . . . . . . . . . . 36 2.7 Verification . . . . . . . . . . . . . . . . . . . . . . . . . . . . . . . . . . . . . . . . . . . . . . 38 2.7.1 Verification of Distillation Unit . . . . . . . . . . . . . . . . . . . . . . . . . . . . . . . . 38 2.7.2 Verification of the Digestion Unit . . . . . . . . . . . . . . . . . . . . . . . . . . . . . 39

3 Troubleshooting . . . . . . . . . . . . . . . . . . . . . . . . . . . . . . . . . . . . . . . 41
4 Official Norms and Regulations . . . . . . . . . . . . . . . . . . . . . . . . . 42
5 Attachments . . . . . . . . . . . . . . . . . . . . . . . . . . . . . . . . . . . . . . . . . . 44 5.1 Two-Stage Mixed Indicator According to Sher for Boric Acid Titration . 44 5.2 Mixing Indicator According to Mortimer for Back-Titration Method and Colorimetric Titration . . . . . . . . . . . . . . . . . . . . . . . . . . . . . . . . . . 44 5.3 Recommended Monographs on Kjeldahl . . . . . . . . . . . . . . . . . . . . . . . 44
6 References . . . . . . . . . . . . . . . . . . . . . . . . . . . . . . . . . . . . . . . . . . . 45
7 Application Notes . . . . . . . . . . . . . . . . . . . . . . . . . . . . . . . . . . . . . 47 7.1 Environmental Applications . . . . . . . . . . . . . . . . . . . . . . . . . . . . . . . . . 47 7.1.1 Ammonia . . . . . . . . . . . . . . . . . . . . . . . . . . . . . . . . . . . . . . . . . . . . . . . 47 7.1.2 Nitrate . . . . . . . . . . . . . . . . . . . . . . . . . . . . . . . . . . . . . . . . . . . . . . . . . 53 7.1.3 Total Kjeldahl Nitrogen (TKN) . . . . . . . . . . . . . . . . . . . . . . . . . . . . . . . . 57 7.2 Food and Feed . . . . . . . . . . . . . . . . . . . . . . . . . . . . . . . . . . . . . . . . . . 71 7.2.1 Milk . . . . . . . . . . . . . . . . . . . . . . . . . . . . . . . . . . . . . . . . . . . . . . . . . . . 71 7.2.2 Beer . . . . . . . . . . . . . . . . . . . . . . . . . . . . . . . . . . . . . . . . . . . . . . . . . . 89 7.2.3 Cheese . . . . . . . . . . . . . . . . . . . . . . . . . . . . . . . . . . . . . . . . . . . . . . . . 93 7.2.4 Eggs . . . . . . . . . . . . . . . . . . . . . . . . . . . . . . . . . . . . . . . . . . . . . . . . . . 99 7.2.5 Cookies . . . . . . . . . . . . . . . . . . . . . . . . . . . . . . . . . . . . . . . . . . . . . . . . 103 7.2.6 Pasta . . . . . . . . . . . . . . . . . . . . . . . . . . . . . . . . . . . . . . . . . . . . . . . . . . 109 7.2.7 Meat . . . . . . . . . . . . . . . . . . . . . . . . . . . . . . . . . . . . . . . . . . . . . . . . . . 113 7.2.8 Salami . . . . . . . . . . . . . . . . . . . . . . . . . . . . . . . . . . . . . . . . . . . . . . . . . 131
8 Index . . . . . . . . . . . . . . . . . . . . . . . . . . . . . . . . . . . . . . . . . . . . . . . . . 148
9 List of Figures and Tables . . . . . . . . . . . . . . . . . . . . . . . . . . . . . . 151

Introduction 9
Introduction
This introduction gives an overview of the history of the Kjeldahl Method and of its evolution to the current state of the art.
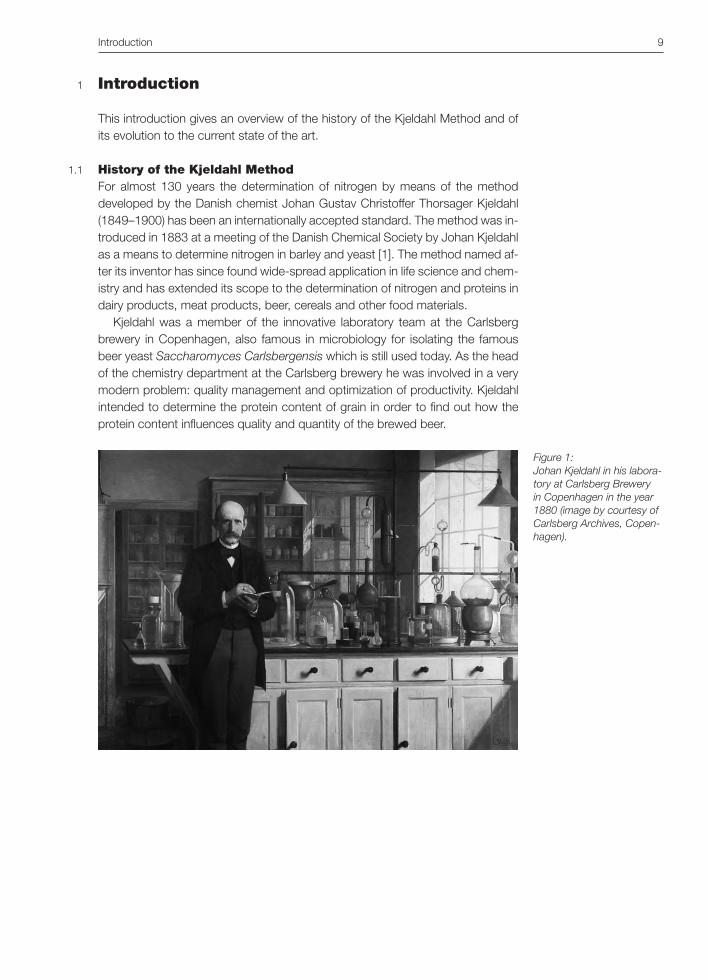
History of the Kjeldahl MethodFor almost 130 years the determination of nitrogen by means of the method developed by the Danish chemist Johan Gustav Christoffer Thorsager Kjeldahl (1849–1900) has been an internationally accepted standard. The method was in-troduced in 1883 at a meeting of the Danish Chemical Society by Johan Kjeldahl as a means to determine nitrogen in barley and yeast [1]. The method named af-ter its inventor has since found wide-spread application in life science and chem-istry and has extended its scope to the determination of nitrogen and proteins in dairy products, meat products, beer, cereals and other food materials.
Kjeldahl was a member of the innovative laboratory team at the Carlsberg brewery in Copenhagen, also famous in microbiology for isolating the famous beer yeast Saccharomyces Carlsbergensis which is still used today. As the head of the chemistry department at the Carlsberg brewery he was involved in a very modern problem: quality management and optimization of productivity. Kjeldahl intended to determine the protein content of grain in order to find out how the protein content influences quality and quantity of the brewed beer.
1
1.1
Figure 1: Johan Kjeldahl in his labora-tory at Carlsberg Brewery in Copenhagen in the year 1880 (image by courtesy of Carlsberg Archives, Copen-hagen).

10 Introduction
Original citation Translation
«Le principe de la nouvelle méthode consiste donc à chauffer pendant quelque temps la matière à analyser avec une forte proportion d’acide sulfurique concentré jusqu’à une température voisine du point d’ébullition de l’acide, et à oxyder la dissolution ainsi obtenue avec un excès d’hyperpermanganate de potasse sec en poudre. Dans ces conditions, l’azote des substances organiques, … , se transforme complètement en sulfate d’ammoniaque, qui, l’oxydation une fois terminée et après saturation avec la soude, peut être distillé et dosé par les méthodes ordinaires.»
«The principle of the new method is to heat the test material for some time with a large quantity of concentrated sulfuric acid at a temperature close to the acid’s boiling point and to oxidize the solution thus obtained with an excess of dry potas-sium per-manganate powder. Under these conditions the nitrogen of the organic sub-stances, … , is completely transformed into ammonium sulfate which, once the oxidation is completed and after satura-tion with caustic soda can be distilled and determined by ordinary methods.»
Although individual chemicals used in the Kjeldahl method have changed over
the years it is possible to give a concise general definition:
The Kjeldahl Method consists in a procedure of catalytically supported miner-alization of organic material in a boiling mixture of sulfuric acid and sulfate salts at digestion temperatures between 340 and 370 °C. In the digestion process the organically bonded nitrogen is converted into ammonium sulfate. Alkal-izing the solution liberates ammonia which is quantitatively steam-distilled and determined by titration.
Product Classes Amenable to the Kjeldahl MethodProteins are of indispensable nutritional value for humans and animals and are contained in juices, dairy products, food and feed [2]. The Kjeldahl method al-lows the calculation of protein contents in food samples based on the deter-mined nitrogen which is a general constituent of all proteins. Organically bonded nitrogen, amenable to the Kjeldahl method, is found in beer, yeast, barley, wine, wheat, corn, rice, vegetables, beans, soy and nuts, milk and related dairy prod-ucts, eggs, meat and sausages, fish and seafood.
The scope of Kjeldahl nitrogen determinations today also includes applica-tions in the fields of environmental analysis, research and development, phar-maceutical, chemical and cosmetics industries and is also used in governmental and regulatory laboratories.
Table 1:Citation from Kjeldahl’s original publication of 1883.
1.2

Introduction 11
Food Protein [%]
Apple 0.3
Peach 0.8
Carrot 1.0
Raspberry 1.3
Potatoes 2.0
Elderberry 2.5
Spinach 2.7
Horse-radish 2.8
Rose hip 3.6
Milk 3.2
Pea sprouts 5.1
Corn 9.2
Flour 11.0
Oats 12.6
Chicken 19.9
Halibut 20.1
Red beans 21.2
Beef 22.0
Lentils (dry) 22.9
Cheese (eg. Cheddar) 24.7
Peanuts 24.7
Sunflower seed 26.5
Ostrich 35.3
Soybeans 37.6
For packed and processed food nutrition fact labels are in use almost every-where in the world, examples are given in Figure 2. The protein content is one of the important parameters declared on nutrition fact labels.
Table 2:Protein contents of some foodstuffs.
Figure 2:Typical Nutrition Facts Labels as used in North America and Europe.
Nutrition FactsServing Size 67 g
Amount Per Serving
Calories 33 Calories from Fat 4
% Daily Value*
Total Fat 0g 1%
Saturated Fat 0g 0%
Trans Fat
Cholesterol 0mg 0%
Sodium 29mg 1%
Total Carbohydrate 7g 2%
Dietary Fiber 1g 5%
Sugars
Protein 2g
Vitamin A 20% • Vitamin C 34%
Calcium 9% • Iron 6%
*Percent Dialy Values are based on a 2,000 calorie diet. Your daily values may be higher or lower depending on your calorie needs.
Nährwerte/valeurs nutritives/ valori nutritivi
100 g 1 Stängel (17 g) enthalten/ enthält/ contiennent/ bâton contient/ contengono: bastoncino contrine:
Energiewert/ valeur énergétique/ 1870 KJ 320 KJ calore energetico (447 kcal) (77 kcal)
Eiweiss/ protéines/ proteine 15 g 2.5 g
Kohlenhydrate/ glucides/carboidrati 56 g 10 g davon/dont/di cui · Zucker/sucres/zuccheri 30 g 5 g
Fett/lipides/grassi 18 g 3 g davon/dont/di cui · gesättigte Fettsäuren/ acides gras saturés/ acidi grassi saturi 6 g 1 g · Cholesterin/ cholestérol colesterolo 0 mg 0 mg
Ballaststoffe/ fibres alimentaires/ fibres alimentari 6 g 1 g
Natrium/sodium sodio 0.15 g 0.02 g
12 Introduction
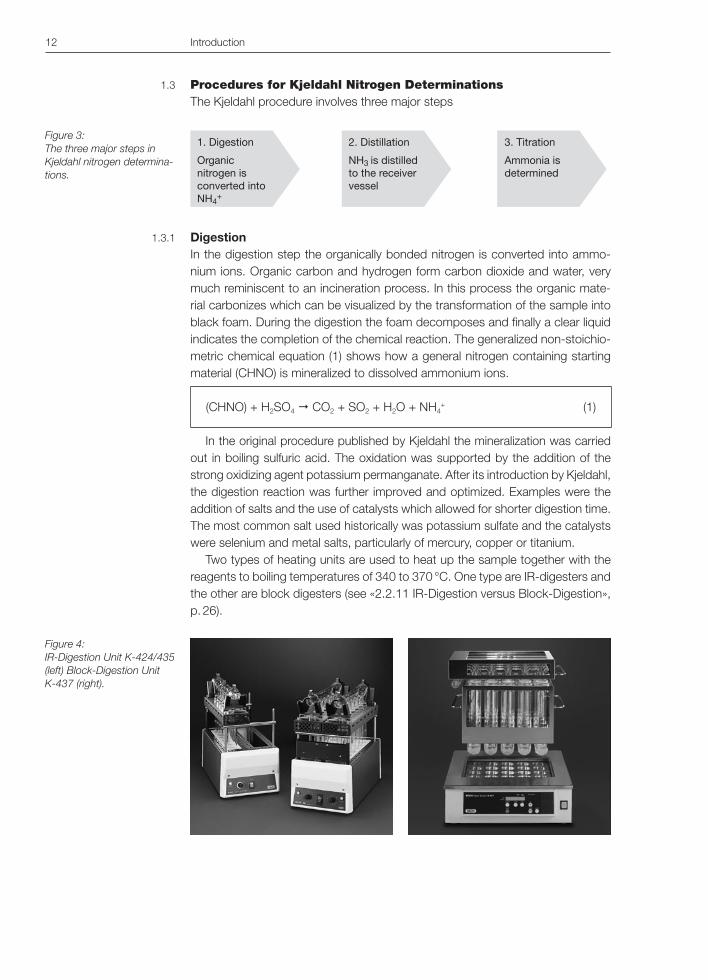
Procedures for Kjeldahl Nitrogen DeterminationsThe Kjeldahl procedure involves three major steps
DigestionIn the digestion step the organically bonded nitrogen is converted into ammo-nium ions. Organic carbon and hydrogen form carbon dioxide and water, very much reminiscent to an incineration process. In this process the organic mate-rial carbonizes which can be visualized by the transformation of the sample into black foam. During the digestion the foam decomposes and finally a clear liquid indicates the completion of the chemical reaction. The generalized non-stoichio-metric chemical equation (1) shows how a general nitrogen containing starting material (CHNO) is mineralized to dissolved ammonium ions.
(CHNO) + H2SO4 CO2 + SO2 + H2O + NH4+ (1)
In the original procedure published by Kjeldahl the mineralization was carried out in boiling sulfuric acid. The oxidation was supported by the addition of the strong oxidizing agent potassium permanganate. After its introduction by Kjeldahl, the digestion reaction was further improved and optimized. Examples were the addition of salts and the use of catalysts which allowed for shorter digestion time. The most common salt used historically was potassium sulfate and the catalysts were selenium and metal salts, particularly of mercury, copper or titanium.
Two types of heating units are used to heat up the sample together with the reagents to boiling temperatures of 340 to 370 °C. One type are IR-digesters and the other are block digesters (see «2.2.11 IR-Digestion versus Block-Digestion», p. 26).
Figure 4: IR-Digestion Unit K-424/435 (left) Block-Digestion Unit K-437 (right).
1.3
1.3.1
1. Digestion
Organicnitrogen isconverted intoNH4
+
2. Distillation
NH3 is distilled
to the receivervessel
3. Titration
Ammonia isdetermined
Figure 3: The three major steps in Kjeldahl nitrogen determina-tions.
Introduction 13
After the digestion has lead to a clear liquid, an additional digestion time of e.g. 30 minutes is usually added, in order to allow complete mineralization [3].
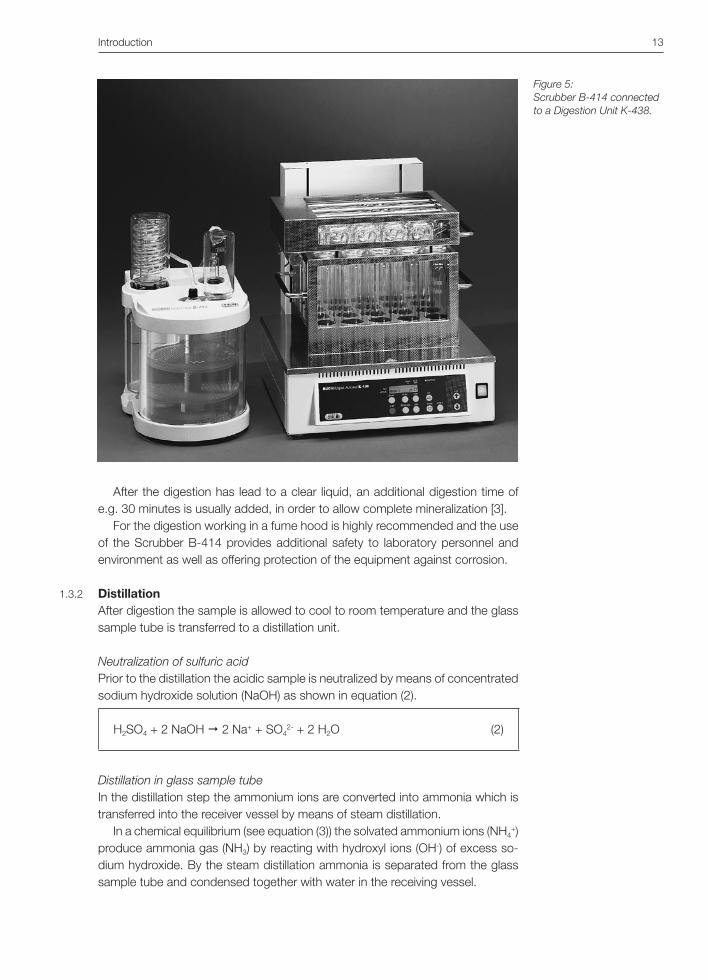
For the digestion working in a fume hood is highly recommended and the use of the Scrubber B-414 provides additional safety to laboratory personnel and environment as well as offering protection of the equipment against corrosion.
DistillationAfter digestion the sample is allowed to cool to room temperature and the glass sample tube is transferred to a distillation unit.
Neutralization of sulfuric acidPrior to the distillation the acidic sample is neutralized by means of concentrated sodium hydroxide solution (NaOH) as shown in equation (2).
H2SO4 + 2 NaOH 2 Na+ + SO42- + 2 H2O (2)
Distillation in glass sample tubeIn the distillation step the ammonium ions are converted into ammonia which is transferred into the receiver vessel by means of steam distillation.
In a chemical equilibrium (see equation (3)) the solvated ammonium ions (NH4+)
produce ammonia gas (NH3) by reacting with hydroxyl ions (OH-) of excess so-dium hydroxide. By the steam distillation ammonia is separated from the glass sample tube and condensed together with water in the receiving vessel.
Figure 5: Scrubber B-414 connected to a Digestion Unit K-438.
1.3.2

14 Introduction
NH4+ + OH- NH3(gas) + H2O (3)
Condensate collection in receiving vesselA common procedure to collect the ammonia in the receiver involves the pres-ence of boric acid B(OH)3 dissolved in water which forms ions with ammonia according to equation (4). The ammonia is quantitatively captured by the boric acid solution forming solvated ammonium ions. See also «1.4 Blanks», p. 13.
B(OH)3 + NH3 + H2O NH4+ + B(OH)4
- (4)
TitrationThe concentration of the captured ammonium ions in the boric acid are deter-mined by means of an acid base titration commonly using standard solutions of sulfuric or hydrochloric acid. Depending on the amount of ammonium ions present, concentrations in the range of 0.01 N to 0.5 N are used. Titrations may be carried out by means of a burette using an appropriate pH-indicator such as Sher mixed indicator [4] (Büchi 003512) to indicate the end point of pH = 4.65 (see «2.4.1 Boric Acid Titration», p.31). For the preparation see «5.1 Two-Stage Mixing Indicator According to Sher for Boric Acid Titration» (p. 44). A second option is to attach a titration stand to the distillation unit and read the volume of consumed acid from the display of the titrator. The most sophisticated pro-cedure is the use of a Kjeldahl distillation unit with a built-in titrator and have the calculation done by the software of the instrument. Whatever the choice of the determination method, the chemical reaction is described by equation (5) show-ing the reaction of the tetrahydroxyborate anion B(OH)4- with a generalized strong acid HX (X = Cl- etc.).
B(OH)4- + HX X- + B(OH)3 + H2O (5)
1.3.3
Figure 6: Distillation units: 1. stand alone distillation (K-355) 2. with external titrator (K-360)3. with built-in titrator (K-370)
Introduction 15
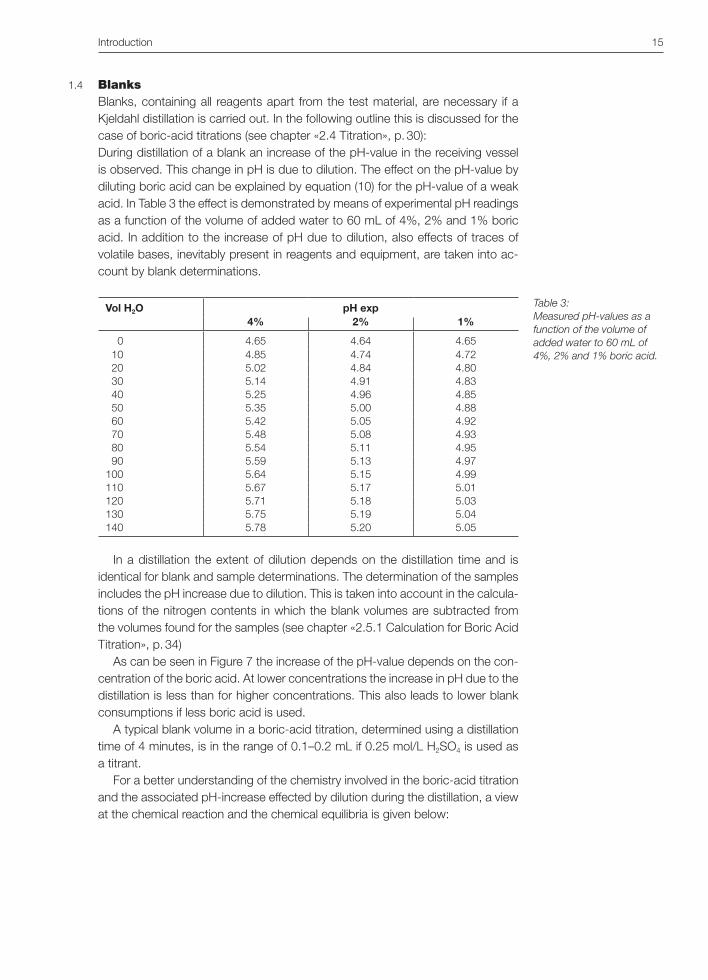
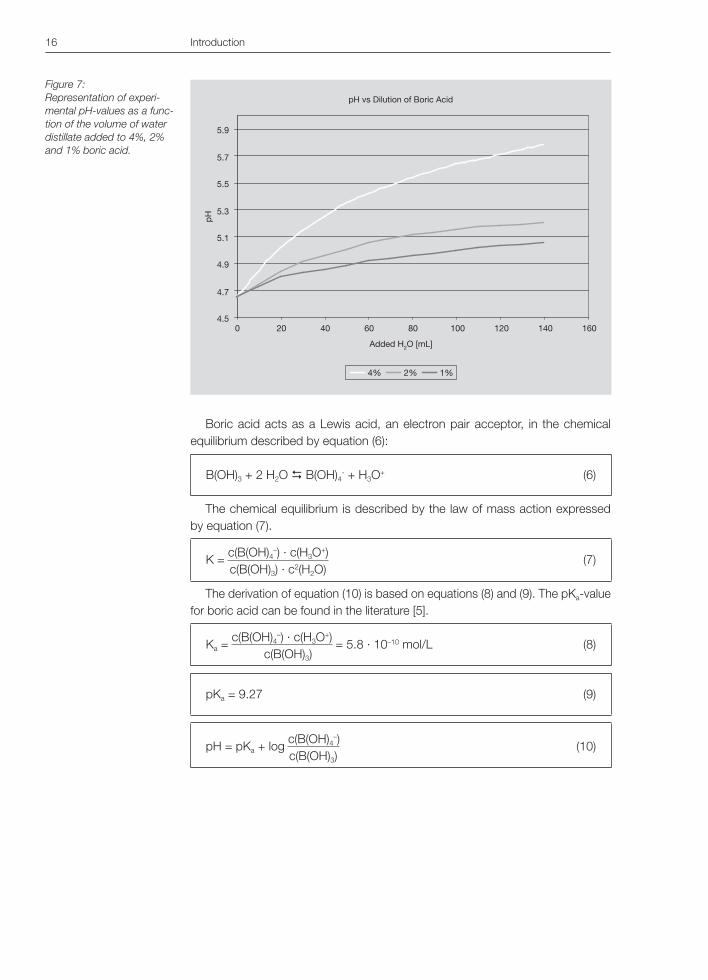
BlanksBlanks, containing all reagents apart from the test material, are necessary if a Kjeldahl distillation is carried out. In the following outline this is discussed for the case of boric-acid titrations (see chapter «2.4 Titration», p. 30): During distillation of a blank an increase of the pH-value in the receiving vessel is observed. This change in pH is due to dilution. The effect on the pH-value by diluting boric acid can be explained by equation (10) for the pH-value of a weak acid. In Table 3 the effect is demonstrated by means of experimental pH readings as a function of the volume of added water to 60 mL of 4%, 2% and 1% boric acid. In addition to the increase of pH due to dilution, also effects of traces of volatile bases, inevitably present in reagents and equipment, are taken into ac-count by blank determinations.
Vol H2O pH exp4% 2% 1%
0 4.65 4.64 4.65 10 4.85 4.74 4.72 20 5.02 4.84 4.80 30 5.14 4.91 4.83 40 5.25 4.96 4.85 50 5.35 5.00 4.88 60 5.42 5.05 4.92 70 5.48 5.08 4.93 80 5.54 5.11 4.95 90 5.59 5.13 4.97100 5.64 5.15 4.99110 5.67 5.17 5.01120 5.71 5.18 5.03130 5.75 5.19 5.04140 5.78 5.20 5.05
In a distillation the extent of dilution depends on the distillation time and is identical for blank and sample determinations. The determination of the samples includes the pH increase due to dilution. This is taken into account in the calcula-tions of the nitrogen contents in which the blank volumes are subtracted from the volumes found for the samples (see chapter «2.5.1 Calculation for Boric Acid Titration», p. 34)
As can be seen in Figure 7 the increase of the pH-value depends on the con-centration of the boric acid. At lower concentrations the increase in pH due to the distillation is less than for higher concentrations. This also leads to lower blank consumptions if less boric acid is used.
A typical blank volume in a boric-acid titration, determined using a distillation time of 4 minutes, is in the range of 0.1–0.2 mL if 0.25 mol/L H2SO4 is used as a titrant.
For a better understanding of the chemistry involved in the boric-acid titration and the associated pH-increase effected by dilution during the distillation, a view at the chemical reaction and the chemical equilibria is given below:
1.4
Table 3:Measured pH-values as a function of the volume of added water to 60 mL of 4%, 2% and 1% boric acid.
16 Introduction
Boric acid acts as a Lewis acid, an electron pair acceptor, in the chemical equilibrium described by equation (6):
B(OH)3 + 2 H2O B(OH)4- + H3O+ (6)
The chemical equilibrium is described by the law of mass action expressed by equation (7).
K = c(B(OH)4–) · c(H3O+)
(7) c(B(OH)3) · c2(H2O)
The derivation of equation (10) is based on equations (8) and (9). The pKa-value for boric acid can be found in the literature [5].
Ka = c(B(OH)4–) · c(H3O+)
= 5.8 · 10–10 mol/L (8) c(B(OH)3)
pKa = 9.27 (9)
pH = pKa + log c(B(OH)4–)
(10) c(B(OH)3)
Figure 7:Representation of experi-mental pH-values as a func-tion of the volume of water distillate added to 4%, 2% and 1% boric acid.
Vol H2O
4.00
4.25
4.50
4.75
5.00
5.25
5.50
5.75
6.00
0 20 40 60 80 100 120 140 160
pH vs Dilution of Boric Acid
4.5
4.7
4.9
5.1
5.3
5.5
5.7
5.9
0 20 40 60 80 100 120 140 160
Added H2O [mL]
pH
4% 2% 1%

Determination of Nitrogen by the Kjeldahl Method 17
Determination of Nitrogen by the Kjeldahl Method
Nitrogen in the oxidized form of nitrates and nitrites and often nitrogen in aro-matic heterocycles do not add quantitatively to the finally determined Kjeldahl reaction product ammonia. In Table 4 some of the most important refractory compounds for Kjeldahl nitrogen determination are summarized and in Table 8, p.17, a classification of organic nitrogen containing compounds is given.
Compound Recovery [%]
Nitrate, nitrite (organic and inorganic) <1
Aromatic N-heterocycles:Pyridine, pyrimidine, thiazole, imidazole, pyrazole
1–<80
Azo compounds 30–85
Hydrazines <50
In the context of studies on the oxidation of organic nitrogen containing sub-stances, a general chemical equation was published by Jurecek et al. [6] [7] [8] in order to describe the oxidation. Kjeldahl digestions of nitrogen containing chemical compounds/substances can either lead to ammonia, nitrate or elemen-tal nitrogen. A theoretical consideration on chemical reactions in the Kjeldahl digestion was published by Morita [9]. A short form of the chemical equations described in [8] and [9] is given in equation (11) and the indices a, b, c are ex-plained to the right.
CHONa+b+c + O a NH3 + b HNO3 + c/2 N2 (11)
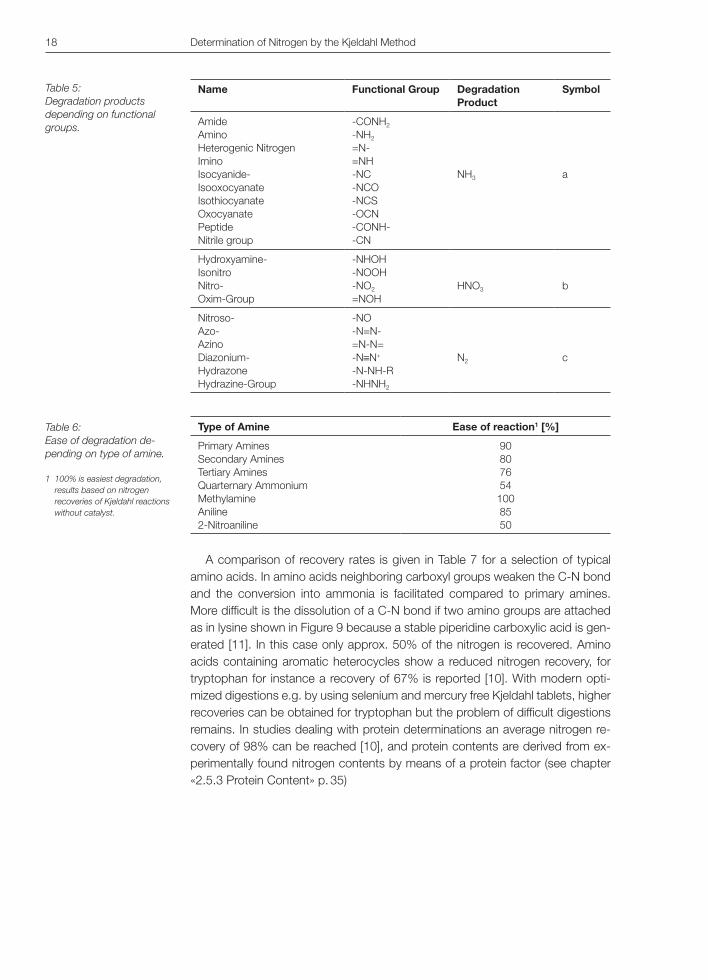
In Table 5 organic functional groups are listed and correlated to the respective nitrogen degradation products a, b, and c as described above in equation (11) [9] [10].
The chemical pathways of degradation processes include simultaneous re-duction, dehydration, hydrolysis, substitution and other reactions. For (-NH2, =NH, ≡N, [R4N]x) the first step is protonation by sulfuric acid. The more alkaline an amine the easier it is protonated aiding the cleavage of the C-N bond. Primary amines are the easiest amines to be digested. In Table 6 the ease of reaction for a series of amines is expressed by relative recovery rates referenced to methyl-amine.
2
Table 4: Refractory compounds which show poor contribu-tion to Kjeldahl nitrogen.
a = groups producing NH3
b = groups producing HNO3
c = groups producing N2
18 Determination of Nitrogen by the Kjeldahl Method
Name Functional Group Degradation Product
Symbol
Amide Amino Heterogenic Nitrogen Imino Isocyanide- Isooxocyanate Isothiocyanate Oxocyanate Peptide Nitrile group
-CONH2 -NH2 =N- =NH -NC -NCO -NCS -OCN -CONH- -CN
NH3
a
Hydroxyamine- Isonitro Nitro- Oxim-Group
-NHOH -NOOH -NO2 =NOH
HNO3
b
Nitroso- Azo- Azino Diazonium- Hydrazone Hydrazine-Group
-NO -N=N- =N-N= -N≡N+ -N-NH-R -NHNH2
N2
c
Type of Amine Ease of reaction1 [%]
Primary Amines Secondary Amines Tertiary Amines Quarternary Ammonium Methylamine Aniline 2-Nitroaniline
90 80 76 54 100 85 50
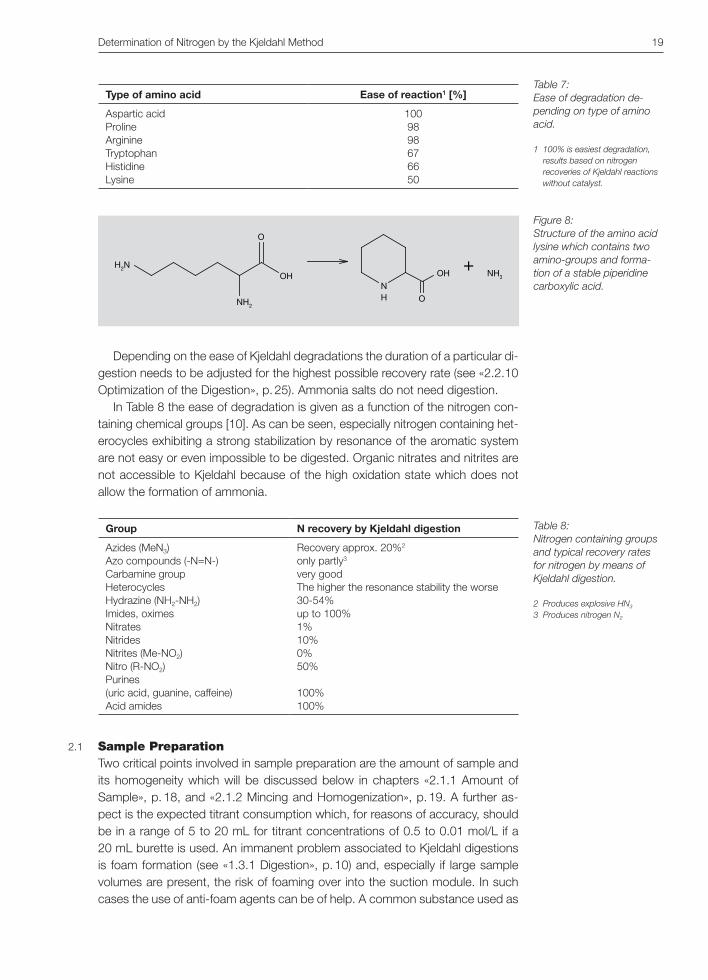
A comparison of recovery rates is given in Table 7 for a selection of typical amino acids. In amino acids neighboring carboxyl groups weaken the C-N bond and the conversion into ammonia is facilitated compared to primary amines. More difficult is the dissolution of a C-N bond if two amino groups are attached as in lysine shown in Figure 9 because a stable piperidine carboxylic acid is gen-erated [11]. In this case only approx. 50% of the nitrogen is recovered. Amino acids containing aromatic heterocycles show a reduced nitrogen recovery, for tryptophan for instance a recovery of 67% is reported [10]. With modern opti-mized digestions e.g. by using selenium and mercury free Kjeldahl tablets, higher recoveries can be obtained for tryptophan but the problem of difficult digestions remains. In studies dealing with protein determinations an average nitrogen re-covery of 98% can be reached [10], and protein contents are derived from ex-perimentally found nitrogen contents by means of a protein factor (see chapter «2.5.3 Protein Content» p. 35)
Table 5:Degradation products depending on functional groups.
Table 6:Ease of degradation de-pending on type of amine.
1 100% is easiest degradation, results based on nitrogen recoveries of Kjeldahl reactions without catalyst.
Determination of Nitrogen by the Kjeldahl Method 19
Type of amino acid Ease of reaction1 [%]
Aspartic acidProlineArginineTryptophanHistidineLysine
100 9898676650
Depending on the ease of Kjeldahl degradations the duration of a particular di-gestion needs to be adjusted for the highest possible recovery rate (see «2.2.10 Optimization of the Digestion», p. 25). Ammonia salts do not need digestion.
In Table 8 the ease of degradation is given as a function of the nitrogen con-taining chemical groups [10]. As can be seen, especially nitrogen containing het-erocycles exhibiting a strong stabilization by resonance of the aromatic system are not easy or even impossible to be digested. Organic nitrates and nitrites are not accessible to Kjeldahl because of the high oxidation state which does not allow the formation of ammonia.
Group N recovery by Kjeldahl digestion
Azides (MeN3)Azo compounds (-N=N-)Carbamine groupHeterocyclesHydrazine (NH2-NH2)Imides, oximesNitratesNitridesNitrites (Me-NO2)Nitro (R-NO2)Purines(uric acid, guanine, caffeine)Acid amides
Recovery approx. 20%2
only partly3
very goodThe higher the resonance stability the worse30-54%up to 100%1%10%0%50%
100%100%
Sample PreparationTwo critical points involved in sample preparation are the amount of sample and its homogeneity which will be discussed below in chapters «2.1.1 Amount of Sample», p. 18, and «2.1.2 Mincing and Homogenization», p. 19. A further as-pect is the expected titrant consumption which, for reasons of accuracy, should be in a range of 5 to 20 mL for titrant concentrations of 0.5 to 0.01 mol/L if a 20 mL burette is used. An immanent problem associated to Kjeldahl digestions is foam formation (see «1.3.1 Digestion», p. 10) and, especially if large sample volumes are present, the risk of foaming over into the suction module. In such cases the use of anti-foam agents can be of help. A common substance used as
Table 7: Ease of degradation de-pending on type of amino acid.
1 100% is easiest degradation, results based on nitrogen recoveries of Kjeldahl reactions without catalyst.
Table 8: Nitrogen containing groups and typical recovery rates for nitrogen by means of Kjeldahl digestion.
2 Produces explosive HN3
3 Produces nitrogen N2
2.1
O
H2N
NH2
OH OH
NH O
+NH3
Figure 8:Structure of the amino acid lysine which contains two amino-groups and forma-tion of a stable piperidine carboxylic acid.
150 Index
8 Index
AAcid consumption per sample 20Ammonia 47Amount of sample 18Anti-foam agents 17AOAC method 43Auto Kjeldahl Unit K-370 18
BBack titration 32Beer 89Blanks 13Block-Digestion 10, 26Boric acid 14Boric acid titration 31
CCalculations 33Catalyst 22Cheese 93Chemical degradation processes 15Cookies 103
DDevarda reagent 27Digestion 10, 20DIN norm 42Distillation 11, 28Distillation time 30Drying of samples 19
EEggs 99Environmental applications 47EPA 350.2 51EPA 351.3 61, 68
FFood and feed 71
HH2O2 Digestion 125Hydrogen peroxide 23, 79
Index 151
IIdeal ratio of salt to sulfuric acid 21IR-Digestion 10, 26ISO norm 42
KKjeldahl method 7Kjeldahl Sampler K-371 18
LLimit of detection 36Limit of quantification 36
MMacro Kjeldahl 19Meat 113, 119, 125Micro Kjeldahl 19Milk 71, 79Milk direct distillation 75Milk powder 85Mincing and homogenization 19
NNitrate 53Nutrition facts labels 9
OOptimization of the digestion 25
PParameters for digestion 24Pasta 109Protein content 35Protein contents foodstuffs 9Protein factors 36
RReceiving vessel of distillate 29Recovery rates 16
152 Index
SSalami 137, 143Salami (Pepperoni) 131Sample preparation 17Scrubber B-414 11Semimicro Kjeldahl 19Sher indicator 31Steam distillation 29Steam power 30Suction manifold 27
TTitration 12, 30TKN 20Total Kjeldahl Nitrogen (TKN) 57
VVerification 38Verification of distillation unit 38Verification of the digestion unit 39

List of Figures and Tables 153
List of Figures and Tables
Figure 1: Johan Kjeldahl in his laboratory at Carlsberg Brewery in Copenhagen in the year 1880 (image by courtesy of Carlsberg Archives, Copenhagen) . . . . . . . . . . . . . . . . . 7
Figure 2: Typical Nutrition Facts Labels as used in North America and Europe . . . . . . . . . . . . . . . . . . . . . . . . . . . . . . . . . . 9
Figure 3: The three major steps in Kjeldahl nitrogen determinations 10Figure 4: IR-Digestion Unit K-424/435 (left) Block-Digestion
Unit K-437 (right) . . . . . . . . . . . . . . . . . . . . . . . . . . . . . 10Figure 5: Scrubber B-414 connected to a Digestion Unit K-438. . 11Figure 6: Distillation units: 1. stand alone distillation (K-355),
2. with external titrator (K-360), 3. with built-in titrator (K-370) . . . . . . . . . . . . . . . . . . . . . . . . . . . . . . . . . . . . . 12
Figure 7: Representation of experimental pH-values as a function of the volume of water distillate added to 4%, 2% and 1% boric acid . . . . . . . . . . . . . . . . . . . . . . 14
Figure 8: Structure of the amino acid lysine which contains two amino-groups and formation of a stable piperidine carboxylic acid . . . . . . . . . . . . . . . . . . . . . . . . . . . . . . . 17
Figure 9: Buchi Mixer B-400 . . . . . . . . . . . . . . . . . . . . . . . . . . . . 19Figure 10: Suction module for -digestion with H2O2 . . . . . . . . . . . . 23Figure 11: Heating systems in IR- and block digesters . . . . . . . . . 26Figure 12: Büchi Scrubber B-414 . . . . . . . . . . . . . . . . . . . . . . . . . 28Figure 13: Autokjeldahlsystem K-370/371 . . . . . . . . . . . . . . . . . . . 29Figure 14: Titration Unit with receiving vessel . . . . . . . . . . . . . . . . . 30Figure 15: Semiautomatic distillation unit with external titrator
(Büchi KjelFlex K-360, Metrohm DMP 785) . . . . . . . . . . 31Figure 16: Titration curve for ammonium tetrahydroxyborate with
acid . . . . . . . . . . . . . . . . . . . . . . . . . . . . . . . . . . . . . . . 32Figure 17: Typical food sample . . . . . . . . . . . . . . . . . . . . . . . . . . . 35Figure 18: IQ-OQ documentation . . . . . . . . . . . . . . . . . . . . . . . . . 37
Table 1: Citation from Kjeldahl’s original publication of 1883 . . . . 8Table 2: Protein contents of some foodstuffs. . . . . . . . . . . . . . . . 9Table 3: Measured pH-values as a function of the volume of
added water to 60 mL of 4%, 2% and 1% boric acid . . 13Table 4: Refractory compounds which show poor contribution
to Kjeldahl nitrogen . . . . . . . . . . . . . . . . . . . . . . . . . . . . 15Table 5: Degradation products depending on functional groups . 16Table 6: Ease of degradation depending on type of amine . . . . . 16Table 7: Ease of degradation depending on type of amino acid . 17Table 8: Nitrogen containing groups and typical recovery rates
for nitrogen by means of Kjeldahl digestion . . . . . . . . . . 17
9

154 Separation of mixtures using a rotary evaporator and a glass oven
Table 9: Correlation of nitrogen contents (N[mg], N[%]) with sample weight, number of Kjeldahl tablets (KT), volume of sulfuric acid (Acid [mL]), concentration of titrant (c(HX) [mol/L] and titrant consumptions (Titrant con- sumption sample [mL] in 4% boric acid and Titrant con- sumption blank [mL] in 4% boric acid) . . . . . . . . . . . . . 18
Table 10: Terminology macro, semi micro and micro Kjeldahl . . . . 19Table 11: Sample volumes for TKN determinations . . . . . . . . . . . 20Table 12: Consumption of volumes (A) and weights (B) of 98%
H2SO4 for different components in samples. . . . . . . . . . 21Table 13: Calculation of the consumption of concentrated sulfuric
acid by 1.0 g of sample . . . . . . . . . . . . . . . . . . . . . . . . 21Table 14: Effect of ratio H2SO4 [mL] to K2SO4 [g] on optimal
digestion temperature [°C] . . . . . . . . . . . . . . . . . . . . . . 22Table 15: Composition of a series of commercially
available Kjeldahl tablets . . . . . . . . . . . . . . . . . . . . . . . . 22Table 16: Temperature program used on the Digestion Automat
K-438 . . . . . . . . . . . . . . . . . . . . . . . . . . . . . . . . . . . . . . 25Table 17: Digestion parameters for typical sample weights . . . . . . 25Table 18: Correlation of times when samples become translucent
(clearing) and total digestion time with recovery rates using selenium and mercury free Kjeldahl tablets . . . . . 25
Table 19: Further measures for improved conditions in digestions, of boiling and foaming samples . . . . . . . . . . . . . . . . . . . 26
Table 20: Typical distillation parameters for a boric acid titration on the Auto Kjeldahl K-370 . . . . . . . . . . . . . . . . . . . . . . 28
Table 21: Typical distillation parameters for a back titration on the Auto Kjeldahl K-370 . . . . . . . . . . . . . . . . . . . . . . . . 28
Table 22: Typical titration parameters for a boric acid titration on the Auto Kjeldahl K-370 . . . . . . . . . . . . . . . . . . . . . . . . 32
Table 23: Typical titration parameters for a back titration on the Auto Kjeldahl K-370 . . . . . . . . . . . . . . . . . . . . . . . . . . . 33
Table 24: Empirical protein factors for the Kjeldahl method . . . . . 36Table 25: Reporting of analytical results [DIN EN 32645) . . . . . . . 37Table 26: Distillation parameters for boric acid titration of
ammonium dihydrogen phosphate . . . . . . . . . . . . . . . . 39


BÜCHI Labortechnik AGPostfach9230 Flawil SwitzerlandTel. +41 71 394 63 63Fax +41 71 394 65 [email protected]
ISBN 978-3-033-01688-0
Quality in your hands