BSC6900 UMTS Product Documentation
51
http://support.huawei.com/hedex/pages/SE000070333931185611/09/SE000070333931185611/09/resources/mbsc/RANCapacityMonitoringGuide.htm?ft=99&id=31185611_09_10290&keyword=wbbp[1/10/2014 12:22:02 PM] RAN14.0 Capacity Monitoring Guide Issue 06 Date 2013-11-20
Transcript of BSC6900 UMTS Product Documentation
http://support.huawei.com/hedex/pages/SE000070333931185611/09/SE000070333931185611/09/resources/mbsc/RANCapacityMonitoringGuide.htm?ft=99&id=31185611_09_10290&keyword=wbbp[1/10/2014 12:22:02 PM]
RAN14.0
Capacity Monitoring Guide
Issue 06
Date 2013-11-20
http://support.huawei.com/hedex/pages/SE000070333931185611/09/SE000070333931185611/09/resources/mbsc/RANCapacityMonitoringGuide.htm?ft=99&id=31185611_09_10290&keyword=wbbp[1/10/2014 12:22:02 PM]
HUAWEI TECHNOLOGIES CO., LTD.
Copyright © Huawei Technologies Co., Ltd. 2013. All rights reserved.No part of this document may be reproduced or transmitted in any form or by any means without prior writtenconsent of Huawei Technologies Co., Ltd.
Trademarks and Permissions
and other Huawei trademarks are trademarks of Huawei Technologies Co., Ltd.All other trademarks and trade names mentioned in this document are the property of their respectiveholders.
NoticeThe purchased products, services and features are stipulated by the contract made between Huawei and thecustomer. All or part of the products, services and features described in this document may not be within thepurchase scope or the usage scope. Unless otherwise specified in the contract, all statements, information,and recommendations in this document are provided "AS IS" without warranties, guarantees orrepresentations of any kind, either express or implied.The information in this document is subject to change without notice. Every effort has been made in thepreparation of this document to ensure accuracy of the contents, but all statements, information, andrecommendations in this document do not constitute a warranty of any kind, express or implied.
Huawei Technologies Co., Ltd.
Address: Huawei Industrial BaseBantian, LonggangShenzhen 518129People's Republic of China
Website: http://www.huawei.com
Email: [email protected]
http://support.huawei.com/hedex/pages/SE000070333931185611/09/SE000070333931185611/09/resources/mbsc/RANCapacityMonitoringGuide.htm?ft=99&id=31185611_09_10290&keyword=wbbp[1/10/2014 12:22:02 PM]
About This Document
PurposeAs traffic continues to increase on mobile telecommunications networks, more and more resources such as transmission, signaling processing, and air interface resources are required to sustainuser experience. Therefore, real-time resource monitoring, prompt resource bottleneck detection, and proper network expansion play a fundamental role in sustaining good user experience onmobile telecommunications networks.
This document describes how to monitor usage of various network resources and locate network resource bottlenecks.
Guidelines provided in this document apply to the BSC6900 and 3900 series base stations.
Radio Network Controllers (RNCs) used in this document refer to Huawei BSC6900 products.For details about the MML commands, parameters, alarms, and performance counters, see section "Operation and Maintenance" in BSC6900 UMTS Product Documentation or 3900 Series WCDMA NodeB Product
Documentation.Flow control is an important feature required for capacity monitoring. For details about flow control, see Flow Control Feature Parameter Description in RAN feature documentation.
OrganizationThis document provides guidelines for preventing resource congestion. The guidelines are direct and operable.
Chapter Description
1 Network ResourceMonitoring Methods
Describes basic concepts associated with network resources,including definitions and monitoring activities.
2 Network ResourceCounters
Describes principles, methods, and recommendations measuresfor monitoring various network resources.
3 Diagnosis of ProblemsRelated to NetworkResources
Provides fault analysis and locating methods to handle networkcongestion or overload events.
4 Counter Definitions Lists all performance counters mentioned in the other chapters.This helps monitor network resources and design the graphicaluser interface (GUI) for resource usage analysis.
Change HistoryThe latest document issue contains all changes made in previous issues.
Issue 06 (2013-11-20)This is issue 06 of RAN14.0.
Compared with issue 05 (2013-06-28), this issue includes the following changes:
Feedbac
http://support.huawei.com/hedex/pages/SE000070333931185611/09/SE000070333931185611/09/resources/mbsc/RANCapacityMonitoringGuide.htm?ft=99&id=31185611_09_10290&keyword=wbbp[1/10/2014 12:22:02 PM]
Optimized figures in this document.
Issue 05 (2013-06-28)This is issue 05 of RAN14.0.
Compared with issue 04 (2013-04-15), this issue includes the following changes:
Updated the optimization suggestions in section “2.3 MPU CPU Load”.Updated the monitoring methods and optimization suggestions in section “2.10 CE Usage” and “2.13 NodeB CNBAP Load”.
Issue 04 (2013-04-15)This is issue 04 of RAN14.0.
Compared with issue 03 (2012-11-07), this issue includes the following changes:
Updated the monitoring principles, monitoring methods, and optimization suggestions in chapter 2 "Network Resource Counters."
Compared with issue 03 (2012-11-07), this issue excludes the following topics:
Deleted "NodeB CPU Load".Deleted 3"HSPA Related Resources".
Issue 03 (2012-11-07)This is issue 03 of RAN14.0.
Compared with issue 02 (2012-06-30), this issue includes the following changes:
Updated section "NodeB CNBAP Load."
Issue 02 (2012-06-30)This is issue 02 of RAN14.0.
Compared with issue 01 (2012-04-30), this issue includes the following changes:
Updated the formula for calculating the CE usage by replacing the NodeB counters with RNC counters.Added a section describing the MPU.Adjusted the monitoring thresholds for the SPU, DPU, and interface boards.Adjusted the document structure.
Issue 01 (2012-04-30)This is issue 01 of RAN14.0.
Compared with Draft A (2012-02-15), this issue includes the following changes:
Optimized some descriptions.
Draft A (2012-02-15)This is the Draft A release of RAN14.0.
Contents
http://support.huawei.com/hedex/pages/SE000070333931185611/09/SE000070333931185611/09/resources/mbsc/RANCapacityMonitoringGuide.htm?ft=99&id=31185611_09_10290&keyword=wbbp[1/10/2014 12:22:02 PM]
About This Document1 Network Resource Monitoring Methods
1.1 Introduction to Network Resources1.2 Resource Monitoring Procedure
2 Network Resource Counters2.1 Overview2.2 SPU CPU Load2.3 MPU CPU Load2.4 DPU DSP Load2.5 Interface Board Load2.6 SCU Board Load2.7 Downlink Load2.8 Uplink Load2.9 OVSF Code Usage2.10 CE Usage2.11 Iub Bandwidth2.12 Common Channels2.13 NodeB CNBAP Load
3 Diagnosis of Problems Related to Network Resources3.1 Call Blocks in the Basic Call Flow3.2 Call Congestion Counters3.3 Resource Usage Analysis
4 Counter Definitions
1 Network Resource Monitoring Methods
There are two methods of monitoring system resources and detecting resource bottlenecks:
Proactive monitoring: This is a method of simultaneously monitoring various network resources. When detecting that usage of a resource continually exceeds its upper threshold, you canperform capacity expansion to relieve resource congestion. It is easy to implement and suitable for daily monitoring of resources. For details, see chapter 2 "Network ResourceCounters."
Problem-driven analysis: When a problem occurs, for example, call block, this analysis is performed to find the system capacity bottleneck while locating the problem. This methodrequires higher problem locating skills, but it maximizes system resource use and delays the network expansion. For details, see chapter 3 "Diagnosis of Problems Related to NetworkResources."
This chapter describes various network resources and the resource monitoring procedure.
http://support.huawei.com/hedex/pages/SE000070333931185611/09/SE000070333931185611/09/resources/mbsc/RANCapacityMonitoringGuide.htm?ft=99&id=31185611_09_10290&keyword=wbbp[1/10/2014 12:22:02 PM]
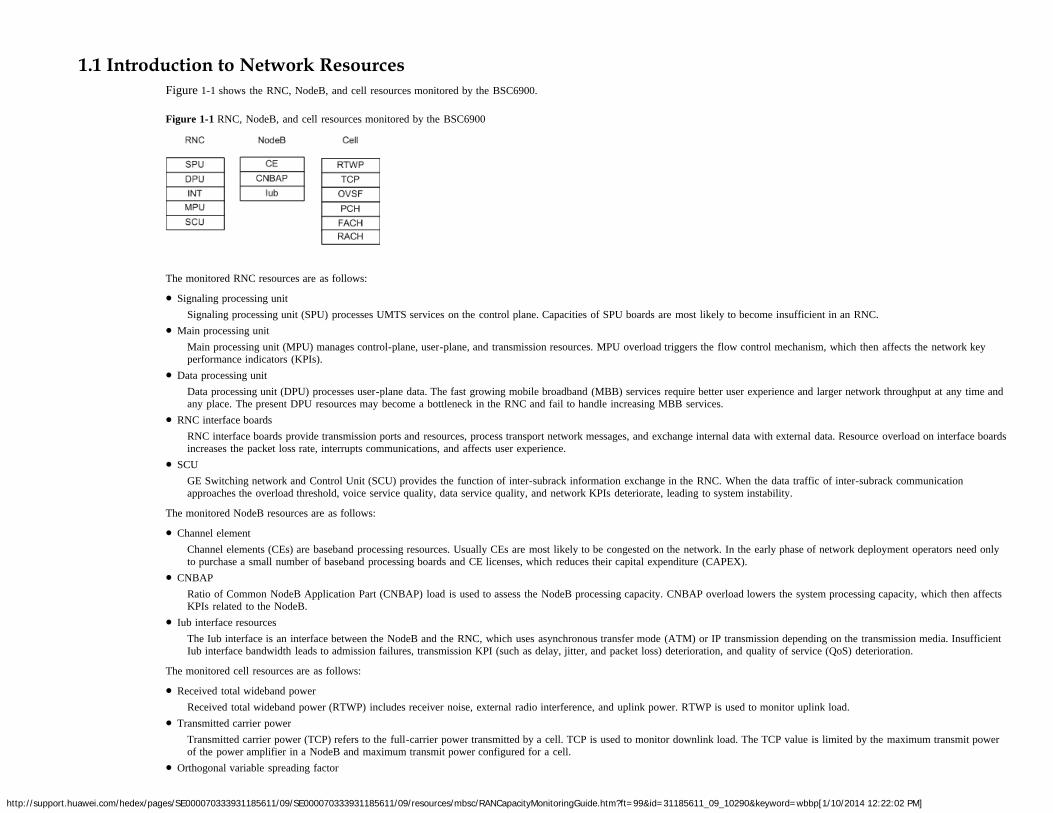
1.1 Introduction to Network ResourcesFigure 1-1 shows the RNC, NodeB, and cell resources monitored by the BSC6900.
Figure 1-1 RNC, NodeB, and cell resources monitored by the BSC6900
The monitored RNC resources are as follows:
Signaling processing unitSignaling processing unit (SPU) processes UMTS services on the control plane. Capacities of SPU boards are most likely to become insufficient in an RNC.
Main processing unitMain processing unit (MPU) manages control-plane, user-plane, and transmission resources. MPU overload triggers the flow control mechanism, which then affects the network keyperformance indicators (KPIs).
Data processing unitData processing unit (DPU) processes user-plane data. The fast growing mobile broadband (MBB) services require better user experience and larger network throughput at any time andany place. The present DPU resources may become a bottleneck in the RNC and fail to handle increasing MBB services.
RNC interface boardsRNC interface boards provide transmission ports and resources, process transport network messages, and exchange internal data with external data. Resource overload on interface boardsincreases the packet loss rate, interrupts communications, and affects user experience.
SCUGE Switching network and Control Unit (SCU) provides the function of inter-subrack information exchange in the RNC. When the data traffic of inter-subrack communicationapproaches the overload threshold, voice service quality, data service quality, and network KPIs deteriorate, leading to system instability.
The monitored NodeB resources are as follows:
Channel elementChannel elements (CEs) are baseband processing resources. Usually CEs are most likely to be congested on the network. In the early phase of network deployment operators need onlyto purchase a small number of baseband processing boards and CE licenses, which reduces their capital expenditure (CAPEX).
CNBAPRatio of Common NodeB Application Part (CNBAP) load is used to assess the NodeB processing capacity. CNBAP overload lowers the system processing capacity, which then affectsKPIs related to the NodeB.
Iub interface resourcesThe Iub interface is an interface between the NodeB and the RNC, which uses asynchronous transfer mode (ATM) or IP transmission depending on the transmission media. InsufficientIub interface bandwidth leads to admission failures, transmission KPI (such as delay, jitter, and packet loss) deterioration, and quality of service (QoS) deterioration.
The monitored cell resources are as follows:
Received total wideband powerReceived total wideband power (RTWP) includes receiver noise, external radio interference, and uplink power. RTWP is used to monitor uplink load.
Transmitted carrier powerTransmitted carrier power (TCP) refers to the full-carrier power transmitted by a cell. TCP is used to monitor downlink load. The TCP value is limited by the maximum transmit powerof the power amplifier in a NodeB and maximum transmit power configured for a cell.
Orthogonal variable spreading factor
http://support.huawei.com/hedex/pages/SE000070333931185611/09/SE000070333931185611/09/resources/mbsc/RANCapacityMonitoringGuide.htm?ft=99&id=31185611_09_10290&keyword=wbbp[1/10/2014 12:22:02 PM]
Orthogonal variable spreading factor (OVSF) refers to downlink spread factor resource. Insufficiency of OVSF resources affects the user equipment's (UE's) access to the network.Paging channel
The PCH usage is affected by the location area and routing area planning. After the solution to signaling storm is introduced, the number of UEs in CELL_PCH state increases, therebyincreasing the PCH usage. PCH overload decreases the paging success rate.
Random access channel and forward access channelRandom access channel (RACH) and forward access channel (FACH) carry signaling and some user-plane data. RACH or FACH overload decreases the access success rate and affectsuser experience.
1.2 Resource Monitoring ProcedureDuring network operation, overuse of network resources is determined by measuring the usage of various resources. When the usage of a resource exceeds its upper threshold, check whetherother resources also exceed their upper thresholds.
If yes, the cell or NodeB is overloaded and capacity expansion is required.If no, the cell or NodeB is not necessarily overloaded and capacity expansion is not mandatory. The problem can be resolved through other adjustments or optimizations.
For example, when the usage of CE resources exceeds 70% but the usage of other resources such as RTWP, TCP, and OVSF is within the allowed range, CE resources are consideredinsufficient but the cell is not overloaded. To resolve this problem, a license for a larger amount of CE resources or more baseband processing boards are required instead of NodeB capacityexpansion.
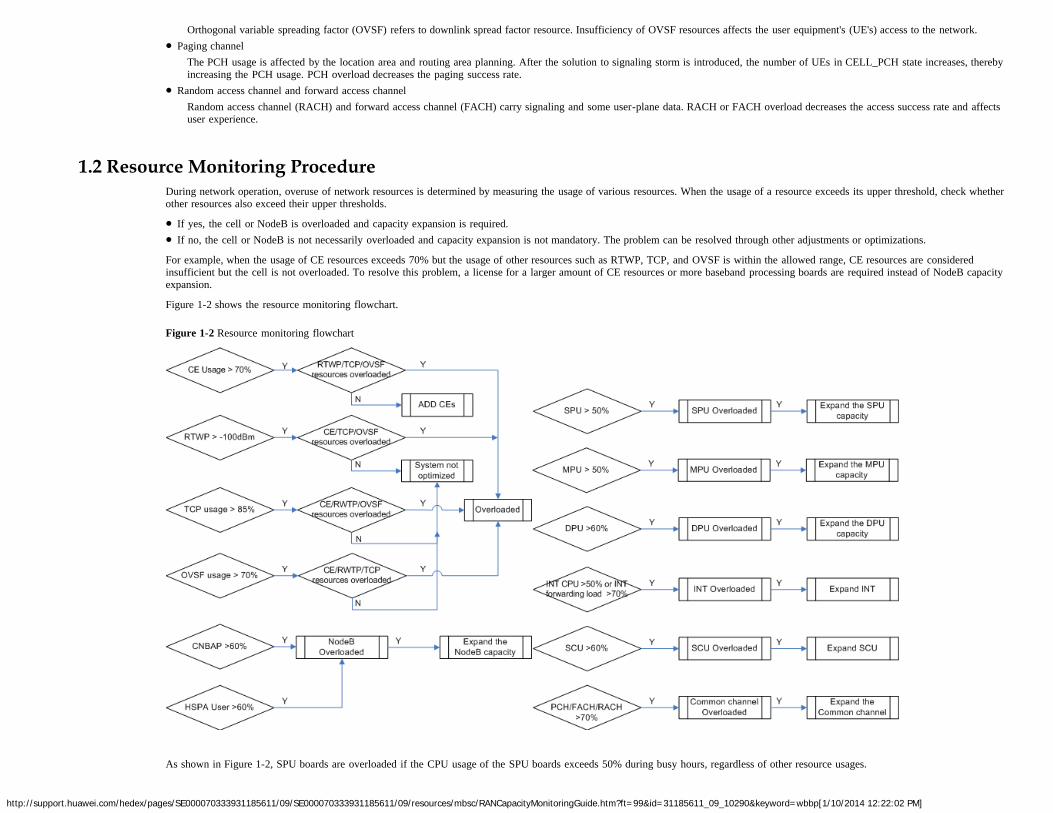
Figure 1-2 shows the resource monitoring flowchart.
Figure 1-2 Resource monitoring flowchart
As shown in Figure 1-2, SPU boards are overloaded if the CPU usage of the SPU boards exceeds 50% during busy hours, regardless of other resource usages.
http://support.huawei.com/hedex/pages/SE000070333931185611/09/SE000070333931185611/09/resources/mbsc/RANCapacityMonitoringGuide.htm?ft=99&id=31185611_09_10290&keyword=wbbp[1/10/2014 12:22:02 PM]
This flowchart applies to most resource monitoring scenarios, except when the system overload is caused by an unexpected event, but not a service increase. Unexpected events are notconsidered in this flowchart. Causes for unexpected events can be located based on their association with various resource bottlenecks. For details about how to locate a resource-relatedproblem, see chapter 3 "Diagnosis of Problems Related to Network Resources".
For the sake of simplicity, the proactive monitoring methods described in chapter 2 "Network Resource Counters" exclude unexpected events.
2 Network Resource Counters
2.1 OverviewVarious counters are defined to represent the resource usage or load of a UTRAN system. In addition, upper thresholds for these counters are predefined.
Identifying peak hours is a key to accurate counter analysis. There are various methods of identifying peak hours. The simplest is to take the hours when the most resources are consumed aspeak hours.
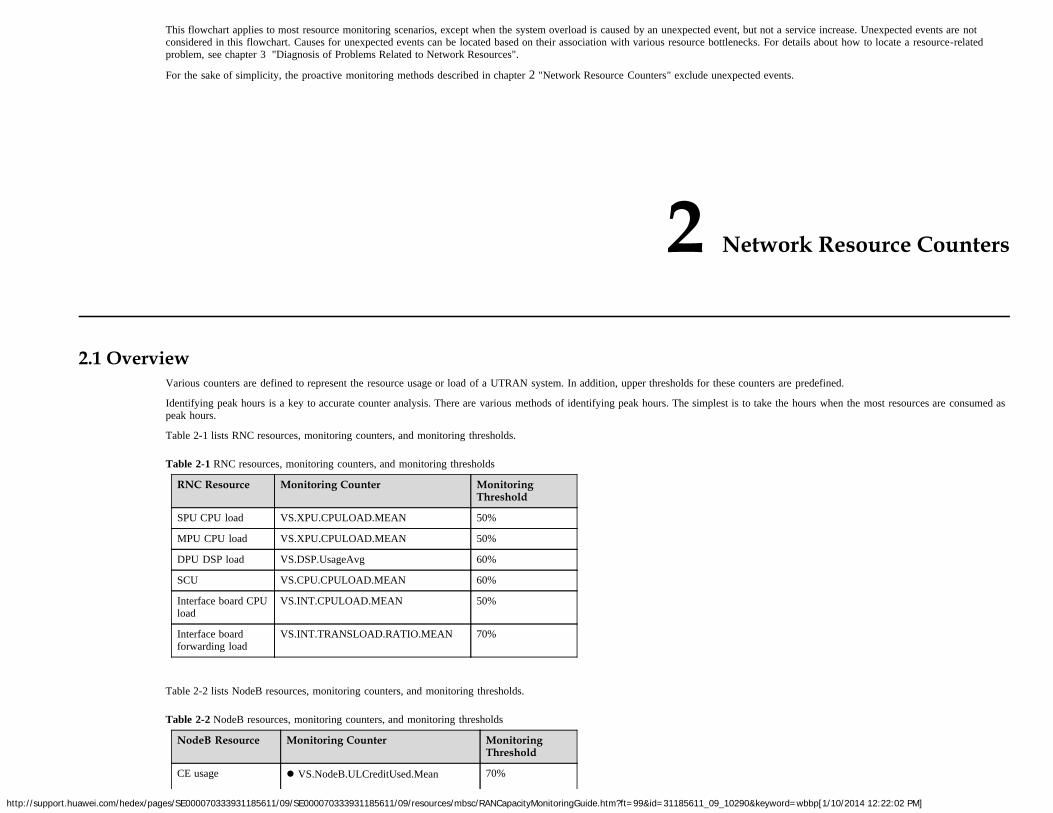
Table 2-1 lists RNC resources, monitoring counters, and monitoring thresholds.
Table 2-1 RNC resources, monitoring counters, and monitoring thresholds
RNC Resource Monitoring Counter MonitoringThreshold
SPU CPU load VS.XPU.CPULOAD.MEAN 50%
MPU CPU load VS.XPU.CPULOAD.MEAN 50%
DPU DSP load VS.DSP.UsageAvg 60%
SCU VS.CPU.CPULOAD.MEAN 60%
Interface board CPUload
VS.INT.CPULOAD.MEAN 50%
Interface boardforwarding load
VS.INT.TRANSLOAD.RATIO.MEAN 70%
Table 2-2 lists NodeB resources, monitoring counters, and monitoring thresholds.
Table 2-2 NodeB resources, monitoring counters, and monitoring thresholds
NodeB Resource Monitoring Counter MonitoringThreshold
CE usage VS.NodeB.ULCreditUsed.Mean 70%
http://support.huawei.com/hedex/pages/SE000070333931185611/09/SE000070333931185611/09/resources/mbsc/RANCapacityMonitoringGuide.htm?ft=99&id=31185611_09_10290&keyword=wbbp[1/10/2014 12:22:02 PM]
VS.LC.ULCreditUsed.Mean VS.LC.DLCreditUsed.Mean VS.HW.DLCreditAvailable VS.HW.ULCreditAvailable
CNBAP load ofNodeB
VS.RadioLink.Recv.Mean VS.DedicMeaRpt.MEAN
60%
For details about other resources, monitoring counters, and monitoring thresholds, see the corresponding sections.
2.2 SPU CPU Load2.2.1 Monitoring Principles
An RNC can be configured with multiple SPU boards (SPUa or SPUb boards). SPU boards are classified into main control SPU boards and non-main control SPU boards, depending on theloaded software. Each SPUa board contains four CPUs and each SPUb board contains eight CPUs. Each CPU represents a subsystem. Subsystems can be classified into SPU subsystems andMain Processing Unit (MPU) subsystems.
Subsystem 0 of the main control SPU board is the MPU subsystem, which manages the user-plane, control-plane, and transmission resources of the RNC.Other subsystems of the main control SPU board and all the subsystems of the non-main control SPU board are the SPU subsystems, also called CPU for Service (CPUS) subsystems,
which process services on the control plane.
To set the logical function type of an SPU board, run the ADD BRD command and set the parameter as follows:
To add a main control SPU board, set the Logical function type parameter to RUCP.To add a non-main control SPU board, set the Logical function type parameter to UCP.
This section describes SPU subsystems only. For details about the MPU subsystem, see section 2.3 "MPU CPU Load."
Functions of SPU subsystems are as follows:
Processing upper-layer signaling over the Uu, Iu, Iur, and Iub interfacesProcessing transport layer signalingAllocating and managing various resources necessary for service setup, and establishing signaling and service connectionsProcessing RNC frame number (RFN)
The SPU CPU load is classified as follows:
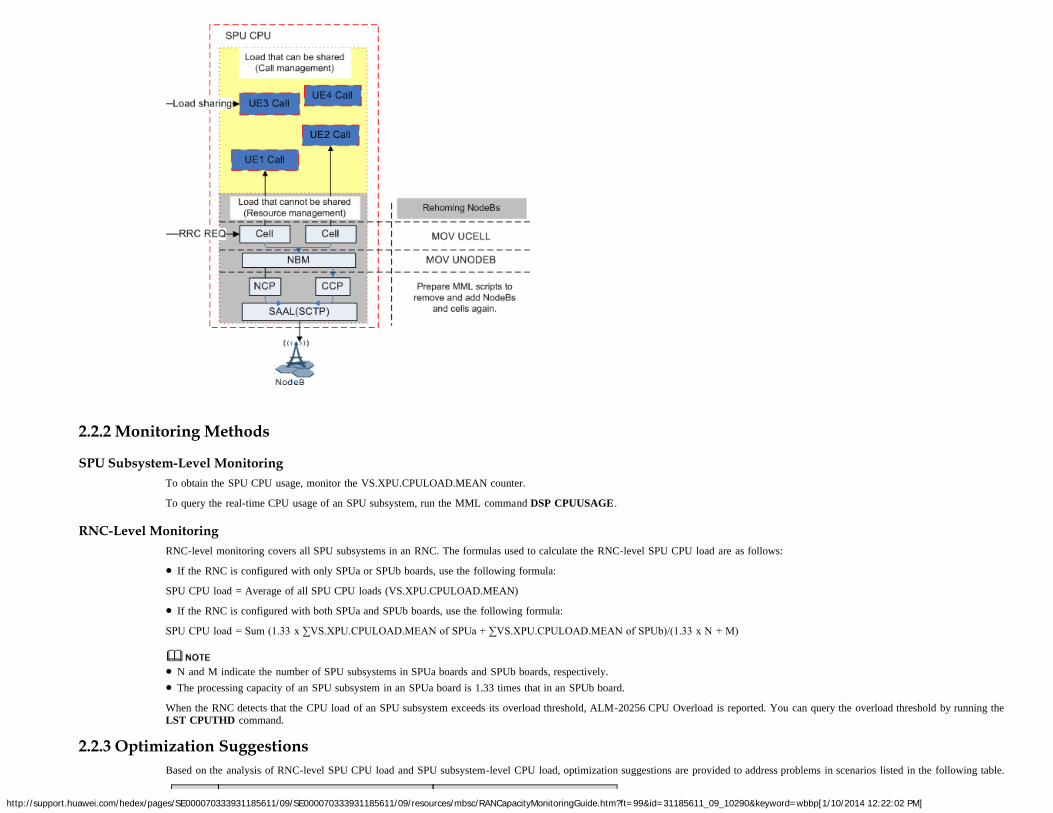
Shareable load that comes from call management. When an SPU subsystem is overloaded, the load sharing mechanism works automatically to forward new calls and the loads they causedto other lightly-loaded subsystems.
Non-shareable load that comes from cell resource management, NodeB resource management, and signaling management at the transport layer.By setting parameters, these functions and the loads they caused can be processed by a specific subsystem instead of being forwarded to other subsystems. The non-shareable load on aspecific subsystem can be reduced by re-homing NodeBs, reconfiguring the SCTP link, or enabling the SSN resource pool feature.
For details about load sharing and SSN resource pool feature, see Flow Control Feature Parameter Description in the RAN feature documentation.
The ratio of shareable load to non-shareable load is approximately 2:1. The ratio slightly varies according to different traffic models but applies to most traffic models.
Figure 2-1 shows the CPU load allocation in the SPU.
Figure 2-1 CPU load allocation in the SPU
http://support.huawei.com/hedex/pages/SE000070333931185611/09/SE000070333931185611/09/resources/mbsc/RANCapacityMonitoringGuide.htm?ft=99&id=31185611_09_10290&keyword=wbbp[1/10/2014 12:22:02 PM]
2.2.2 Monitoring Methods
SPU Subsystem-Level MonitoringTo obtain the SPU CPU usage, monitor the VS.XPU.CPULOAD.MEAN counter.
To query the real-time CPU usage of an SPU subsystem, run the MML command DSP CPUUSAGE.
RNC-Level MonitoringRNC-level monitoring covers all SPU subsystems in an RNC. The formulas used to calculate the RNC-level SPU CPU load are as follows:
If the RNC is configured with only SPUa or SPUb boards, use the following formula:
SPU CPU load = Average of all SPU CPU loads (VS.XPU.CPULOAD.MEAN)
If the RNC is configured with both SPUa and SPUb boards, use the following formula:
SPU CPU load = Sum (1.33 x ∑VS.XPU.CPULOAD.MEAN of SPUa + ∑VS.XPU.CPULOAD.MEAN of SPUb)/(1.33 x N + M)
N and M indicate the number of SPU subsystems in SPUa boards and SPUb boards, respectively.The processing capacity of an SPU subsystem in an SPUa board is 1.33 times that in an SPUb board.
When the RNC detects that the CPU load of an SPU subsystem exceeds its overload threshold, ALM-20256 CPU Overload is reported. You can query the overload threshold by running theLST CPUTHD command.
2.2.3 Optimization SuggestionsBased on the analysis of RNC-level SPU CPU load and SPU subsystem-level CPU load, optimization suggestions are provided to address problems in scenarios listed in the following table.
http://support.huawei.com/hedex/pages/SE000070333931185611/09/SE000070333931185611/09/resources/mbsc/RANCapacityMonitoringGuide.htm?ft=99&id=31185611_09_10290&keyword=wbbp[1/10/2014 12:22:02 PM]
No. Scenario Optimization Suggestion
1 RNC-level SPU CPU load is significantlyhigh.
Add SPU boards.
2 The CPU load of an SPU subsystem issignificantly lower than the RNC-level SPUCPU load.
Adjust the load sharing threshold.
3 The CPU load of an SPU subsystem issignificantly higher than the RNC-level SPUCPU load.
Re-home NodeBs.Enable the SSN resource pool feature.Reconfigure the SCTP or SAAL link.
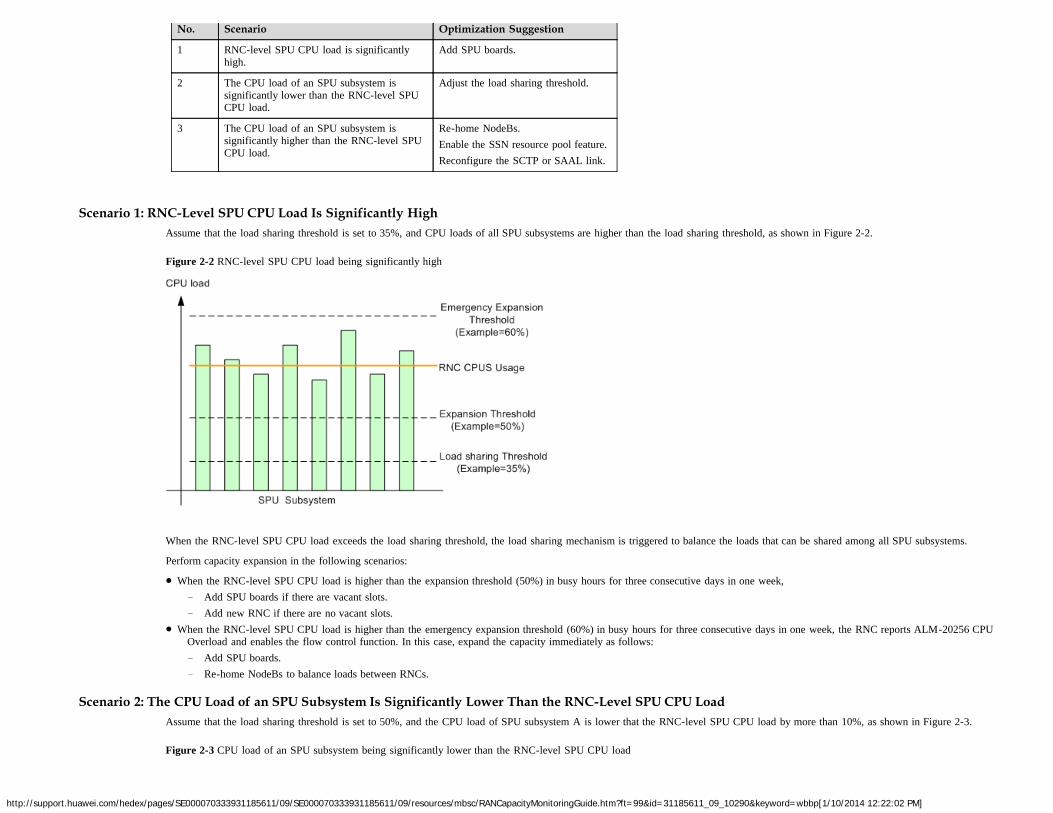
Scenario 1: RNC-Level SPU CPU Load Is Significantly HighAssume that the load sharing threshold is set to 35%, and CPU loads of all SPU subsystems are higher than the load sharing threshold, as shown in Figure 2-2.
Figure 2-2 RNC-level SPU CPU load being significantly high
When the RNC-level SPU CPU load exceeds the load sharing threshold, the load sharing mechanism is triggered to balance the loads that can be shared among all SPU subsystems.
Perform capacity expansion in the following scenarios:
When the RNC-level SPU CPU load is higher than the expansion threshold (50%) in busy hours for three consecutive days in one week,− Add SPU boards if there are vacant slots.− Add new RNC if there are no vacant slots.
When the RNC-level SPU CPU load is higher than the emergency expansion threshold (60%) in busy hours for three consecutive days in one week, the RNC reports ALM-20256 CPUOverload and enables the flow control function. In this case, expand the capacity immediately as follows:− Add SPU boards.− Re-home NodeBs to balance loads between RNCs.
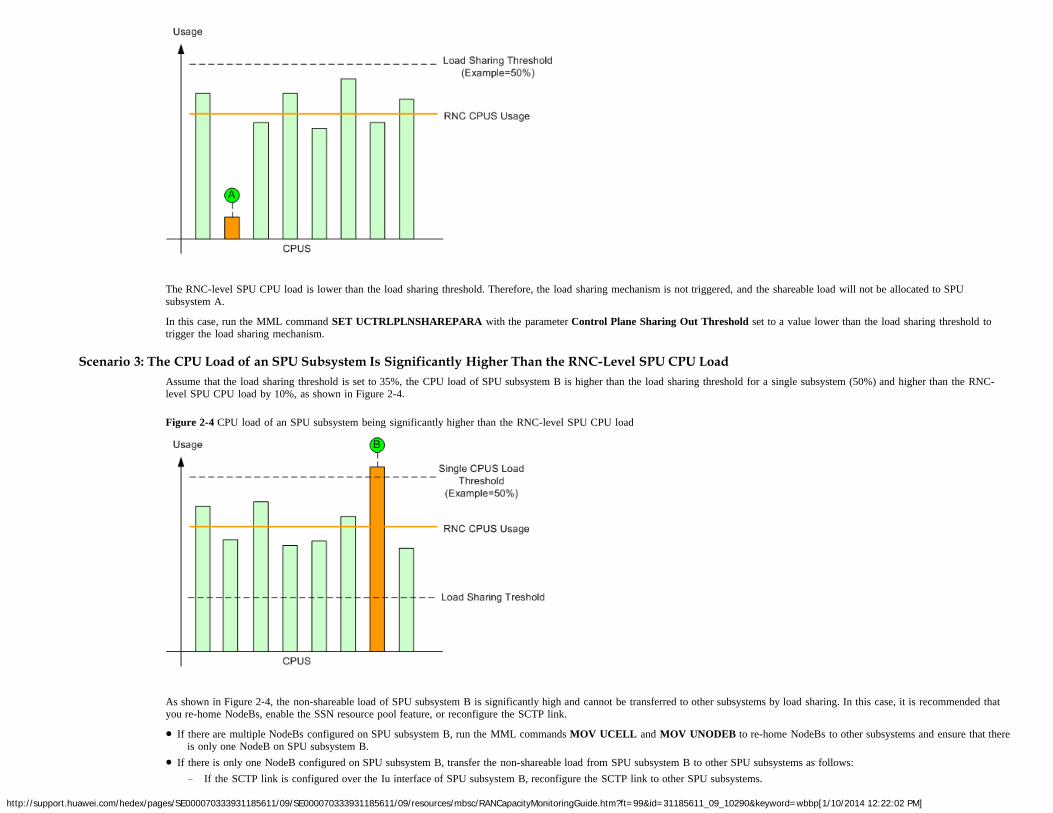
Scenario 2: The CPU Load of an SPU Subsystem Is Significantly Lower Than the RNC-Level SPU CPU LoadAssume that the load sharing threshold is set to 50%, and the CPU load of SPU subsystem A is lower that the RNC-level SPU CPU load by more than 10%, as shown in Figure 2-3.
Figure 2-3 CPU load of an SPU subsystem being significantly lower than the RNC-level SPU CPU load
http://support.huawei.com/hedex/pages/SE000070333931185611/09/SE000070333931185611/09/resources/mbsc/RANCapacityMonitoringGuide.htm?ft=99&id=31185611_09_10290&keyword=wbbp[1/10/2014 12:22:02 PM]
The RNC-level SPU CPU load is lower than the load sharing threshold. Therefore, the load sharing mechanism is not triggered, and the shareable load will not be allocated to SPUsubsystem A.
In this case, run the MML command SET UCTRLPLNSHAREPARA with the parameter Control Plane Sharing Out Threshold set to a value lower than the load sharing threshold totrigger the load sharing mechanism.
Scenario 3: The CPU Load of an SPU Subsystem Is Significantly Higher Than the RNC-Level SPU CPU LoadAssume that the load sharing threshold is set to 35%, the CPU load of SPU subsystem B is higher than the load sharing threshold for a single subsystem (50%) and higher than the RNC-level SPU CPU load by 10%, as shown in Figure 2-4.
Figure 2-4 CPU load of an SPU subsystem being significantly higher than the RNC-level SPU CPU load
As shown in Figure 2-4, the non-shareable load of SPU subsystem B is significantly high and cannot be transferred to other subsystems by load sharing. In this case, it is recommended thatyou re-home NodeBs, enable the SSN resource pool feature, or reconfigure the SCTP link.
If there are multiple NodeBs configured on SPU subsystem B, run the MML commands MOV UCELL and MOV UNODEB to re-home NodeBs to other subsystems and ensure that thereis only one NodeB on SPU subsystem B.
If there is only one NodeB configured on SPU subsystem B, transfer the non-shareable load from SPU subsystem B to other SPU subsystems as follows:− If the SCTP link is configured over the Iu interface of SPU subsystem B, reconfigure the SCTP link to other SPU subsystems.
http://support.huawei.com/hedex/pages/SE000070333931185611/09/SE000070333931185611/09/resources/mbsc/RANCapacityMonitoringGuide.htm?ft=99&id=31185611_09_10290&keyword=wbbp[1/10/2014 12:22:02 PM]
− If the SCTP link is not configured over the Iu interface of SPU subsystem B, enable the SSN resource pool feature.
For details about the SCTP link, see section "Reconfiguring NodeB Management Distribution" in RAN Reconfiguration Guide in BSC6900 UMTS Product Documentation.For details about the SSN resource pool feature, see Flow Control Feature Parameter Description in the RAN feature documentation.Huawei provides professional services for planning and implementing NodeB and cell reallocation.
2.3 MPU CPU Load2.3.1 Monitoring Principles
The MPU corresponds to subsystem 0 on the main control SPU board. The MPU manages the user-plane resources, control-plane resources, and transmission resources in the RNC. Thenumber of MPUs on an SPU board can be configured based on service requirements. The MPU allocates resources such as SPU, DPU, and interface board for each call. Over 60% of theMPU load is used for transmission resource management.
The MPU resource pool function is used to manage transmission resources and enabled by default. After this function is enabled, all the MPU subsystems work in a resource pool, and theRNC allocates transmission resources based on MPU CPU loads to balance the MPU CPU loads in the RNC.
In effective mode, run the MML command DSP BRD to query the logical function type of an SPUa or SPUb. If Logic function type is set to RUCP, subsystem 0 on this SPU is theMPU subsystem.
In ineffective mode, find the MML command ADD BRD in the RNC configuration file. If the value of Logic function type is RUCP, subsystem 0 on this SPU is the MPU subsystem.
2.3.2 Monitoring MethodsThe RNC counter VS.XPU.CPULOAD.MEAN measures the CPU usage of a single MPU subsystem, which indicates each MPU CPU load.
To query the real-time CPU usage of an MPU subsystem, run the MML command DSP CPUUSAGE.
You are advised to monitor the RNC-level MPU CPU load, which is the average CPU load of all MPU subsystems in an RNC. The formulas used to calculate the RNC-level MPU CPUload are as follows:
If the RNC is configured with only SPUa or SPUb boards, use the following formula:
MPU CPU load = Average of all MPU CPU loads (VS.XPU.CPULOAD.MEAN)
If the RNC is configured with both SPUa and SPUb boards, use the following formula:
MPU CPU load = Sum (1.7 x ∑VS.XPU.CPULOAD.MEAN of SPUa + ∑VS.XPU.CPULOAD.MEAN of SPUb)/(1.7 x N + M)
N and M indicate the number of MPU subsystems in SPUa boards and SPUb boards, respectively.The processing capacity of an MPU subsystem in an SPUa board is 1.7 times that in an SPUb board.
When the RNC detects that the CPU load of an MPU subsystem exceeds its overload threshold, ALM-20256 CPU Overload is reported. You can query the overload threshold by running theLST CPUTHD command.
2.3.3 Optimization SuggestionsTo adjust the load sharing threshold and its offset, run the MML command SET TNLOADBALANCEPARA with the parameters MPU Load Sharing Threshold set to 40 and MPU LoadDifference Threshold set to 10, respectively.
After the load sharing threshold is adjusted, perform capacity expansion in the following scenarios:
The RNC-level MPU CPU load is higher than the expansion threshold (50%) in busy hours for three consecutive days in one week.The RNC-level MPU CPU load is higher than the emergency expansion threshold (60%) in busy hours for three consecutive days in one week. In addition, the RNC reports ALM-20256
CPU Overload and triggers flow control. In this case, expand the capacity immediately.
Expand the capacity as follows:
If there are vacant slots, add SPU boards.
http://support.huawei.com/hedex/pages/SE000070333931185611/09/SE000070333931185611/09/resources/mbsc/RANCapacityMonitoringGuide.htm?ft=99&id=31185611_09_10290&keyword=wbbp[1/10/2014 12:22:02 PM]
If there are no vacant slots, do as follows to configure more MPU subsystems:− Change the logical type from non-main control SPU boards to main control SPU boards when the CPU loads of non-main control SPU boards are lower than or equal to 40%.− Add new RNC when the CPU loads of non-main control SPU boards are higher than 40%.
2.4 DPU DSP Load2.4.1 Monitoring Principles
The digital signal processing (DSP) subsystems are logical subsystems on the DPUb or DPUe. A DPUb board contains 22 logical subsystems and a DPUe board contains 28 logicalsubsystems.
The DPU board processes and distributes the UMTS user-plane service data and performs the following functions:
Multiplexing and demultiplexing
Processing frame protocols
Selecting and distributing data
Performing the functions of the GTP-U, Iu UP, PDCP, RLC, MAC, and FP protocols
Performing encryption, decryption, and paging
Processing inter-communication protocols between the SPUa and DPU boards
Processing the Multimedia Broadcast and Multicast Service (MBMS) at the RLC and MAC layers
The MPU subsystem manages DSP subsystems. All DSP subsystems under one MPU subsystem work in a resource pool where loads are balanced between DSP subsystems. If one DSPsubsystem in the resource pool is overloaded, new calls will be transferred to other lightly-loaded subsystems. You are advised to monitor the resource-pool DSP load and RNC DSP load.
For details about resource sharing on the user plane, see System Reliability Feature Parameter Description in the RAN feature documentation.To query the MPU managing a specific DPU, find the MML command ADD BRD in the RNC configuration file. If the value of BRDCLASS is DPU, the values for MPUSUBRACK
and MPUSLOT are the subrack number and slot number of the MPU. For example, if the ADD BRD command in the RNC configuration file is as follows:ADD BRD:SRN=0, SN=8, BRDCLASS=DPU, BRDTYPE=DPUb, LGCAPPTYPE=UUP, MPUSUBRACK=0, MPUSLOT=2;Then, the MPU in slot 2 of subrack 0 manages the DPU in slot 8 of subrack 0.
2.4.2 Monitoring MethodsThe RNC counter VS.DSP.UsageAvg measures the usage of a single DSP subsystem, which indicates the load of each DSP.
Resource-Pool-Level MonitoringThe resource-pool-level monitoring covers all the DSP subsystems managed by one MPU subsystem.
Load of DSP subsystems in one resource pool can be calculated by the average load of all DSP subsystems in one resource pool during busy hours. The formulas are as follows:
If the RNC is configured with only DPUb or DPUe boards, the following formula is true:
Resource-pool-level DSP load = Average of all DSP loads (VS.DSP.UsageAvg)
If the RNC is configured with both DPUb and DPUe boards, the following formula is true:
Resource-pool-level DSP load = Sum (0.5 x ∑VS.DSP.UsageAvg of DPUb + ∑VS.DSP.UsageAvg of DPUe)/(0.5 x N + M)
N and M indicate the number of DSP subsystems in DPUb boards and DPUe boards, respectively.The processing capacity of a DSP subsystem in a DPUb board is 0.5 times that in a DPUe board.
RNC-Level MonitoringThe RNC-level monitoring covers all the DSP subsystems in an RNC.
http://support.huawei.com/hedex/pages/SE000070333931185611/09/SE000070333931185611/09/resources/mbsc/RANCapacityMonitoringGuide.htm?ft=99&id=31185611_09_10290&keyword=wbbp[1/10/2014 12:22:02 PM]
The DSP load in an RNC can be calculated by the average load of all DSP subsystems in an RNC during busy hours. The formulas are as follows:
If the RNC is configured with only DPUb or DPUe boards, use the following formula:
RNC-level DSP load = Average of all DSP loads (VS.DSP.UsageAvg)
If the RNC is configured with both DPUb and DPUe boards, use the following formula:
RNC-level DSP load = Sum (0.5 x ∑VS.DSP.UsageAvg of DPUb + ∑VS.DSP.UsageAvg of DPUe)/(0.5 x N + M)
N and M indicate the number of DSP subsystems in DPUb boards and DPUe boards, respectively.The processing capacity of a DSP subsystem in a DPUb board is 0.5 times that in a DPUe board.
When the RNC detects that the load of a DSP subsystem exceeds its overload threshold, ALM-20256 CPU Overload is reported. You can query the overload threshold by running the LSTCPUTHD command.
When the RNC detects that the average load of all DSP subsystems managed by one MPU subsystem exceeds its overload threshold, or the average guaranteed bit rate (GBR) usage of all DSPsubsystems managed by one MPU subsystem exceeds its overload threshold, ALM-22305 Resource overload on the user plane is reported. You can run the LST UALMTHD command toquery the overload thresholds.
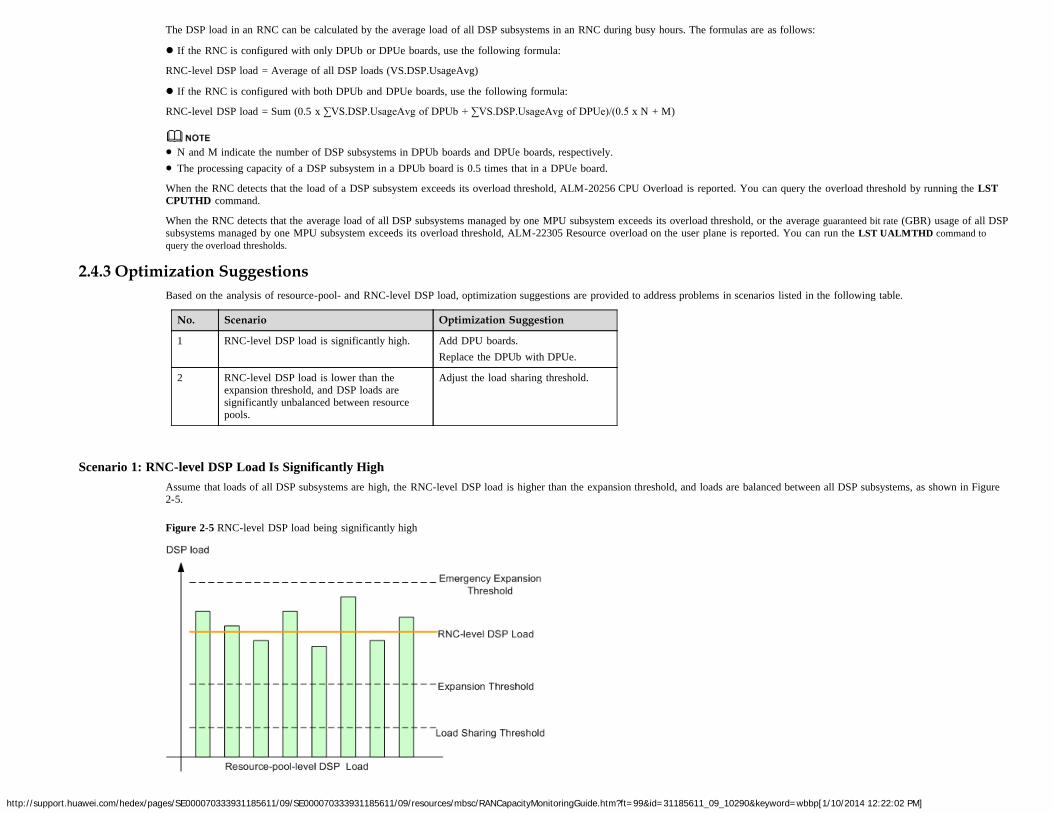
2.4.3 Optimization SuggestionsBased on the analysis of resource-pool- and RNC-level DSP load, optimization suggestions are provided to address problems in scenarios listed in the following table.
No. Scenario Optimization Suggestion
1 RNC-level DSP load is significantly high. Add DPU boards.Replace the DPUb with DPUe.
2 RNC-level DSP load is lower than theexpansion threshold, and DSP loads aresignificantly unbalanced between resourcepools.
Adjust the load sharing threshold.
Scenario 1: RNC-level DSP Load Is Significantly HighAssume that loads of all DSP subsystems are high, the RNC-level DSP load is higher than the expansion threshold, and loads are balanced between all DSP subsystems, as shown in Figure2-5.
Figure 2-5 RNC-level DSP load being significantly high
http://support.huawei.com/hedex/pages/SE000070333931185611/09/SE000070333931185611/09/resources/mbsc/RANCapacityMonitoringGuide.htm?ft=99&id=31185611_09_10290&keyword=wbbp[1/10/2014 12:22:02 PM]
Perform capacity expansion in the following scenarios:
When the RNC-level DSP load is higher than the expansion threshold (60%) in busy hours for three consecutive days in one week, expand the DPU capacity.When the RNC-level DSP load is higher than the emergency expansion threshold (70%) in busy hours for three consecutive days in one week, the RNC reports ALM-20256 CPU
Overload and triggers flow control. In this case, expand the capacity immediately.
Expand the capacity as follows:
Add DPUs if there are vacant slots.Replace the DPUb boards with DPUe boards if there are no vacant slots and the RNC is configured with DPUb boards.Add new RNC to increase the DPU boards.
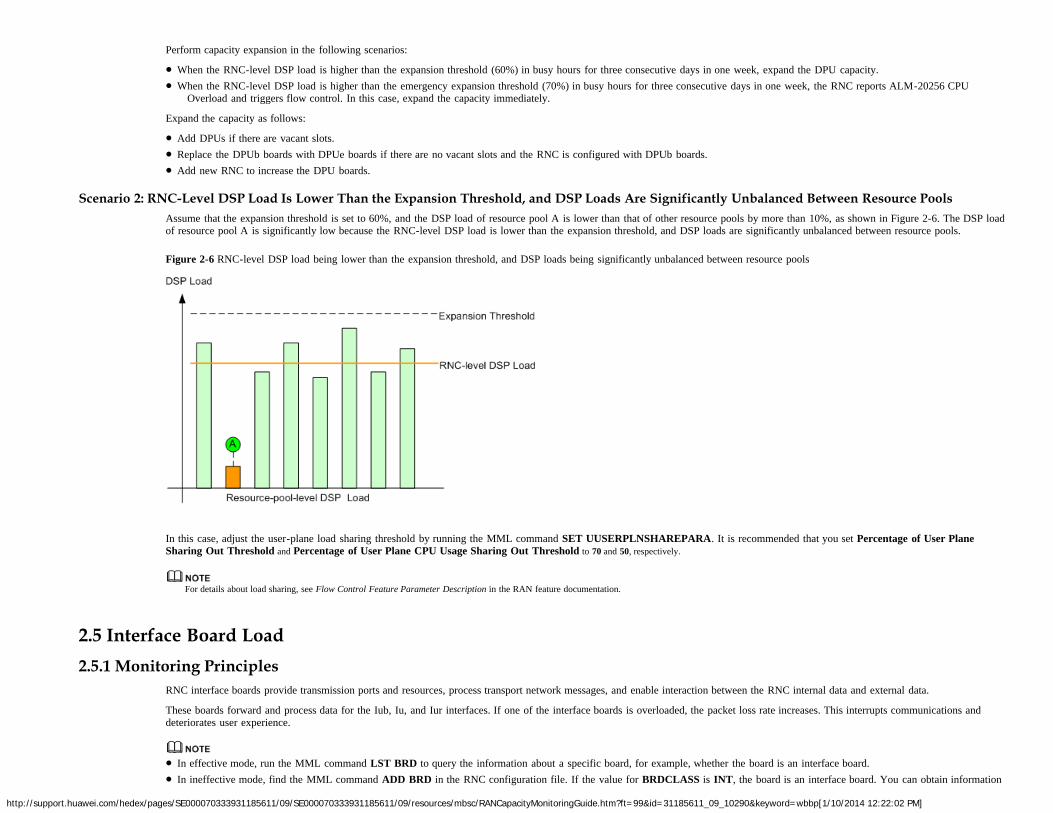
Scenario 2: RNC-Level DSP Load Is Lower Than the Expansion Threshold, and DSP Loads Are Significantly Unbalanced Between Resource PoolsAssume that the expansion threshold is set to 60%, and the DSP load of resource pool A is lower than that of other resource pools by more than 10%, as shown in Figure 2-6. The DSP loadof resource pool A is significantly low because the RNC-level DSP load is lower than the expansion threshold, and DSP loads are significantly unbalanced between resource pools.
Figure 2-6 RNC-level DSP load being lower than the expansion threshold, and DSP loads being significantly unbalanced between resource pools
In this case, adjust the user-plane load sharing threshold by running the MML command SET UUSERPLNSHAREPARA. It is recommended that you set Percentage of User PlaneSharing Out Threshold and Percentage of User Plane CPU Usage Sharing Out Threshold to 70 and 50, respectively.
For details about load sharing, see Flow Control Feature Parameter Description in the RAN feature documentation.
2.5 Interface Board Load2.5.1 Monitoring Principles
RNC interface boards provide transmission ports and resources, process transport network messages, and enable interaction between the RNC internal data and external data.
These boards forward and process data for the Iub, Iu, and Iur interfaces. If one of the interface boards is overloaded, the packet loss rate increases. This interrupts communications anddeteriorates user experience.
In effective mode, run the MML command LST BRD to query the information about a specific board, for example, whether the board is an interface board.In ineffective mode, find the MML command ADD BRD in the RNC configuration file. If the value for BRDCLASS is INT, the board is an interface board. You can obtain information
http://support.huawei.com/hedex/pages/SE000070333931185611/09/SE000070333931185611/09/resources/mbsc/RANCapacityMonitoringGuide.htm?ft=99&id=31185611_09_10290&keyword=wbbp[1/10/2014 12:22:02 PM]
about this interface board in this command.
2.5.2 Monitoring MethodsTo obtain the interface board load, monitor the control-plane CPU load and user-plane forwarding load. The counters used to monitor the interface board load are as follows:
VS.INT.CPULOAD.MEAN: average CPU loadVS.INT.TRANSLOAD.RATIO.MEAN: average forwarding load on interface boards
The forwarding load is expressed by the ratio of actual forwarding data rate to maximum forwarding data rate configured for the interface board. The forwarding load indicates the operatingload and performance of the interface board.
When the RNC detects that the CPU load of an interface board exceeds its threshold, ALM-20256 CPU Overload is reported.
2.5.3 Optimization SuggestionsPerform capacity expansion in the following scenarios:
When the average CPU load of interface boards reaches 50%, prepare for capacity expansion. When the average CPU load of interface boards reaches 60%, expand the capacityimmediately.
When the average forwarding load of interface boards reaches 70%, prepare for capacity expansion. When the average forwarding load of interface boards reaches 80%, expand thecapacity immediately.
Expand the capacity as follows:
In non-transmission resource pool networking scenarios, separately assess the capacity of each interface board. For loads between interface boards of the same type, adjust the number oflinks carried on each interface board to balance loads between them. If loads cannot be balanced after the adjustment, add interface boards of the same type.
In transmission resource pool networking scenarios, when the load of an interface board exceeds the load threshold in the resource pool, add interface boards of the same type immediately.
For details about the Transmission Resource Pool in the RNC feature, see Transmission Resource Pool in RNC Feature Parameter Description in the RAN feature documentation.
2.6 SCU Board Load2.6.1 Monitoring Principles
Two SCU boards (SCUa or SCUb) are installed in slots 6 and 7 of each subrack. Two SCU boards in the same subrack work in active/standby mode.
SCUa and SCUb boards cannot be installed in the same subrack.
In effective mode, run the MML command LST SUBRACK to query the current subrack configuration. In the command output, the values of SLOT6 and SLOT7 indicate the SCU boardtype in the subrack.
In ineffective mode, find the MML command ADD SUBRACK in the RNC configuration file. The value of SCUTYPE indicates the SCU board type. For example, if the ADDSUBRACK command in the RNC configuration file is as follows:
ADD SUBRACK: SRN=2, SRName="test2", CONNPWR=NO, SCUTYPE=SCUa;Then, the SCU board is of the SCUa type.
Ports on an SCU board form a trunk group to connect the MPS and EPS. Restricted by their switching capacities, SCU boards are likely to be congested when configurations are unbalancedbetween subracks and the inter-subrack traffic is heavy. When the data traffic of inter-subrack communication approaches the overload threshold, voice service quality, data service quality,and network KPIs deteriorate, causing the system to become unstable. Therefore, the SCU CPU load and inter-subrack bandwidth need to be monitored for SCU boards.
2.6.2 Monitoring Methods
Monitoring of SCU CPU LoadThe counter used to monitor the SCU CPU load is as follows:
VS.SCU.CPULOAD.MEAN: average SCU CPU load
When the RNC detects that the CPU load of an SCU board exceeds its overload threshold, ALM-20256 CPU Overload will be reported. The overload threshold can be queried by running
http://support.huawei.com/hedex/pages/SE000070333931185611/09/SE000070333931185611/09/resources/mbsc/RANCapacityMonitoringGuide.htm?ft=99&id=31185611_09_10290&keyword=wbbp[1/10/2014 12:22:02 PM]
the LST CPUTHD command.
Monitoring of Inter-Subrack BandwidthThe counters used to monitor the inter-subrack bandwidth are as follows:
VS.Frame.Flux.Mean.TxRate: average inter-subrack transmitting trafficFrame Mean Utility Ratio: average utility rate of inter-subrack traffic
The Frame Mean Utility Ratio is calculated using the following formula:Frame Mean Utility Ratio = VS.Frame.Flux.Mean.TxRate/inter-subrack bandwidth x 100%
When a pair of active and standby SCUa boards are configured, the inter-subrack bandwidth will be 4 Gbit/s. When a pair of active and standby SCUb boards are configured, the inter-subrack bandwidth will be 40 Gbit/s. If either the active or standby SCUa/SCUb board becomes faulty, the inter-subrack bandwidth will be reduced by half.
2.6.3 Optimization SuggestionsWhen the SCU CPU load reaches 60%, you are advised to contact Huawei engineers to handle the problem.When the value of the Frame Mean Utility Ratio exceeds 40%, you are advised to contact Huawei engineers to handle the problem.
2.7 Downlink Load2.7.1 Monitoring Principles
The downlink capacity of a cell is limited by its total available transmit power, which is determined by the NodeB power amplifier capability and the power configured for the cell.
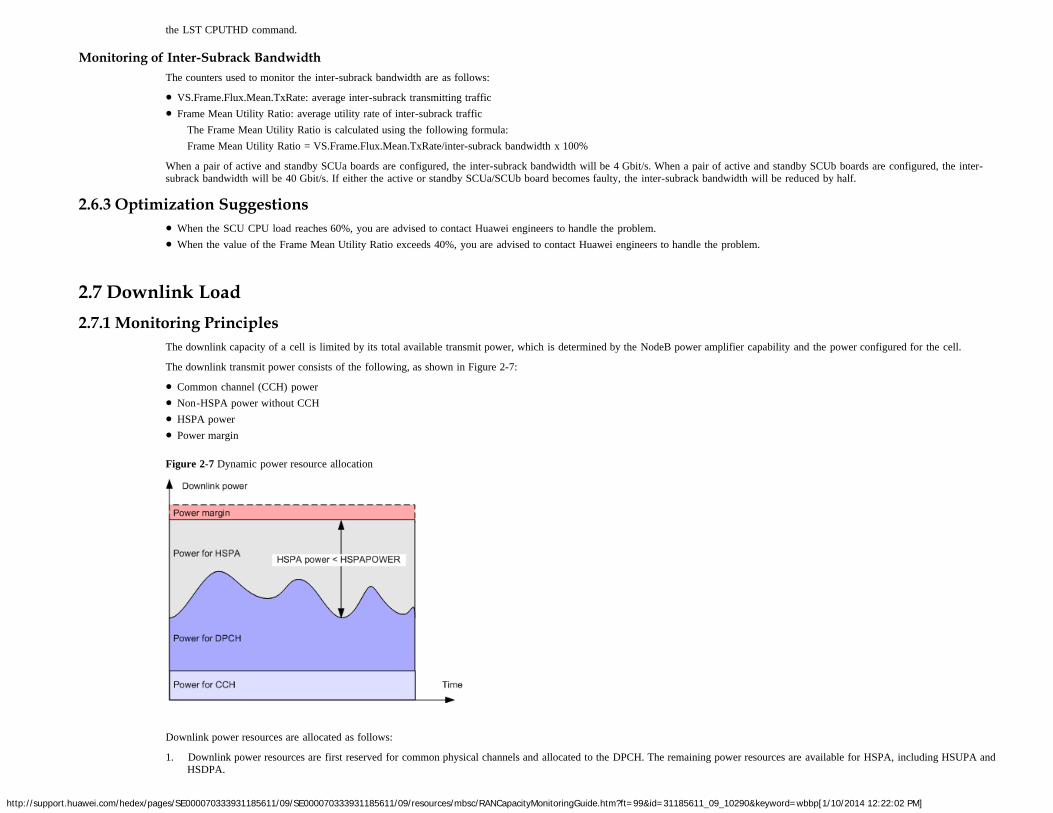
The downlink transmit power consists of the following, as shown in Figure 2-7:
Common channel (CCH) powerNon-HSPA power without CCHHSPA powerPower margin
Figure 2-7 Dynamic power resource allocation
Downlink power resources are allocated as follows:
1. Downlink power resources are first reserved for common physical channels and allocated to the DPCH. The remaining power resources are available for HSPA, including HSUPA andHSDPA.
http://support.huawei.com/hedex/pages/SE000070333931185611/09/SE000070333931185611/09/resources/mbsc/RANCapacityMonitoringGuide.htm?ft=99&id=31185611_09_10290&keyword=wbbp[1/10/2014 12:22:02 PM]
2. The HSPA power resources are first allocated to the HSUPA downlink control channels, including the E-AGCH, E-RGCH, and E-HICH. The remaining power resources are availablefor HSDPA.
3. The HSDPA power resources are first allocated to the downlink control channel HS-SCCH. The remaining power resources are available for the traffic channel HS-PDSCH.
Downlink power consumption is related to cell coverage, UE locations, and the traffic load in the cell. Large cell coverage, UEs being far away from the cell center, and heavy traffic loadall contribute to large downlink power consumption. Therefore, downlink power overload is more likely to occur in hotspots or in cells with large coverage.
When the downlink transmit power is insufficient, the following occurs:
The cell coverage shrinks.The data throughput decreases.The service quality declines.New service requests are likely to be rejected.
2.7.2 Monitoring MethodsThe following TCP-associated counters are defined for Huawei RNCs:
VS.MeanTCP: mean transmitted power of carrier for cellVS.MeanTCP.NonHS: mean Non-HSDPA transmitted carrier power for cellVS.HSDPA.MeanChThroughput: mean downlink throughput of single HSDPA MAC-d flows for cell
The downlink cell load is indicated by the mean utility ratio of transmitted carrier power in a cell.
The mean utility ratio of the transmitted carrier power for non-HSPA users in a cell (including non-HSPA users on CCHs) is calculated using the following formula:
MeanNonHSTCP Utility Ratio = MeanNonHSTCP/MAXTXPOWER x 100%
The mean utility ratio of the transmitted carrier power for all users in a cell is calculated using the following formula:
MeanTCP Utility Ratio = MeanTCP/MAXTXPOWER x 100%
To obtain MAXTXPOWER, run the LST UCELL command, query the value of the Max Transmit Power of Cell parameter, and convert the parameter value from the unit "0.1 dBm" to"watt."
2.7.3 Optimization SuggestionsPerform capacity expansion in the following scenarios:
The MeanNonHSTCP Utility Ratio is greater than 70% during peak hours for three consecutive days in one week.The MeanTCP Utility Ratio is greater than 85% and the value of the VS.HSDPA.MeanChThroughput counter is lower than the value (for example, 300 kbit/s) required by subscribers
during peak hours for three consecutive days in one week.The capacity expansion methods are as follows:
For cells with heavy traffic, add a carrier for the current sector if possible; add a NodeB or split the sector if the number of carriers in the sector reaches the maximum.For cells with light traffic and poor coverage, add a NodeB.
2.8 Uplink Load2.8.1 Monitoring Principles
Use the RTWP to measure the uplink cell capability on WCDMA networks.
RTWP includes the background noise, intra-system interference, and RF interference. Intra-system interference includes the uplink signals sent by the UEs in the serving and neighboringcells. RF interference includes the RF interference from an external source (for example, the RF interference from another RAT or from equipment other than communication equipment) andintra-system RF interference (for example, intermodulation interference produced by hardware components).
http://support.huawei.com/hedex/pages/SE000070333931185611/09/SE000070333931185611/09/resources/mbsc/RANCapacityMonitoringGuide.htm?ft=99&id=31185611_09_10290&keyword=wbbp[1/10/2014 12:22:02 PM]
The NodeB measures the RTWP on each receive channel in each cell. The cell RTWP obtained by the RNC is the linear average of the RTWPs measured on all receive channels in a cellunder the NodeB. The RTWP reflects the interference to a NodeB and indicates the signal strength on the RX port on the RF module.
The uplink cell capacity is restricted by the rise over thermal (RoT), which equals the RTWP minus the cell background noise. The formula is as follows:
If there is no RF interference, the RoT is generated by intra-system interference. Under this condition, the RoT is used as a criterion to evaluate the uplink load.
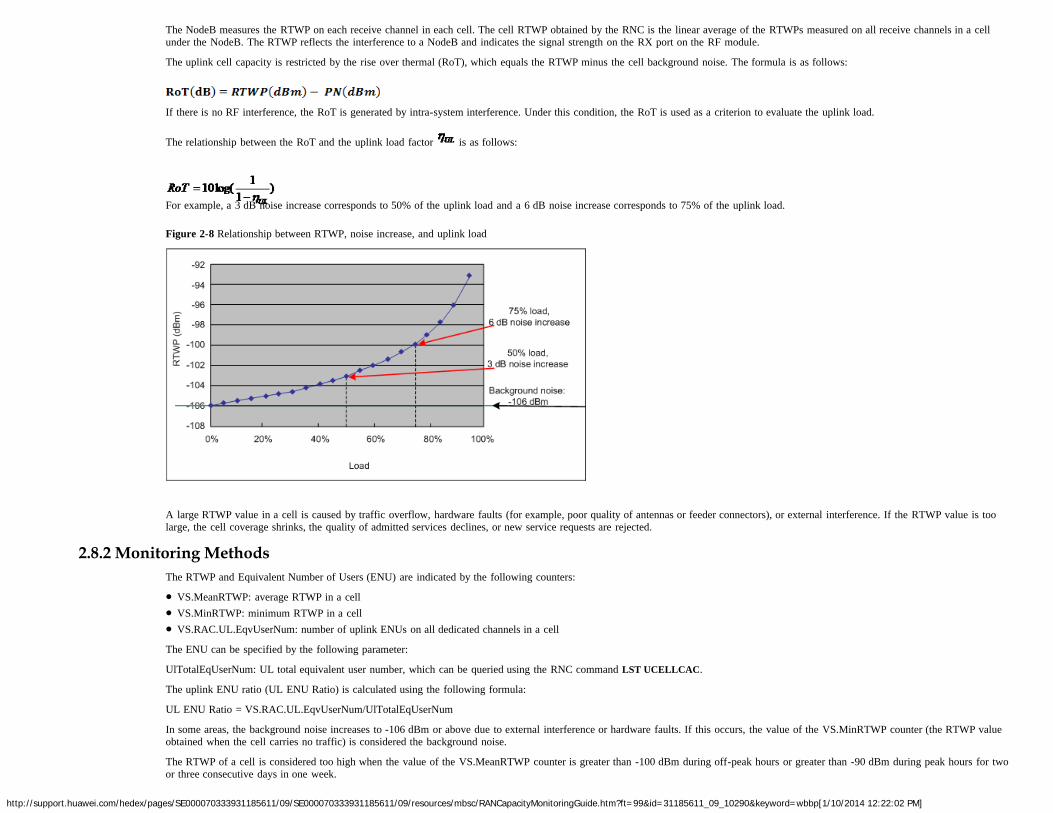
The relationship between the RoT and the uplink load factor is as follows:
For example, a 3 dB noise increase corresponds to 50% of the uplink load and a 6 dB noise increase corresponds to 75% of the uplink load.
Figure 2-8 Relationship between RTWP, noise increase, and uplink load
A large RTWP value in a cell is caused by traffic overflow, hardware faults (for example, poor quality of antennas or feeder connectors), or external interference. If the RTWP value is toolarge, the cell coverage shrinks, the quality of admitted services declines, or new service requests are rejected.
2.8.2 Monitoring MethodsThe RTWP and Equivalent Number of Users (ENU) are indicated by the following counters:
VS.MeanRTWP: average RTWP in a cellVS.MinRTWP: minimum RTWP in a cellVS.RAC.UL.EqvUserNum: number of uplink ENUs on all dedicated channels in a cell
The ENU can be specified by the following parameter:
UlTotalEqUserNum: UL total equivalent user number, which can be queried using the RNC command LST UCELLCAC.
The uplink ENU ratio (UL ENU Ratio) is calculated using the following formula:
UL ENU Ratio = VS.RAC.UL.EqvUserNum/UlTotalEqUserNum
In some areas, the background noise increases to -106 dBm or above due to external interference or hardware faults. If this occurs, the value of the VS.MinRTWP counter (the RTWP valueobtained when the cell carries no traffic) is considered the background noise.
The RTWP of a cell is considered too high when the value of the VS.MeanRTWP counter is greater than -100 dBm during off-peak hours or greater than -90 dBm during peak hours for twoor three consecutive days in one week.
http://support.huawei.com/hedex/pages/SE000070333931185611/09/SE000070333931185611/09/resources/mbsc/RANCapacityMonitoringGuide.htm?ft=99&id=31185611_09_10290&keyword=wbbp[1/10/2014 12:22:02 PM]
A cell is considered heavily loaded if the UL ENU Ratio exceeds 75% during peak hours for two or three consecutive days in one week.
2.8.3 Optimization SuggestionsPerform capacity expansion in the following scenarios:
If the value of the VS.MinRTWP counter is greater than -100 dBm or less than -110 dBm during off-peak hours for three consecutive days in one week, hardware faults or externalinterference exists. Locate and rectify the faults.
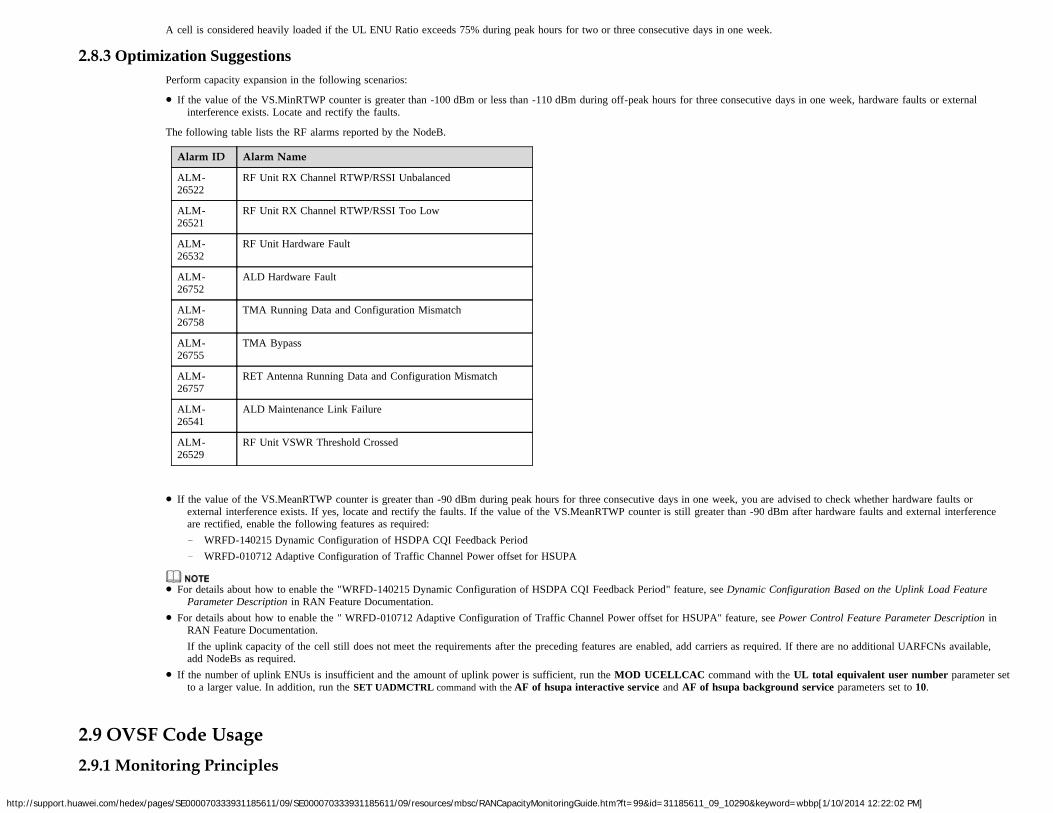
The following table lists the RF alarms reported by the NodeB.
Alarm ID Alarm Name
ALM-26522
RF Unit RX Channel RTWP/RSSI Unbalanced
ALM-26521
RF Unit RX Channel RTWP/RSSI Too Low
ALM-26532
RF Unit Hardware Fault
ALM-26752
ALD Hardware Fault
ALM-26758
TMA Running Data and Configuration Mismatch
ALM-26755
TMA Bypass
ALM-26757
RET Antenna Running Data and Configuration Mismatch
ALM-26541
ALD Maintenance Link Failure
ALM-26529
RF Unit VSWR Threshold Crossed
If the value of the VS.MeanRTWP counter is greater than -90 dBm during peak hours for three consecutive days in one week, you are advised to check whether hardware faults orexternal interference exists. If yes, locate and rectify the faults. If the value of the VS.MeanRTWP counter is still greater than -90 dBm after hardware faults and external interferenceare rectified, enable the following features as required:− WRFD-140215 Dynamic Configuration of HSDPA CQI Feedback Period− WRFD-010712 Adaptive Configuration of Traffic Channel Power offset for HSUPA
For details about how to enable the "WRFD-140215 Dynamic Configuration of HSDPA CQI Feedback Period" feature, see Dynamic Configuration Based on the Uplink Load FeatureParameter Description in RAN Feature Documentation.
For details about how to enable the " WRFD-010712 Adaptive Configuration of Traffic Channel Power offset for HSUPA" feature, see Power Control Feature Parameter Description inRAN Feature Documentation.If the uplink capacity of the cell still does not meet the requirements after the preceding features are enabled, add carriers as required. If there are no additional UARFCNs available,add NodeBs as required.
If the number of uplink ENUs is insufficient and the amount of uplink power is sufficient, run the MOD UCELLCAC command with the UL total equivalent user number parameter setto a larger value. In addition, run the SET UADMCTRL command with the AF of hsupa interactive service and AF of hsupa background service parameters set to 10.
2.9 OVSF Code Usage2.9.1 Monitoring Principles
http://support.huawei.com/hedex/pages/SE000070333931185611/09/SE000070333931185611/09/resources/mbsc/RANCapacityMonitoringGuide.htm?ft=99&id=31185611_09_10290&keyword=wbbp[1/10/2014 12:22:02 PM]
On WCDMA networks, channels are distinguished by code. Each channel uses two types of code: scrambling code and orthogonal variable spreading factor (OVSF) code.
In the uplink, each UE is allocated a unique scrambling code. In the downlink, each cell is allocated a unique scrambling code. That is, all UEs in a cell use the same scrambling code buteach of them is allocated a unique OVSF code. Therefore, OVSF codes distinguish the downlink physical channels of different UEs in a cell.
In a WCDMA cell, different user data is distinguished by CDMA technique, and all user data is transmitted over the same central frequency almost at the same time. OVSF codes provideperfect orthogonality, minimizing interference between different users.
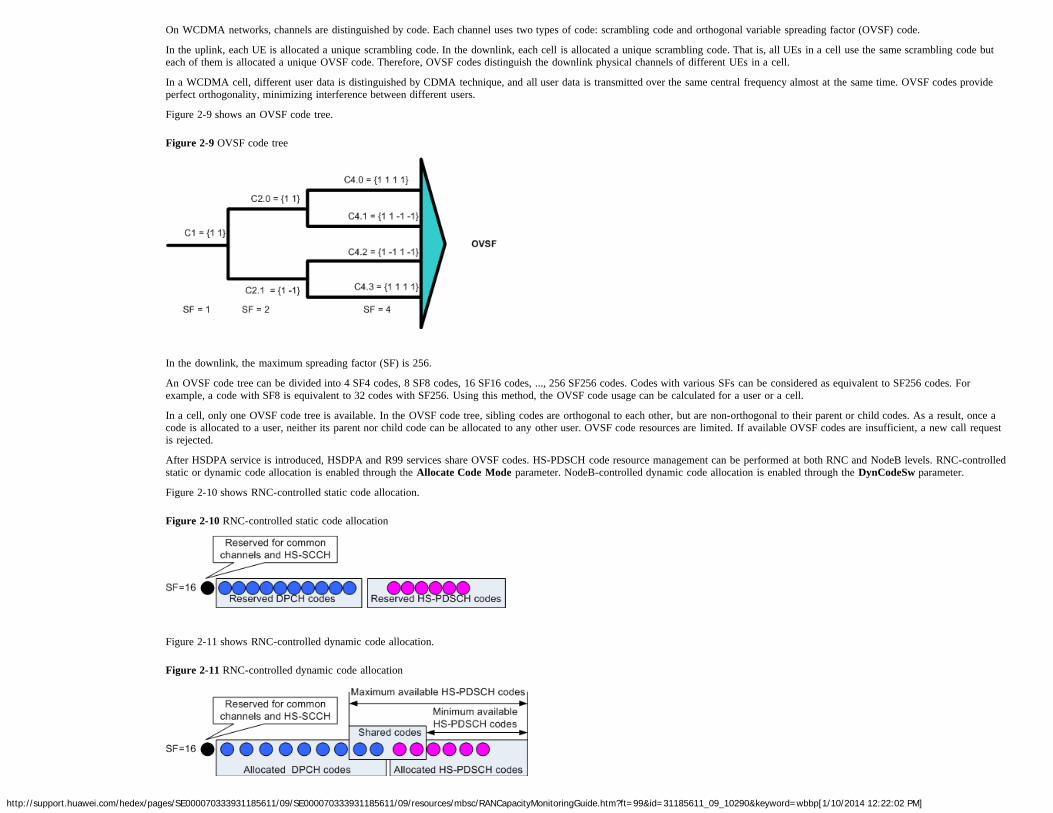
Figure 2-9 shows an OVSF code tree.
Figure 2-9 OVSF code tree
In the downlink, the maximum spreading factor (SF) is 256.
An OVSF code tree can be divided into 4 SF4 codes, 8 SF8 codes, 16 SF16 codes, ..., 256 SF256 codes. Codes with various SFs can be considered as equivalent to SF256 codes. Forexample, a code with SF8 is equivalent to 32 codes with SF256. Using this method, the OVSF code usage can be calculated for a user or a cell.
In a cell, only one OVSF code tree is available. In the OVSF code tree, sibling codes are orthogonal to each other, but are non-orthogonal to their parent or child codes. As a result, once acode is allocated to a user, neither its parent nor child code can be allocated to any other user. OVSF code resources are limited. If available OVSF codes are insufficient, a new call requestis rejected.
After HSDPA service is introduced, HSDPA and R99 services share OVSF codes. HS-PDSCH code resource management can be performed at both RNC and NodeB levels. RNC-controlledstatic or dynamic code allocation is enabled through the Allocate Code Mode parameter. NodeB-controlled dynamic code allocation is enabled through the DynCodeSw parameter.
Figure 2-10 shows RNC-controlled static code allocation.
Figure 2-10 RNC-controlled static code allocation
Figure 2-11 shows RNC-controlled dynamic code allocation.
Figure 2-11 RNC-controlled dynamic code allocation
http://support.huawei.com/hedex/pages/SE000070333931185611/09/SE000070333931185611/09/resources/mbsc/RANCapacityMonitoringGuide.htm?ft=99&id=31185611_09_10290&keyword=wbbp[1/10/2014 12:22:02 PM]
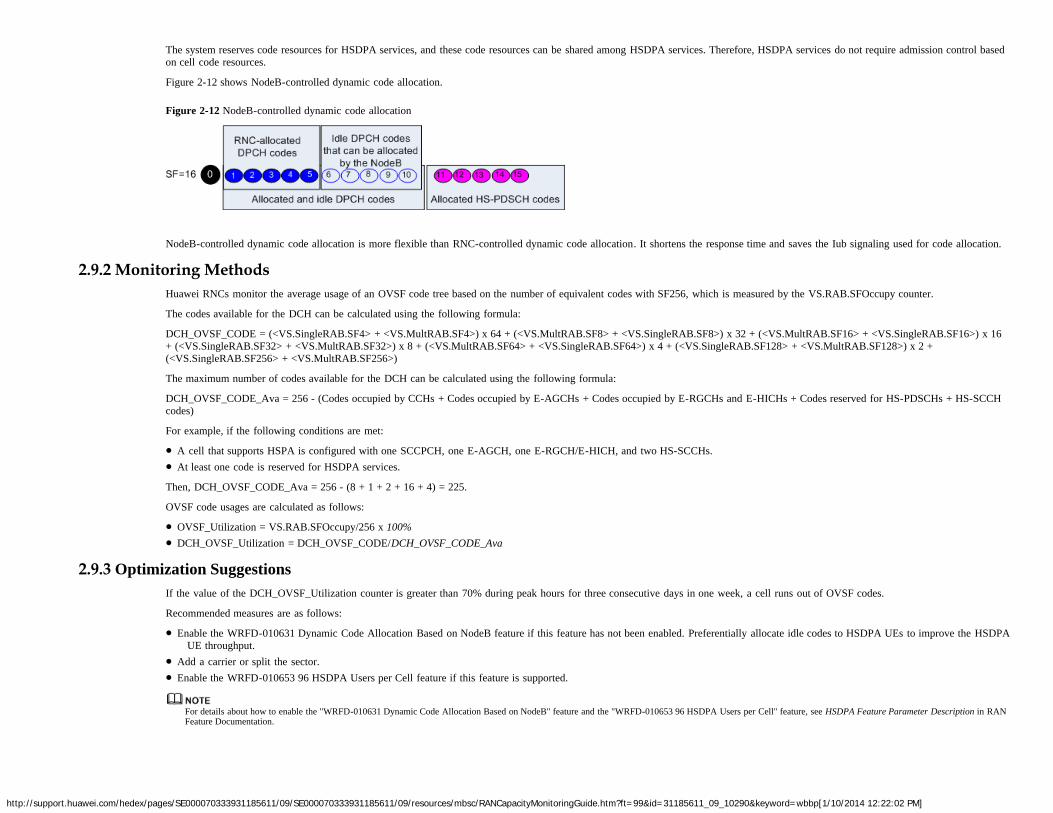
The system reserves code resources for HSDPA services, and these code resources can be shared among HSDPA services. Therefore, HSDPA services do not require admission control basedon cell code resources.
Figure 2-12 shows NodeB-controlled dynamic code allocation.
Figure 2-12 NodeB-controlled dynamic code allocation
NodeB-controlled dynamic code allocation is more flexible than RNC-controlled dynamic code allocation. It shortens the response time and saves the Iub signaling used for code allocation.
2.9.2 Monitoring MethodsHuawei RNCs monitor the average usage of an OVSF code tree based on the number of equivalent codes with SF256, which is measured by the VS.RAB.SFOccupy counter.
The codes available for the DCH can be calculated using the following formula:
DCH_OVSF_CODE = (<VS.SingleRAB.SF4> + <VS.MultRAB.SF4>) x 64 + (<VS.MultRAB.SF8> + <VS.SingleRAB.SF8>) x 32 + (<VS.MultRAB.SF16> + <VS.SingleRAB.SF16>) x 16+ (<VS.SingleRAB.SF32> + <VS.MultRAB.SF32>) x 8 + (<VS.MultRAB.SF64> + <VS.SingleRAB.SF64>) x 4 + (<VS.SingleRAB.SF128> + <VS.MultRAB.SF128>) x 2 +(<VS.SingleRAB.SF256> + <VS.MultRAB.SF256>)
The maximum number of codes available for the DCH can be calculated using the following formula:
DCH_OVSF_CODE_Ava = 256 - (Codes occupied by CCHs + Codes occupied by E-AGCHs + Codes occupied by E-RGCHs and E-HICHs + Codes reserved for HS-PDSCHs + HS-SCCHcodes)
For example, if the following conditions are met:
A cell that supports HSPA is configured with one SCCPCH, one E-AGCH, one E-RGCH/E-HICH, and two HS-SCCHs.At least one code is reserved for HSDPA services.
Then, DCH_OVSF_CODE_Ava = 256 - (8 + 1 + 2 + 16 + 4) = 225.
OVSF code usages are calculated as follows:
OVSF_Utilization = VS.RAB.SFOccupy/256 x 100%DCH_OVSF_Utilization = DCH_OVSF_CODE/DCH_OVSF_CODE_Ava
2.9.3 Optimization SuggestionsIf the value of the DCH_OVSF_Utilization counter is greater than 70% during peak hours for three consecutive days in one week, a cell runs out of OVSF codes.
Recommended measures are as follows:
Enable the WRFD-010631 Dynamic Code Allocation Based on NodeB feature if this feature has not been enabled. Preferentially allocate idle codes to HSDPA UEs to improve the HSDPAUE throughput.
Add a carrier or split the sector.Enable the WRFD-010653 96 HSDPA Users per Cell feature if this feature is supported.
For details about how to enable the "WRFD-010631 Dynamic Code Allocation Based on NodeB" feature and the "WRFD-010653 96 HSDPA Users per Cell" feature, see HSDPA Feature Parameter Description in RANFeature Documentation.
http://support.huawei.com/hedex/pages/SE000070333931185611/09/SE000070333931185611/09/resources/mbsc/RANCapacityMonitoringGuide.htm?ft=99&id=31185611_09_10290&keyword=wbbp[1/10/2014 12:22:02 PM]
2.10 CE Usage2.10.1 Monitoring Principles
CEs are baseband resources provided by NodeBs and measure the baseband capability of NodeBs. The more CEs a NodeB supports, the stronger the service processing capability of theNodeB. If available CE resources are insufficient, the NodeB rejects a new call request.
Uplink CE resources can be shared in an uplink resource group, but not between uplink resource groups. Downlink CE resources are associated with the baseband processing boards where acell is set up. CE resources allocated by licenses are shared among services on the NodeB(CE resources allocated by licenses are shared among services on the operators in MOCNscenarios). The NodeB sends the response message that carries its CE capability to the RNC. The CE capability of the NodeB is limited by both the installed hardware and the configuredsoftware licenses. The usage of CEs for admitted UEs is calculated in different ways depending on whether the CE Overbooking feature is enabled.
If CE Overbooking is disabled:The RNC calculates the usage of CEs for admitted UEs by adding up credit resources reserved for each UE.− R99 UEs: The RNC calculates the usage of credit resources for an R99 UE based on the mobility binding record (MBR).− HSUPA UE: The RNC calculates the usage of credit resources for an HSUPA UE based on MAX(GBR, Rateone RLC PDU).
If CE Overbooking is enabled:The NodeB calculates the usage of credit resources for all admitted UEs at the cell and NodeB levels and periodically reports the measurement result to the RNC.− R99 UE: The NodeB calculates the usage of credit resources for an R99 UE based on the MBR.− HSUPA UE using a 10 ms transmission time interval (TTI): The NodeB adjusts the credit resource usage of such a UE based on the UE's rate. After the adjustment, the credit
resources consumed by such a UE must be less than the credit resources required by MAX(GBR, Rateone RLC PDU).
− HSUPA UE using a 2 ms TTI: The NodeB adjusts the credit resource usage of such a UE based on the UE's rate and the minimum number of CEs reserved for admitting such a UE.After the adjustment, the credit resources consumed by such a UE must be less than the credit resources required by MAX(GBR, Rateone RLC PDU).
The minimum number of CEs reserved for admitting an HSUPA UE using a 2 ms TTI is 4 by default. The value range is 1 to 8.
CCHs do not require extra CE resources because the RNC reserves CE resources for services on these channels. Signaling carried on an associated channel of the dedicated channel (DCH)does not consume extra CE resources. One CE can be consumed by a 12.2 kbit/s voice call.
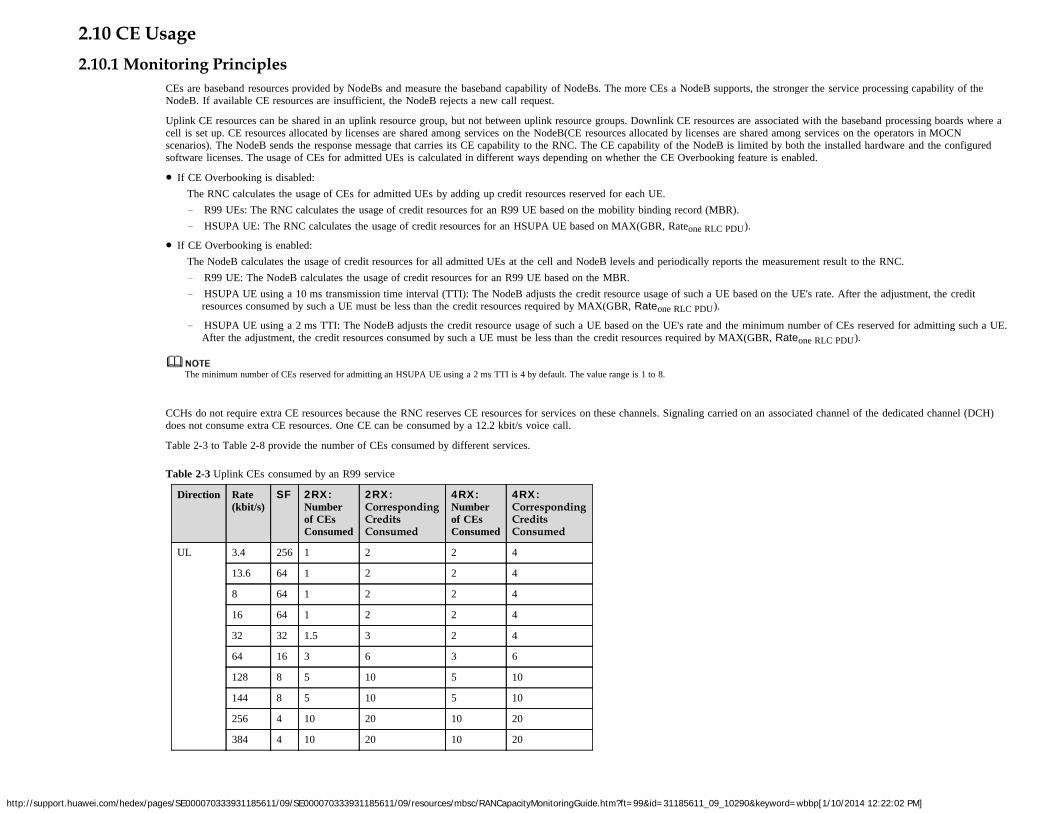
Table 2-3 to Table 2-8 provide the number of CEs consumed by different services.
Table 2-3 Uplink CEs consumed by an R99 service
Direction Rate(kbit/s)
SF 2RX:Numberof CEsConsumed
2RX:CorrespondingCreditsConsumed
4RX:Numberof CEsConsumed
4RX:CorrespondingCreditsConsumed
UL 3.4 256 1 2 2 4
13.6 64 1 2 2 4
8 64 1 2 2 4
16 64 1 2 2 4
32 32 1.5 3 2 4
64 16 3 6 3 6
128 8 5 10 5 10
144 8 5 10 5 10
256 4 10 20 10 20
384 4 10 20 10 20
http://support.huawei.com/hedex/pages/SE000070333931185611/09/SE000070333931185611/09/resources/mbsc/RANCapacityMonitoringGuide.htm?ft=99&id=31185611_09_10290&keyword=wbbp[1/10/2014 12:22:02 PM]
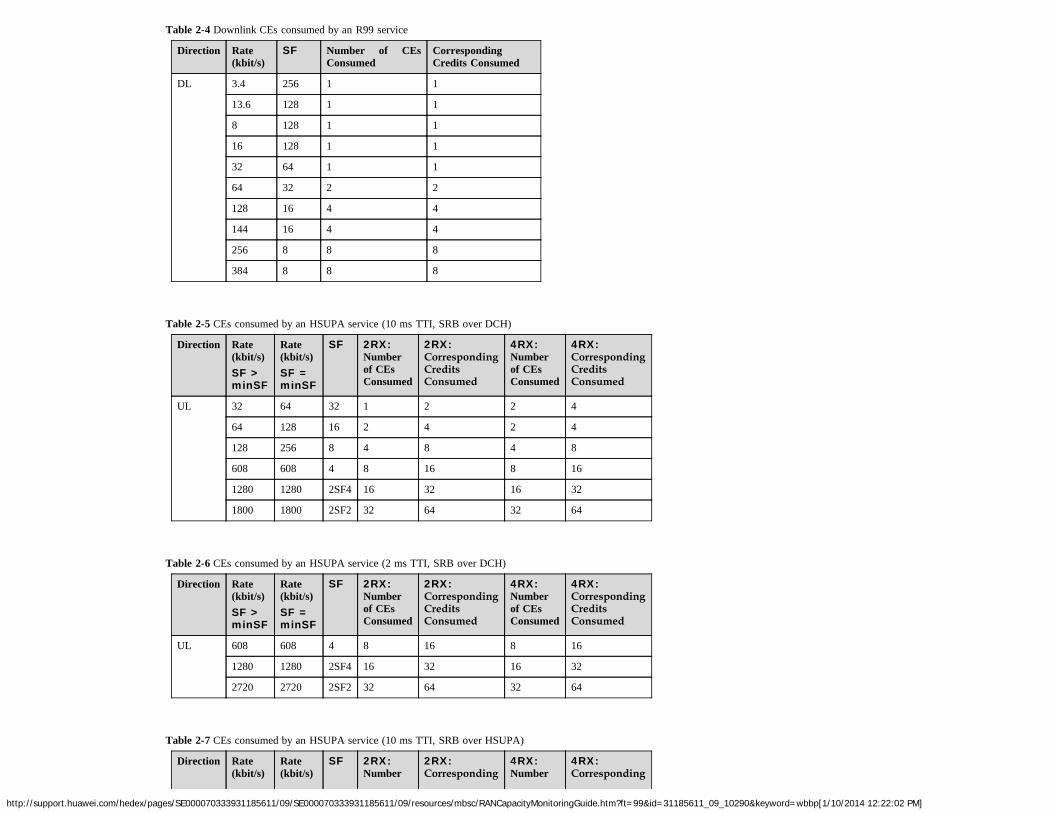
Table 2-4 Downlink CEs consumed by an R99 service
Direction Rate(kbit/s)
SF Number of CEsConsumed
CorrespondingCredits Consumed
DL 3.4 256 1 1
13.6 128 1 1
8 128 1 1
16 128 1 1
32 64 1 1
64 32 2 2
128 16 4 4
144 16 4 4
256 8 8 8
384 8 8 8
Table 2-5 CEs consumed by an HSUPA service (10 ms TTI, SRB over DCH)
Direction Rate(kbit/s)SF >minSF
Rate(kbit/s)SF =minSF
SF 2RX:Numberof CEsConsumed
2RX:CorrespondingCreditsConsumed
4RX:Numberof CEsConsumed
4RX:CorrespondingCreditsConsumed
UL 32 64 32 1 2 2 4
64 128 16 2 4 2 4
128 256 8 4 8 4 8
608 608 4 8 16 8 16
1280 1280 2SF4 16 32 16 32
1800 1800 2SF2 32 64 32 64
Table 2-6 CEs consumed by an HSUPA service (2 ms TTI, SRB over DCH)
Direction Rate(kbit/s)SF >minSF
Rate(kbit/s)SF =minSF
SF 2RX:Numberof CEsConsumed
2RX:CorrespondingCreditsConsumed
4RX:Numberof CEsConsumed
4RX:CorrespondingCreditsConsumed
UL 608 608 4 8 16 8 16
1280 1280 2SF4 16 32 16 32
2720 2720 2SF2 32 64 32 64
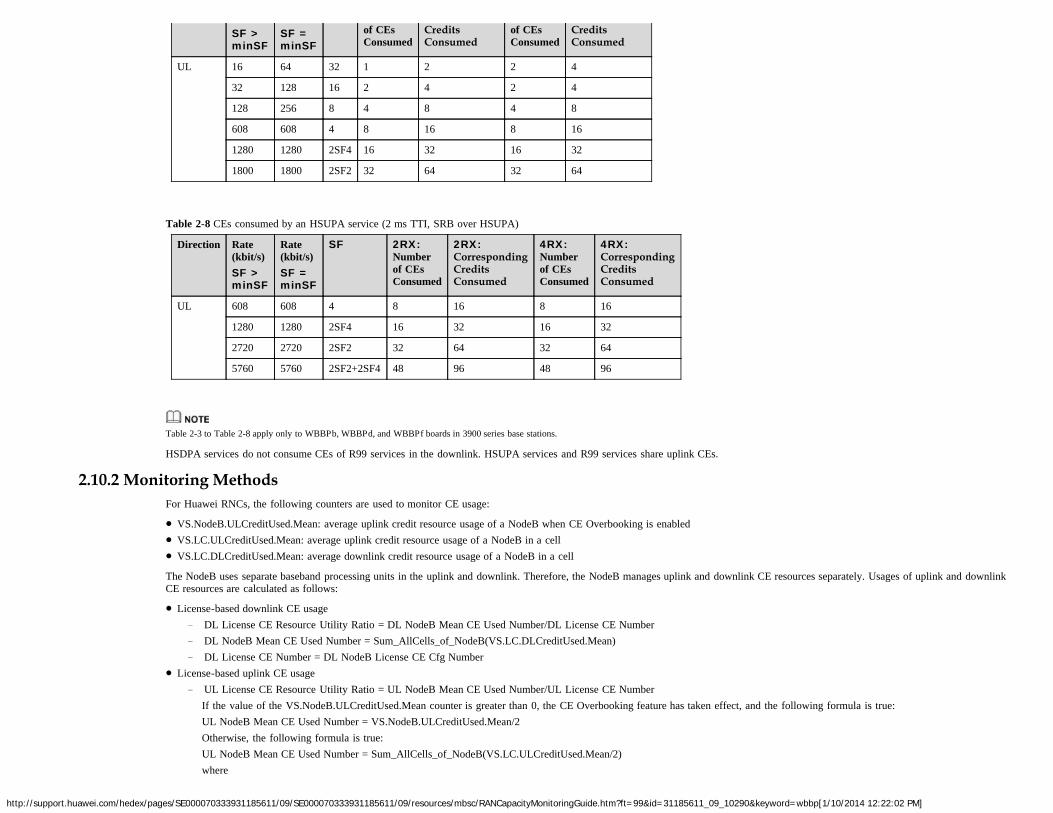
Table 2-7 CEs consumed by an HSUPA service (10 ms TTI, SRB over HSUPA)
Direction Rate(kbit/s)
Rate(kbit/s)
SF 2RX:Number
2RX:Corresponding
4RX:Number
4RX:Corresponding
http://support.huawei.com/hedex/pages/SE000070333931185611/09/SE000070333931185611/09/resources/mbsc/RANCapacityMonitoringGuide.htm?ft=99&id=31185611_09_10290&keyword=wbbp[1/10/2014 12:22:02 PM]
SF >minSF
SF =minSF
of CEsConsumed
CreditsConsumed
of CEsConsumed
CreditsConsumed
UL 16 64 32 1 2 2 4
32 128 16 2 4 2 4
128 256 8 4 8 4 8
608 608 4 8 16 8 16
1280 1280 2SF4 16 32 16 32
1800 1800 2SF2 32 64 32 64
Table 2-8 CEs consumed by an HSUPA service (2 ms TTI, SRB over HSUPA)
Direction Rate(kbit/s)SF >minSF
Rate(kbit/s)SF =minSF
SF 2RX:Numberof CEsConsumed
2RX:CorrespondingCreditsConsumed
4RX:Numberof CEsConsumed
4RX:CorrespondingCreditsConsumed
UL 608 608 4 8 16 8 16
1280 1280 2SF4 16 32 16 32
2720 2720 2SF2 32 64 32 64
5760 5760 2SF2+2SF4 48 96 48 96
Table 2-3 to Table 2-8 apply only to WBBPb, WBBPd, and WBBPf boards in 3900 series base stations.
HSDPA services do not consume CEs of R99 services in the downlink. HSUPA services and R99 services share uplink CEs.
2.10.2 Monitoring MethodsFor Huawei RNCs, the following counters are used to monitor CE usage:
VS.NodeB.ULCreditUsed.Mean: average uplink credit resource usage of a NodeB when CE Overbooking is enabledVS.LC.ULCreditUsed.Mean: average uplink credit resource usage of a NodeB in a cellVS.LC.DLCreditUsed.Mean: average downlink credit resource usage of a NodeB in a cell
The NodeB uses separate baseband processing units in the uplink and downlink. Therefore, the NodeB manages uplink and downlink CE resources separately. Usages of uplink and downlinkCE resources are calculated as follows:
License-based downlink CE usage− DL License CE Resource Utility Ratio = DL NodeB Mean CE Used Number/DL License CE Number− DL NodeB Mean CE Used Number = Sum_AllCells_of_NodeB(VS.LC.DLCreditUsed.Mean)− DL License CE Number = DL NodeB License CE Cfg Number
License-based uplink CE usage− UL License CE Resource Utility Ratio = UL NodeB Mean CE Used Number/UL License CE Number
If the value of the VS.NodeB.ULCreditUsed.Mean counter is greater than 0, the CE Overbooking feature has taken effect, and the following formula is true:UL NodeB Mean CE Used Number = VS.NodeB.ULCreditUsed.Mean/2Otherwise, the following formula is true:UL NodeB Mean CE Used Number = Sum_AllCells_of_NodeB(VS.LC.ULCreditUsed.Mean/2)where
http://support.huawei.com/hedex/pages/SE000070333931185611/09/SE000070333931185611/09/resources/mbsc/RANCapacityMonitoringGuide.htm?ft=99&id=31185611_09_10290&keyword=wbbp[1/10/2014 12:22:02 PM]
"/2" is used because the number of uplink credit resources is twice the number of uplink CEs, whereas the number of downlink credit resources is equal to the number of downlinkCEs.
− UL License CE Number = UL NodeB License CE Cfg NumberHardware-based downlink CE usage
− DL CE Capacity Utility Ratio = DL NodeB Mean CE Used Number/DL CE Capacity Number− The value of DL NodeB Mean CE Used Number equals that used for calculating the license-based downlink CE usage.− DL CE Capacity Number = VS.HW.DLCreditAvailable
Hardware-based uplink CE usage− UL CE Capacity Utility Ratio = UL NodeB Mean CE Used Number/UL CE Capacity Number− The value of UL NodeB Mean CE Used Number equals that used for calculating the license-based uplink CE usage.− UL CE Capacity Number = VS.HW.ULCreditAvailable
The CE resource usage can be monitored by alarms. If the CE hardware capacity is exceeded, ALM-28230 Base Station Service Overload is reported.
2.10.3 Optimization SuggestionsIf the uplink or downlink License-based or Hardware-based CE usage is constantly higher than 70% during peak hours for three consecutive days in one week, expand capacity as follows:
If the license-based CE usage exceeds its capacity expansion threshold, CE resources are limited by the license. In this case, upgrade the license file.If the hardware-based CE usage exceeds its capacity expansion threshold, CE resources are limited by the hardware capacity. In this case, add WBBP boards.
If capacity expansion is inapplicable, perform the following operations to optimize the CE usage:Run the RNC command SET UCORRMALGOSWITCH. In this step, select the DRA_DCCC_SWITCH and DRA_BASE_ADM_CE_BE_TTI_RECFG_SWITCH check boxes under
the Dynamic Resource Allocation Switch parameter to enable the DCCC algorithm and the TTI dynamic adjustment algorithm for admission CE-based BE services, respectively.Run the RNC command SET UUSERGBR with the Uplink GBR for BE service parameter set to D32.
Newly added CE resources can share traffic with hotspots and relieve CE congestion caused by traffic overflow.
2.11 Iub Bandwidth2.11.1 Monitoring Principles
The Iub interface is between the NodeB and the RNC. Depending on transmission medium, the Iub interface can use ATM transmission or IP transmission.
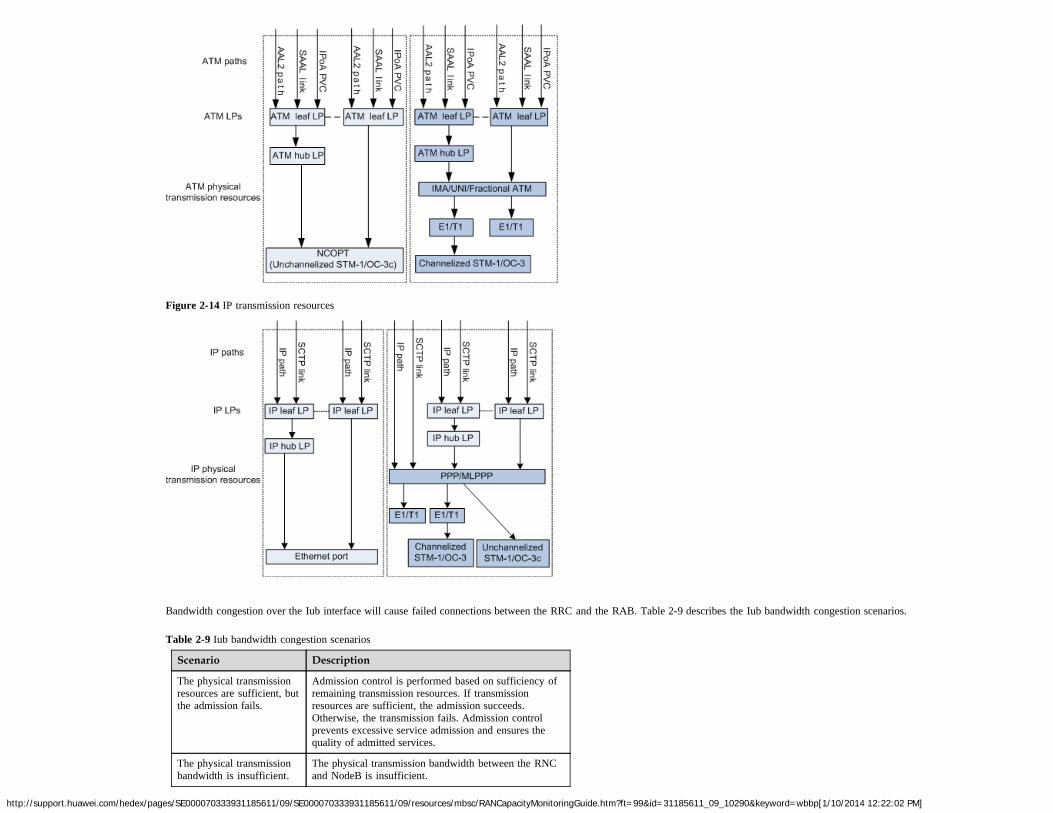
ATM and IP transmission resources can be classified into physical resources, logical port resources, resource groups, and link resources, as shown in Figure 2-13 and Figure 2-14.
Figure 2-13 ATM transmission resources
http://support.huawei.com/hedex/pages/SE000070333931185611/09/SE000070333931185611/09/resources/mbsc/RANCapacityMonitoringGuide.htm?ft=99&id=31185611_09_10290&keyword=wbbp[1/10/2014 12:22:02 PM]
Figure 2-14 IP transmission resources
Bandwidth congestion over the Iub interface will cause failed connections between the RRC and the RAB. Table 2-9 describes the Iub bandwidth congestion scenarios.
Table 2-9 Iub bandwidth congestion scenarios
Scenario Description
The physical transmissionresources are sufficient, butthe admission fails.
Admission control is performed based on sufficiency ofremaining transmission resources. If transmissionresources are sufficient, the admission succeeds.Otherwise, the transmission fails. Admission controlprevents excessive service admission and ensures thequality of admitted services.
The physical transmissionbandwidth is insufficient.
The physical transmission bandwidth between the RNCand NodeB is insufficient.
http://support.huawei.com/hedex/pages/SE000070333931185611/09/SE000070333931185611/09/resources/mbsc/RANCapacityMonitoringGuide.htm?ft=99&id=31185611_09_10290&keyword=wbbp[1/10/2014 12:22:02 PM]
2.11.2 Monitoring Methods
ATM TransmissionOn an ATM transport network, Huawei RNCs and NodeBs can monitor the uplink and downlink load on their interface boards. The Iub bandwidth usage is represented by the ratio of theactual uplink or downlink load to the configured Iub bandwidth.
The RNC monitors the bandwidth-based admission success rate for each NodeB.
1. Bandwidth-based admission success rate
The counters used to measure the bandwidth-based admission success rate are as follows:
VS.AAL2.CAC.Succ: number of successful AAL2 path admissions
VS.AAL2.CAC.Att: number of AAL2 path resource admissions
The bandwidth-based admission success rate is calculated using the following formula:
Bandwidth-based admission success rate = VS.AAL2.CAC.Succ/VS.AAL2.CAC.Att
If the bandwidth-based admission success rate is less than 99%, bandwidth congestion probably occurred on the user plane.
2. Physical bandwidth utilization- Control plane
The counters for monitoring received or transmitted bytes on Signaling ATM Layer (SAAL) links (including NCP, CCP and ALCAP links) are as follows:
VS.SAALLNK.PVCLAYER.TXBYTES: number of bytes transmitted on an SAAL link at the ATM layer
VS.SAALLNK.PVCLAYER.RXBYTES: number of bytes received on an SAAL link at the ATM layer
The uplink and downlink bandwidth utility ratios of the SAAL links on the control plane over the Iub interface are calculated using the following formulas:
VS.SAALLNK.PVCLAYER.RX.LOAD = VS.SAALLNK.PVCLAYER.RXBYTES x 8/1000/SP<Measurement period>/RX BW_CFG
VS.SAALLNK.PVCLAYER.TX.LOAD = VS.SAALLNK.PVCLAYER.TXBYTES x 8/1000/SP<Measurement period>/TX BW_CFG
When the uplink or downlink bandwidth utility ratio reaches 70%, bandwidth congestion occurred on the control plane. Then, capacity expansion is required. In addition, if ALM-21532SAAL Link Congestion is reported on the Iub interface, bandwidth congestion occurred on the control plane.
- User plane
The counters used to measure the number of bytes transmitted and received on an AAL2 path at the ATM layer for NodeBs are as follows:
VS.AAL2PATH.PVCLAYER.TXBYTES: number of bytes transmitted on an AAL2 path at the ATM layer
VS.AAL2PATH.PVCLAYER.RXBYTES: number of bytes received on an AAL2 path at the ATM layer
The uplink and downlink bandwidth utility ratios of the user plane on the Iub interface are calculated using the following formulas:
DL IUB User Plane Utility Ratio = Sum (VS.AAL2PATH.PVCLAYER.TXBYTES) x 8/SP<Measurement period>/1000/TX BW_CFG
UL IUB User Plane Utility Ratio = Sum (VS.AAL2PATH.PVCLAYER.RXBYTES) x 8/SP<Measurement period>/1000/RX BW_CFG
When the uplink or downlink bandwidth utility ratio reaches 70%, bandwidth congestion occurred on the user plane. Then, capacity expansion is required.
IP TransmissionOn an IP transport network, the RNC and NodeB can monitor the average uplink and downlink load on their interface boards. The Iub bandwidth usage is represented by the ratio of theaverage uplink or downlink load to the configured Iub bandwidth. In addition, the RNC and NodeB can dynamically adjust the bandwidth of a service based on the QoS requirements of theservice and user priority and improve the Iub bandwidth usage using the reserve pressure algorithm on their interface boards.1. Bandwidth-based admission success rate
The counters used to measure the bandwidth-based admission success rate are as follows:
VS.ANI.IP.Conn.Estab.Succ: number of successful IP connection setups initiated by the transport layer on IP transport adjacent node
http://support.huawei.com/hedex/pages/SE000070333931185611/09/SE000070333931185611/09/resources/mbsc/RANCapacityMonitoringGuide.htm?ft=99&id=31185611_09_10290&keyword=wbbp[1/10/2014 12:22:02 PM]
VS.ANI.IP.Conn.Estab.Att: number of connection setup requests for IP transport from the transport layer to the radio network layer on the IP transport adjacent node
VS.ANI.IP.FailResAllocForBwLimit: number of failed resource allocations due to insufficient bandwidth on the IP transport adjacent node
The IP connection setup success rate is calculated using the following formula:
IP connection setup success rate = VS.ANI.IP.Conn.Estab.Succ/VS.ANI.IP.Conn.Estab.Att
If the IP connection setup success rate is less than 99%, bandwidth congestion probably occurred on the user plane.
If the value of the VS.ANI.IP.FailResAllocForBwLimit counter is not zero, bandwidth congestion occurred on the user plane.
2. Physical bandwidth usage- Control plane
The counters for monitoring the bytes received or transmitted on Signaling Control Transmission Protocol (SCTP) links (including NCP, CCP links) are as follows:
VS.SCTP.TX.BYTES: number of IP bytes transmitted on an SCTP link
VS.SCTP.RX.BYTES: number of IP bytes received on an SCTP link
The uplink and downlink traffic volumes of the SCTP links on the control plane over the Iub interface are calculated using the following formulas:
STCP DL KBPS = VS.SCTP.TX.BYTES x 8/SP<Measurement period>/1000
SCTP UL KBPS = VS.SCTP.RX.BYTES x 8/SP<Measurement period>/1000
If ALM-21542 SCTP Link Congestion is reported on the Iub interface, bandwidth congestion occurred on the control plane.
- User plane
In non-transmission resource pool networking, the number of bytes received or transmitted on an IP path of each NodeB is measured by the following counters:
VS.IPPATH.IPLAYER.TXBYTES: number of bytes transmitted on an IP path at the IP layer
VS.IPPATH.IPLAYER.RXBYTES: number of bytes received on an IP path at the IP layer
The uplink or downlink Iub bandwidth utility ratios are calculated using the following formulas:
DL IUB User Plane Utility Ratio = Sum (VS.IPPATH.IPLAYER.TXBYTES) x 8/SP<Measurement period>/1000/TX BW_CFG
UL IUB User Plane Utility Ratio = Sum (VS.IPPATH.IPLAYER.RXBYTES) x 8/SP<Measurement period>/1000/RX BW_CFG
If the uplink or downlink bandwidth utility ratio of the user plane on the Iub interface reaches 70%, bandwidth congestion occurred on the user plane. Then, capacity expansion is required.
In transmission resource pool networking, the number of IP bytes received or transmitted on the user plane by each adjacent node is measured by the following counters:
VS.IPPOOL.ANI.IPLAYER.TXBYTES: number of IP bytes transmitted on the user plane of an adjacent node
VS.IPPOOL.ANI.IPLAYER.RXBYTES: number of IP bytes received on the user plane of an adjacent node
The Iub bandwidth utility ratio of a transmission resource pool is calculated using the following formulas:
DL IUB User Plane Utility Ratio = VS.IPPOOL.ANI.IPLAYER.TXBYTES x 8/SP<Measurement period>/1000/TX BW_CFG
UL IUB User Plane Utility Ratio = VS.IPPOOL.ANI.IPLAYER.RXBYTES x 8/SP<Measurement period>/1000/RX BW_CFG
If the uplink or downlink bandwidth utility ratio of the user plane on the Iub interface reaches 70%, bandwidth congestion occurred on the user plane. Then, capacity expansion is required.
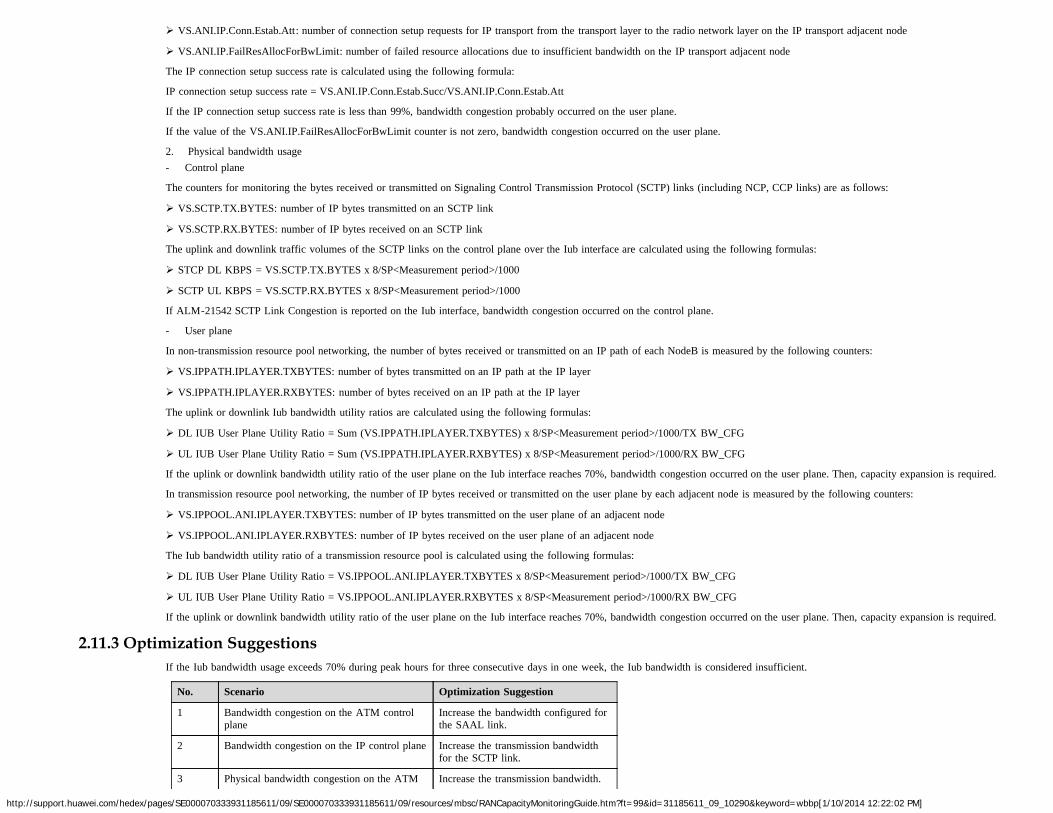
2.11.3 Optimization SuggestionsIf the Iub bandwidth usage exceeds 70% during peak hours for three consecutive days in one week, the Iub bandwidth is considered insufficient.
No. Scenario Optimization Suggestion
1 Bandwidth congestion on the ATM controlplane
Increase the bandwidth configured forthe SAAL link.
2 Bandwidth congestion on the IP control plane Increase the transmission bandwidthfor the SCTP link.
3 Physical bandwidth congestion on the ATM Increase the transmission bandwidth.
http://support.huawei.com/hedex/pages/SE000070333931185611/09/SE000070333931185611/09/resources/mbsc/RANCapacityMonitoringGuide.htm?ft=99&id=31185611_09_10290&keyword=wbbp[1/10/2014 12:22:02 PM]
and IP user planes
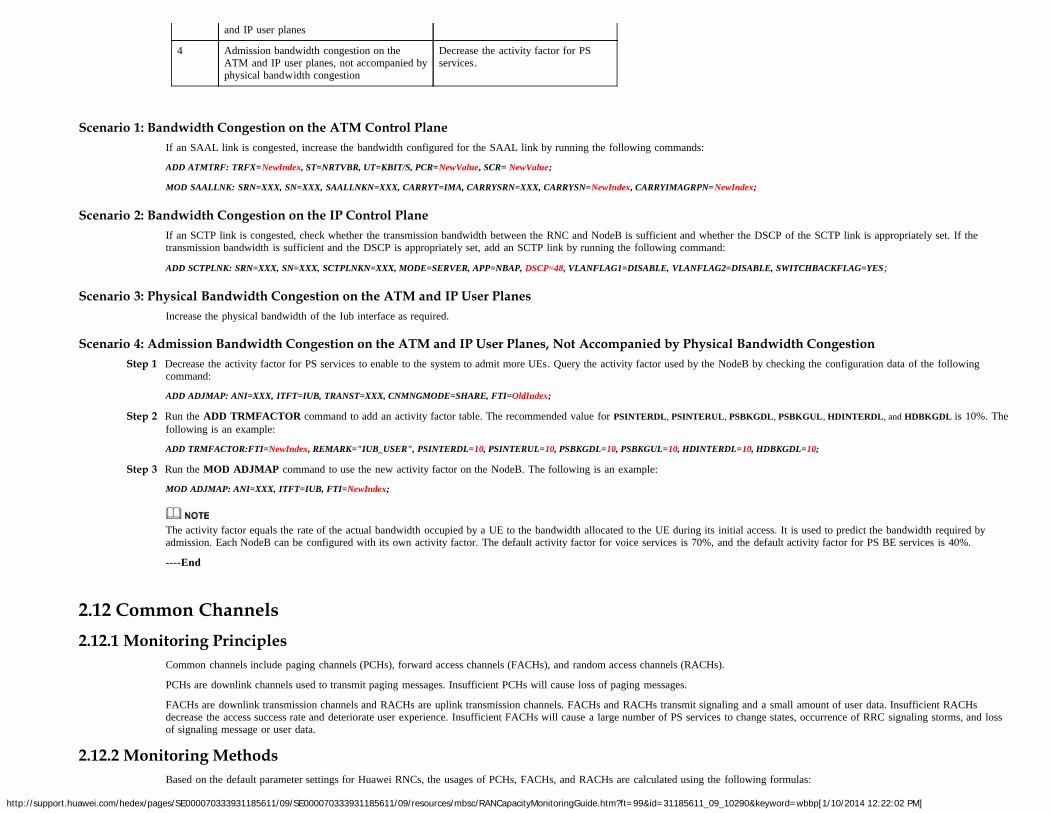
4 Admission bandwidth congestion on theATM and IP user planes, not accompanied byphysical bandwidth congestion
Decrease the activity factor for PSservices.
Scenario 1: Bandwidth Congestion on the ATM Control PlaneIf an SAAL link is congested, increase the bandwidth configured for the SAAL link by running the following commands:
ADD ATMTRF: TRFX=NewIndex, ST=NRTVBR, UT=KBIT/S, PCR=NewValue, SCR= NewValue;
MOD SAALLNK: SRN=XXX, SN=XXX, SAALLNKN=XXX, CARRYT=IMA, CARRYSRN=XXX, CARRYSN=NewIndex, CARRYIMAGRPN=NewIndex;
Scenario 2: Bandwidth Congestion on the IP Control PlaneIf an SCTP link is congested, check whether the transmission bandwidth between the RNC and NodeB is sufficient and whether the DSCP of the SCTP link is appropriately set. If thetransmission bandwidth is sufficient and the DSCP is appropriately set, add an SCTP link by running the following command:
ADD SCTPLNK: SRN=XXX, SN=XXX, SCTPLNKN=XXX, MODE=SERVER, APP=NBAP, DSCP=48, VLANFLAG1=DISABLE, VLANFLAG2=DISABLE, SWITCHBACKFLAG=YES;
Scenario 3: Physical Bandwidth Congestion on the ATM and IP User PlanesIncrease the physical bandwidth of the Iub interface as required.
Scenario 4: Admission Bandwidth Congestion on the ATM and IP User Planes, Not Accompanied by Physical Bandwidth Congestion Step 1 Decrease the activity factor for PS services to enable to the system to admit more UEs. Query the activity factor used by the NodeB by checking the configuration data of the following
command:
ADD ADJMAP: ANI=XXX, ITFT=IUB, TRANST=XXX, CNMNGMODE=SHARE, FTI=OldIndex;
Step 2 Run the ADD TRMFACTOR command to add an activity factor table. The recommended value for PSINTERDL, PSINTERUL, PSBKGDL, PSBKGUL, HDINTERDL, and HDBKGDL is 10%. Thefollowing is an example:
ADD TRMFACTOR:FTI=NewIndex, REMARK="IUB_USER", PSINTERDL=10, PSINTERUL=10, PSBKGDL=10, PSBKGUL=10, HDINTERDL=10, HDBKGDL=10;
Step 3 Run the MOD ADJMAP command to use the new activity factor on the NodeB. The following is an example:
MOD ADJMAP: ANI=XXX, ITFT=IUB, FTI=NewIndex;
The activity factor equals the rate of the actual bandwidth occupied by a UE to the bandwidth allocated to the UE during its initial access. It is used to predict the bandwidth required byadmission. Each NodeB can be configured with its own activity factor. The default activity factor for voice services is 70%, and the default activity factor for PS BE services is 40%.
----End
2.12 Common Channels2.12.1 Monitoring Principles
Common channels include paging channels (PCHs), forward access channels (FACHs), and random access channels (RACHs).
PCHs are downlink channels used to transmit paging messages. Insufficient PCHs will cause loss of paging messages.
FACHs are downlink transmission channels and RACHs are uplink transmission channels. FACHs and RACHs transmit signaling and a small amount of user data. Insufficient RACHsdecrease the access success rate and deteriorate user experience. Insufficient FACHs will cause a large number of PS services to change states, occurrence of RRC signaling storms, and lossof signaling message or user data.
2.12.2 Monitoring MethodsBased on the default parameter settings for Huawei RNCs, the usages of PCHs, FACHs, and RACHs are calculated using the following formulas:
http://support.huawei.com/hedex/pages/SE000070333931185611/09/SE000070333931185611/09/resources/mbsc/RANCapacityMonitoringGuide.htm?ft=99&id=31185611_09_10290&keyword=wbbp[1/10/2014 12:22:02 PM]
1. PCH usagePCH usage = VS.UTRAN.AttPaging1/(<SP> x 60 x 5/0.01)
2. FACH usageIf an FACH and a PCH are carried on a secondary common control physical channel (SCCPCH), the FACH usage is calculated using the following formula:
Usage of an FACH carried on an SCCPCH = VS.CRNCIubBytesFACH.Tx x 8/[(60 x <SP> x 168 x 1/0.01) x VS.PCH.Bandwidth.UsageRate x 6/7 + (60 x <SP> x 360 x 1/0.01) x(1 - VS.PCH.Bandwidth.UsageRate x 6/7)]whereVS.PCH.Bandwidth.UsageRate = <VS.CRNCIubBytesPCH.Tx> /(<VS.CRNC.IUB.PCH.Bandwidth> x <SP> x 60)
If an FACH is carried on an SCCPCH, the FACH usage is calculated using the following formula:FACH Utility Ratio = ((VS.SRBNum.FACH - VS.OneSRBTTINum.FACH)/2 + VS.OneSRBTTINum.FACH + VS.IndepTRBNum.FACH)/( <SP> x 60/0.01)whereSP is the measurement period, expressed in seconds.
3. RACH usageEach cell has only one RACH. When signaling and user data coexist on the RACH, the RACH usage is calculated using the following formula:RACH Utility Ratio = ((VS.CRNCIubBytesRACH.Rx - VS.TRBNum.RACH x 360/8) x 8/168)/( <sp> x 60 x 4/0.02)+ VS.TRBNum.RACH/(<sp> x 60 x 4/0.02)
2.12.3 Optimization SuggestionsMeasures taken to address overload of PCHs, FACHs, and RACHs are as follows:
1. PCH overloadReplan the LA. Inappropriate planning of LAs will causes overload of PCHs because paging messages are broadcast across the entire LA.− If paging messages are not retransmitted, the paging message loss rate is 5% when the PCH usage reaches 60%. In this case, replan the LAs or analyze the cause of paging message
loss.− If paging messages are retransmitted once or twice, the paging message loss rate is 1% when the PCH usage reaches 70%. In this case, replan the LAs or analyze the cause of
paging message loss.2. FACH overload
If the FACH usage reaches 70% during peak hours for three consecutive days in one week, the following measures are recommended:− Add an SCCPCH to carry FACHs if the network is configured with only one SCCPCH.− Add a carrier, NodeB, or micro NodeB if no more SCCPCHs can be added.
3. RACH overloadAdd a carrier if the RACH usage reaches 70% during peak hours for three consecutive days in one week.
2.13 NodeB CNBAP Load2.13.1 Monitoring Principles
The control NodeB application part (CNBAP) load is used to measure the processing capacity of a NodeB. CNBAP overload will cause a radio link setup failure or result in rejected radiolink setup requests and significantly decrease the setup success rate of RRC and RAB connections.
2.13.2 Monitoring MethodsFor Huawei NodeBs, the following counters are used to monitor the CNBAP load:
VS.RadioLink.Recv.Mean: average number of wireless connection receptions per secondVS.DedicMeaRpt.MEAN: average number of Dedicated Measurement Reporting per second
The CNBAP load of a NodeB is limited by the license and hardware capacity. The license-based and hardware-based CNBAP load ratios are calculated using the following formulas,respectively:
License-based CNBAP usage− License CNBAP Resource Utility Ratio = (VS.RadioLink.Recv.Mean + VS.DedicMeaRpt.MEAN/12)/License CNBAP− License CNBAP = NodeB License CNBAP Cfg Number
http://support.huawei.com/hedex/pages/SE000070333931185611/09/SE000070333931185611/09/resources/mbsc/RANCapacityMonitoringGuide.htm?ft=99&id=31185611_09_10290&keyword=wbbp[1/10/2014 12:22:02 PM]
Hardware-based CNBAP usage− CNBAP Capacity Utility Ratio = (VS.RadioLink.Recv.Mean + VS.DedicMeaRpt.MEAN/12)/CNBAP Capacity of NodeB− The CNBAP capacity of a NodeB depends on the configurations of main control boards, WBBP boards, and UTRP boards.
For detailed specifications of these boards, see 3900 Series Base Station Technical Description.
The CNBAP resource usage can be monitored by alarms. If the CNBAP hardware capacity is exceeded, ALM-28230 Base Station Service Overload is reported.
2.13.3 Optimization SuggestionsIf the License-based CNBAP usage or Hardware-based CNBAP usage of the NodeB is greater than 60% during peak hours for three consecutive days in one week, the NodeB is consideredoverloaded.
Recommended measures are as follows:
Enable the WRFD-010202 UE State in Connected Mode (CELL_DCH, CELL_PCH, URA_PCH, CELL_FACH) or WRFD-020500 Enhanced Fast Dormancy feature.If the license-based CNBAP usage exceeds its capacity expansion threshold, CNBAP resources are limited by the license. In this case, upgrade the license file.If the hardware-based CNBAP usage exceeds its capacity expansion threshold, CNBAP resources are limited by the license. In this case, replace the WMPT board with the UMPT board,
or replace the WBBPb or WBBPd board with the WBBPf board.Split the NodeB or add a NodeB if the CNBAP overload problem cannot be solved by upgrading the license file or board addition or board replacement.
For details about how to enable the WRFD-010202 UE State in Connected Mode (CELL_DCH, CELL_PCH, URA_PCH, CELL_FACH) feature, see State Transition Feature ParameterDescription in RAN Feature Documentation.
For details about how to enable the WRFD-020500 Enhanced Fast Dormancy feature, see Enhanced Fast Dormancy Feature Parameter Description in RAN Feature Documentation.The maximum CNBAP capability of the NodeB is 1500. When the CNBAP capability configured for a NodeB is less than 1500, replace boards to expand the capacity if CNBAP overload
occurs. For the CNBAP capabilities of the WBBPb, WBBPd, and WBBPf boards in different configuration scenarios, see 3900 Series Base Station Technical Description.
3 Diagnosis of Problems Related to Network Resources
The monitoring methods described in chapter 2 "Network Resource Counters" can solve problems caused by traffic increase in most cases. However, these methods are insufficient in somescenarios and further analysis is required to determine whether resources are consumed by increased traffic or unexpected reasons. This chapter describes how to diagnose resource usageproblems caused by traffic increase or other exceptions.
This chapter is intended for experts who have a deep understanding of WCDMA networks.
3.1 Call Blocks in the Basic Call FlowWhen network resources are insufficient, system access KPIs are likely to be affected first.
Figure 3-1 shows the basic call flow chart and possible block/failure points. For details about the call flow, see 3GPP TS 25.931.
Figure 3-1 Call flow chart of possible block/failure points
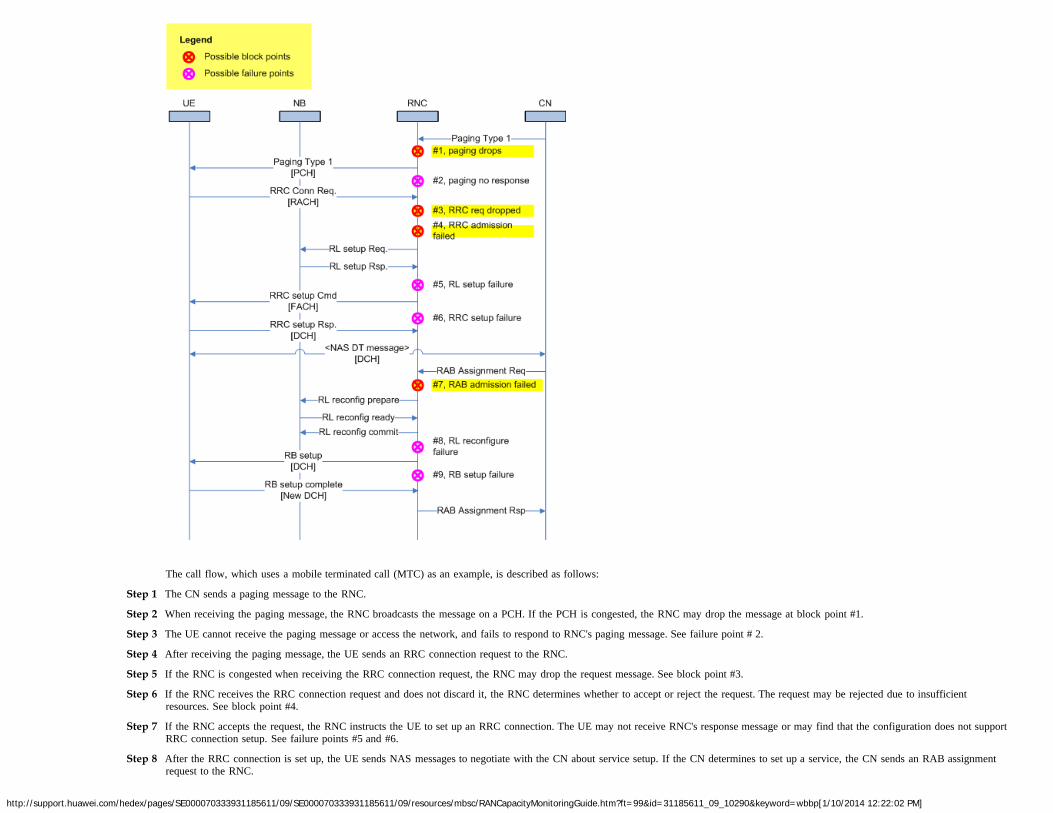
http://support.huawei.com/hedex/pages/SE000070333931185611/09/SE000070333931185611/09/resources/mbsc/RANCapacityMonitoringGuide.htm?ft=99&id=31185611_09_10290&keyword=wbbp[1/10/2014 12:22:02 PM]
The call flow, which uses a mobile terminated call (MTC) as an example, is described as follows:
Step 1 The CN sends a paging message to the RNC.
Step 2 When receiving the paging message, the RNC broadcasts the message on a PCH. If the PCH is congested, the RNC may drop the message at block point #1.
Step 3 The UE cannot receive the paging message or access the network, and fails to respond to RNC's paging message. See failure point # 2.
Step 4 After receiving the paging message, the UE sends an RRC connection request to the RNC.
Step 5 If the RNC is congested when receiving the RRC connection request, the RNC may drop the request message. See block point #3.
Step 6 If the RNC receives the RRC connection request and does not discard it, the RNC determines whether to accept or reject the request. The request may be rejected due to insufficientresources. See block point #4.
Step 7 If the RNC accepts the request, the RNC instructs the UE to set up an RRC connection. The UE may not receive RNC's response message or may find that the configuration does not supportRRC connection setup. See failure points #5 and #6.
Step 8 After the RRC connection is set up, the UE sends NAS messages to negotiate with the CN about service setup. If the CN determines to set up a service, the CN sends an RAB assignmentrequest to the RNC.
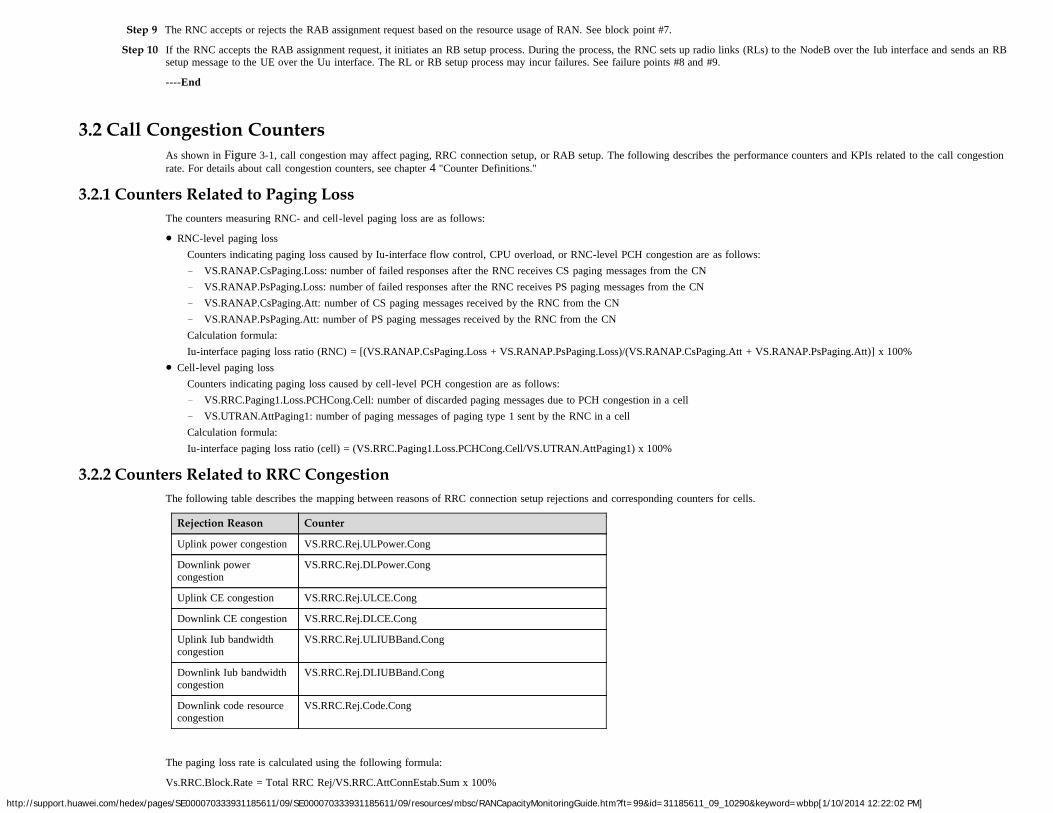
http://support.huawei.com/hedex/pages/SE000070333931185611/09/SE000070333931185611/09/resources/mbsc/RANCapacityMonitoringGuide.htm?ft=99&id=31185611_09_10290&keyword=wbbp[1/10/2014 12:22:02 PM]
Step 9 The RNC accepts or rejects the RAB assignment request based on the resource usage of RAN. See block point #7.
Step 10 If the RNC accepts the RAB assignment request, it initiates an RB setup process. During the process, the RNC sets up radio links (RLs) to the NodeB over the Iub interface and sends an RBsetup message to the UE over the Uu interface. The RL or RB setup process may incur failures. See failure points #8 and #9.
----End
3.2 Call Congestion CountersAs shown in Figure 3-1, call congestion may affect paging, RRC connection setup, or RAB setup. The following describes the performance counters and KPIs related to the call congestionrate. For details about call congestion counters, see chapter 4 "Counter Definitions."
3.2.1 Counters Related to Paging LossThe counters measuring RNC- and cell-level paging loss are as follows:
RNC-level paging lossCounters indicating paging loss caused by Iu-interface flow control, CPU overload, or RNC-level PCH congestion are as follows:− VS.RANAP.CsPaging.Loss: number of failed responses after the RNC receives CS paging messages from the CN− VS.RANAP.PsPaging.Loss: number of failed responses after the RNC receives PS paging messages from the CN− VS.RANAP.CsPaging.Att: number of CS paging messages received by the RNC from the CN− VS.RANAP.PsPaging.Att: number of PS paging messages received by the RNC from the CNCalculation formula:Iu-interface paging loss ratio (RNC) = [(VS.RANAP.CsPaging.Loss + VS.RANAP.PsPaging.Loss)/(VS.RANAP.CsPaging.Att + VS.RANAP.PsPaging.Att)] x 100%
Cell-level paging lossCounters indicating paging loss caused by cell-level PCH congestion are as follows:− VS.RRC.Paging1.Loss.PCHCong.Cell: number of discarded paging messages due to PCH congestion in a cell− VS.UTRAN.AttPaging1: number of paging messages of paging type 1 sent by the RNC in a cellCalculation formula:Iu-interface paging loss ratio (cell) = (VS.RRC.Paging1.Loss.PCHCong.Cell/VS.UTRAN.AttPaging1) x 100%
3.2.2 Counters Related to RRC CongestionThe following table describes the mapping between reasons of RRC connection setup rejections and corresponding counters for cells.
Rejection Reason Counter
Uplink power congestion VS.RRC.Rej.ULPower.Cong
Downlink powercongestion
VS.RRC.Rej.DLPower.Cong
Uplink CE congestion VS.RRC.Rej.ULCE.Cong
Downlink CE congestion VS.RRC.Rej.DLCE.Cong
Uplink Iub bandwidthcongestion
VS.RRC.Rej.ULIUBBand.Cong
Downlink Iub bandwidthcongestion
VS.RRC.Rej.DLIUBBand.Cong
Downlink code resourcecongestion
VS.RRC.Rej.Code.Cong
The paging loss rate is calculated using the following formula:
Vs.RRC.Block.Rate = Total RRC Rej/VS.RRC.AttConnEstab.Sum x 100%
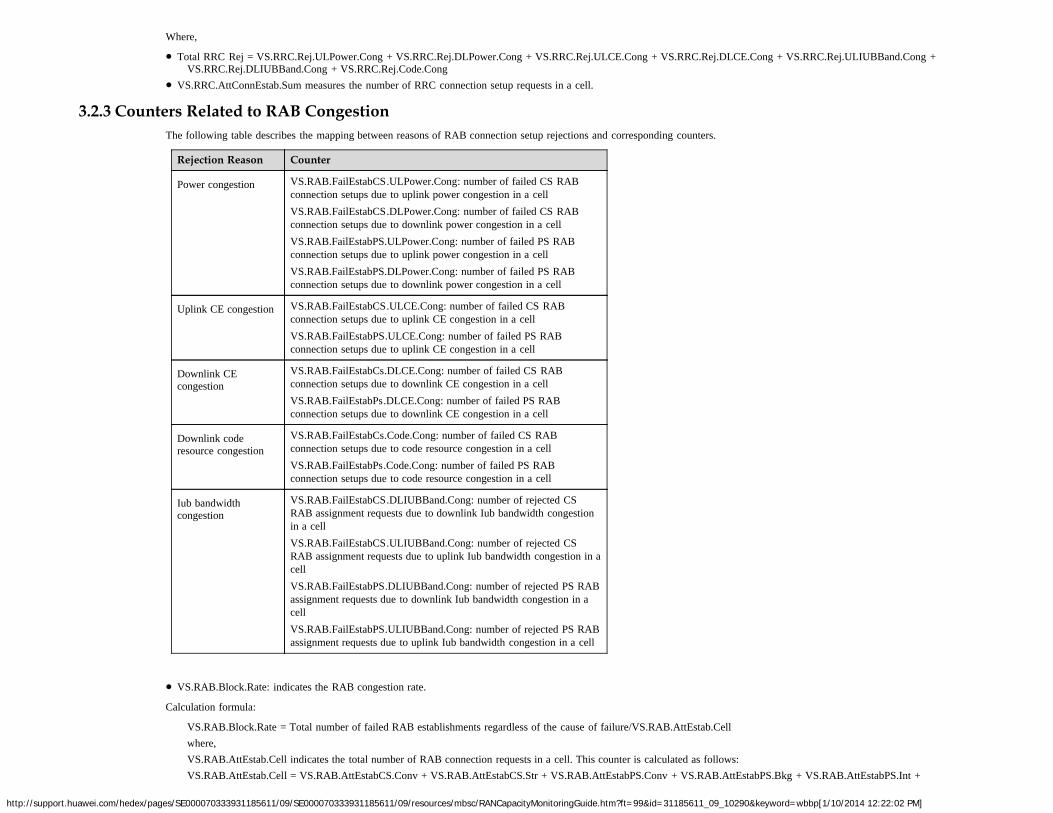
http://support.huawei.com/hedex/pages/SE000070333931185611/09/SE000070333931185611/09/resources/mbsc/RANCapacityMonitoringGuide.htm?ft=99&id=31185611_09_10290&keyword=wbbp[1/10/2014 12:22:02 PM]
Where,
Total RRC Rej = VS.RRC.Rej.ULPower.Cong + VS.RRC.Rej.DLPower.Cong + VS.RRC.Rej.ULCE.Cong + VS.RRC.Rej.DLCE.Cong + VS.RRC.Rej.ULIUBBand.Cong +VS.RRC.Rej.DLIUBBand.Cong + VS.RRC.Rej.Code.Cong
VS.RRC.AttConnEstab.Sum measures the number of RRC connection setup requests in a cell.
3.2.3 Counters Related to RAB CongestionThe following table describes the mapping between reasons of RAB connection setup rejections and corresponding counters.
Rejection Reason Counter
Power congestion VS.RAB.FailEstabCS.ULPower.Cong: number of failed CS RABconnection setups due to uplink power congestion in a cellVS.RAB.FailEstabCS.DLPower.Cong: number of failed CS RABconnection setups due to downlink power congestion in a cellVS.RAB.FailEstabPS.ULPower.Cong: number of failed PS RABconnection setups due to uplink power congestion in a cellVS.RAB.FailEstabPS.DLPower.Cong: number of failed PS RABconnection setups due to downlink power congestion in a cell
Uplink CE congestion VS.RAB.FailEstabCS.ULCE.Cong: number of failed CS RABconnection setups due to uplink CE congestion in a cellVS.RAB.FailEstabPS.ULCE.Cong: number of failed PS RABconnection setups due to uplink CE congestion in a cell
Downlink CEcongestion
VS.RAB.FailEstabCs.DLCE.Cong: number of failed CS RABconnection setups due to downlink CE congestion in a cellVS.RAB.FailEstabPs.DLCE.Cong: number of failed PS RABconnection setups due to downlink CE congestion in a cell
Downlink coderesource congestion
VS.RAB.FailEstabCs.Code.Cong: number of failed CS RABconnection setups due to code resource congestion in a cellVS.RAB.FailEstabPs.Code.Cong: number of failed PS RABconnection setups due to code resource congestion in a cell
Iub bandwidthcongestion
VS.RAB.FailEstabCS.DLIUBBand.Cong: number of rejected CSRAB assignment requests due to downlink Iub bandwidth congestionin a cellVS.RAB.FailEstabCS.ULIUBBand.Cong: number of rejected CSRAB assignment requests due to uplink Iub bandwidth congestion in acellVS.RAB.FailEstabPS.DLIUBBand.Cong: number of rejected PS RABassignment requests due to downlink Iub bandwidth congestion in acellVS.RAB.FailEstabPS.ULIUBBand.Cong: number of rejected PS RABassignment requests due to uplink Iub bandwidth congestion in a cell
VS.RAB.Block.Rate: indicates the RAB congestion rate.
Calculation formula:
VS.RAB.Block.Rate = Total number of failed RAB establishments regardless of the cause of failure/VS.RAB.AttEstab.Cellwhere,VS.RAB.AttEstab.Cell indicates the total number of RAB connection requests in a cell. This counter is calculated as follows:VS.RAB.AttEstab.Cell = VS.RAB.AttEstabCS.Conv + VS.RAB.AttEstabCS.Str + VS.RAB.AttEstabPS.Conv + VS.RAB.AttEstabPS.Bkg + VS.RAB.AttEstabPS.Int +
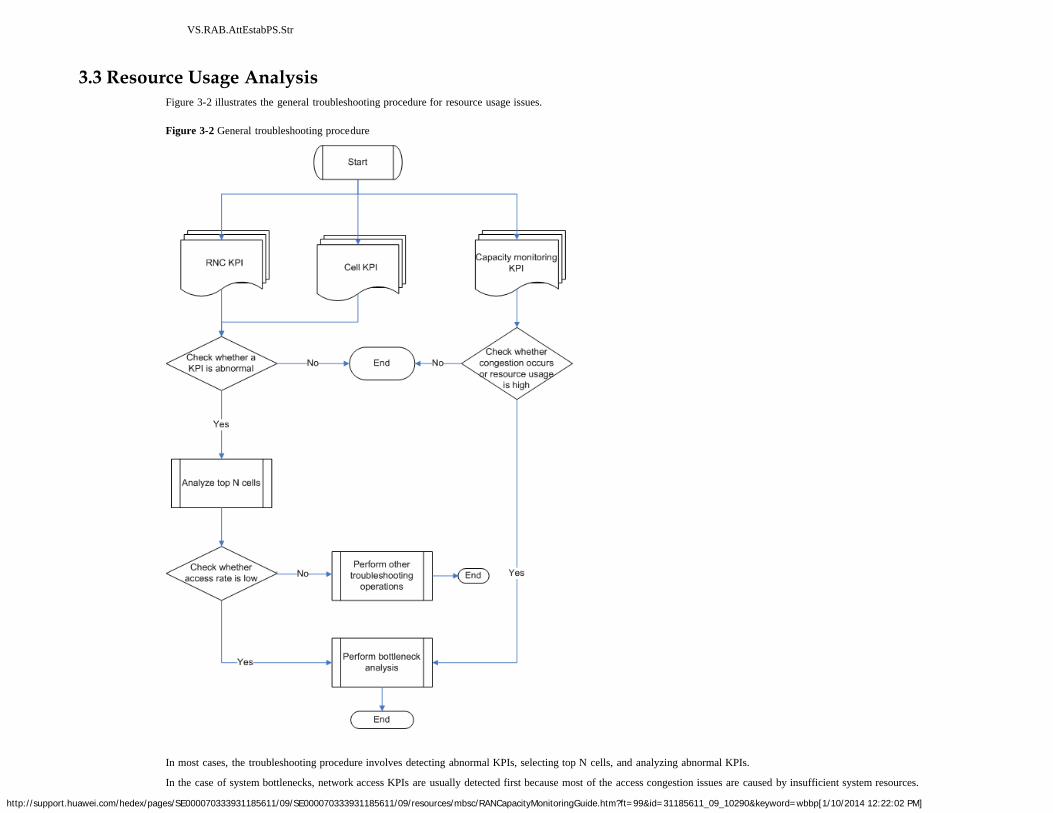
http://support.huawei.com/hedex/pages/SE000070333931185611/09/SE000070333931185611/09/resources/mbsc/RANCapacityMonitoringGuide.htm?ft=99&id=31185611_09_10290&keyword=wbbp[1/10/2014 12:22:02 PM]
VS.RAB.AttEstabPS.Str
3.3 Resource Usage AnalysisFigure 3-2 illustrates the general troubleshooting procedure for resource usage issues.
Figure 3-2 General troubleshooting procedure
In most cases, the troubleshooting procedure involves detecting abnormal KPIs, selecting top N cells, and analyzing abnormal KPIs.
In the case of system bottlenecks, network access KPIs are usually detected first because most of the access congestion issues are caused by insufficient system resources.
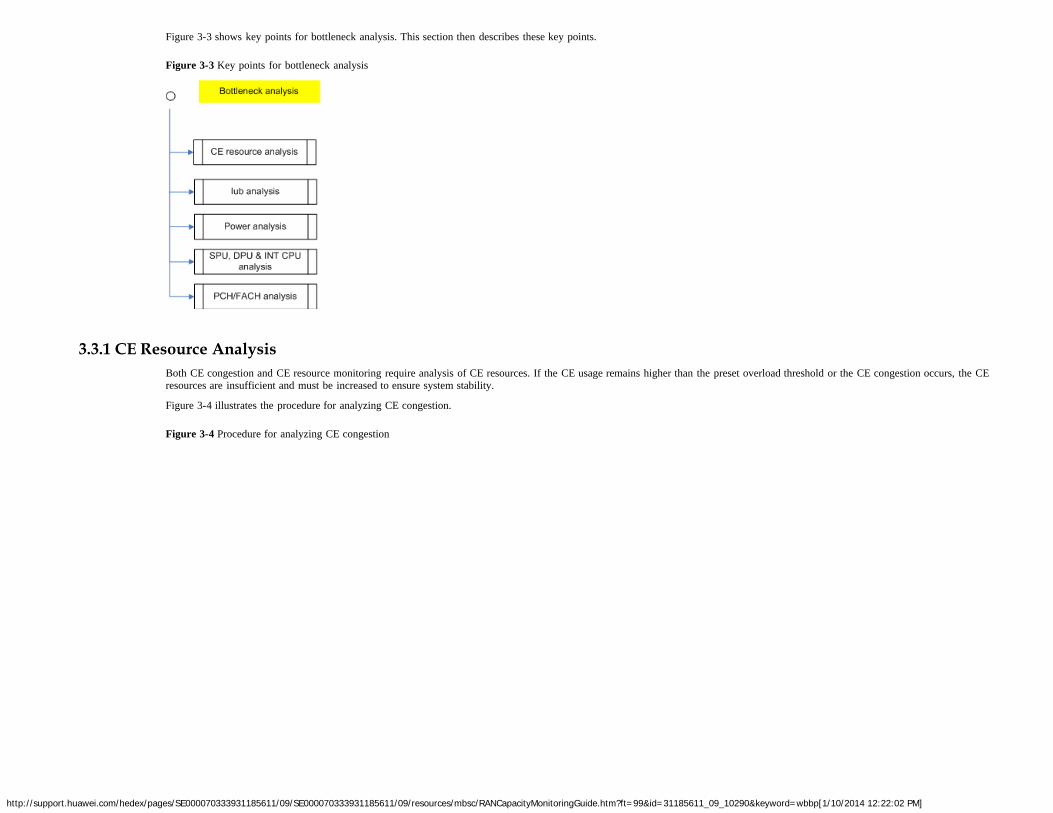
http://support.huawei.com/hedex/pages/SE000070333931185611/09/SE000070333931185611/09/resources/mbsc/RANCapacityMonitoringGuide.htm?ft=99&id=31185611_09_10290&keyword=wbbp[1/10/2014 12:22:02 PM]
Figure 3-3 shows key points for bottleneck analysis. This section then describes these key points.
Figure 3-3 Key points for bottleneck analysis
3.3.1 CE Resource AnalysisBoth CE congestion and CE resource monitoring require analysis of CE resources. If the CE usage remains higher than the preset overload threshold or the CE congestion occurs, the CEresources are insufficient and must be increased to ensure system stability.
Figure 3-4 illustrates the procedure for analyzing CE congestion.
Figure 3-4 Procedure for analyzing CE congestion
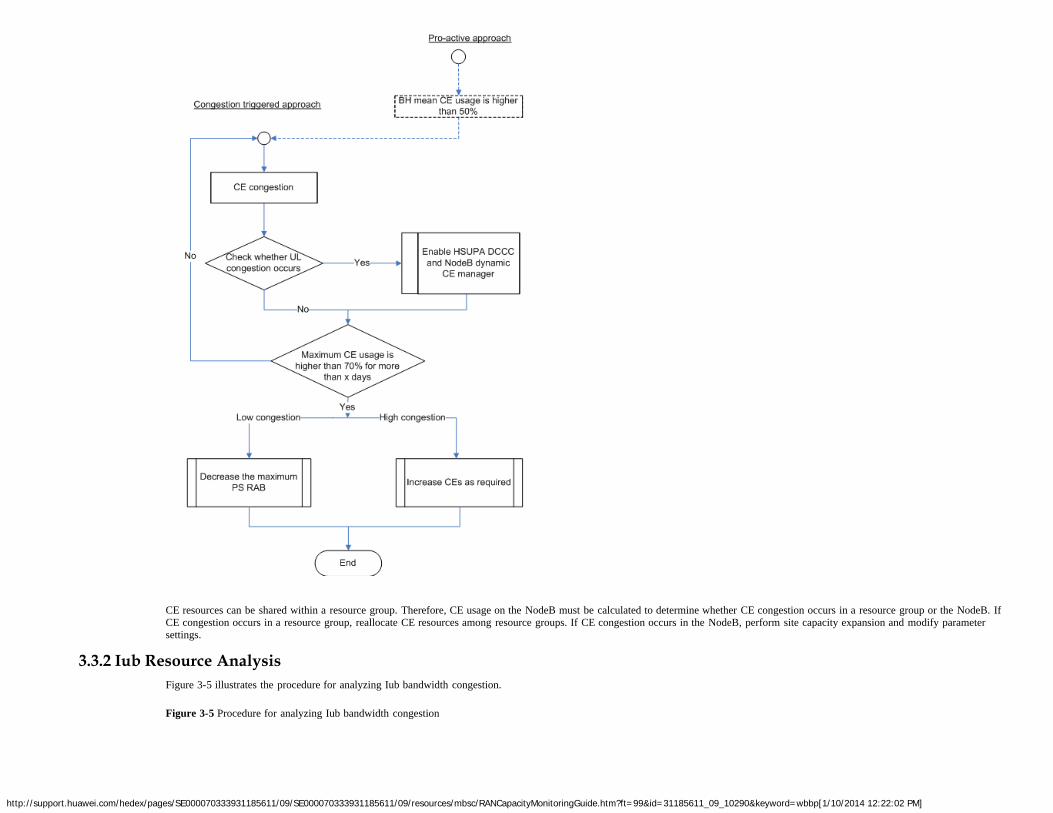
http://support.huawei.com/hedex/pages/SE000070333931185611/09/SE000070333931185611/09/resources/mbsc/RANCapacityMonitoringGuide.htm?ft=99&id=31185611_09_10290&keyword=wbbp[1/10/2014 12:22:02 PM]
CE resources can be shared within a resource group. Therefore, CE usage on the NodeB must be calculated to determine whether CE congestion occurs in a resource group or the NodeB. IfCE congestion occurs in a resource group, reallocate CE resources among resource groups. If CE congestion occurs in the NodeB, perform site capacity expansion and modify parametersettings.
3.3.2 Iub Resource AnalysisFigure 3-5 illustrates the procedure for analyzing Iub bandwidth congestion.
Figure 3-5 Procedure for analyzing Iub bandwidth congestion
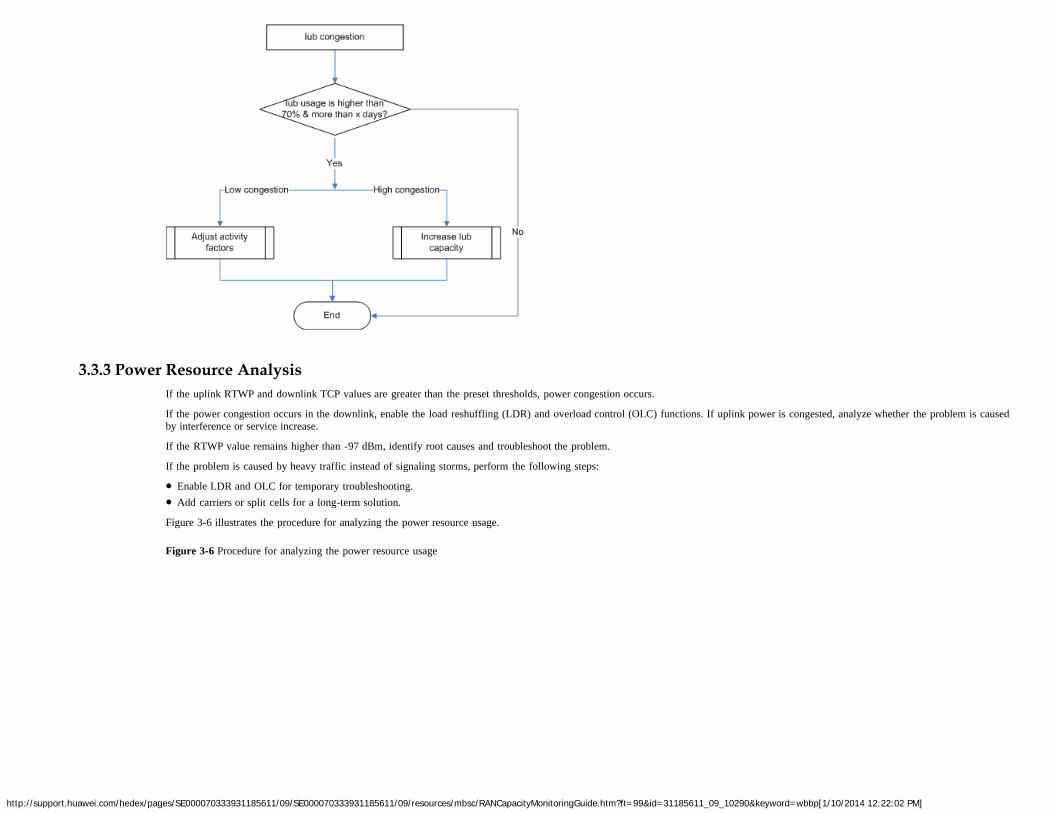
http://support.huawei.com/hedex/pages/SE000070333931185611/09/SE000070333931185611/09/resources/mbsc/RANCapacityMonitoringGuide.htm?ft=99&id=31185611_09_10290&keyword=wbbp[1/10/2014 12:22:02 PM]
3.3.3 Power Resource AnalysisIf the uplink RTWP and downlink TCP values are greater than the preset thresholds, power congestion occurs.
If the power congestion occurs in the downlink, enable the load reshuffling (LDR) and overload control (OLC) functions. If uplink power is congested, analyze whether the problem is causedby interference or service increase.
If the RTWP value remains higher than -97 dBm, identify root causes and troubleshoot the problem.
If the problem is caused by heavy traffic instead of signaling storms, perform the following steps:
Enable LDR and OLC for temporary troubleshooting.Add carriers or split cells for a long-term solution.
Figure 3-6 illustrates the procedure for analyzing the power resource usage.
Figure 3-6 Procedure for analyzing the power resource usage
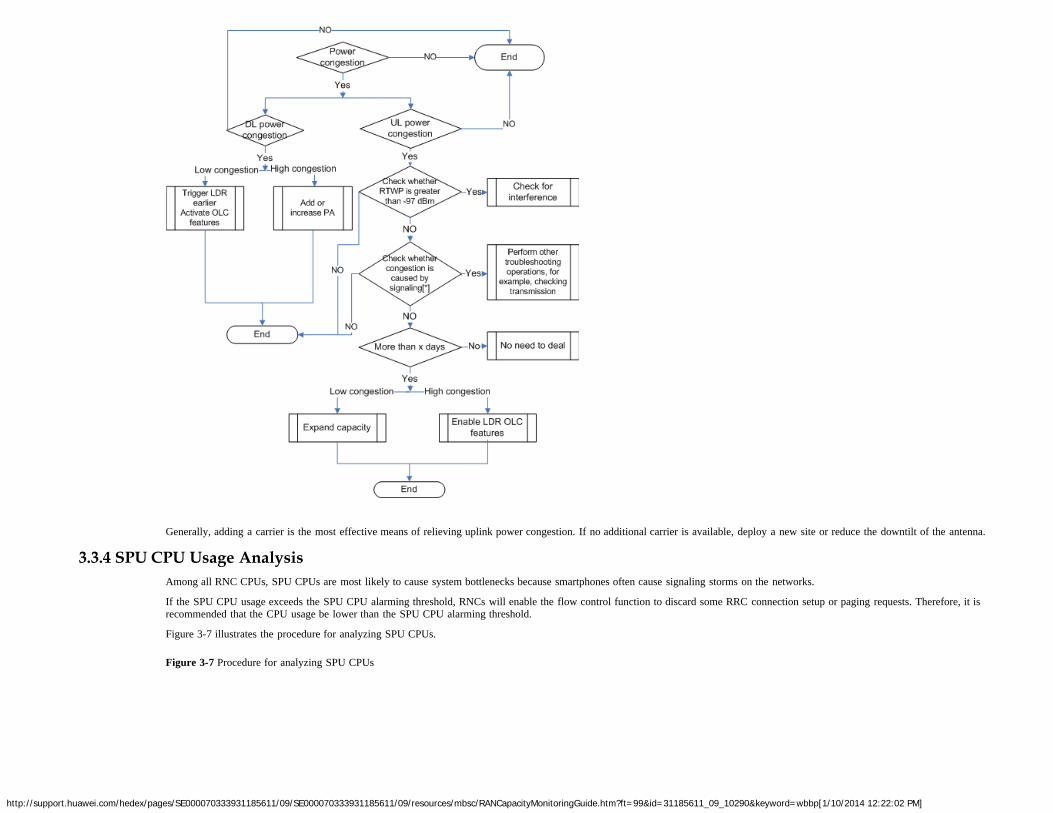
http://support.huawei.com/hedex/pages/SE000070333931185611/09/SE000070333931185611/09/resources/mbsc/RANCapacityMonitoringGuide.htm?ft=99&id=31185611_09_10290&keyword=wbbp[1/10/2014 12:22:02 PM]
Generally, adding a carrier is the most effective means of relieving uplink power congestion. If no additional carrier is available, deploy a new site or reduce the downtilt of the antenna.
3.3.4 SPU CPU Usage AnalysisAmong all RNC CPUs, SPU CPUs are most likely to cause system bottlenecks because smartphones often cause signaling storms on the networks.
If the SPU CPU usage exceeds the SPU CPU alarming threshold, RNCs will enable the flow control function to discard some RRC connection setup or paging requests. Therefore, it isrecommended that the CPU usage be lower than the SPU CPU alarming threshold.
Figure 3-7 illustrates the procedure for analyzing SPU CPUs.
Figure 3-7 Procedure for analyzing SPU CPUs
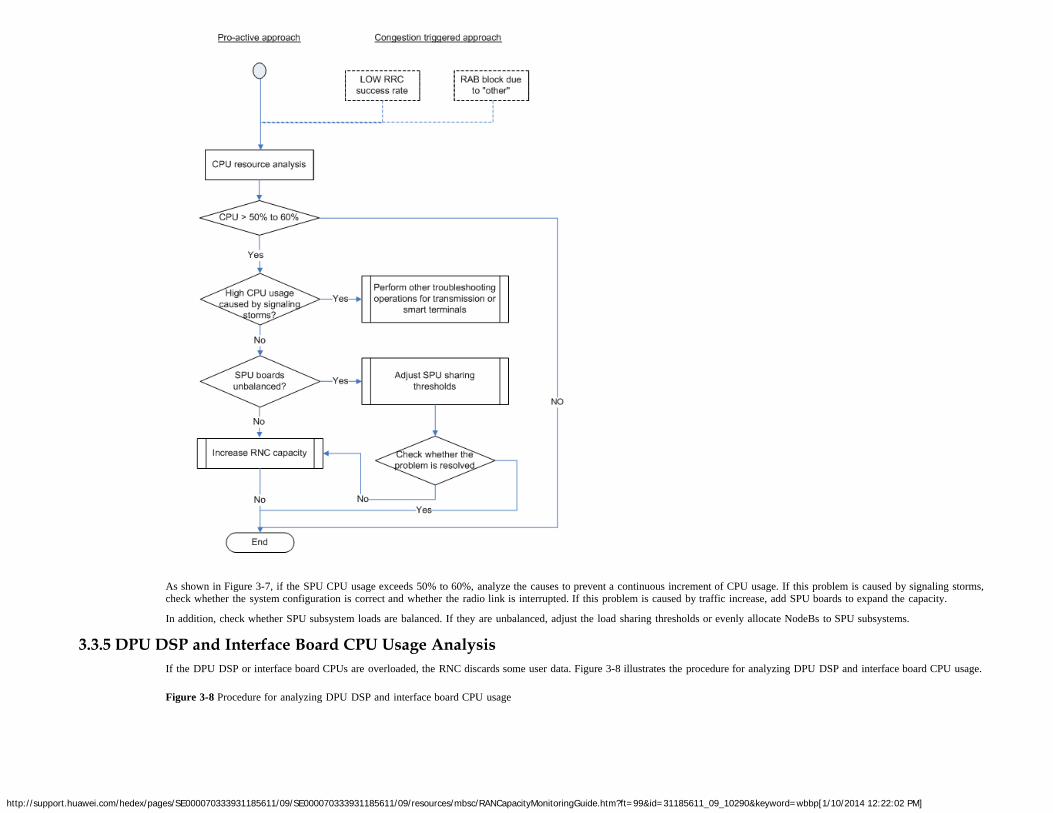
http://support.huawei.com/hedex/pages/SE000070333931185611/09/SE000070333931185611/09/resources/mbsc/RANCapacityMonitoringGuide.htm?ft=99&id=31185611_09_10290&keyword=wbbp[1/10/2014 12:22:02 PM]
As shown in Figure 3-7, if the SPU CPU usage exceeds 50% to 60%, analyze the causes to prevent a continuous increment of CPU usage. If this problem is caused by signaling storms,check whether the system configuration is correct and whether the radio link is interrupted. If this problem is caused by traffic increase, add SPU boards to expand the capacity.
In addition, check whether SPU subsystem loads are balanced. If they are unbalanced, adjust the load sharing thresholds or evenly allocate NodeBs to SPU subsystems.
3.3.5 DPU DSP and Interface Board CPU Usage AnalysisIf the DPU DSP or interface board CPUs are overloaded, the RNC discards some user data. Figure 3-8 illustrates the procedure for analyzing DPU DSP and interface board CPU usage.
Figure 3-8 Procedure for analyzing DPU DSP and interface board CPU usage
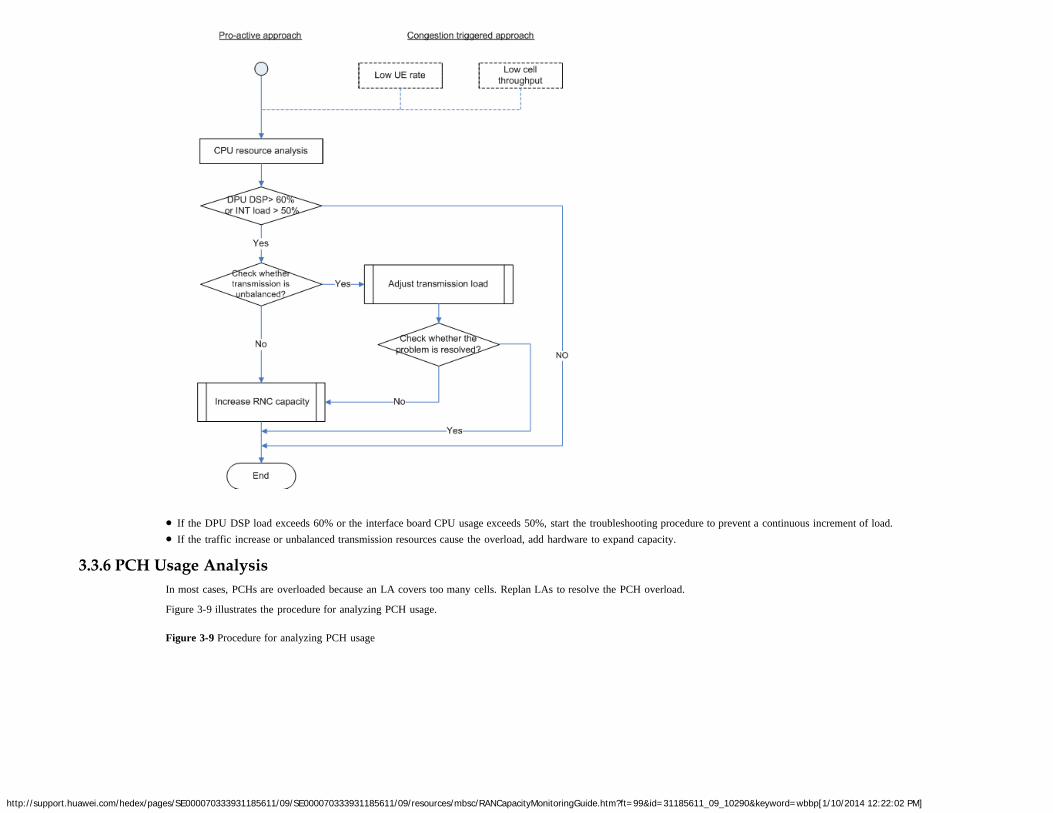
http://support.huawei.com/hedex/pages/SE000070333931185611/09/SE000070333931185611/09/resources/mbsc/RANCapacityMonitoringGuide.htm?ft=99&id=31185611_09_10290&keyword=wbbp[1/10/2014 12:22:02 PM]
If the DPU DSP load exceeds 60% or the interface board CPU usage exceeds 50%, start the troubleshooting procedure to prevent a continuous increment of load.If the traffic increase or unbalanced transmission resources cause the overload, add hardware to expand capacity.
3.3.6 PCH Usage AnalysisIn most cases, PCHs are overloaded because an LA covers too many cells. Replan LAs to resolve the PCH overload.
Figure 3-9 illustrates the procedure for analyzing PCH usage.
Figure 3-9 Procedure for analyzing PCH usage
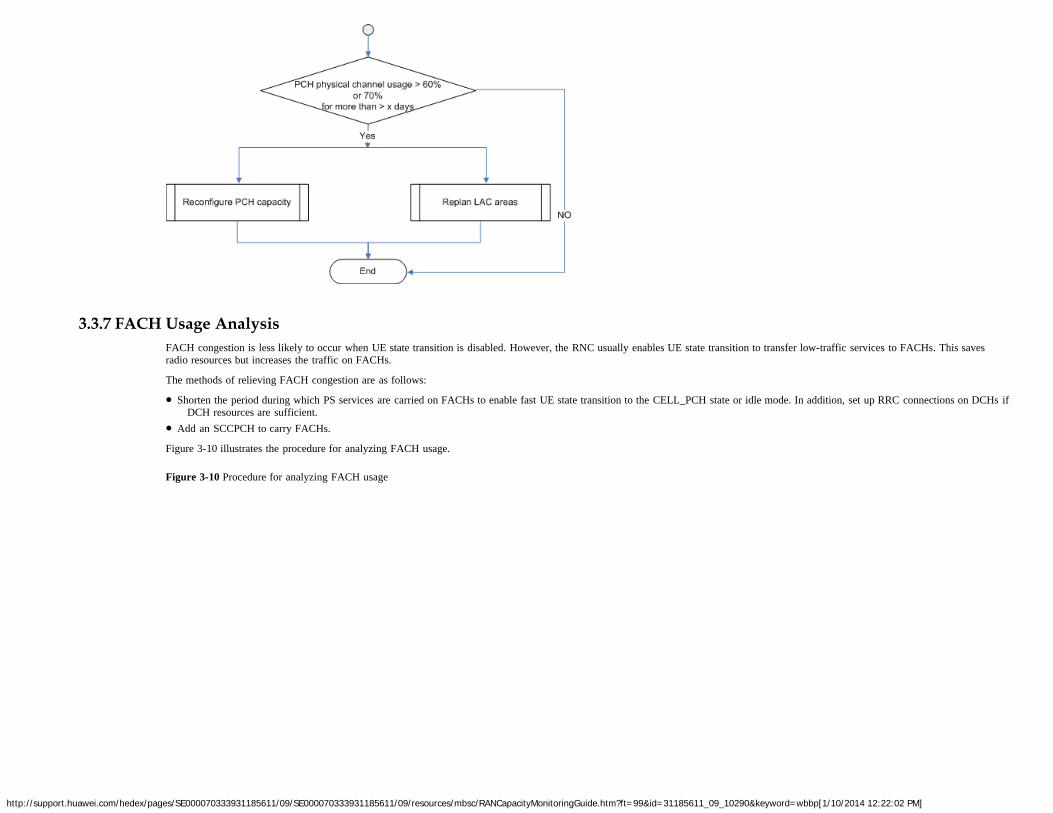
http://support.huawei.com/hedex/pages/SE000070333931185611/09/SE000070333931185611/09/resources/mbsc/RANCapacityMonitoringGuide.htm?ft=99&id=31185611_09_10290&keyword=wbbp[1/10/2014 12:22:02 PM]
3.3.7 FACH Usage AnalysisFACH congestion is less likely to occur when UE state transition is disabled. However, the RNC usually enables UE state transition to transfer low-traffic services to FACHs. This savesradio resources but increases the traffic on FACHs.
The methods of relieving FACH congestion are as follows:
Shorten the period during which PS services are carried on FACHs to enable fast UE state transition to the CELL_PCH state or idle mode. In addition, set up RRC connections on DCHs ifDCH resources are sufficient.
Add an SCCPCH to carry FACHs.
Figure 3-10 illustrates the procedure for analyzing FACH usage.
Figure 3-10 Procedure for analyzing FACH usage
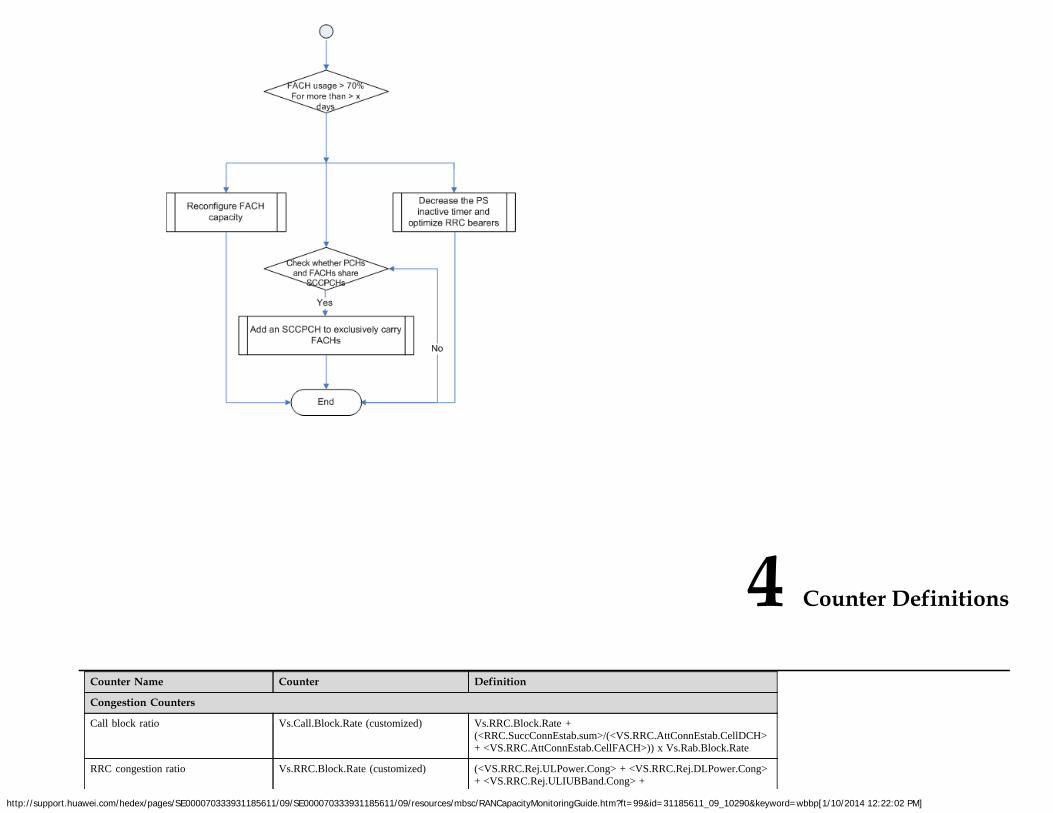
http://support.huawei.com/hedex/pages/SE000070333931185611/09/SE000070333931185611/09/resources/mbsc/RANCapacityMonitoringGuide.htm?ft=99&id=31185611_09_10290&keyword=wbbp[1/10/2014 12:22:02 PM]
4 Counter Definitions
Counter Name Counter Definition
Congestion Counters
Call block ratio Vs.Call.Block.Rate (customized) Vs.RRC.Block.Rate +(<RRC.SuccConnEstab.sum>/(<VS.RRC.AttConnEstab.CellDCH>+ <VS.RRC.AttConnEstab.CellFACH>)) x Vs.Rab.Block.Rate
RRC congestion ratio Vs.RRC.Block.Rate (customized) (<VS.RRC.Rej.ULPower.Cong> + <VS.RRC.Rej.DLPower.Cong>+ <VS.RRC.Rej.ULIUBBand.Cong> +
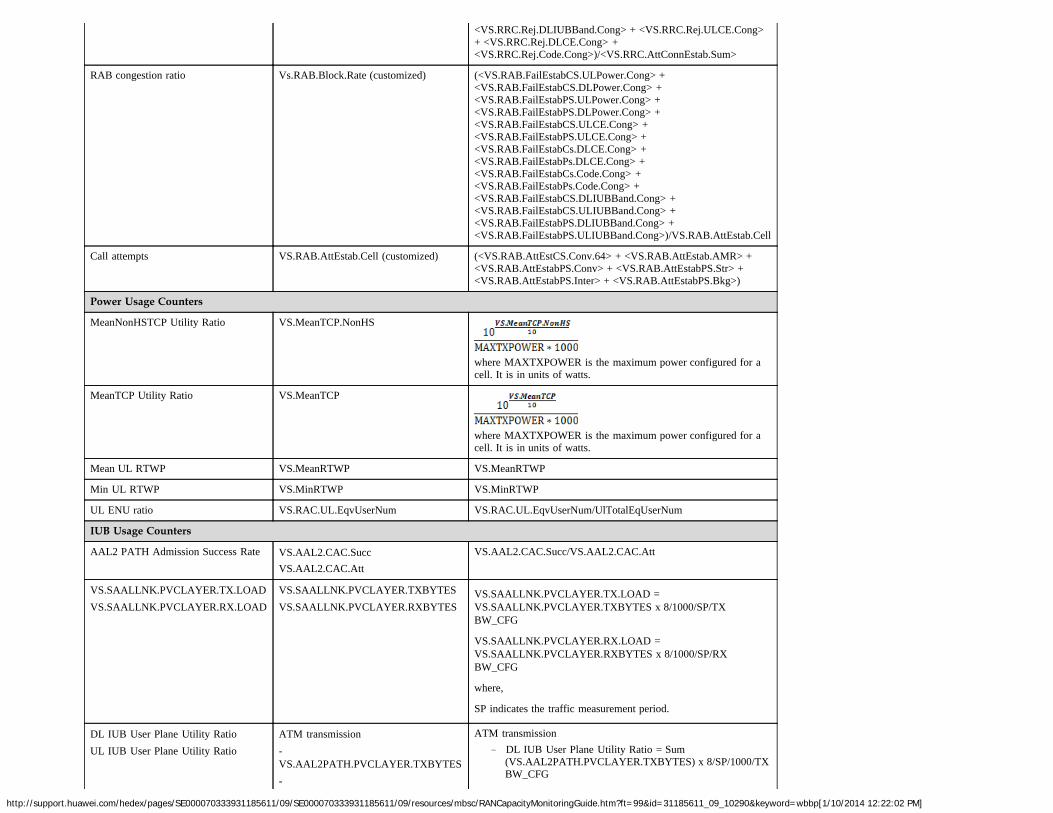
http://support.huawei.com/hedex/pages/SE000070333931185611/09/SE000070333931185611/09/resources/mbsc/RANCapacityMonitoringGuide.htm?ft=99&id=31185611_09_10290&keyword=wbbp[1/10/2014 12:22:02 PM]
<VS.RRC.Rej.DLIUBBand.Cong> + <VS.RRC.Rej.ULCE.Cong>+ <VS.RRC.Rej.DLCE.Cong> +<VS.RRC.Rej.Code.Cong>)/<VS.RRC.AttConnEstab.Sum>
RAB congestion ratio Vs.RAB.Block.Rate (customized) (<VS.RAB.FailEstabCS.ULPower.Cong> +<VS.RAB.FailEstabCS.DLPower.Cong> +<VS.RAB.FailEstabPS.ULPower.Cong> +<VS.RAB.FailEstabPS.DLPower.Cong> +<VS.RAB.FailEstabCS.ULCE.Cong> +<VS.RAB.FailEstabPS.ULCE.Cong> +<VS.RAB.FailEstabCs.DLCE.Cong> +<VS.RAB.FailEstabPs.DLCE.Cong> +<VS.RAB.FailEstabCs.Code.Cong> +<VS.RAB.FailEstabPs.Code.Cong> +<VS.RAB.FailEstabCS.DLIUBBand.Cong> +<VS.RAB.FailEstabCS.ULIUBBand.Cong> +<VS.RAB.FailEstabPS.DLIUBBand.Cong> +<VS.RAB.FailEstabPS.ULIUBBand.Cong>)/VS.RAB.AttEstab.Cell
Call attempts VS.RAB.AttEstab.Cell (customized) (<VS.RAB.AttEstCS.Conv.64> + <VS.RAB.AttEstab.AMR> +<VS.RAB.AttEstabPS.Conv> + <VS.RAB.AttEstabPS.Str> +<VS.RAB.AttEstabPS.Inter> + <VS.RAB.AttEstabPS.Bkg>)
Power Usage Counters
MeanNonHSTCP Utility Ratio VS.MeanTCP.NonHS
where MAXTXPOWER is the maximum power configured for acell. It is in units of watts.
MeanTCP Utility Ratio VS.MeanTCP
where MAXTXPOWER is the maximum power configured for acell. It is in units of watts.
Mean UL RTWP VS.MeanRTWP VS.MeanRTWP
Min UL RTWP VS.MinRTWP VS.MinRTWP
UL ENU ratio VS.RAC.UL.EqvUserNum VS.RAC.UL.EqvUserNum/UlTotalEqUserNum
IUB Usage Counters
AAL2 PATH Admission Success Rate VS.AAL2.CAC.SuccVS.AAL2.CAC.Att
VS.AAL2.CAC.Succ/VS.AAL2.CAC.Att
VS.SAALLNK.PVCLAYER.TX.LOADVS.SAALLNK.PVCLAYER.RX.LOAD
VS.SAALLNK.PVCLAYER.TXBYTESVS.SAALLNK.PVCLAYER.RXBYTES
VS.SAALLNK.PVCLAYER.TX.LOAD =VS.SAALLNK.PVCLAYER.TXBYTES x 8/1000/SP/TXBW_CFG
VS.SAALLNK.PVCLAYER.RX.LOAD =VS.SAALLNK.PVCLAYER.RXBYTES x 8/1000/SP/RXBW_CFG
where,
SP indicates the traffic measurement period.
DL IUB User Plane Utility RatioUL IUB User Plane Utility Ratio
ATM transmission-VS.AAL2PATH.PVCLAYER.TXBYTES-
ATM transmission− DL IUB User Plane Utility Ratio = Sum
(VS.AAL2PATH.PVCLAYER.TXBYTES) x 8/SP/1000/TXBW_CFG
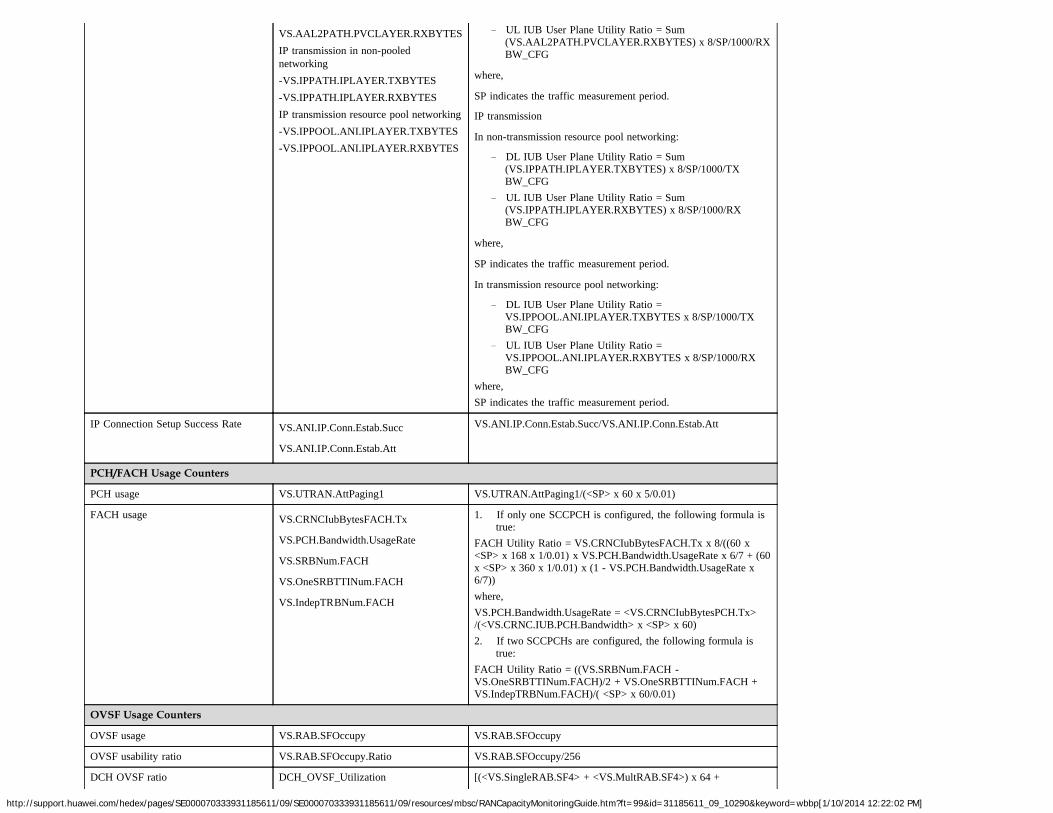
http://support.huawei.com/hedex/pages/SE000070333931185611/09/SE000070333931185611/09/resources/mbsc/RANCapacityMonitoringGuide.htm?ft=99&id=31185611_09_10290&keyword=wbbp[1/10/2014 12:22:02 PM]
VS.AAL2PATH.PVCLAYER.RXBYTESIP transmission in non-poolednetworking-VS.IPPATH.IPLAYER.TXBYTES-VS.IPPATH.IPLAYER.RXBYTESIP transmission resource pool networking-VS.IPPOOL.ANI.IPLAYER.TXBYTES-VS.IPPOOL.ANI.IPLAYER.RXBYTES
− UL IUB User Plane Utility Ratio = Sum(VS.AAL2PATH.PVCLAYER.RXBYTES) x 8/SP/1000/RXBW_CFG
where,
SP indicates the traffic measurement period.
IP transmission
In non-transmission resource pool networking:
− DL IUB User Plane Utility Ratio = Sum(VS.IPPATH.IPLAYER.TXBYTES) x 8/SP/1000/TXBW_CFG
− UL IUB User Plane Utility Ratio = Sum(VS.IPPATH.IPLAYER.RXBYTES) x 8/SP/1000/RXBW_CFG
where,
SP indicates the traffic measurement period.
In transmission resource pool networking:
− DL IUB User Plane Utility Ratio =VS.IPPOOL.ANI.IPLAYER.TXBYTES x 8/SP/1000/TXBW_CFG
− UL IUB User Plane Utility Ratio =VS.IPPOOL.ANI.IPLAYER.RXBYTES x 8/SP/1000/RXBW_CFG
where,SP indicates the traffic measurement period.
IP Connection Setup Success Rate VS.ANI.IP.Conn.Estab.Succ
VS.ANI.IP.Conn.Estab.Att
VS.ANI.IP.Conn.Estab.Succ/VS.ANI.IP.Conn.Estab.Att
PCH/FACH Usage Counters
PCH usage VS.UTRAN.AttPaging1 VS.UTRAN.AttPaging1/(<SP> x 60 x 5/0.01)
FACH usage VS.CRNCIubBytesFACH.Tx
VS.PCH.Bandwidth.UsageRate
VS.SRBNum.FACH
VS.OneSRBTTINum.FACH
VS.IndepTRBNum.FACH
1. If only one SCCPCH is configured, the following formula istrue:
FACH Utility Ratio = VS.CRNCIubBytesFACH.Tx x 8/((60 x<SP> x 168 x 1/0.01) x VS.PCH.Bandwidth.UsageRate x 6/7 + (60x <SP> x 360 x 1/0.01) x (1 - VS.PCH.Bandwidth.UsageRate x6/7))where,VS.PCH.Bandwidth.UsageRate = <VS.CRNCIubBytesPCH.Tx>/(<VS.CRNC.IUB.PCH.Bandwidth> x <SP> x 60)2. If two SCCPCHs are configured, the following formula is
true:FACH Utility Ratio = ((VS.SRBNum.FACH -VS.OneSRBTTINum.FACH)/2 + VS.OneSRBTTINum.FACH +VS.IndepTRBNum.FACH)/( <SP> x 60/0.01)
OVSF Usage Counters
OVSF usage VS.RAB.SFOccupy VS.RAB.SFOccupy
OVSF usability ratio VS.RAB.SFOccupy.Ratio VS.RAB.SFOccupy/256
DCH OVSF ratio DCH_OVSF_Utilization [(<VS.SingleRAB.SF4> + <VS.MultRAB.SF4>) x 64 +
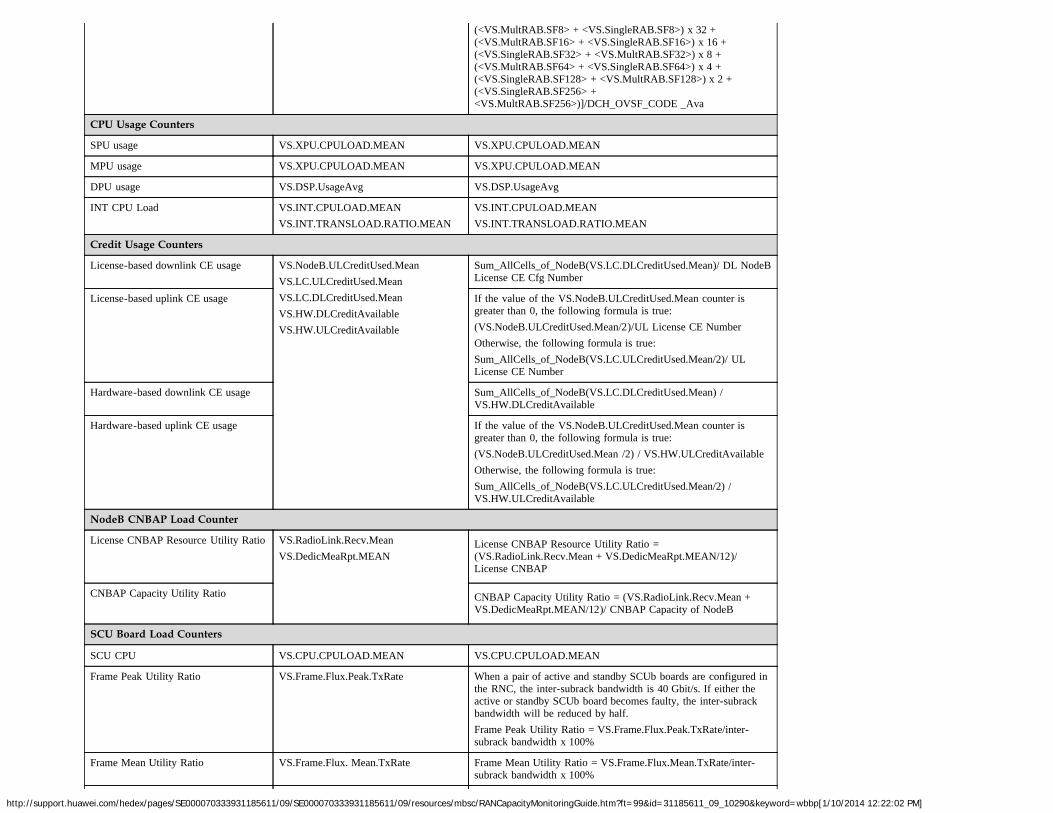
http://support.huawei.com/hedex/pages/SE000070333931185611/09/SE000070333931185611/09/resources/mbsc/RANCapacityMonitoringGuide.htm?ft=99&id=31185611_09_10290&keyword=wbbp[1/10/2014 12:22:02 PM]
(<VS.MultRAB.SF8> + <VS.SingleRAB.SF8>) x 32 +(<VS.MultRAB.SF16> + <VS.SingleRAB.SF16>) x 16 +(<VS.SingleRAB.SF32> + <VS.MultRAB.SF32>) x 8 +(<VS.MultRAB.SF64> + <VS.SingleRAB.SF64>) x 4 +(<VS.SingleRAB.SF128> + <VS.MultRAB.SF128>) x 2 +(<VS.SingleRAB.SF256> +<VS.MultRAB.SF256>)]/DCH_OVSF_CODE _Ava
CPU Usage Counters
SPU usage VS.XPU.CPULOAD.MEAN VS.XPU.CPULOAD.MEAN
MPU usage VS.XPU.CPULOAD.MEAN VS.XPU.CPULOAD.MEAN
DPU usage VS.DSP.UsageAvg VS.DSP.UsageAvg
INT CPU Load VS.INT.CPULOAD.MEANVS.INT.TRANSLOAD.RATIO.MEAN
VS.INT.CPULOAD.MEANVS.INT.TRANSLOAD.RATIO.MEAN
Credit Usage Counters
License-based downlink CE usage VS.NodeB.ULCreditUsed.MeanVS.LC.ULCreditUsed.MeanVS.LC.DLCreditUsed.MeanVS.HW.DLCreditAvailableVS.HW.ULCreditAvailable
Sum_AllCells_of_NodeB(VS.LC.DLCreditUsed.Mean)/ DL NodeBLicense CE Cfg Number
License-based uplink CE usage If the value of the VS.NodeB.ULCreditUsed.Mean counter isgreater than 0, the following formula is true:(VS.NodeB.ULCreditUsed.Mean/2)/UL License CE NumberOtherwise, the following formula is true:Sum_AllCells_of_NodeB(VS.LC.ULCreditUsed.Mean/2)/ ULLicense CE Number
Hardware-based downlink CE usage Sum_AllCells_of_NodeB(VS.LC.DLCreditUsed.Mean) /VS.HW.DLCreditAvailable
Hardware-based uplink CE usage If the value of the VS.NodeB.ULCreditUsed.Mean counter isgreater than 0, the following formula is true:(VS.NodeB.ULCreditUsed.Mean /2) / VS.HW.ULCreditAvailableOtherwise, the following formula is true:Sum_AllCells_of_NodeB(VS.LC.ULCreditUsed.Mean/2) /VS.HW.ULCreditAvailable
NodeB CNBAP Load Counter
License CNBAP Resource Utility Ratio VS.RadioLink.Recv.MeanVS.DedicMeaRpt.MEAN
License CNBAP Resource Utility Ratio =(VS.RadioLink.Recv.Mean + VS.DedicMeaRpt.MEAN/12)/License CNBAP
CNBAP Capacity Utility Ratio CNBAP Capacity Utility Ratio = (VS.RadioLink.Recv.Mean +VS.DedicMeaRpt.MEAN/12)/ CNBAP Capacity of NodeB
SCU Board Load Counters
SCU CPU VS.CPU.CPULOAD.MEAN VS.CPU.CPULOAD.MEAN
Frame Peak Utility Ratio VS.Frame.Flux.Peak.TxRate When a pair of active and standby SCUb boards are configured inthe RNC, the inter-subrack bandwidth is 40 Gbit/s. If either theactive or standby SCUb board becomes faulty, the inter-subrackbandwidth will be reduced by half.Frame Peak Utility Ratio = VS.Frame.Flux.Peak.TxRate/inter-subrack bandwidth x 100%
Frame Mean Utility Ratio VS.Frame.Flux. Mean.TxRate Frame Mean Utility Ratio = VS.Frame.Flux.Mean.TxRate/inter-subrack bandwidth x 100%
http://support.huawei.com/hedex/pages/SE000070333931185611/09/SE000070333931185611/09/resources/mbsc/RANCapacityMonitoringGuide.htm?ft=99&id=31185611_09_10290&keyword=wbbp[1/10/2014 12:22:02 PM]
Very Poor Very Good
Your contact information:
All comments of the libAll Comments
Frame DropPackets Ratio VS.Frame.Flux.DropPacketsVS.Frame.Flux.TxPackets
Frame DropPackets Ratio=VS.Frame.Flux.DropPackets/VS.Frame.Flux.TxPackets x 100%
Thanks for your comments
Rating:
This document solved your problem: Yes No Just Browsing
Feedback:
Please provide your contact information for us to reach you quickly:
Contact person: Email: Tel: Modify/Refresh Contact Information
Recent Comments and Feedback

Welcome to login Huawei website
https://uniportal.huawei.com/...dex.huawei.com%3A8090%2Fhedex%2Fhdx.do%3Fdocid%3DSE0000703339%26id%3D31185611_09_10290%26lang%3Den[1/10/2014 12:23:45 PM]
Login
User ID
Password
Forgot Password Modify Password
Welcome to My Huawei
Registering for a free account gives you a number of
additional benefits, including access to additional valuable
information that you can browse or download, and much
more.
Copyright © Huawei Technologies Co., Ltd. 1998-2014. All rights reserved.
Fingerprint | 中 | Help
Welcome to login Huawei website
http://support.huawei.com/...UMTS%20Product%20Documentation&libVer=09&IA=&prodName=BSC6900%20UMTS&prodVersion=V900R014C00&SE=&TE=[1/10/2014 12:23:52 PM]
Login
User ID
Password
Forgot Password Modify Password
Welcome to My Huawei
Registering for a free account gives you a number of
additional benefits, including access to additional valuable
information that you can browse or download, and much
more.
Copyright © Huawei Technologies Co., Ltd. 1998-2014. All rights reserved.
Fingerprint | 中 | Help