BRITISH SKY BROADCASTING GROUP PLC -...
13
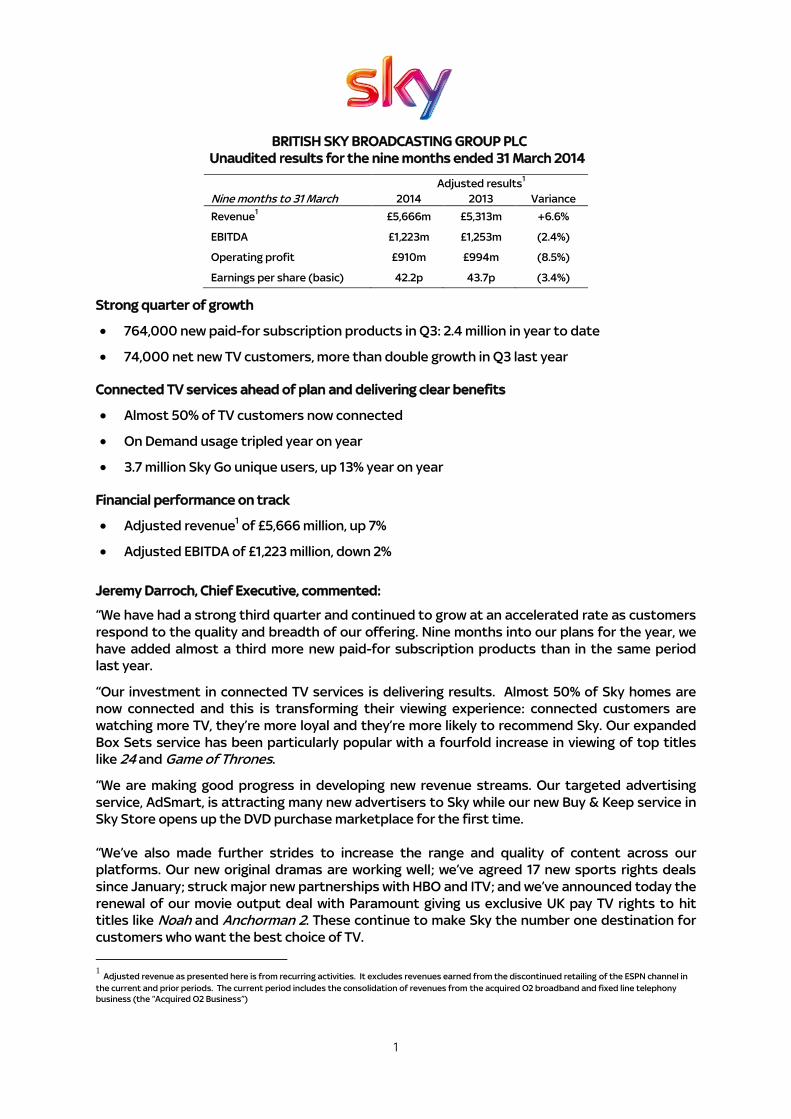
1 BRITISH SKY BROADCASTING GROUP PLC Unaudited results for the nine months ended 31 March 2014 Adjusted results 1 Nine months to 31 March 2014 2013 Variance Revenue 1 £5,666m £5,313m +6.6% EBITDA £1,223m £1,253m (2.4%) Operating profit £910m £994m (8.5%) Earnings per share (basic) 42.2p 43.7p (3.4%) Strong quarter of growth 764,000 new paid-for subscription products in Q3: 2.4 million in year to date 74,000 net new TV customers, more than double growth in Q3 last year Connected TV services ahead of plan and delivering clear benefits Almost 50% of TV customers now connected On Demand usage tripled year on year 3.7 million Sky Go unique users, up 13% year on year Financial performance on track Adjusted revenue 1 of £5,666 million, up 7% Adjusted EBITDA of £1,223 million, down 2% Jeremy Darroch, Chief Executive, commented: “We have had a strong third quarter and continued to grow at an accelerated rate as customers respond to the quality and breadth of our offering. Nine months into our plans for the year, we have added almost a third more new paid-for subscription products than in the same period last year. “Our investment in connected TV services is delivering results. Almost 50% of Sky homes are now connected and this is transforming their viewing experience: connected customers are watching more TV, they’re more loyal and they’re more likely to recommend Sky. Our expanded Box Sets service has been particularly popular with a fourfold increase in viewing of top titles like 24 and Game of Thrones. “We are making good progress in developing new revenue streams. Our targeted advertising service, AdSmart, is attracting many new advertisers to Sky while our new Buy & Keep service in Sky Store opens up the DVD purchase marketplace for the first time. “We’ve also made further strides to increase the range and quality of content across our platforms. Our new original dramas are working well; we’ve agreed 17 new sports rights deals since January; struck major new partnerships with HBO and ITV; and we’ve announced today the renewal of our movie output deal with Paramount giving us exclusive UK pay TV rights to hit titles like Noah and Anchorman 2. These continue to make Sky the number one destination for customers who want the best choice of TV. 1 Adjusted revenue as presented here is from recurring activities. It excludes revenues earned from the discontinued retailing of the ESPN channel in the current and prior periods. The current period includes the consolidation of revenues from the acquired O2 broadband and fixed line telephony business (the “Acquired O2 Business”)
Transcript of BRITISH SKY BROADCASTING GROUP PLC -...
1
BRITISH SKY BROADCASTING GROUP PLC
Unaudited results for the nine months ended 31 March 2014
Adjusted results1
Nine months to 31 March 2014 2013 Variance
Revenue1 £5,666m £5,313m +6.6%
EBITDA £1,223m £1,253m (2.4%)
Operating profit £910m £994m (8.5%)
Earnings per share (basic) 42.2p 43.7p (3.4%)
Strong quarter of growth
764,000 new paid-for subscription products in Q3: 2.4 million in year to date
74,000 net new TV customers, more than double growth in Q3 last year
Connected TV services ahead of plan and delivering clear benefits
Almost 50% of TV customers now connected
On Demand usage tripled year on year
3.7 million Sky Go unique users, up 13% year on year
Financial performance on track
Adjusted revenue1 of £5,666 million, up 7%
Adjusted EBITDA of £1,223 million, down 2%
Jeremy Darroch, Chief Executive, commented:
“We have had a strong third quarter and continued to grow at an accelerated rate as customers
respond to the quality and breadth of our offering. Nine months into our plans for the year, we
have added almost a third more new paid-for subscription products than in the same period
last year.
“Our investment in connected TV services is delivering results. Almost 50% of Sky homes are
now connected and this is transforming their viewing experience: connected customers are
watching more TV, they’re more loyal and they’re more likely to recommend Sky. Our expanded
Box Sets service has been particularly popular with a fourfold increase in viewing of top titles
like 24 and Game of Thrones.
“We are making good progress in developing new revenue streams. Our targeted advertising
service, AdSmart, is attracting many new advertisers to Sky while our new Buy & Keep service in
Sky Store opens up the DVD purchase marketplace for the first time.
“We’ve also made further strides to increase the range and quality of content across our
platforms. Our new original dramas are working well; we’ve agreed 17 new sports rights deals
since January; struck major new partnerships with HBO and ITV; and we’ve announced today the
renewal of our movie output deal with Paramount giving us exclusive UK pay TV rights to hit
titles like Noah and Anchorman 2. These continue to make Sky the number one destination for
customers who want the best choice of TV.
1 Adjusted revenue as presented here is from recurring activities. It excludes revenues earned from the discontinued retailing of the ESPN channel in
the current and prior periods. The current period includes the consolidation of revenues from the acquired O2 broadband and fixed line telephony
business (the “Acquired O2 Business”)
2
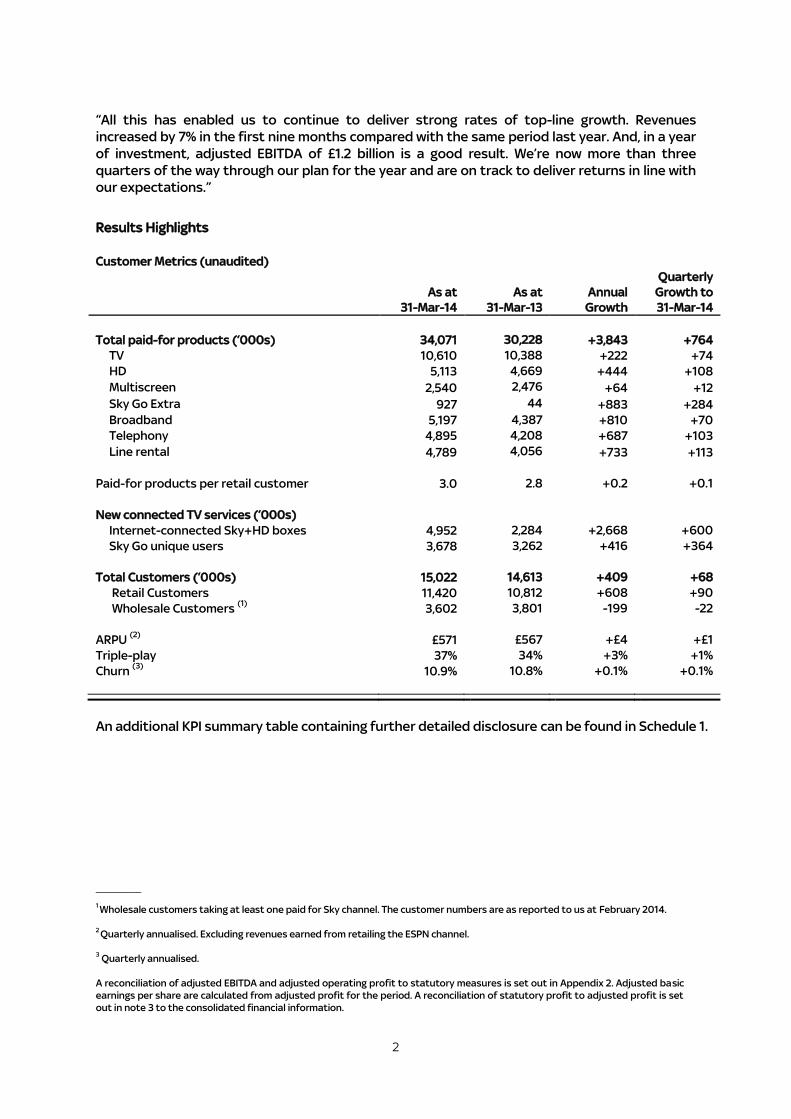
“All this has enabled us to continue to deliver strong rates of top-line growth. Revenues
increased by 7% in the first nine months compared with the same period last year. And, in a year
of investment, adjusted EBITDA of £1.2 billion is a good result. We’re now more than three
quarters of the way through our plan for the year and are on track to deliver returns in line with
our expectations.”
Results Highlights
Customer Metrics (unaudited)
As at
31-Mar-14
As at
31-Mar-13
Annual
Growth
Quarterly
Growth to
31-Mar-14
Total paid-for products (‘000s) 34,071 30,228 +3,843 +764
TV 10,610 10,388 +222 +74
HD 5,113 4,669 +444 +108
Multiscreen 2,540 2,476 +64 +12
Sky Go Extra 927 44 +883 +284
Broadband 5,197 4,387 +810 +70
Telephony 4,895 4,208 +687 +103
Line rental 4,789 4,056 +733 +113
Paid-for products per retail customer 3.0 2.8 +0.2 +0.1
New connected TV services (‘000s)
Internet-connected Sky+HD boxes 4,952 2,284 +2,668 +600
Sky Go unique users 3,678 3,262 +416 +364
Total Customers (‘000s) 15,022 14,613 +409 +68
Retail Customers 11,420 10,812 +608 +90
Wholesale Customers (1)
3,602 3,801 -199 -22
ARPU (2)
£571 £567 +£4 +£1
Triple-play 37% 34% +3% +1%
Churn (3)
10.9% 10.8% +0.1% +0.1%
An additional KPI summary table containing further detailed disclosure can be found in Schedule 1.
_________ 1 Wholesale customers taking at least one paid for Sky channel. The customer numbers are as reported to us at February 2014.
2
Quarterly annualised. Excluding revenues earned from retailing the ESPN channel.
3 Quarterly annualised.
A reconciliation of adjusted EBITDA and adjusted operating profit to statutory measures is set out in Appendix 2. Adjusted basic
earnings per share are calculated from adjusted profit for the period. A reconciliation of statutory profit to adjusted profit is set
out in note 3 to the consolidated financial information.
3
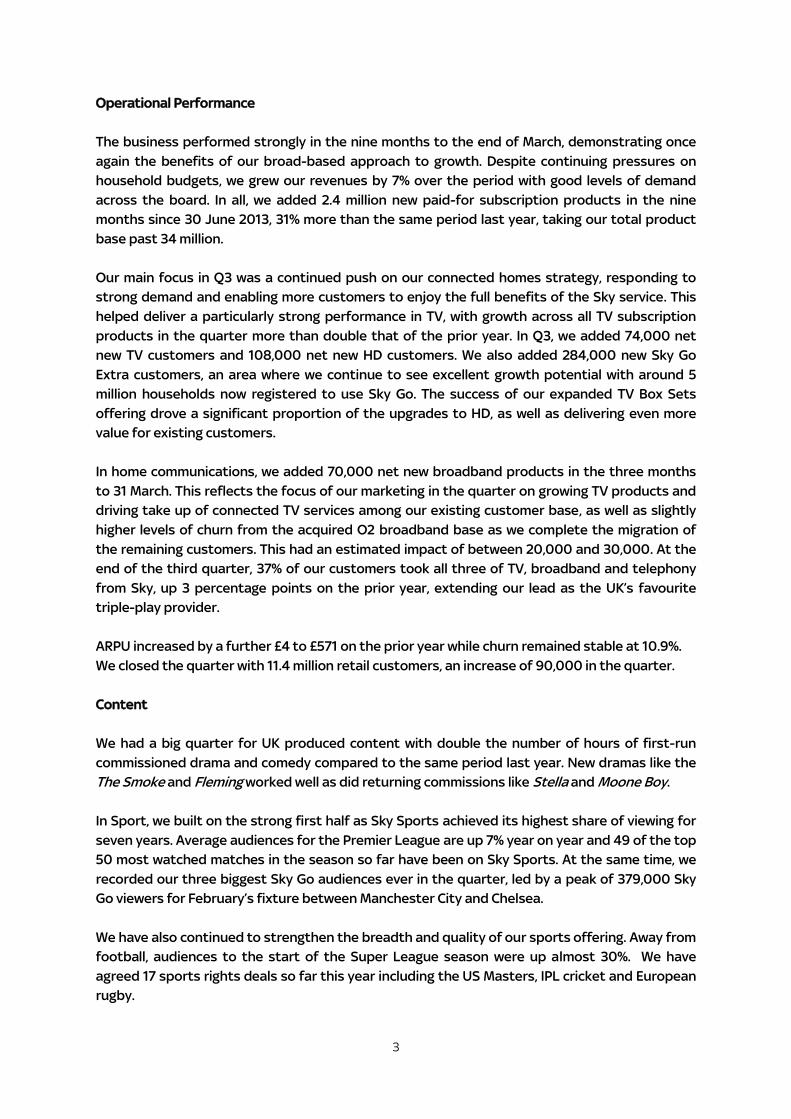
Operational Performance
The business performed strongly in the nine months to the end of March, demonstrating once
again the benefits of our broad-based approach to growth. Despite continuing pressures on
household budgets, we grew our revenues by 7% over the period with good levels of demand
across the board. In all, we added 2.4 million new paid-for subscription products in the nine
months since 30 June 2013, 31% more than the same period last year, taking our total product
base past 34 million.
Our main focus in Q3 was a continued push on our connected homes strategy, responding to
strong demand and enabling more customers to enjoy the full benefits of the Sky service. This
helped deliver a particularly strong performance in TV, with growth across all TV subscription
products in the quarter more than double that of the prior year. In Q3, we added 74,000 net
new TV customers and 108,000 net new HD customers. We also added 284,000 new Sky Go
Extra customers, an area where we continue to see excellent growth potential with around 5
million households now registered to use Sky Go. The success of our expanded TV Box Sets
offering drove a significant proportion of the upgrades to HD, as well as delivering even more
value for existing customers.
In home communications, we added 70,000 net new broadband products in the three months
to 31 March. This reflects the focus of our marketing in the quarter on growing TV products and
driving take up of connected TV services among our existing customer base, as well as slightly
higher levels of churn from the acquired O2 broadband base as we complete the migration of
the remaining customers. This had an estimated impact of between 20,000 and 30,000. At the
end of the third quarter, 37% of our customers took all three of TV, broadband and telephony
from Sky, up 3 percentage points on the prior year, extending our lead as the UK’s favourite
triple-play provider.
ARPU increased by a further £4 to £571 on the prior year while churn remained stable at 10.9%.
We closed the quarter with 11.4 million retail customers, an increase of 90,000 in the quarter.
Content
We had a big quarter for UK produced content with double the number of hours of first-run
commissioned drama and comedy compared to the same period last year. New dramas like the
The Smoke and Fleming worked well as did returning commissions like Stella and Moone Boy.
In Sport, we built on the strong first half as Sky Sports achieved its highest share of viewing for
seven years. Average audiences for the Premier League are up 7% year on year and 49 of the top
50 most watched matches in the season so far have been on Sky Sports. At the same time, we
recorded our three biggest Sky Go audiences ever in the quarter, led by a peak of 379,000 Sky
Go viewers for February’s fixture between Manchester City and Chelsea.
We have also continued to strengthen the breadth and quality of our sports offering. Away from
football, audiences to the start of the Super League season were up almost 30%. We have
agreed 17 sports rights deals so far this year including the US Masters, IPL cricket and European
rugby.
4
In addition, we have announced today the renewal of our movie output deal with Paramount
giving us exclusive rights across all platforms to blockbusters like Noah and Anchorman 2. This
means we've secured new deals with five of the six major studios in the last two years. We have
also signed a new deal with Fox to ensure that Sky1 remains the exclusive home for first-run
Simpsons through to 2016.
Connected TV Services
We’ve made further strong progress with our investment to drive take up of connected TV
services. We connected a further 600,000 Sky+HD boxes in the quarter to take the connected
base to 5 million, nearly half of all Sky TV homes. We also added more On Demand content, with
a particular focus on building our Box Sets offering where we’ve more than doubled the hours of
quality titles available in the past nine months, including hit series such as Sopranos and 24.
As a result, consumption of On Demand content continued to grow rapidly: weekly downloads in
the third quarter were three times higher than a year ago, equating to each connected
household downloading on average three pieces of content a week. On Demand viewing now
accounts for more than 5% of viewing in connected Sky homes. To put this in context, this
means that On Demand is equivalent to the third most popular linear channel in those homes. A
surge in demand for our expanded Box Sets offering accounted for much of this increase – in
March, Game of Thrones Series 1-3 became our most downloaded box set ever.
We took another big step forward in our connected TV offering in March with the launch of a
new home page for our electronic programming guide. This showcases the full range of
programming available to customers up front for the first time, including On Demand content
such as Sky Store, Box Sets and Catch Up.
The growth in reach and usage of our connected box platform is enabling us to open up
additional sources of revenue growth with the roll out of new services. Customer rentals via Sky
Store in the third quarter were up over 100% versus the prior year benefitting from greater
awareness of the service, repeat usage from existing customers and availability of strong titles
such as Captain Phillips and Gravity. We have built on the early success of Sky Store rentals with
the launch in April of our new 'Buy & Keep' service which targets the much larger DVD purchase
marketplace.
A second new service, Sky AdSmart, launched in January. This is improving effectiveness for our
existing advertiser clients and attracting new advertisers to TV by giving them the ability, for
the first time, to run targeted campaigns across Sky and third party channels. To date, of the
100 advertisers that have run AdSmart campaigns, half are new to Sky and around 20% had
never previously advertised on TV.
We have also struck a new deal with Sony to make Sky Go and NOW TV available on
Playstation®4 (PS4) from this summer.
5
Financial performance
We delivered a good financial performance for the nine months to 31 March 2014. Adjusted
revenue growth was 7% and this, together with continued discipline on costs, allowed us to
deliver adjusted EBITDA of £1,223 million, down only 2.4%, despite our connected services
investment and the uplift in Premier League amortisation. Adjusted basic earnings per share
were 42.2 pence, in line with our expectations. Unless otherwise stated, all figures and growth
rates below exclude adjusting items.
Revenue increased by 7% to £5,666 million (2013: £5,313 million) with continued strong growth in
both our retail and commercial businesses.
Retail subscription revenue grew by 7% to £4,655 million (2013: £4,354 million) after adjusting
for £6 million of ESPN revenue (2013: £68 million), reflecting the continued product and
customer growth, price rises and strong growth in transactional revenues.
Our commercial businesses performed well. Advertising revenue was up 8% to £354 million
(2013: £327 million) through a combination of market growth, share gains through our
consolidation of two small houses in this financial year and a contribution for the first time of
AdSmart. The one area of slower growth was wholesale subscription revenue which increased by
2% to £301 million (2013: £295 million) as renewed carriage agreements and price increases were
partially offset by lower customer volumes on third party platforms.
Other revenue increased by 10% to £295 million (2013: £269 million). A continued strong
performance from Sky Bet was partially offset by the absence of one time sublicence revenue of
£8 million from England away qualifiers included in the prior period.
Growth in the cost base - held in aggregate to just 5% excluding the £173 million one-time step
up in Premier League amortisation - was driven by the enhanced rate of growth in product and
customer volumes, the first time consolidation of the acquired O2 business and the investment
in our connected home strategy.
We were pleased with the progress we continue to make on operating efficiency; both in our
volume facing activities, typically reported within subscriber management and supply chain
costs; and in our overhead and administration costs with each of these cost categories for the
period growing at below the rate of revenue.
Depreciation and amortisation was up 21% to £313 million (2013: £259 million) due to the
integration of the Acquired O2 Business, depreciable kit installed in more exchanges, network
upgrades carried out across the year and a higher fixed asset base as we begin to depreciate
the development costs of recently launched products such as NOW TV and AdSmart.
Adjusted EBITDA of £1,223 million and operating profit for the period of £910 million were both in
line with our expectations. After tax of £183 million and interest of £94 million – reflecting a full
nine months of interest for the first time on the November 2022 bond – earnings per share were
42.2 pence.
Net debt at 31 March 2014 was £1,543 million. The number of votable shares in issue at 31 March
2014 was 1,574 million.
6
CORPORATE
Pay TV Case
In February, the Court of Appeal (CoA) upheld BT's appeal against the Competition Appeal
Tribunal’s (CAT) August 2012 judgment in relation to the imposition by Ofcom of Wholesale
Must Offer (WMO) obligations on Sky in respect of Sky Sports 1 and 2.
The CoA remitted the case back to the CAT for further consideration.
Ofcom review of WMO obligations
On 16 April, Ofcom announced a review of the WMO obligations imposed on Sky in relation to Sky
Sports 1 and 2. Ofcom has noted that there have been a number of sector developments since
2010, which will need to be considered as part of its review. As yet Ofcom has not published any
further details of its review.
7
Enquiries:
Analysts/Investors:
Edward Steel Tel: 020 7032 2093
Lang Messer Tel: 020 7032 2657
E-mail: [email protected]
Press:
Alice Macandrew Tel: 020 7032 4256
Robin Tozer Tel: 020 7032 0620
E-mail: [email protected]
A conference call for UK and European analysts and investors will be held at 8.30 a.m. (BST)
today. Participants must register by contacting Felicity Marshall on +44 20 7251 3801 or at
There will be a separate conference call for US analysts and investors at 10.00 a.m. (EDT) today.
Details of this call have been sent to US institutions and can be obtained from Dana Diver at
Taylor Rafferty on +1 212 889 4350. Alternatively you may register online at: http://invite.taylor-
rafferty.com/_bskyb/2013Q2CC/Default.htm.
The live conference calls of the UK and US calls will be available to analysts and investors via the
BSkyB website at http://www.sky.com/corporate. Replays will be subsequently available.
8
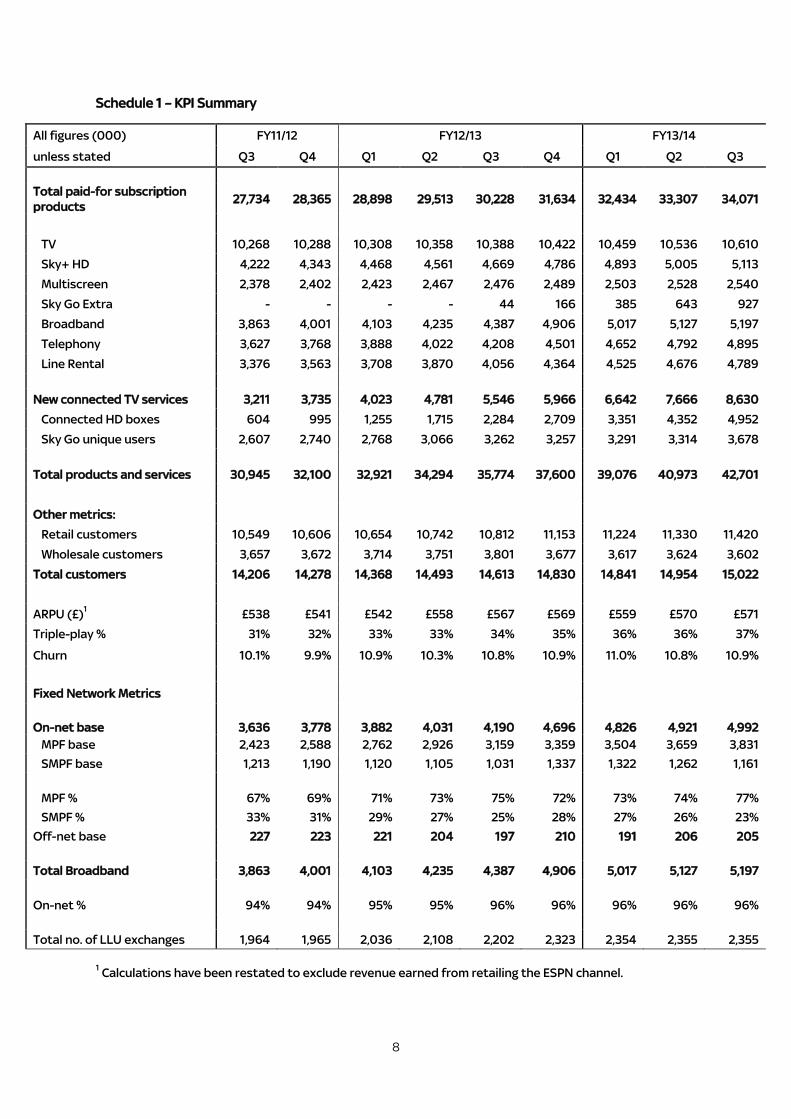
Schedule 1 – KPI Summary
All figures (000) FY11/12 FY12/13 FY13/14
unless stated Q3 Q4 Q1 Q2 Q3 Q4 Q1 Q2 Q3
Total paid-for subscription
products 27,734 28,365 28,898 29,513 30,228 31,634 32,434 33,307 34,071
TV 10,268 10,288 10,308 10,358 10,388 10,422 10,459 10,536 10,610
Sky+ HD 4,222 4,343 4,468 4,561 4,669 4,786 4,893 5,005 5,113
Multiscreen 2,378 2,402 2,423 2,467 2,476 2,489 2,503 2,528 2,540
Sky Go Extra - - - - 44 166 385 643 927
Broadband 3,863 4,001 4,103 4,235 4,387 4,906 5,017 5,127 5,197
Telephony 3,627 3,768 3,888 4,022 4,208 4,501 4,652 4,792 4,895
Line Rental 3,376 3,563 3,708 3,870 4,056 4,364 4,525 4,676 4,789
New connected TV services 3,211 3,735 4,023 4,781 5,546 5,966 6,642 7,666 8,630
Connected HD boxes 604 995 1,255 1,715 2,284 2,709 3,351 4,352 4,952
Sky Go unique users 2,607 2,740 2,768 3,066 3,262 3,257 3,291 3,314 3,678
Total products and services 30,945 32,100 32,921 34,294 35,774 37,600 39,076 40,973 42,701
Other metrics:
Retail customers 10,549 10,606 10,654 10,742 10,812 11,153 11,224 11,330 11,420
Wholesale customers 3,657 3,672 3,714 3,751 3,801 3,677 3,617 3,624 3,602
Total customers 14,206 14,278 14,368 14,493 14,613 14,830 14,841 14,954 15,022
ARPU (£)1 £538 £541 £542 £558 £567 £569 £559 £570 £571
Triple-play % 31% 32% 33% 33% 34% 35% 36% 36% 37%
Churn 10.1% 9.9% 10.9% 10.3% 10.8% 10.9% 11.0% 10.8% 10.9%
Fixed Network Metrics
On-net base 3,636 3,778 3,882 4,031 4,190 4,696
4,826 4,921 4,992
MPF base 2,423 2,588 2,762 2,926 3,159 3,359 3,504 3,659 3,831
SMPF base 1,213 1,190 1,120 1,105 1,031 1,337 1,322 1,262 1,161
MPF % 67% 69% 71% 73% 75% 72% 73% 74% 77%
SMPF % 33% 31% 29% 27% 25% 28% 27% 26% 23%
Off-net base 227 223 221 204 197 210 191 206 205
Total Broadband 3,863 4,001 4,103 4,235 4,387 4,906 5,017 5,127 5,197
On-net % 94% 94% 95% 95% 96% 96% 96% 96% 96%
Total no. of LLU exchanges 1,964 1,965 2,036 2,108 2,202 2,323 2,354 2,355 2,355
1 Calculations have been restated to exclude revenue earned from retailing the ESPN channel.
9
Use of measures not defined under IFRS
This press release contains certain information on the Group’s financial position, results and cash flows that have been derived from
measures calculated in accordance with IFRS. This information should not be read in isolation from the related IFRS measures.
Forward looking statements
This document contains certain forward looking statements with respect to the Group’s financial condition, results of operations
and business, and our strategy, plans and objectives for the Group. These statements include, without limitation, those that express
forecasts, expectations and projections, such as forecasts, expectations and projections in relation to new products and services,
the potential for growth of free-to-air and pay television, fixed line telephony, broadband and bandwidth requirements, advertising
growth, DTH and OTT customer growth, Multiscreen, On Demand, NOW TV, Sky Go, Sky Go Extra, Sky+, Sky+HD and other services
penetration, revenue, administration costs and other costs, advertising growth, churn, profit, cash flow, products and our
broadband network footprint, content, wholesale, marketing and capital expenditure and proposals for returning capital to
shareholders.
Although the Company believes that the expectations reflected in such forward looking statements are reasonable, these
statements are not guarantees of future performance and are subject to risks, uncertainties and other factors, some of which are
beyond our control, are difficult to predict and could cause actual results to differ materially from those expressed or implied or
forecast in the forward looking statements. Information on the significant risks and uncertainties are described in the “Principal
risks and uncertainties” section of Sky’s Annual Report for the full year ended 30 June 2013 (as updated in Sky’s results for the six
months ended 31 December 2013). Copies of the Annual Report and 31 December 2013 results are available from the British Sky
Broadcasting Group plc web page at www.sky.com/corporate.
All forward looking statements in this document are based on information known to the Group on the date hereof. The Group
undertakes no obligation publicly to update or revise any forward looking statements, whether as a result of new information,
future events or otherwise.
Glossary of Terms
A glossary of terms is included within the Annual Report and on our corporate investor relations web page at
http://corporate.sky.com/investors/glossary. Copies of the Annual Report are available from the British Sky Broadcasting Group plc
web page at www.sky.com/corporate and in hard copy from the Company Secretary, British Sky Broadcasting Group plc, Grant Way,
Isleworth, Middlesex TW7 5QD.
10
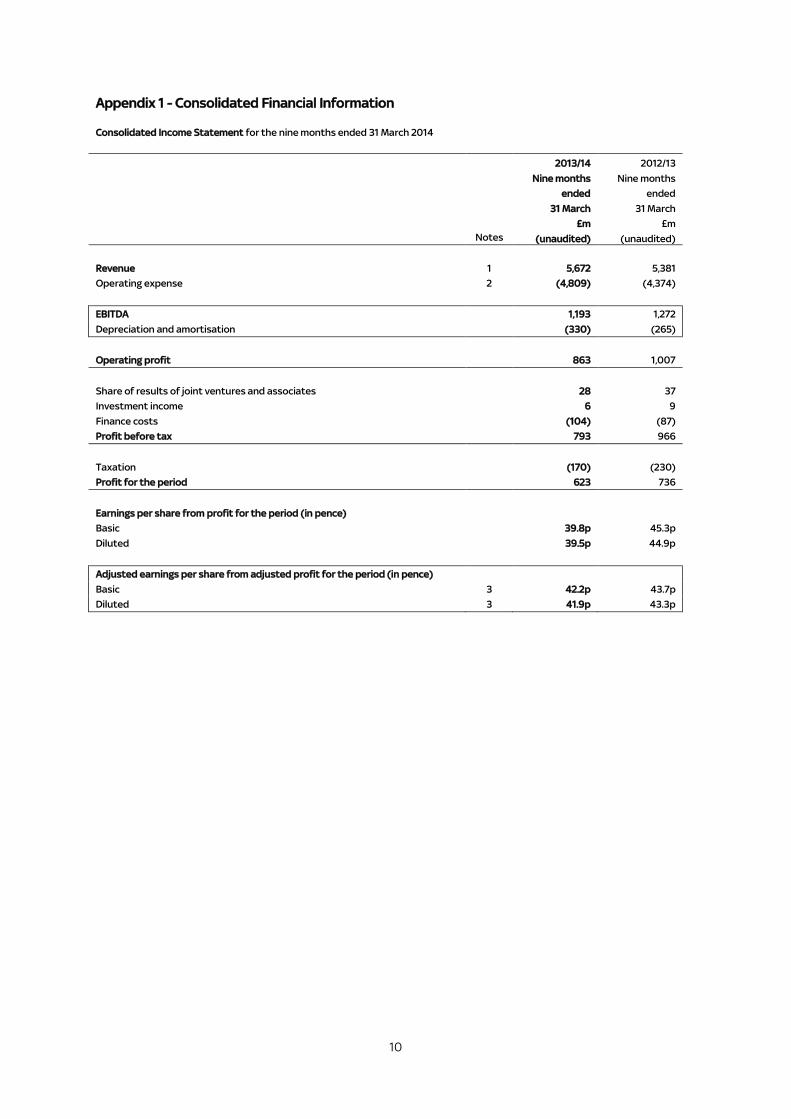
Appendix 1 - Consolidated Financial Information
Consolidated Income Statement for the nine months ended 31 March 2014
2013/14 2012/13
Nine months Nine months
ended ended
31 March 31 March
£m £m
Notes (unaudited) (unaudited)
Revenue 1 5,672 5,381
Operating expense 2 (4,809) (4,374)
EBITDA 1,193 1,272
Depreciation and amortisation (330) (265)
Operating profit 863 1,007
Share of results of joint ventures and associates 28 37
Investment income 6 9
Finance costs (104) (87)
Profit before tax 793 966
Taxation (170) (230)
Profit for the period 623 736
Earnings per share from profit for the period (in pence)
Basic 39.8p 45.3p
Diluted 39.5p 44.9p
Adjusted earnings per share from adjusted profit for the period (in pence)
Basic 3 42.2p 43.7p
Diluted 3 41.9p 43.3p
11
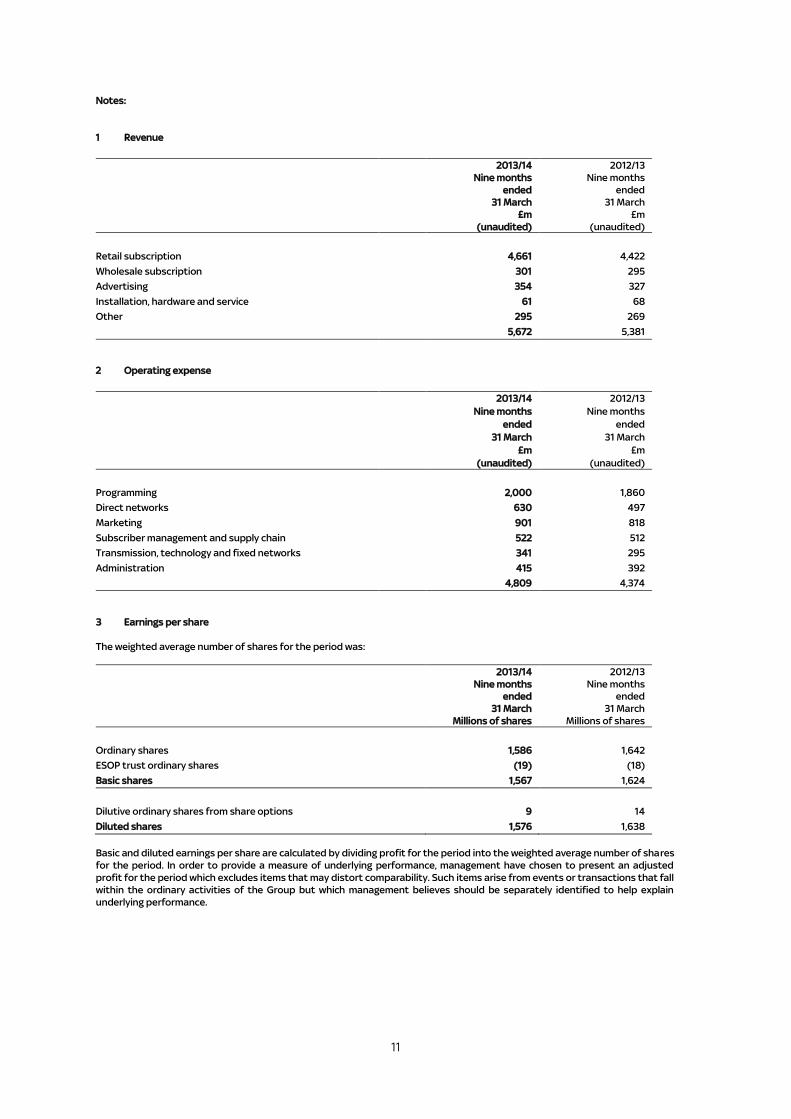
Notes:
1 Revenue
2013/14 2012/13
Nine months Nine months
ended ended
31 March 31 March
£m £m
(unaudited) (unaudited)
Retail subscription 4,661 4,422
Wholesale subscription 301 295
Advertising 354 327
Installation, hardware and service 61 68
Other 295 269
5,672 5,381
2 Operating expense
2013/14 2012/13
Nine months Nine months
ended ended
31 March 31 March
£m £m
(unaudited) (unaudited)
Programming 2,000 1,860
Direct networks 630 497
Marketing 901 818
Subscriber management and supply chain 522 512
Transmission, technology and fixed networks 341 295
Administration 415 392
4,809 4,374
3 Earnings per share
The weighted average number of shares for the period was:
2013/14
Nine months
ended
31 March
Millions of shares
2012/13
Nine months
ended
31 March
Millions of shares
Ordinary shares 1,586 1,642
ESOP trust ordinary shares (19) (18)
Basic shares 1,567 1,624
Dilutive ordinary shares from share options 9 14
Diluted shares 1,576 1,638
Basic and diluted earnings per share are calculated by dividing profit for the period into the weighted average number of shares
for the period. In order to provide a measure of underlying performance, management have chosen to present an adjusted
profit for the period which excludes items that may distort comparability. Such items arise from events or transactions that fall
within the ordinary activities of the Group but which management believes should be separately identified to help explain
underlying performance.
12
3 Earnings per share (continued)
2013/14
Nine months
ended
31 March
£m
(unaudited)
2012/13
Nine months
ended
31 March
£m
(unaudited)
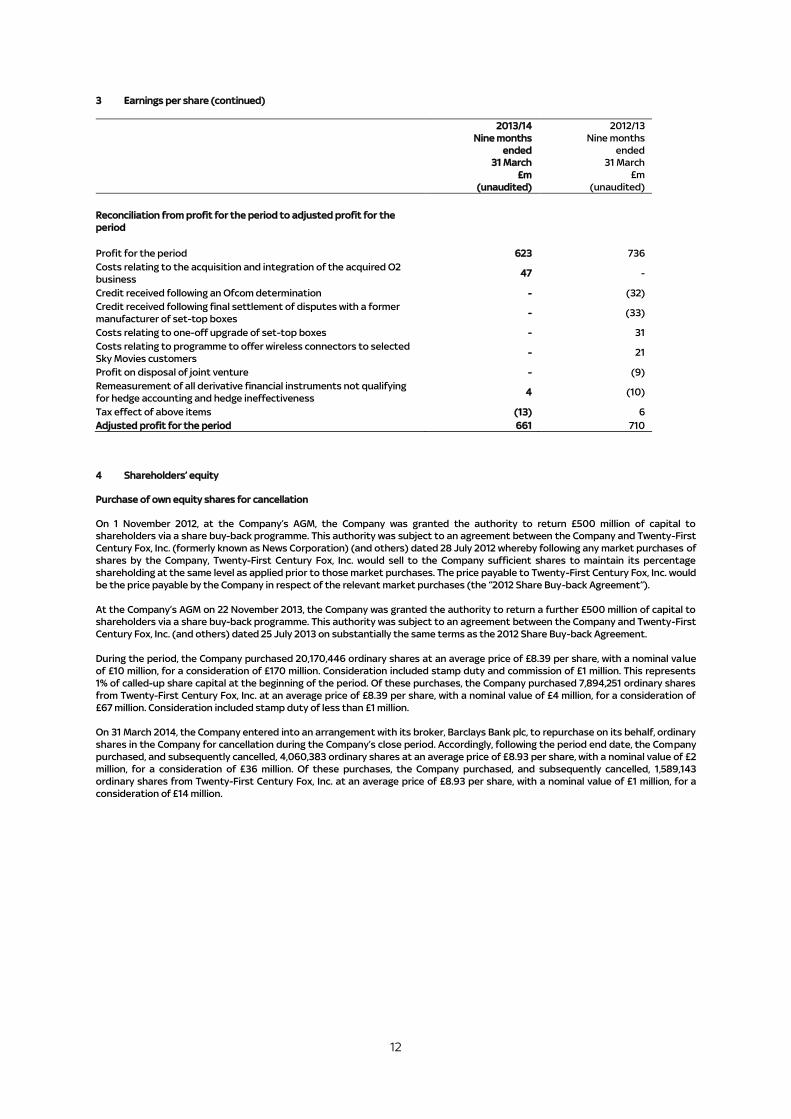
Reconciliation from profit for the period to adjusted profit for the
period
Profit for the period 623 736
Costs relating to the acquisition and integration of the acquired O2
business 47 -
Credit received following an Ofcom determination - (32)
Credit received following final settlement of disputes with a former
manufacturer of set-top boxes - (33)
Costs relating to one-off upgrade of set-top boxes - 31
Costs relating to programme to offer wireless connectors to selected
Sky Movies customers - 21
Profit on disposal of joint venture - (9)
Remeasurement of all derivative financial instruments not qualifying
for hedge accounting and hedge ineffectiveness 4 (10)
Tax effect of above items (13) 6
Adjusted profit for the period 661 710
4 Shareholders’ equity
Purchase of own equity shares for cancellation
On 1 November 2012, at the Company’s AGM, the Company was granted the authority to return £500 million of capital to
shareholders via a share buy-back programme. This authority was subject to an agreement between the Company and Twenty-First
Century Fox, Inc. (formerly known as News Corporation) (and others) dated 28 July 2012 whereby following any market purchases of
shares by the Company, Twenty-First Century Fox, Inc. would sell to the Company sufficient shares to maintain its percentage
shareholding at the same level as applied prior to those market purchases. The price payable to Twenty-First Century Fox, Inc. would
be the price payable by the Company in respect of the relevant market purchases (the “2012 Share Buy-back Agreement”).
At the Company’s AGM on 22 November 2013, the Company was granted the authority to return a further £500 million of capital to
shareholders via a share buy-back programme. This authority was subject to an agreement between the Company and Twenty-First
Century Fox, Inc. (and others) dated 25 July 2013 on substantially the same terms as the 2012 Share Buy-back Agreement.
During the period, the Company purchased 20,170,446 ordinary shares at an average price of £8.39 per share, with a nominal value
of £10 million, for a consideration of £170 million. Consideration included stamp duty and commission of £1 million. This represents
1% of called-up share capital at the beginning of the period. Of these purchases, the Company purchased 7,894,251 ordinary shares
from Twenty-First Century Fox, Inc. at an average price of £8.39 per share, with a nominal value of £4 million, for a consideration of
£67 million. Consideration included stamp duty of less than £1 million.
On 31 March 2014, the Company entered into an arrangement with its broker, Barclays Bank plc, to repurchase on its behalf, ordinary
shares in the Company for cancellation during the Company’s close period. Accordingly, following the period end date, the Company
purchased, and subsequently cancelled, 4,060,383 ordinary shares at an average price of £8.93 per share, with a nominal value of £2
million, for a consideration of £36 million. Of these purchases, the Company purchased, and subsequently cancelled, 1,589,143
ordinary shares from Twenty-First Century Fox, Inc. at an average price of £8.93 per share, with a nominal value of £1 million, for a
consideration of £14 million.
13
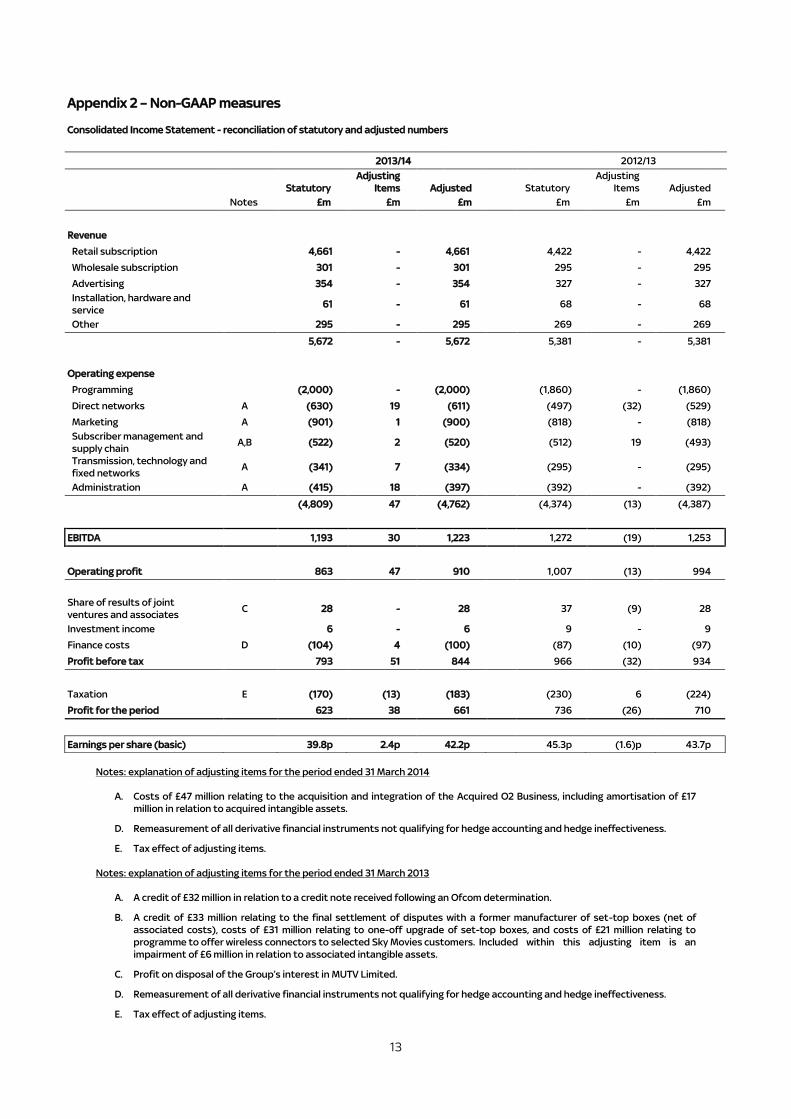
Appendix 2 – Non-GAAP measures
Consolidated Income Statement - reconciliation of statutory and adjusted numbers
Notes: explanation of adjusting items for the period ended 31 March 2014
A. Costs of £47 million relating to the acquisition and integration of the Acquired O2 Business, including amortisation of £17
million in relation to acquired intangible assets.
D. Remeasurement of all derivative financial instruments not qualifying for hedge accounting and hedge ineffectiveness.
E. Tax effect of adjusting items.
Notes: explanation of adjusting items for the period ended 31 March 2013
A. A credit of £32 million in relation to a credit note received following an Ofcom determination.
B. A credit of £33 million relating to the final settlement of disputes with a former manufacturer of set-top boxes (net of
associated costs), costs of £31 million relating to one-off upgrade of set-top boxes, and costs of £21 million relating to
programme to offer wireless connectors to selected Sky Movies customers. Included within this adjusting item is an
impairment of £6 million in relation to associated intangible assets.
C. Profit on disposal of the Group’s interest in MUTV Limited.
D. Remeasurement of all derivative financial instruments not qualifying for hedge accounting and hedge ineffectiveness.
E. Tax effect of adjusting items.
2013/14 2012/13
Statutory
Adjusting
Items Adjusted Statutory
Adjusting
Items Adjusted
Notes £m £m £m £m £m £m
Revenue
Retail subscription 4,661 - 4,661 4,422 - 4,422
Wholesale subscription 301 - 301 295 - 295
Advertising 354 - 354 327 - 327
Installation, hardware and
service 61 - 61 68 - 68
Other 295 - 295 269 - 269
5,672 - 5,672 5,381 - 5,381
Operating expense
Programming (2,000) - (2,000) (1,860) - (1,860)
Direct networks A (630) 19 (611) (497) (32) (529)
Marketing A (901) 1 (900) (818) - (818)
Subscriber management and
supply chain
A,B (522) 2 (520) (512) 19 (493)
Transmission, technology and
fixed networks A (341) 7 (334) (295) - (295)
Administration
A (415) 18 (397) (392) - (392)
(4,809) 47 (4,762) (4,374) (13) (4,387)
EBITDA 1,193 30 1,223 1,272 (19) 1,253
Operating profit 863 47 910 1,007 (13) 994
Share of results of joint
ventures and associates C 28 - 28 37 (9) 28
Investment income 6 - 6 9 - 9
Finance costs D (104) 4 (100) (87) (10) (97)
Profit before tax 793 51 844 966 (32) 934
Taxation E (170) (13) (183) (230) 6 (224)
Profit for the period 623 38 661 736 (26) 710
Earnings per share (basic) 39.8p 2.4p 42.2p 45.3p (1.6)p 43.7p