Brazil, Russia, India, China Future Automotive Giants (Brazil, Russia, India, China) Future...
26
BRICs (Brazil, Russia, India, China) Future Automotive Giants Tim Armstrong Associate Director, Eastern Europe & Middle East and Africa
Transcript of Brazil, Russia, India, China Future Automotive Giants (Brazil, Russia, India, China) Future...

BRICs(Brazil, Russia, India, China)Future Automotive Giants
Tim ArmstrongAssociate Director, Eastern Europe & Middle East and Africa
Copyright © 2006 Global Insight, Inc. 22006 GLOBAL AUTOMOTIVE CONFERENCE
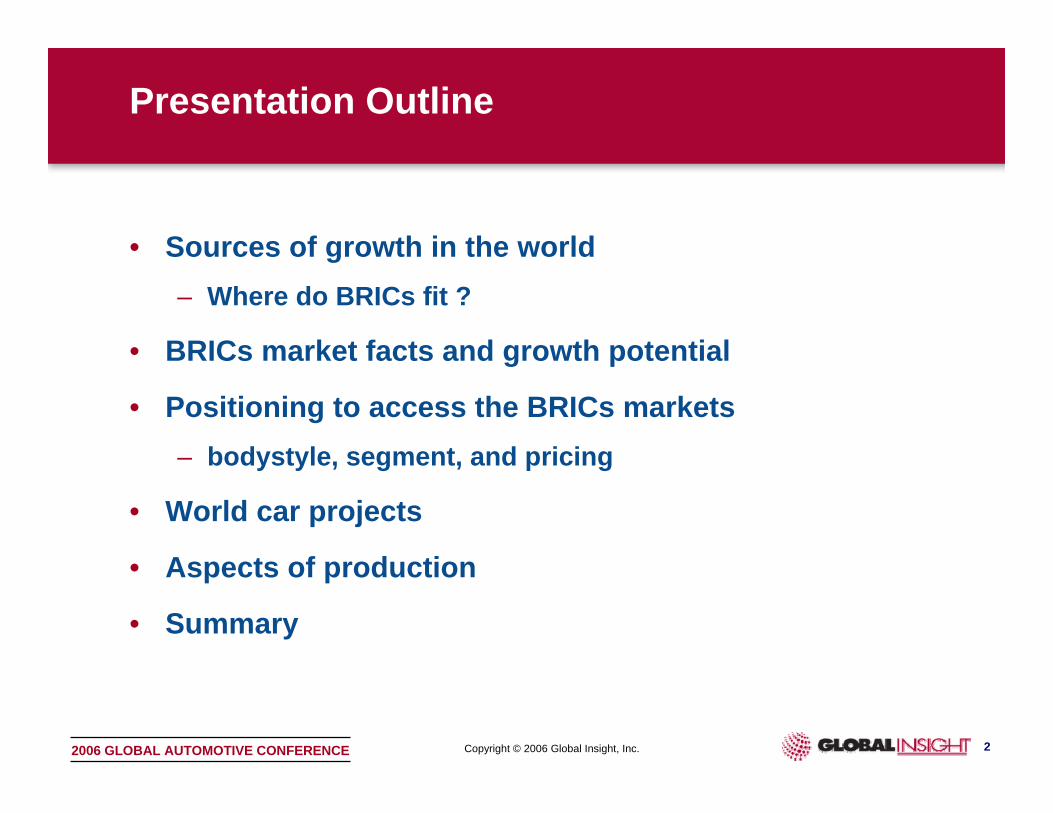
• Sources of growth in the world– Where do BRICs fit ?
• BRICs market facts and growth potential
• Positioning to access the BRICs markets– bodystyle, segment, and pricing
• World car projects
• Aspects of production
• Summary
Presentation Outline
Copyright © 2006 Global Insight, Inc. 32006 GLOBAL AUTOMOTIVE CONFERENCE
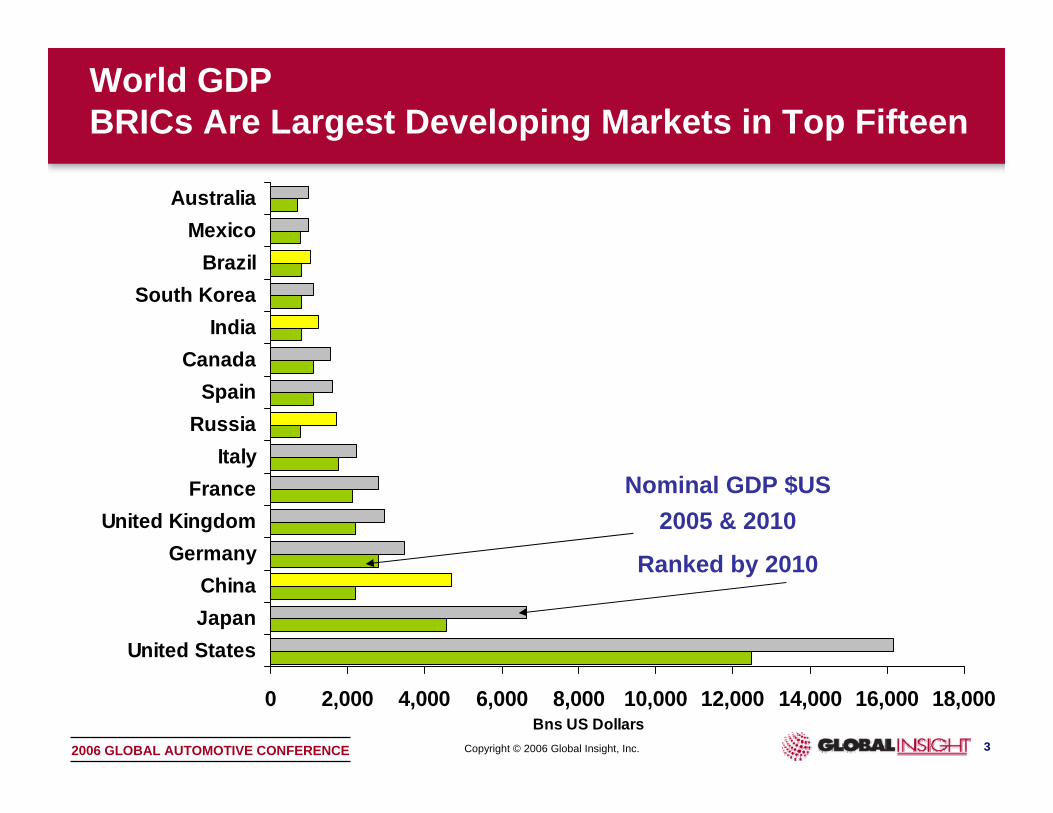
World GDP BRICs Are Largest Developing Markets in Top Fifteen
0 2,000 4,000 6,000 8,000 10,000 12,000 14,000 16,000 18,000
United StatesJapanChina
GermanyUnited Kingdom
FranceItaly
RussiaSpain
CanadaIndia
South KoreaBrazil
MexicoAustralia
Bns US Dollars
Nominal GDP $US2005 & 2010
Ranked by 2010
Copyright © 2006 Global Insight, Inc. 42006 GLOBAL AUTOMOTIVE CONFERENCE
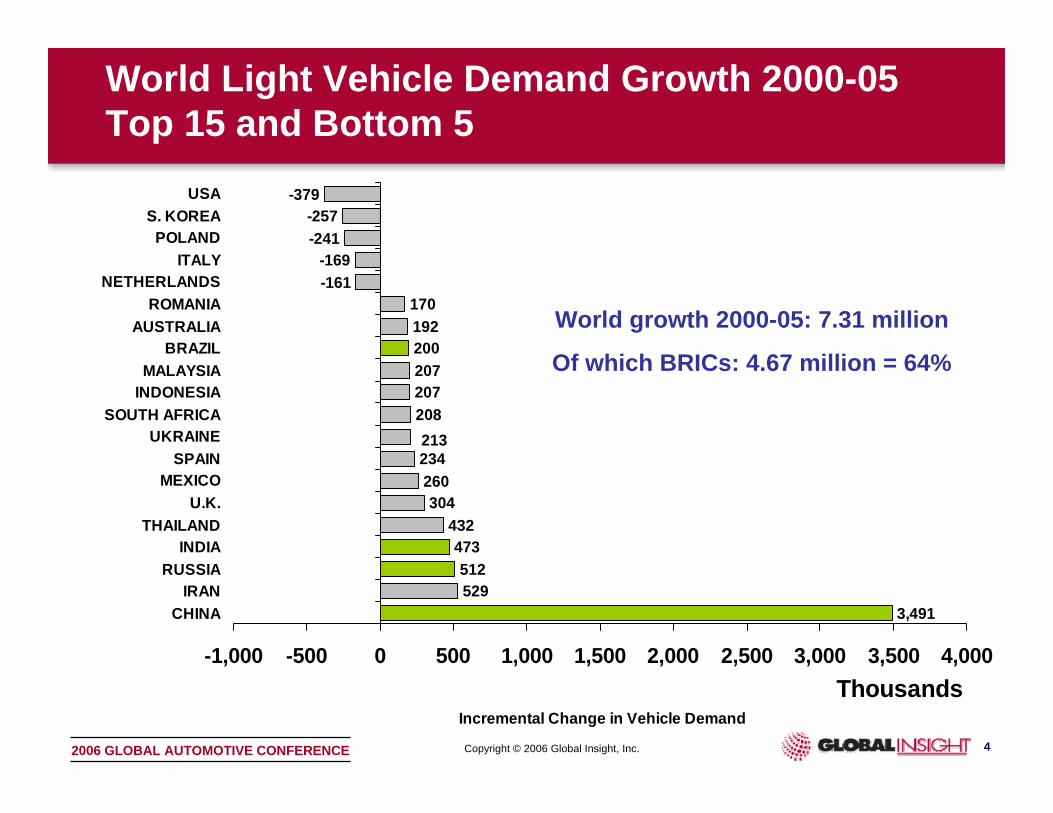
World Light Vehicle Demand Growth 2000-05 Top 15 and Bottom 5
529512
473432
304260234
208207207
192170
-161-169
-241-257
-379
213
3,491
200
-1,000 -500 0 500 1,000 1,500 2,000 2,500 3,000 3,500 4,000
CHINAIRAN
RUSSIAINDIA
THAILANDU.K.
MEXICOSPAIN
UKRAINESOUTH AFRICA
INDONESIAMALAYSIA
BRAZILAUSTRALIA
ROMANIANETHERLANDS
ITALYPOLAND
S. KOREAUSA
ThousandsIncremental Change in Vehicle Demand
World growth 2000-05: 7.31 million
Of which BRICs: 4.67 million = 64%
Copyright © 2006 Global Insight, Inc. 52006 GLOBAL AUTOMOTIVE CONFERENCE
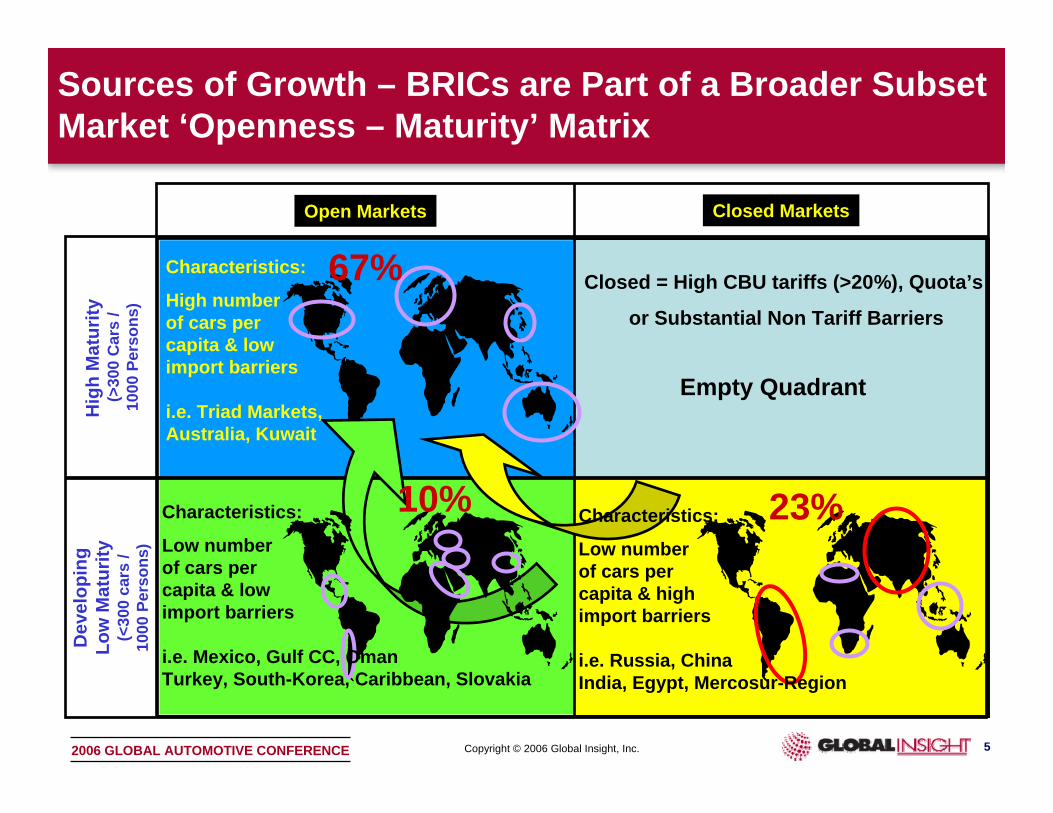
Sources of Growth – BRICs are Part of a Broader SubsetMarket ‘Openness – Maturity’ Matrix
Dev
elop
ing
Low
Mat
urity
(<30
0 ca
rs /
1000
Per
sons
)
Open Markets Closed Markets
Hig
h M
atur
ity(>
300
Car
s /
1000
Per
sons
)
Characteristics:
High numberof cars per capita & lowimport barriers
i.e. Triad Markets,Australia, Kuwait
Characteristics:
Low numberof cars per capita & lowimport barriers
i.e. Mexico, Gulf CC, OmanTurkey, South-Korea, Caribbean, Slovakia
Characteristics:
Low numberof cars per capita & highimport barriers
i.e. Russia, ChinaIndia, Egypt, Mercosur-Region
Empty Quadrant
23%10%
67% Closed = High CBU tariffs (>20%), Quota’s
or Substantial Non Tariff Barriers
Copyright © 2006 Global Insight, Inc. 62006 GLOBAL AUTOMOTIVE CONFERENCE
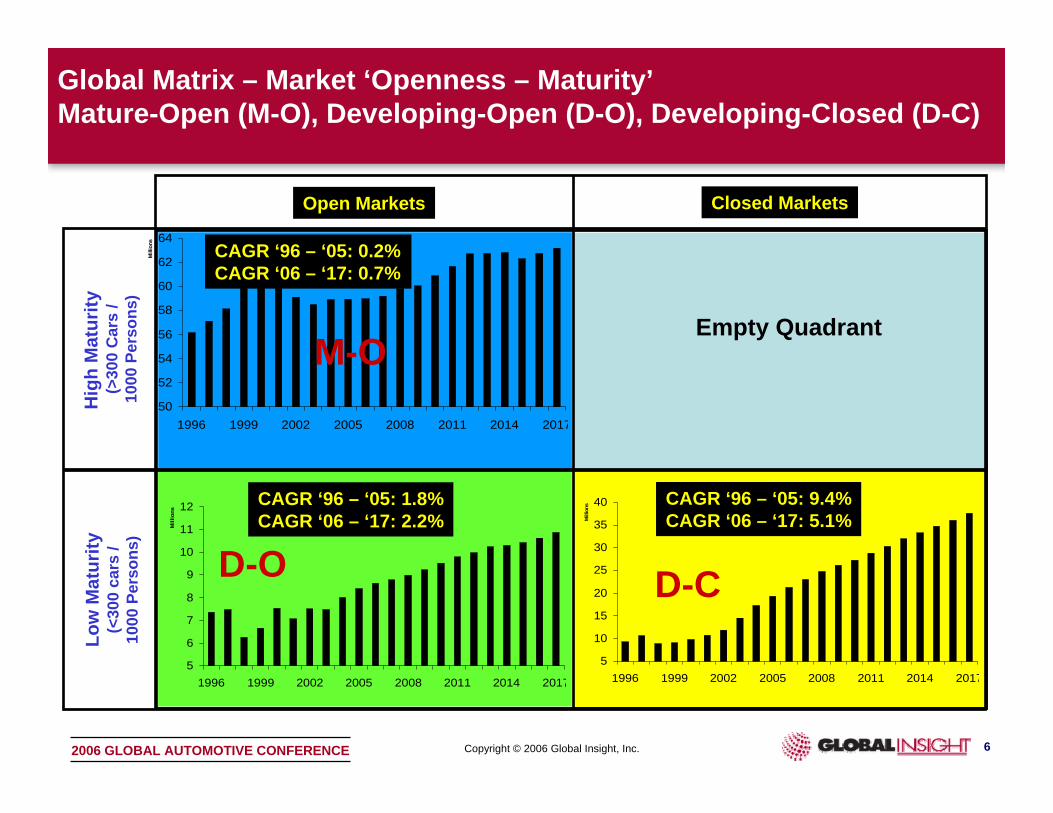
Global Matrix – Market ‘Openness – Maturity’Mature-Open (M-O), Developing-Open (D-O), Developing-Closed (D-C)
Low
Mat
urity
(<30
0 ca
rs /
1000
Per
sons
)
Open Markets Closed Markets
Hig
h M
atur
ity(>
300
Car
s /
1000
Per
sons
)
Empty Quadrant
50
52
54
56
58
60
62
64
1996 1999 2002 2005 2008 2011 2014 2017
Mill
ions
5
10
15
20
25
30
35
40
1996 1999 2002 2005 2008 2011 2014 2017
Mill
ions
5
6
7
8
9
10
11
12
1996 1999 2002 2005 2008 2011 2014 2017
Mill
ions
CAGR ‘96 – ‘05: 0.2%CAGR ‘06 – ‘17: 0.7%
CAGR ‘96 – ‘05: 9.4%CAGR ‘06 – ‘17: 5.1%
CAGR ‘96 – ‘05: 1.8%CAGR ‘06 – ‘17: 2.2%
D-O
M-O
D-C
Copyright © 2006 Global Insight, Inc. 72006 GLOBAL AUTOMOTIVE CONFERENCE
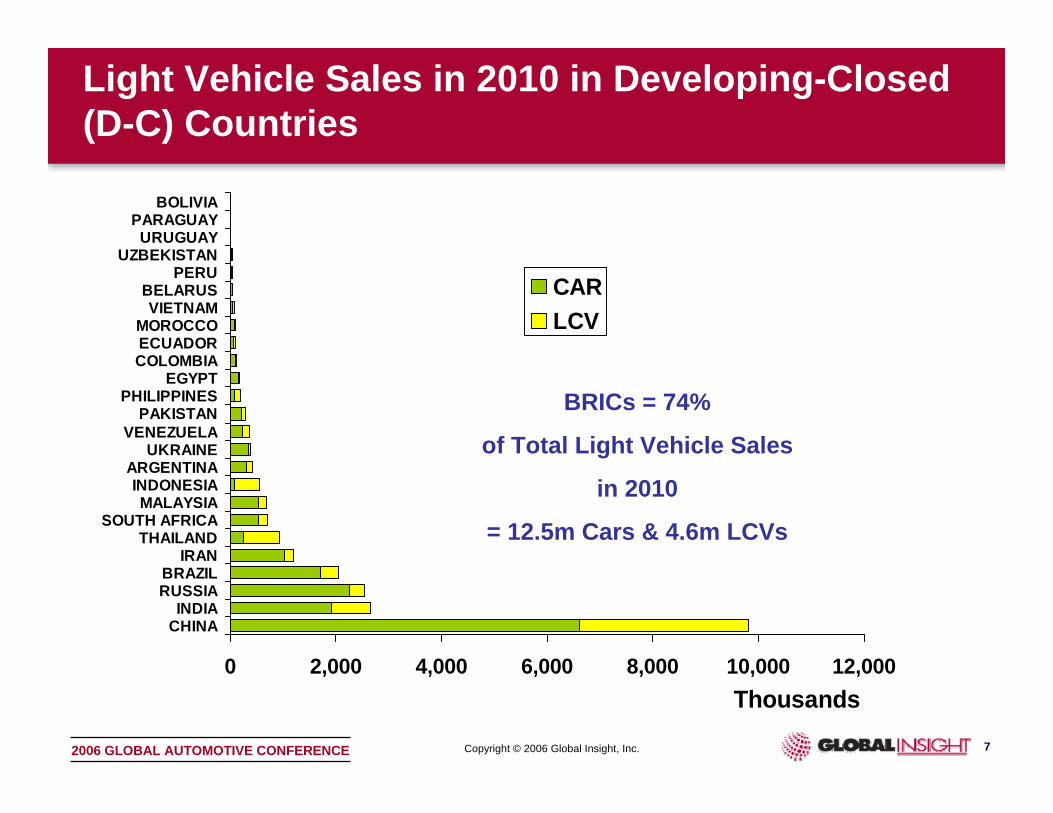
Light Vehicle Sales in 2010 in Developing-Closed (D-C) Countries
0 2,000 4,000 6,000 8,000 10,000 12,000
CHINAINDIA
RUSSIABRAZIL
IRANTHAILAND
SOUTH AFRICAMALAYSIA
INDONESIAARGENTINA
UKRAINEVENEZUELA
PAKISTANPHILIPPINES
EGYPTCOLOMBIAECUADORMOROCCO
VIETNAMBELARUS
PERUUZBEKISTAN
URUGUAYPARAGUAY
BOLIVIA
Thousands
CARLCV
BRICs = 74%
of Total Light Vehicle Sales
in 2010
= 12.5m Cars & 4.6m LCVs
Copyright © 2006 Global Insight, Inc. 82006 GLOBAL AUTOMOTIVE CONFERENCE
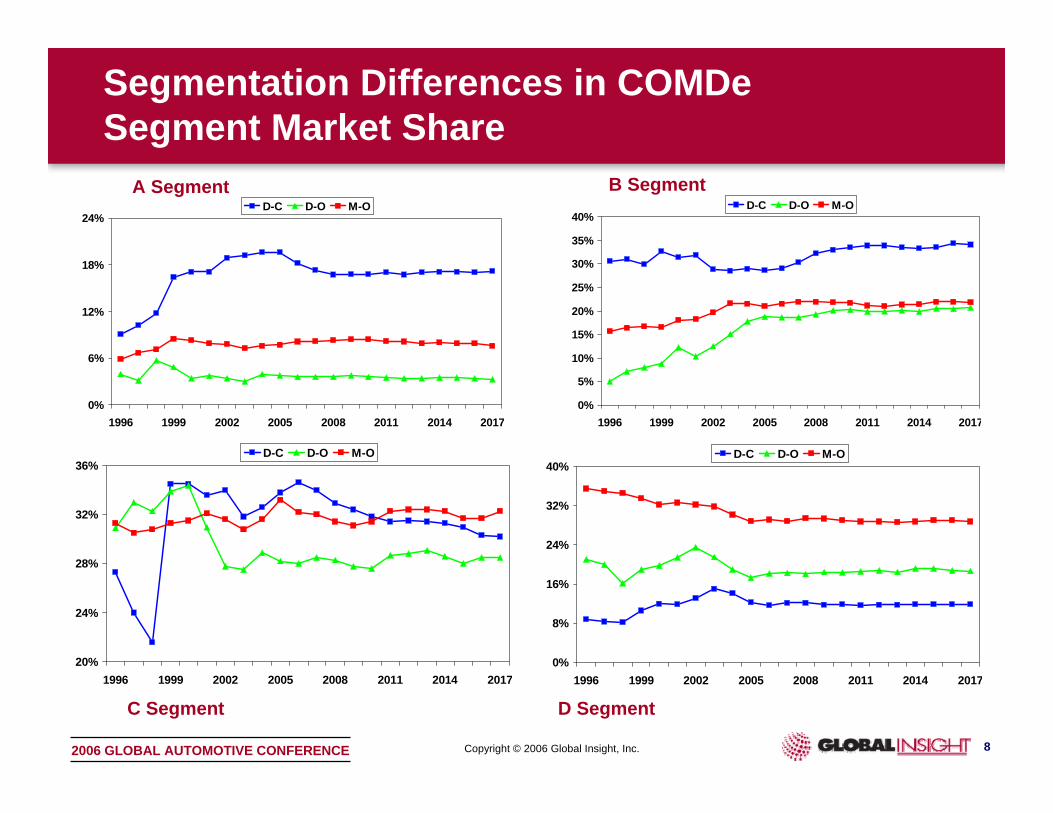
Segmentation Differences in COMDeSegment Market Share
0%
6%
12%
18%
24%
1996 1999 2002 2005 2008 2011 2014 2017
D-C D-O M-O
0%
5%
10%
15%
20%
25%
30%
35%
40%
1996 1999 2002 2005 2008 2011 2014 2017
D-C D-O M-O
20%
24%
28%
32%
36%
1996 1999 2002 2005 2008 2011 2014 2017
D-C D-O M-O
A Segment B Segment
C Segment
0%
8%
16%
24%
32%
40%
1996 1999 2002 2005 2008 2011 2014 2017
D-C D-O M-O
D Segment
Copyright © 2006 Global Insight, Inc. 92006 GLOBAL AUTOMOTIVE CONFERENCE
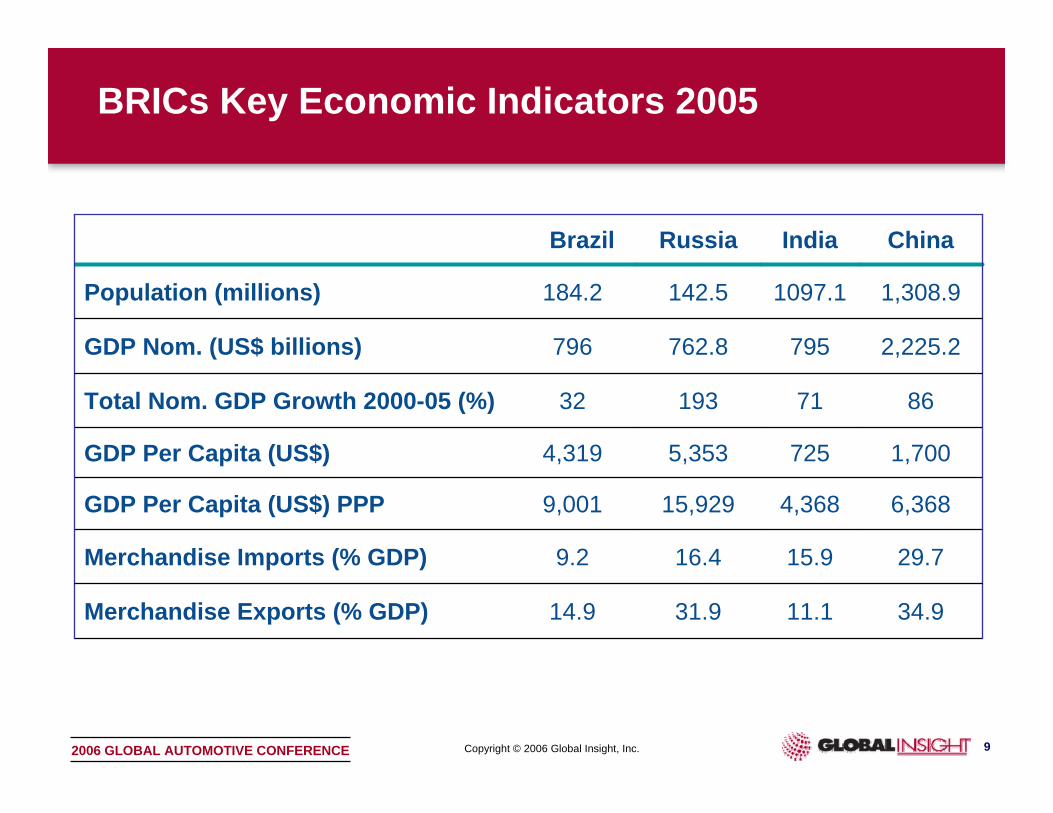
BRICs Key Economic Indicators 2005
34.911.131.914.9Merchandise Exports (% GDP)
29.715.916.49.2Merchandise Imports (% GDP)
2,225.2795762.8796GDP Nom. (US$ billions)
1,308.91097.1142.5184.2Population (millions)
15,929
5,353
193
Russia
9,001
4,319
32
Brazil
6,3684,368GDP Per Capita (US$) PPP
1,700725GDP Per Capita (US$)
8671Total Nom. GDP Growth 2000-05 (%)
ChinaIndia
Copyright © 2006 Global Insight, Inc. 102006 GLOBAL AUTOMOTIVE CONFERENCE
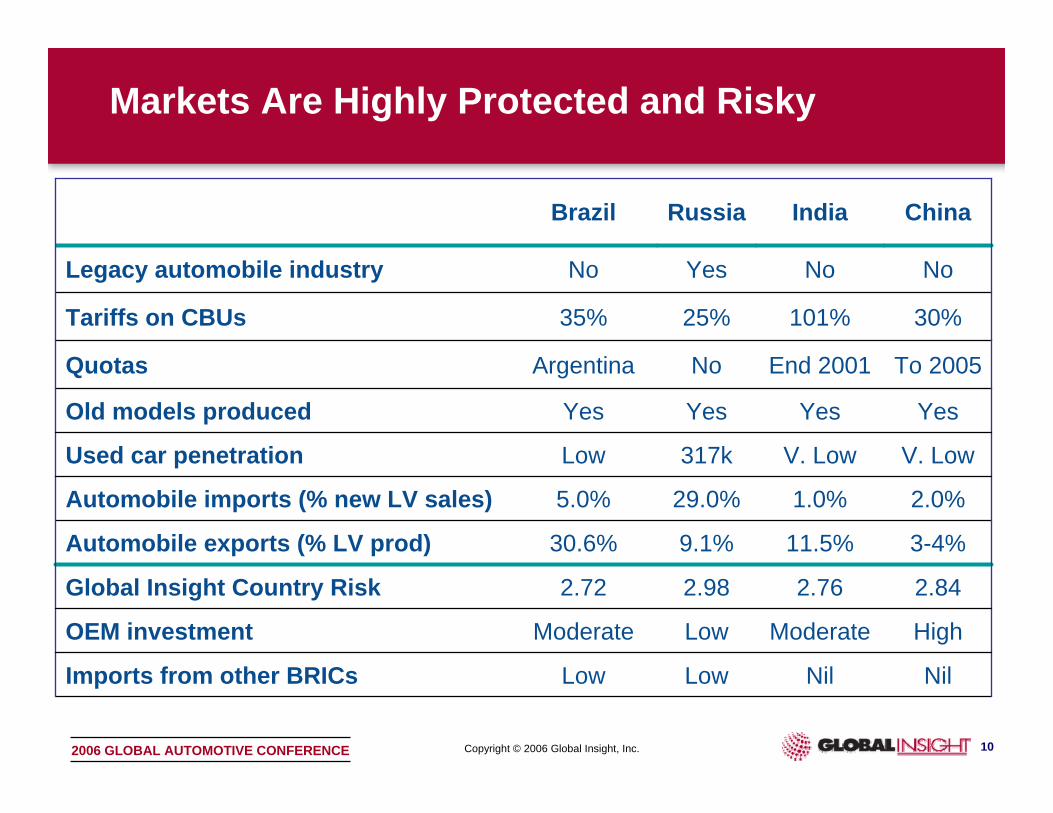
Markets Are Highly Protected and Risky
2.842.762.982.72Global Insight Country Risk
V. LowV. Low317kLow Used car penetration
HighModerateLowModerateOEM investment
YesYesYesYesOld models produced
To 2005End 2001NoArgentinaQuotas
30%101%25%35%Tariffs on CBUs
NoNoYesNoLegacy automobile industry
Low
9.1%
29.0%
Russia
Low
30.6%
5.0%
Brazil
NilNilImports from other BRICs
3-4%11.5%Automobile exports (% LV prod)
2.0%1.0%Automobile imports (% new LV sales)
ChinaIndia

Copyright © 2006 Global Insight, Inc. 112006 GLOBAL AUTOMOTIVE CONFERENCE
Automotive Demand Market Summary 2005
12.88.0125.4618.17Car parc (millions)10.17.3178.0100.0Car ownership per 000 population
5.41.21.61.6Light vehicle sales (millions)4.11.711.28.7LV sales per ‘000 population
RussiaBrazil ChinaIndia
1,413921
3,293196
305
317
1,330
284
2,067
0
1,000
2,000
3,000
4,000
5,000
6,000
BRAZIL RUSSIA INDIA CHINA
Thou
sand
s
Used ImportsLCVCAR
0
1000
2000
3000
4000
5000
6000
1995
1996
1997
1998
1999
2000
2001
2002
2003
2004
2005
Thou
sand
s
China
India
RussiaBrazil
LV Sales 1995-2005 LV Sales 2005
Copyright © 2006 Global Insight, Inc. 122006 GLOBAL AUTOMOTIVE CONFERENCE
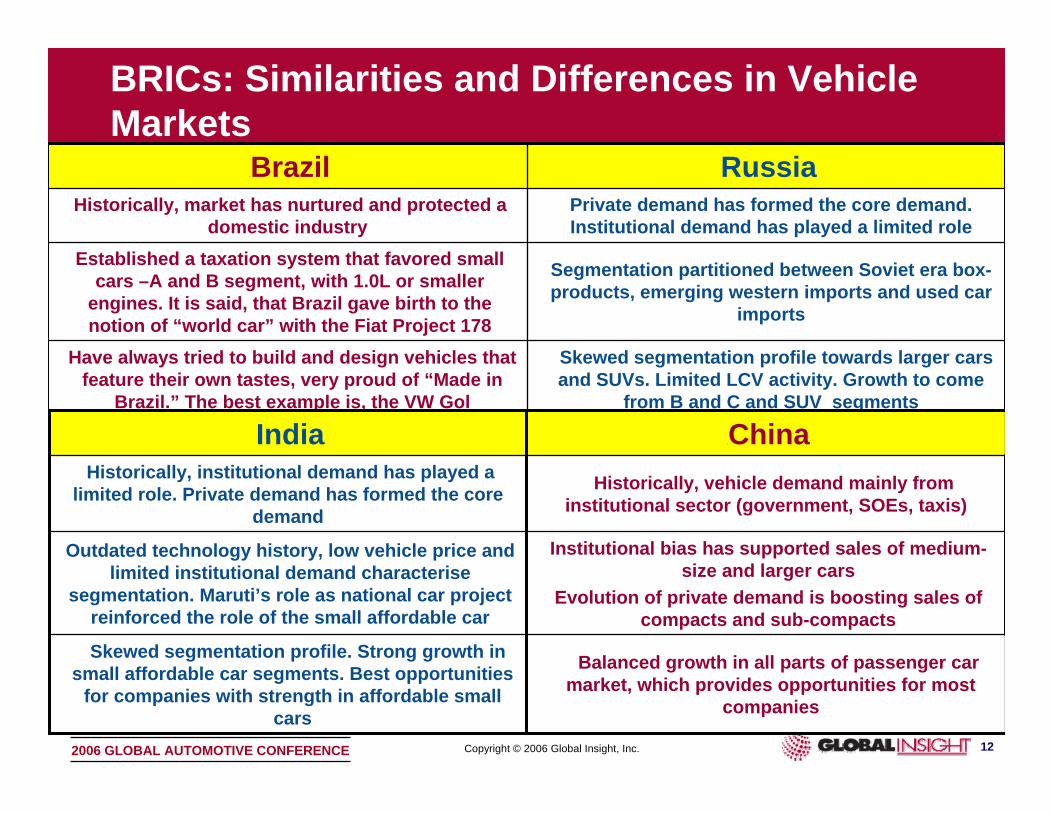
BRICs: Similarities and Differences in Vehicle Markets
RussiaCBrazil
Skewed segmentation profile towards larger cars and SUVs. Limited LCV activity. Growth to come
from B and C and SUV segments
Have always tried to build and design vehicles that feature their own tastes, very proud of “Made in
Brazil.” The best example is, the VW Gol
Segmentation partitioned between Soviet era box-products, emerging western imports and used car
imports
Established a taxation system that favored small cars –A and B segment, with 1.0L or smaller
engines. It is said, that Brazil gave birth to the notion of “world car” with the Fiat Project 178
Private demand has formed the core demand. Institutional demand has played a limited role
Historically, market has nurtured and protected a domestic industry
Skewed segmentation profile. Strong growth in small affordable car segments. Best opportunities
for companies with strength in affordable small cars
Outdated technology history, low vehicle price and limited institutional demand characterise
segmentation. Maruti’s role as national car project reinforced the role of the small affordable car
Historically, institutional demand has played a limited role. Private demand has formed the core
demand
India CChina
Balanced growth in all parts of passenger car market, which provides opportunities for most
companies
Institutional bias has supported sales of medium-size and larger cars
Evolution of private demand is boosting sales of compacts and sub-compacts
Historically, vehicle demand mainly from institutional sector (government, SOEs, taxis)
Copyright © 2006 Global Insight, Inc. 132006 GLOBAL AUTOMOTIVE CONFERENCE
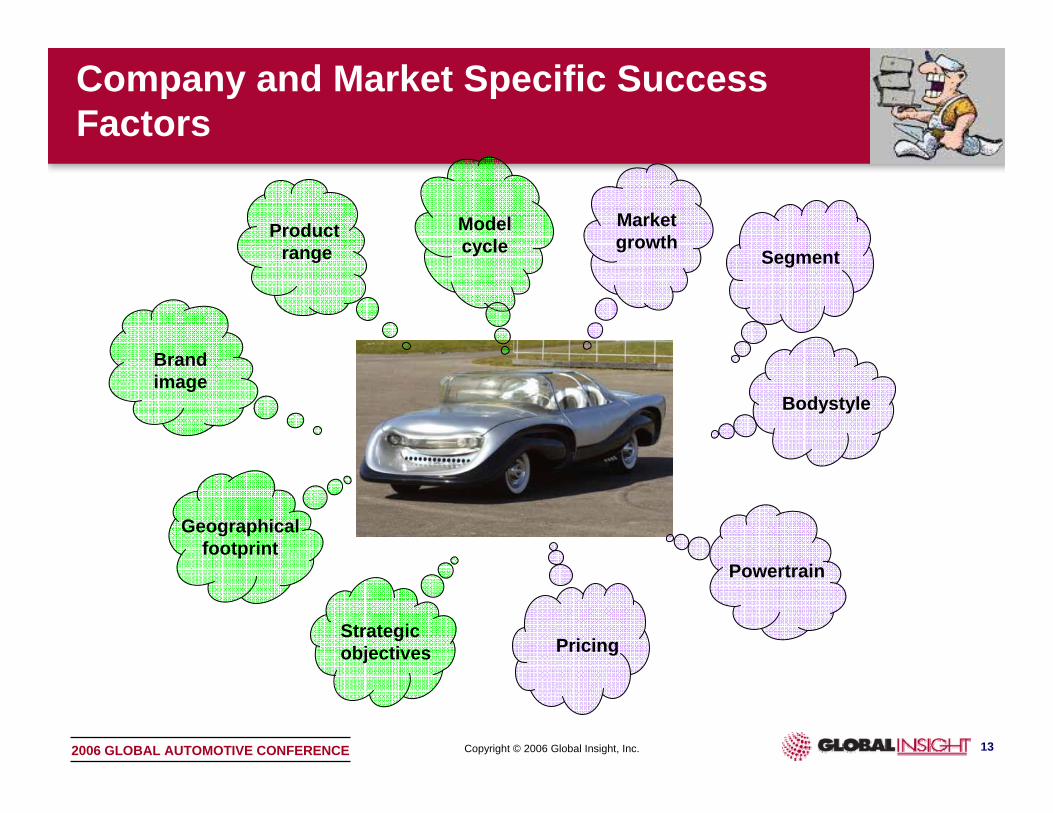
Company and Market Specific SuccessFactors
Segment
Bodystyle
Powertrain
PricingStrategic objectives
Geographicalfootprint
Brandimage
Product range
Modelcycle
Marketgrowth
Copyright © 2006 Global Insight, Inc. 142006 GLOBAL AUTOMOTIVE CONFERENCE
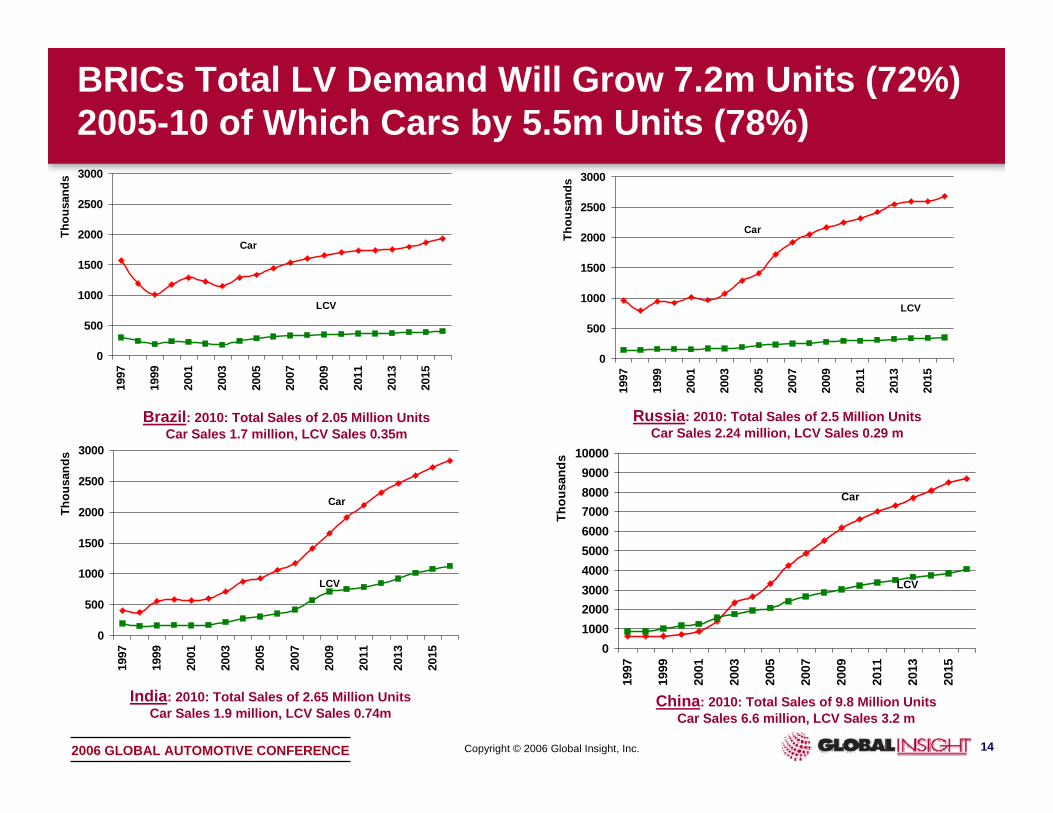
BRICs Total LV Demand Will Grow 7.2m Units (72%) 2005-10 of Which Cars by 5.5m Units (78%)
0
500
1000
1500
2000
2500
3000
1997
1999
2001
2003
2005
2007
2009
2011
2013
2015
Thou
sand
s
Car
LCV
0
500
1000
1500
2000
2500
3000
1997
1999
2001
2003
2005
2007
2009
2011
2013
2015
Thou
sand
s
Car
LCV
0100020003000400050006000700080009000
10000
1997
1999
2001
2003
2005
2007
2009
2011
2013
2015
Thou
sand
s
Car
LCV
China: 2010: Total Sales of 9.8 Million UnitsCar Sales 6.6 million, LCV Sales 3.2 m
0
500
1000
1500
2000
2500
3000
1997
1999
2001
2003
2005
2007
2009
2011
2013
2015
Thou
sand
s
Car
LCV
Russia: 2010: Total Sales of 2.5 Million UnitsCar Sales 2.24 million, LCV Sales 0.29 m
Brazil: 2010: Total Sales of 2.05 Million UnitsCar Sales 1.7 million, LCV Sales 0.35m
India: 2010: Total Sales of 2.65 Million UnitsCar Sales 1.9 million, LCV Sales 0.74m
Copyright © 2006 Global Insight, Inc. 152006 GLOBAL AUTOMOTIVE CONFERENCE
CA
BR
IO
CO
UPE
ESTA
TE
HA
TCH
MPV
RO
AD
STER
SED
AN
SUV
ABCDE
0
500000
1000000
1500000
2000000
2500000
ABCDE
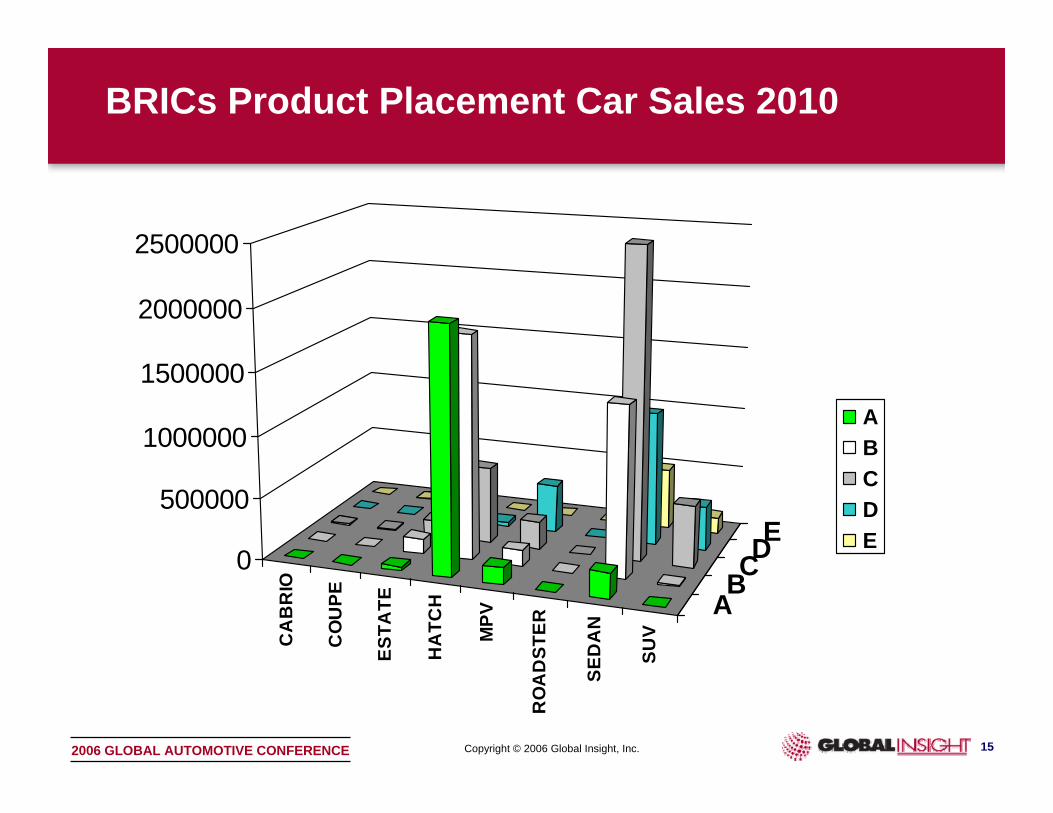
BRICs Product Placement Car Sales 2010
Copyright © 2006 Global Insight, Inc. 162006 GLOBAL AUTOMOTIVE CONFERENCE
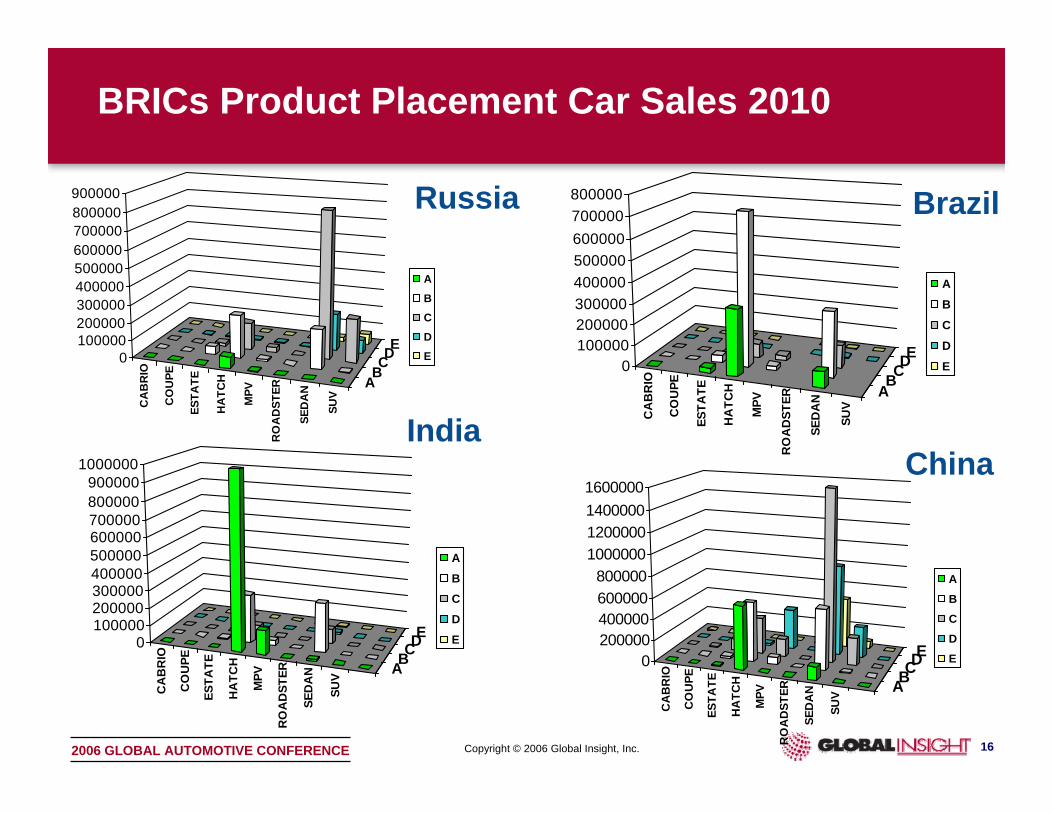
BRICs Product Placement Car Sales 2010C
AB
RIO
CO
UPE
ESTA
TE
HA
TCH
MPV
RO
AD
STER
SED
AN
SUV
ABCDE
0100000200000300000400000500000600000700000800000900000
ABCDE
CA
BR
IO
CO
UPE
ESTA
TE
HA
TCH
MPV
RO
AD
STER
SED
AN
SUV
ABCDE
0100000200000300000400000500000600000700000800000
ABCDE
CA
BR
IO
CO
UPE
ESTA
TE
HA
TCH
MPV
RO
AD
STER
SED
AN
SUV ABCDE0
100000200000300000400000500000600000700000800000900000
1000000
ABCDE
CA
BR
IO
CO
UPE
ESTA
TE
HA
TCH
MPV
RO
AD
STER
SED
AN
SUV AB
CDE0
200000400000600000800000
1000000120000014000001600000
ABCDE
Russia Brazil
ChinaIndia
Copyright © 2006 Global Insight, Inc. 172006 GLOBAL AUTOMOTIVE CONFERENCE
0
10000
20000
30000
40000
50000
60000
70000
80000
90000
100000
0 200000 400000 600000 800000 1000000 1200000 1400000 1600000Cumulative Sales
Pric
e eu
ro
Car price 2002Car price 2005
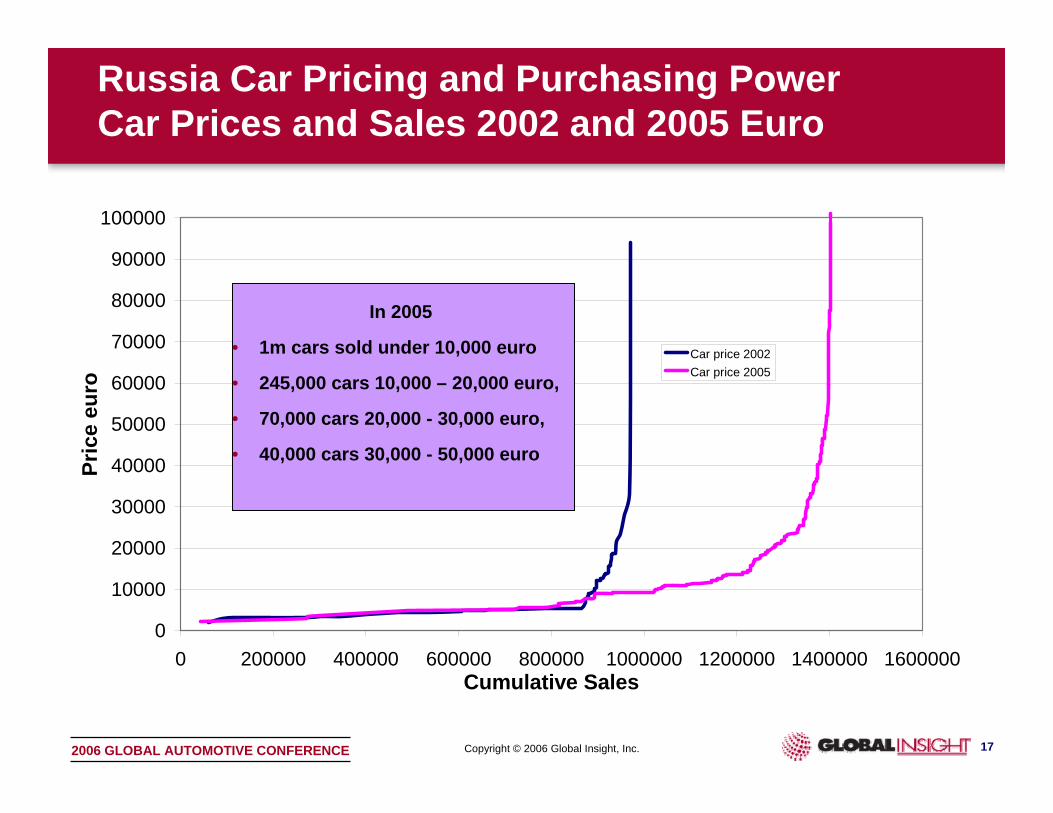
In 2005
• 1m cars sold under 10,000 euro
• 245,000 cars 10,000 – 20,000 euro,
• 70,000 cars 20,000 - 30,000 euro,
• 40,000 cars 30,000 - 50,000 euro
Russia Car Pricing and Purchasing PowerCar Prices and Sales 2002 and 2005 Euro
Copyright © 2006 Global Insight, Inc. 182006 GLOBAL AUTOMOTIVE CONFERENCE
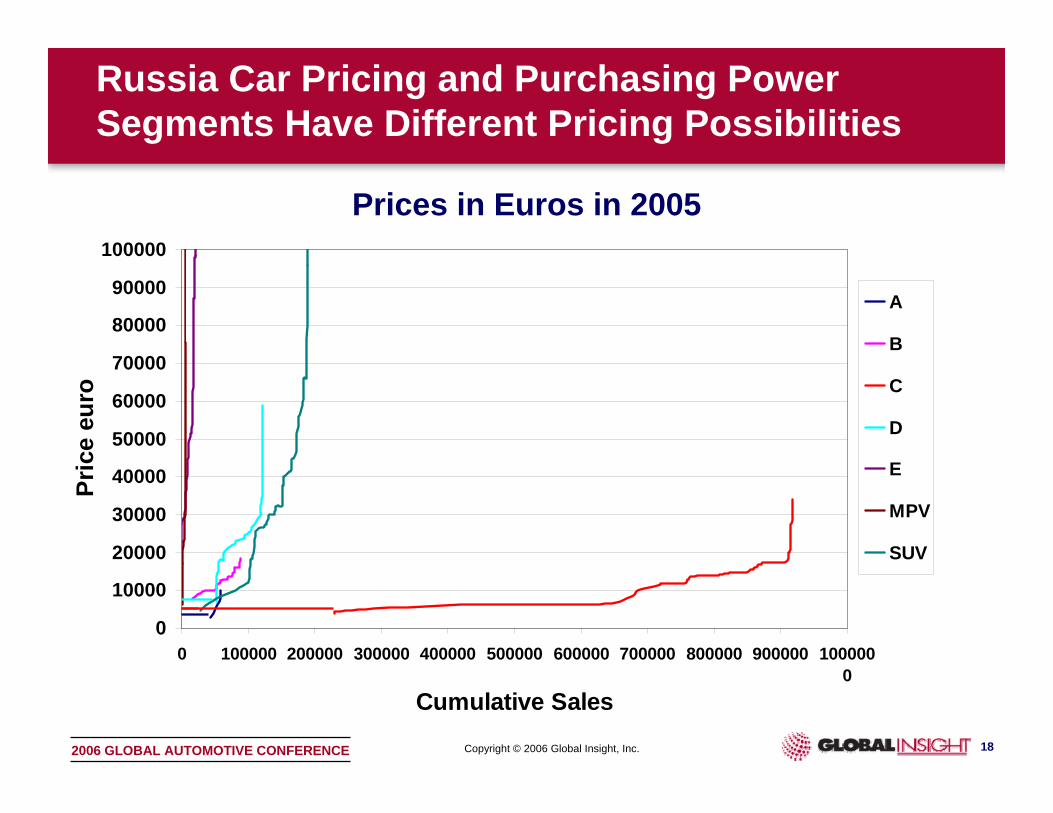
Russia Car Pricing and Purchasing PowerSegments Have Different Pricing Possibilities
0
10000
20000
30000
40000
50000
60000
70000
80000
90000
100000
0 100000 200000 300000 400000 500000 600000 700000 800000 900000 1000000
Cumulative Sales
Pric
e eu
ro
A
B
C
D
E
MPV
SUV
Prices in Euros in 2005

Copyright © 2006 Global Insight, Inc. 192006 GLOBAL AUTOMOTIVE CONFERENCE
0
5 0
1 00
3-D
Colu
mn 1
World Cars Competitive Space
DaciaLogan
VW Gol
Fiat D200
Nissan projectToyota
projectTataMicrocar
Peugeot206
SkodaFabia
OpelCorsa
ToyotaAygo
Ford Ka II
Chevy Aveo
Ford B204VW
Fox
Content/Price
Vehicle Size/Segment
= engineered “World Car”
= derivative (decontented)
vehicle
Small Large
Low
High
Price/content trade off
Price/sizetrade off
Fiat Palio/Siena
HyundaiGetz
Copyright © 2006 Global Insight, Inc. 202006 GLOBAL AUTOMOTIVE CONFERENCE
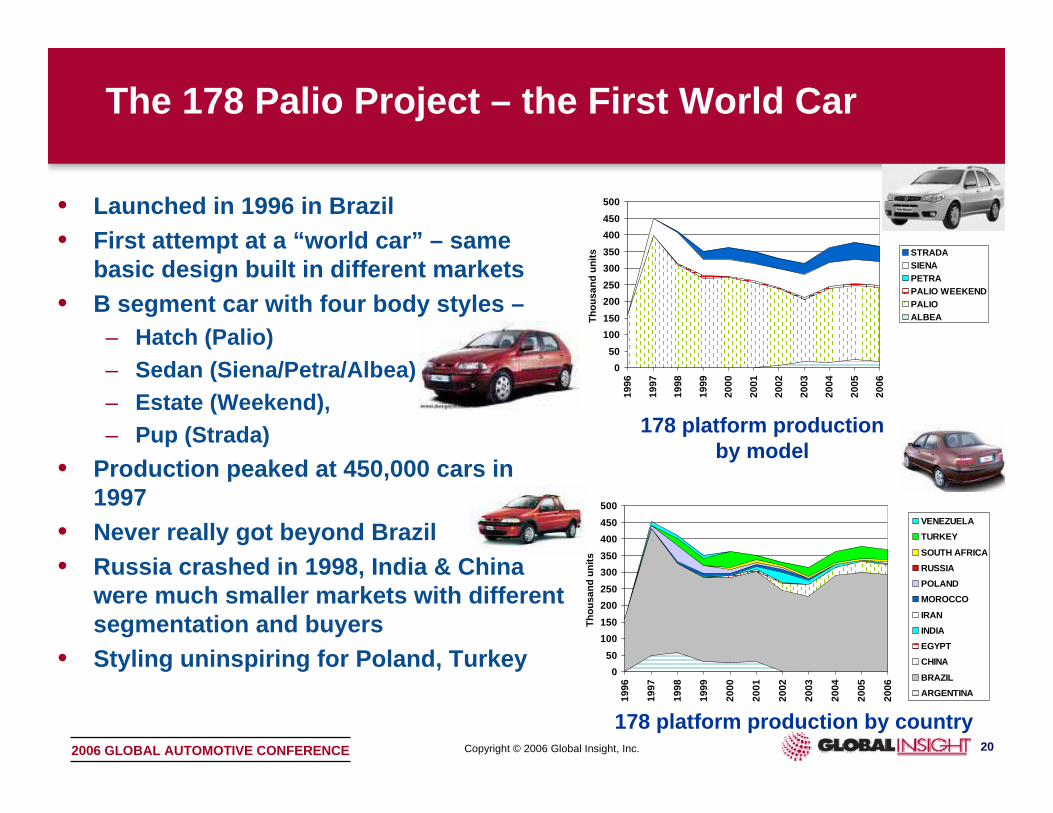
The 178 Palio Project – the First World Car
050
100150200250300350400450500
1996
1997
1998
1999
2000
2001
2002
2003
2004
2005
2006
Thou
sand
uni
ts
VENEZUELATURKEY
SOUTH AFRICARUSSIAPOLANDMOROCCO
IRANINDIAEGYPTCHINA
BRAZILARGENTINA
050
100150200250300350400450500
1996
1997
1998
1999
2000
2001
2002
2003
2004
2005
2006
Thou
sand
uni
ts STRADASIENAPETRAPALIO WEEKENDPALIOALBEA
178 platform production by country
178 platform productionby model
• Launched in 1996 in Brazil• First attempt at a “world car” – same
basic design built in different markets• B segment car with four body styles –
– Hatch (Palio) – Sedan (Siena/Petra/Albea) – Estate (Weekend), – Pup (Strada)
• Production peaked at 450,000 cars in 1997
• Never really got beyond Brazil• Russia crashed in 1998, India & China
were much smaller markets with different segmentation and buyers
• Styling uninspiring for Poland, Turkey

Copyright © 2006 Global Insight, Inc. 212006 GLOBAL AUTOMOTIVE CONFERENCE
• Initiated in 1998, Renault acquired Dacia in 1999. Model focused on 'Design to Cost‘
• C segment, based on a modified B platform, using frontal chassis modules borrowed from the X65 platform and rear chassis modules of the B platform
• Bodystyles – Sedan, Estate - October 2006, Hatchback displayed in Paris in September 2006, Pickup launched in early 2007, 4x4 under consideration for around 2008 or 2009
• Economies of scale achieved by producing 200,000 units per annum in Romania and centralising its CKD activity in the country,
• High potential for cost amortisation and/or reduction from carry-over parts, shared platform, localising production in low-cost bases and strict integration target in purchasing
• Powertrain: 1.4l, 1.6l petrol, 1.5l diesel
The Logan Project (X90)
2005 2006 2007 2008CKD Output 30,000 103,000 408,000 589,000Dacia Sales in Romania 113,276 108,000 95,000 105,000Dacia Sales on export markets 57,994 91,450 140,090 181,950
Dacia Expansion Plans
Source: Dacia
Total Annual Capacity Share of CKD UsedRomania 235,000 N.ARussia 60,000 70%Colombia 15,000 70%Morocco 30,000 70%Iran 300,000 40%India 50,000 50%Brazil N/K 3%
Logan Programme
Source: Dacia
Copyright © 2006 Global Insight, Inc. 222006 GLOBAL AUTOMOTIVE CONFERENCE
• High tariff barriers makes local production a key element in selling into BRICs
• Trade barriers prevent inter-BRIC trade, cannot easily produce in one BRIC and sell into another
• Low export potential means multiple production projects across several BRICs
• OEMs will specialise production to targeted segments within BRICs markets and should look beyond BRICs too
• Production likely to remain low and fragmented for some time -scale economies are harder to achieve
• BRICs type cars will still be among the most successful models produced here, but no super-model emerges to dominate all markets
Production Characteristics in BRICs
Copyright © 2006 Global Insight, Inc. 232006 GLOBAL AUTOMOTIVE CONFERENCE
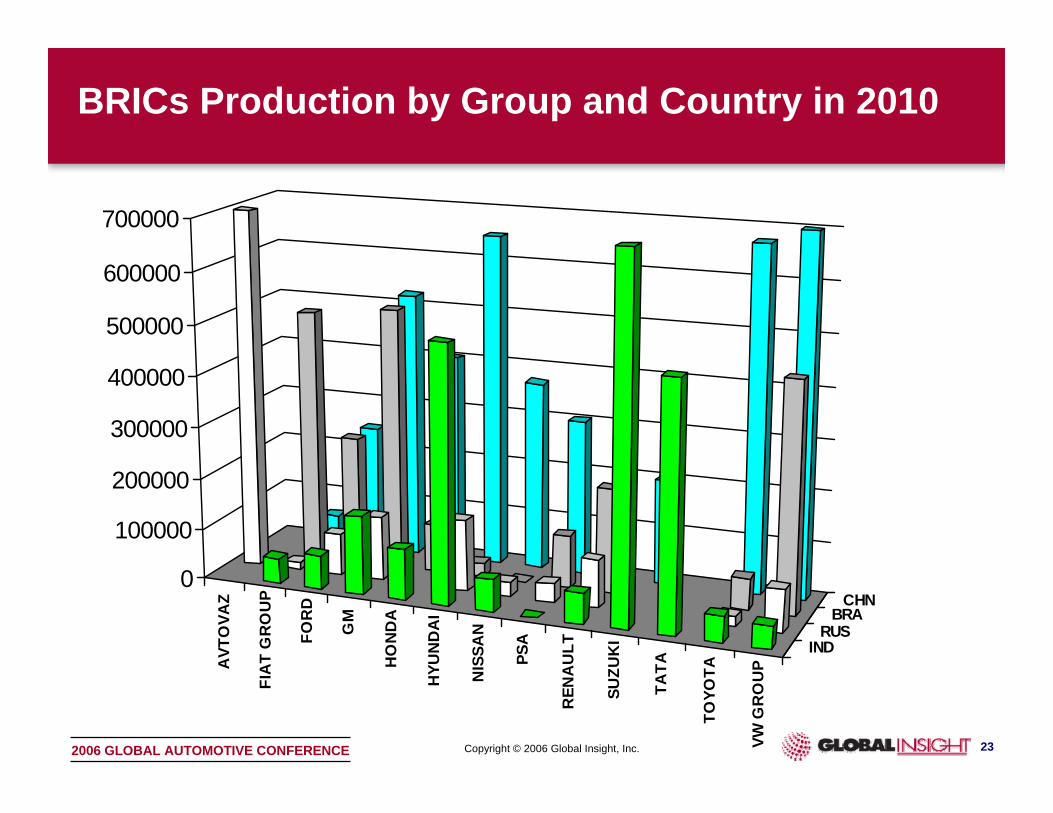
BRICs Production by Group and Country in 2010
AVT
OVA
Z
FIA
T G
RO
UP
FOR
D
GM
HO
ND
A
HYU
ND
AI
NIS
SAN
PSA
REN
AU
LT
SUZU
KI
TATA
TOYO
TA
VW G
RO
UP
INDRUS
BRACHN
0
100000
200000
300000
400000
500000
600000
700000
Copyright © 2006 Global Insight, Inc. 242006 GLOBAL AUTOMOTIVE CONFERENCE
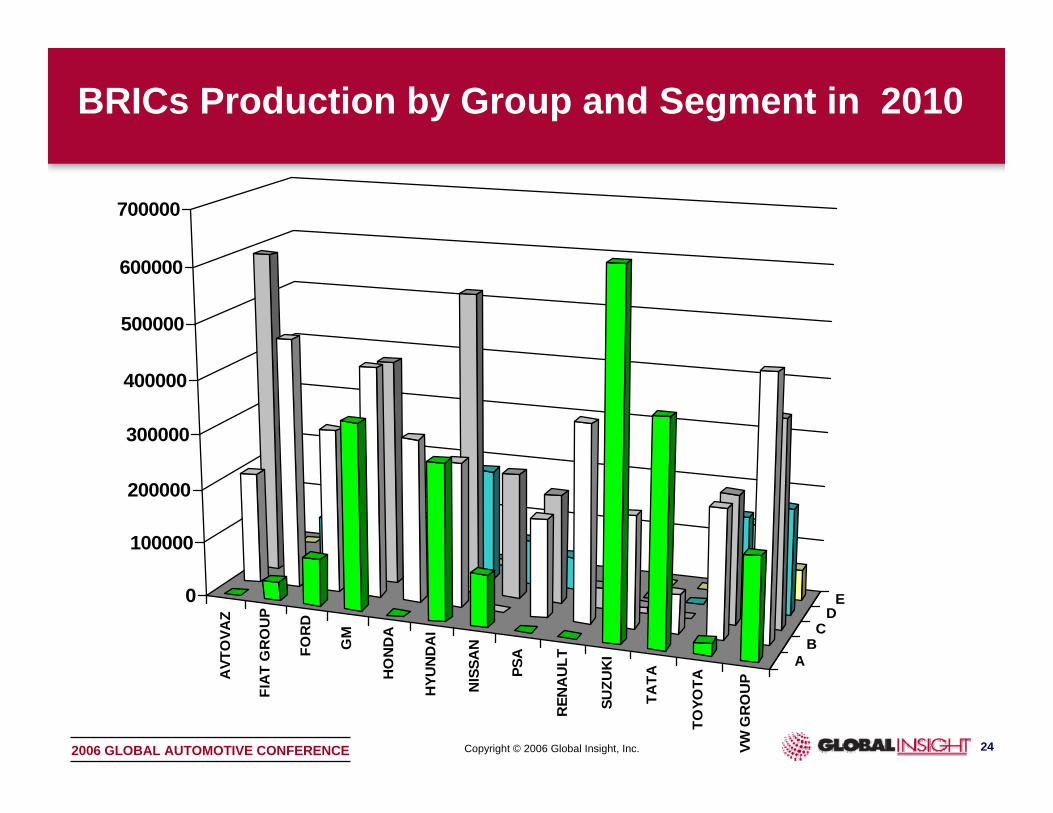
BRICs Production by Group and Segment in 2010
AVT
OVA
Z
FIA
T G
RO
UP
FOR
D
GM
HO
ND
A
HYU
ND
AI
NIS
SAN
PSA
REN
AU
LT
SUZU
KI
TATA
TOYO
TA
VW G
RO
UP
AB
CD
E0
100000
200000
300000
400000
500000
600000
700000
Copyright © 2006 Global Insight, Inc. 252006 GLOBAL AUTOMOTIVE CONFERENCE
• BRICs are the largest countries among D-C markets – but not the only ones
• Total demand growth is impressive but weighted to China
• Closed markets yield:– Ongoing and strong demand differences
• Segmentation, bodystyle, pricing and powertrain differences willremain
– Fragmented and low volume production across several markets
• A multitude of “world cars” will evolve reflecting company differences and objectives
• These cars will still be among the most successful models
Summary

Thank You
Tim ArmstrongAssociate Director, Eastern Europe & Middle East and Africa
E-mail: [email protected]