BOVESPA: BEEF3; Bloomberg: BEEF3.BZ; Reuters: BEEF3 · 11 am (US EST) Tel: +1 (412) 858-4600...
19
Barretos, August 14, 2009 – Minerva (BOVESPA: BEEF3; Bloomberg: BEEF3.BZ; Reuters: BEEF3.SA), one of the leaders in Brazil in the production and sale of fresh beef, leather and live cattle, announces today its results for the second quarter of 2009 (2Q09). Except where stated otherwise, the financial and operating information in this release is presented in BRGAAP and Brazilian real (R$). Minerva's 2Q09 results confirm the company's strong revenue growth and stable operating margins. Net Revenue of R$641.4 million, up 10.9% on 1Q09 revenue and 12.7% in relation to 2Q08. Fresh beef export volume up 20.5% against 1Q09, with Minerva’s market share reaching 17.1%, expanding 0.7 p.p. on the previous quarter. EBITDA of R$44.8 million, growing 36.5% in relation to 1Q09, with EBITDA margin expansion of 1.3 p.p., reflecting the resumption of exports, a more profitable product mix, the recent rationalization of capacity in the industry and the initial maturation of Minerva's investments in 2008. Capacity utilization remains at record levels in 2Q09, at around 80%. In late June, Minerva re-inaugurated the expansion of its plant in Araguaína, Tocantins, with daily slaughter capacity of 800 head and monthly deboning capacity of 1,600 tons (1,680 head/day), in line with its strategy of maintaining high levels of operational flexibility. Net Income rose significantly in relation to 1Q09, due to the combination of better operating results in the quarter and the impact of foreign exchange gains on the financial result. Foreign exchange variation also had a positive impact on the Company’s debt, of which approximately 70% is denominated in USD. Main Indicators (R$ million) 2Q09 1Q09 Var. % 2Q08 Var. % Jun09* Jun08* Var. % Heads of Cattle Slaughters (thousands) 314.1 279.7 12.3% 286.0 9.8% 1,094.6 1,020.7 7.2% Sales Volume (thousand tons) 66.5 63.1 5.3% 73.7 -9.9% 245.3 255.7 -4.0% Gross Revenue 677.8 629.3 7.7% 620.5 9.2% 2,495.2 2,045.5 22.0% Domestic Market 189.9 205.0 -7.4% 228.2 -16.8% 834.1 706.0 18.1% Export Market 487.9 424.4 15.0% 392.3 24.4% 1,661.1 1,339.4 24.0% Net Revenue 641.4 578.3 10.9% 569.1 12.7% 2,309.6 1,883.3 22.6% EBITDA 44.8 32.8 36.5% 47.0 -4.6% 147.1 149.9 -1.9% EBITDA Margin (%) 7.0% 5.7% 1.3 p.p 8.3% -1.3 p.p 6.4% 8.0% -1.6 p.p Adjusted Net Income (loss) 56.9 1.0 5,802.4% 19.4 194.0% (177.0) 29.9 ns Net Margin (%) 8.9% 0.2% 8.7 p.p 3.4% 5.5 p.p -7.7% 1.6% -9.5 p.p * In the last 12 months Minerva (BEEF3) Price on 8/13/09: R$ 5.43 Market Cap: R$ 407 million 75,000,000 Shares Free Float – 31.8% Conference Calls Portuguese August 18, 2009 10 am (Brasília time) 9 am (US EST) Tel: +55 (11) 2101-4848 Replay: +55 (11) 2101-4848 Code: Minerva English August 18, 2009 12 pm (Brasília time) 11 am (US EST) Tel: +1 (412) 858-4600 Replay: +1 (877) 344-7529 +1 (412) 317-0088 Code: 432916# IR Contacts Fernando Galletti CEO and IRO Eduardo Puzziello IR Superintendent Henrique Ribas IR Analyst Phone: +55 (17) 3321-3355 [email protected] 2Q09 HIGHLIGHTS
-
Upload
vuongkhanh -
Category
Documents
-
view
213 -
download
0
Transcript of BOVESPA: BEEF3; Bloomberg: BEEF3.BZ; Reuters: BEEF3 · 11 am (US EST) Tel: +1 (412) 858-4600...

Barretos, August 14, 2009 – Minerva (BOVESPA: BEEF3; Bloomberg: BEEF3.BZ; Reuters: BEEF3.SA), one of the leaders in Brazil in the production and sale of fresh beef, leather and live cattle, announces today its results for the second quarter of 2009 (2Q09). Except where stated otherwise, the financial and operating information in this release is presented in BRGAAP and Brazilian real (R$).
Minerva's 2Q09 results confirm the company's strong revenue growth and stable operating margins.
Net Revenue of R$641.4 million, up 10.9% on 1Q09 revenue and 12.7% in relation to 2Q08. Fresh beef export volume up 20.5% against 1Q09, with Minerva’s market share reaching 17.1%, expanding 0.7 p.p. on the previous quarter.
EBITDA of R$44.8 million, growing 36.5% in relation to 1Q09, with EBITDA margin expansion of 1.3 p.p., reflecting the resumption of exports, a more profitable product mix, the recent rationalization of capacity in the industry and the initial maturation of Minerva's investments in 2008.
Capacity utilization remains at record levels in 2Q09, at around 80%. In late June, Minerva re-inaugurated the expansion of its plant in Araguaína, Tocantins, with daily slaughter capacity of 800 head and monthly deboning capacity of 1,600 tons (1,680 head/day), in line with its strategy of maintaining high levels of operational flexibility.
Net Income rose significantly in relation to 1Q09, due to the combination of better operating results in the quarter and the impact of foreign exchange gains on the financial result. Foreign exchange variation also had a positive impact on the Company’s debt, of which approximately 70% is denominated in USD.
Main Indicators (R$ million) 2Q09 1Q09 Var. % 2Q08 Var. % Jun09* Jun08* Var. %
Heads of Cattle Slaughters (thousands) 314.1 279.7 12.3% 286.0 9.8% 1,094.6 1,020.7 7.2%
Sales Volume (thousand tons) 66.5 63.1 5.3% 73.7 -9.9% 245.3 255.7 -4.0%
Gross Revenue 677.8 629.3 7.7% 620.5 9.2% 2,495.2 2,045.5 22.0%
Domestic Market 189.9 205.0 -7.4% 228.2 -16.8% 834.1 706.0 18.1%
Export Market 487.9 424.4 15.0% 392.3 24.4% 1,661.1 1,339.4 24.0%
Net Revenue 641.4 578.3 10.9% 569.1 12.7% 2,309.6 1,883.3 22.6%
EBITDA 44.8 32.8 36.5% 47.0 -4.6% 147.1 149.9 -1.9%
EBITDA Margin (%) 7.0% 5.7% 1.3 p.p 8.3% -1.3 p.p 6.4% 8.0% -1.6 p.p
Adjusted Net Income (loss) 56.9 1.0 5,802.4% 19.4 194.0% (177.0) 29.9 ns
Net Margin (%) 8.9% 0.2% 8.7 p.p 3.4% 5.5 p.p -7.7% 1.6% -9.5 p.p
* In the last 12 months
Minerva (BEEF3)
Price on 8/13/09: R$ 5.43
Market Cap: R$ 407 million
75,000,000 Shares
Free Float – 31.8%
Conference Calls
Portuguese
August 18, 2009 10 am (Brasília time)
9 am (US EST) Tel: +55 (11) 2101-4848
Replay: +55 (11) 2101-4848 Code: Minerva
English
August 18, 2009 12 pm (Brasília time)
11 am (US EST) Tel: +1 (412) 858-4600
Replay: +1 (877) 344-7529 +1 (412) 317-0088
Code: 432916#
IR Contacts
Fernando Galletti
CEO and IRO
Eduardo Puzziello
IR Superintendent
Henrique Ribas
IR Analyst
Phone: +55 (17) 3321-3355 [email protected]
2Q09 HIGHLIGHTS

2Q09 Results
2
Last year we opted to follow a conservative strategy focused on the long term and structured for organic growth, with investments in capacity expansions imparting greater operational flexibility, in improvements in plant productivity and in increased diversification towards higher value added products through a cooked frozen plant, the Minerva Dawn Farms joint venture. The numbers reported today show that our strategy has already begun to bear fruit and that the investments will gradually reach full maturity. The growth in revenue in the last 12 months of 22% over the previous 12-month period, the expansion in operating margins in relation to previous quarters and the stability in capacity utilization at high levels, reaching 80% (the highest in the industry), are features that should remain in the coming quarters and are products of the comprehensive actions the company opted to implement. After a period of severe turbulence in international markets, which affected the dynamics of many industries, including ours, we believe that the second quarter of this year was a water shed and that, already in this second half of the year, a long period began of revenue growth accompanied by expansion in operating and financial margins. In addition, we continued our process of financial deleveraging through higher operating cash generation, the substitution of onerous debt and the incorporation of more robust operating data. This process will accelerate in the latter half of the year, fueled by the maturation of the substantial investments made last year. Our exports continued to diversify geographically, benefiting our operations with lower concentration and dependence on specific markets. We continued to implement our commercial strategy of broader coverage as well as exposure in regions less affected by the global financial crisis, such as the Middle East and North Africa. Furthermore, the positive developments in fresh beef exports to the European Union continued, reinforcing our view of gradual improvement in this market. In addition, the signals coming out of the federal government on the studies to change tax rules for the domestic market should lead to a higher level of formal practices in the meatpacking industry. We support a conservative tax policy and will benefit directly from reductions in the PIS/Cofins tax rate in the production chain and the monetization of credits for these taxes, in the event these changes indeed are approved. Last, but not least, the second quarter of 2009 was also marked by environmental issues in the Legal Amazon region. We acted proactively by establishing a code of conduct for our raw material suppliers located in the state of Pará, the main region involved in this matter, confirming our policy to support environmental preservation of the Amazon Rainforest and compliance with environmental regulations. In parallel, we strengthened our multi-department team focused on long-term environmental, social and economic sustainability projects – called Minerva Green – since we believe in and support the excellent efforts made by Brazil's government in recent decades to transform Amazonia into a viable and economically sustainable region.
Fernando Galletti de Queiroz, CEO
Message from Management

2Q09 Results
3
Export Market According to Brazil’s Foreign Trade Secretariat (SECEX), Brazilian fresh beef exports in 2Q09 totaled 250,100 tons, or US$771.3 million, representing increases of 22% and 31% in volume and revenue, respectively, in relation to 1Q09. Russia continued to be the main destination, accounting for 30% of the country's exports. The average fresh beef price in USD rose 7.4%, partially offsetting the 10.3% depreciation in the average USD exchange rate in the period. In relation to the second quarter of 2008, fresh beef volume and revenue registered declines of 7% and 24%, respectively, which were accompanied by an 18% decrease in the average price to US$3,084/ton.
Fresh Beef Exports and Revenue Destination of Brazil’s Fresh Beef Exports – 2Q09
Source: SECEX, prepared by Minerva
June registered a solid recovery in fresh beef export volume, which grew by 9.3% in relation to June 2008, nearing pre-crisis levels. Exports will continue to recover as farms gradually receive ERAS certification, with 1,279 farms currently holding this certification qualifying them to export to the EU, and potentially benefitting from a rebuilding of inventories in Russia, which is still working below the buffer level. The return of markets such as Chile and European countries, which are traditional importers of Brazilian beef, bodes well for the industry in the medium and long terms.
Fresh Beef Volume Average Fresh Beef Price Source: SECEX, prepared by Minerva
Farms with ERAS certification - Brazil
Source: European Commission, prepared by Minerva
Brazil – Industry Overview
349.3 349.4 306.6 280.5 252.7 269.5 293.1 207.5 204.7
250.1
847.3 895.5 860.1 882.8 891.6
1,018.1
1,261.8
834.7
588.0 771.3
2,426 2,563 2,805 3,147
3,528 3,778
4,305 4,023
2,872 3,084
1Q07 2Q07 3Q07 4Q07 1Q08 2Q08 3Q08 4Q08 1Q09 2Q09
Thousand Tonnes US$ Million Average Price USD
RUSSIA, 29.5%
EGYPT, 17.7%
HONG KONG, 9.8%
ARGELIA, 6.6%
LIBIA, 2.9%
ISRAEL, 2.2%
IRAN, 5.6%
SAUDI ARABIA, 3.6%
ITALY, 3.5%
OTHER, 18.6%
91.9
76.5
84.4
89.5
97.8
82.2
93.496.1
103.7
89.3
56.7 61.6
56.6
66.0
82.185.1
75.1
89.9
82.0
50
60
70
80
90
100
110
Volume 1000 ton
7.03
5.81
6.596.99
9.63
8.33
6.51 6.43 6.306.55
3.97
3.44
4.07
4.34
4.42
3.48
2.823.12
3.223.39
2.00
2.50
3.00
3.50
4.00
4.50
5.00
1.00
2.00
3.00
4.00
5.00
6.00
7.00
8.00
9.00
10.00
R$/Kg US$/Kg
106 95 95 84 89 123223 252
488574
633
789 820 862963
1,019
1,2191,279

2Q09 Results
4
Domestic Market
Finished Cattle - Average Price (R$) (Arroba ~ 15kg)
Source: ESALQ, prepared by Minerva
The average price of Brazilian finished cattle decreased by 1.1% in 2Q09 compared with 1Q09, to R$80.1/@, and declined by 3.6% against 2Q08. The lower arroba price basically reflects the better supply and demand dynamics for finished cattle following the contraction in active capacity in the industry and the alignment of raw material prices with the average beef prices in the domestic and international markets. Finished cattle prices were also influenced by the onset of the dry season, when producers typically increase supply to prevent finished cattle from losing weight because of dry pastures.
Brazil Slaughter Volume (thousand head of cattle)
Source: MAPA, prepared by Minerva
Figures released by the Ministry of Agriculture, Livestock and Supply (MAPA) show that total slaughter in Brazil was in line with 1Q09, since active capacity in the country's meatpacking industry remained at reduced levels. The increase in formality occurring in the industry is a determinant factor in slaughter volume, which we expect to remain in line with current levels for the rest of the year.
54.9 56.2 62.5
69.8 75.2
83.1
91.2 87.3
81.0 80.1
1Q07 2Q07 3Q07 4Q07 1Q08 2Q08 3Q08 4Q08 1Q09 2Q09
1,883
1,956
1,834 1,834
1,771
1,508
1,619
1,720
1,575
1,719
1,652
1,743
1,610

2Q09 Results
5
31.4%
5.3%
50.7%
12.6%
24.9%
3.1%
51.1%
20.9%
Beef DM Other DM Beef EM Other EM
2Q08 2Q09
Consolidated Gross Sales Revenue
R$ million 2Q09 1Q09 Var. % 2Q08 Var. % Jun09* Jun08* Var. %
Gross Revenue 677.8 629.3 7.7% 620.5 9.2% 2,495.2 2,045.5 22.0%
Domestic Market 189.9 205.0 -7.4% 228.2 -16.8% 834.1 706.0 18.1%
% Gross Revenue 28.0% 32.6% -4.6 p.p 36.8% -8.8 p.p 33.4% 34.5% -1.1 p.p
Beef Division – DM1 169.1 180.5 -6.3% 195.1 -13.3% 738.3 583.4 26.5%
Other 20.8 24.5 -15.0% 33.1 -37.0% 95.8 122.6 -21.9%
Export Market 487.9 424.4 15.0% 392.3 24.4% 1,661.1 1,339.4 24.0%
% Gross Revenue 72.0% 67.4% 4.6 p.p 63.2% 8.8 p.p 66.6% 65.5% 1.1 p.p
Beef Division – EM1 346.2 293.5 17.9% 314.3 10.1% 1,187.3 976.1 21.6%
Other 141.7 130.8 8.3% 78.0 81.7% 473.8 363.3 30.4%
1 Includes Paraguay and affiliated companies
* In the last 12 months
In 2Q09, consolidated gross sales revenue recorded growth of 7.7% and 9.2% against 1Q09 and 2Q08, respectively, reaching R$677.8 million, fueled by exports, which increased by 15.0% quarter on quarter and 24.4% in the annual comparison. The beef division registered strong growth in the export market of 17.9% in relation to 1Q09 and 10.1% against the same quarter of 2008. Beef exports accounted for 51.1% of overall sales in the quarter. Export revenue from the live cattle division posted strong growth, also contributing to overall revenue growth.
Breakdown of Consolidated Gross Sales Revenue (%)
Source: Minerva
Capacity utilization remained at 80% during 2Q09, near record levels. Consolidated production increased by approximately 25% in the quarter. In late June, Minerva re-inaugurated the expansion of its unit in Araguaína, Tocantins, with daily slaughter capacity of 800 head and monthly deboning capacity of 1,600 tons (1,680 head/day), in line with its strategy of maintaining high levels of operational flexibility.
Minerva – Analysis of Results

2Q09 Results
6
Capacity Utilization (%)
Source: Minerva
The charts below show the main destinations of Minerva’s exports in 2Q09 compared with the same quarter of 2008. The Middle East presented a substantial increase in its share of exports in relation to 2Q08, to 23.7%, figuring among those regions least affected by the global crisis. Minerva will continue its commercial strategy of increasing diversification into new markets with positive prospects, such as the Middle East, Africa and Asia.
Exports Breakdown (R$) – 2Q08
Exports Breakdown (R$) – 2Q09
Source: Minerva
Fresh beef sales to the European Union advanced 16.5% in the quarter, to R$42.9 million, surpassing the levels prior to January 2008, when the bloc imposed sanitary restrictions. Fresh beef exports to the EU accounted for 6.3% of the Company’s total sales, compared with 0.9% in 2Q08.
83%
56%
68%
74%
80%83%
2Q08 4Q08 1Q09 Apr-09 May-09 Jun-09
Europe3.7%
Eurasia50.7%
Middle East9.0%
Asia4.6%
Americas17.1%
Africa14.9%
Europe9.0%
Eurasia12.6%
Middle East23.7%
Asia15.0%
Americas24.0%
Africa10.1%
Others5.6%

2Q09 Results
7
Beef Division Brazil Gross sales revenue in the Brazilian beef division grew by 8.9% in relation to 1Q09 and fell by 3.4% compared with 2Q08, registering R$492.1 million in the quarter. Exports presented a positive performance, with revenue growth of 20.3% versus 1Q09 and 4.1% against 2Q08.
Total Revenue (R$ Million) 2Q09 1Q09 Var. % 2Q08 Var. % Jun09* Jun08* Var. %
Fresh Beef - EM 309.3 246.3 25.6% 302.0 2.4% 1,045.9 935.9 11.7%
Processed Beef – EM 1.1 12.5 -91.2% 4.2 -73.9% 20.5 8.1 153.1%
Others – EM 16.9 13.2 28.5% 8.1 108.2% 50.1 32.1 56.3%
Sub-Total – EM 327.3 272.0 20.3% 314.3 4.1% 1,116.4 976.1 14.4%
Fresh Beef - DM 136.0 157.9 -13.9% 164.7 -17.4% 632.7 505.5 25.2%
Processed Beef – DM 1.7 1.2 37.2% 2.9 -42.9% 10.0 10.4 -4.1%
Others – DM 27.1 20.5 32.3% 27.4 -1.2% 92.2 72.1 27.9%
Sub-Total – DM 164.8 179.7 -8.3% 195.1 -15.5% 734.9 588.0 25.0%
Total 492.1 451.7 8.9% 509.4 -3.4% 1,851.3 1,564.0 18.4%
Volume (Thousand Tons) 2Q09 1Q09 Var. % 2Q08 Var. % Jun09* Jun08* Var. %
Fresh Beef - EM 40.5 33.6 20.5% 43.0 -5.8% 134.2 149.4 -10.2%
Processed Beef – EM 0.1 1.0 -88.5% 0.6 -79.1% 1.9 1.1 67.8%
Others – EM 3.1 2.4 28.3% 1.9 60.2% 9.6 8.6 11.0%
Sub-Total – EM 43.7 37.1 17.9% 45.5 -3.9% 145.7 159.2 -8.5%
Fresh Beef - DM 20.3 24.3 -16.4% 25.7 -20.8% 91.9 88.3 4.2%
Processed Beef – DM 0.2 0.1 28.8% 0.4 -59.8% 1.2 1.7 -26.7%
Others – DM 2.2 1.6 40.3% 2.2 4.2% 6.7 6.5 2.8%
Sub-Total – DM 22.8 26.1 -12.7% 28.3 -19.5% 99.9 96.5 3.5%
Total 66.5 63.1 5.3% 73.7 -9.9% 245.5 255.7 -4.0%
Avarage Price – EM (US$/Kg) 2Q09 1Q09 Var. % 2Q08 Var. % Jun09* Jun08* Var. %
Fresh Beef - EM 3.68 3.17 16.2% 4.24 -13.2% 3.75 3.53 6.4%
Processed Beef – EM 4.45 5.23 -14.8% 4.47 -0.4% 5.12 3.97 29.0%
Others – EM 2.62 2.35 11.6% 2.53 3.8% 2.51 2.09 20.4%
Total 3.61 3.17 13.7% 4.17 -13.5% 3.69 3.45 6.9%
USD Average (source: BACEN) 2.07 2.31 -10.3% 1.66 25.2% 2.08 1.78 17.0%
Avarage Price – EM (R$/Kg) 2Q09 1Q09 Var. % 2Q08 Var. % Jun09* Jun08* Var. %
Fresh Beef - EM 7.64 7.33 4.2% 7.03 8.7% 7.80 6.26 24.5%
Processed Beef – EM 9.23 12.08 -23.6% 7.40 24.7% 10.63 7.05 50.8%
Others – EM 5.44 5.43 0.2% 4.18 29.9% 5.22 3.71 40.8%
Total 7.49 7.34 2.0% 6.91 8.3% 7.66 6.13 25.0%
Avarage Price – DM (R$/Kg) 2Q09 1Q09 Var. % 2Q08 Var. % Jun09* Jun08* Var. %
Fresh Beef - DM 6.69 6.49 3.0% 6.41 4.3% 6.88 5.73 20.2%
Processed Beef – DM 9.53 8.95 6.5% 6.70 42.1% 8.16 6.24 30.8%
Others – DM 12.09 12.83 -5.7% 12.75 -5.2% 13.77 11.06 24.5%
Total 7.24 6.89 5.0% 6.90 4.9% 7.36 6.10 20.7%
* In the last 12 months EM – Export Market, DM – Domestic Market

2Q09 Results
8
Fresh beef exports recovered in the quarter, with volumes climbing 20.5% from 1Q09 and the average price in BRL rising 4.2% (+16.2% in USD) to 7.64 R$/kg, while the average Brazilian price in BRL decreased by 3.8% (+7.4% in USD), according to data from SECEX. Despite the 5.8% reduction in fresh beef export volume compared with 2Q08, in this comparison the average export price in BRL improved by 8.7% (-13.2% in USD), while fresh beef export revenue rose by 2.4%. Fresh Beef Sales Volume Average Fresh Beef Price
Source: Minerva
Fresh beef sales volume in the domestic market contracted by 16.4% and 20.8% against 1Q09 and 2Q08, respectively, while the average price improved by 3.0% in comparison with 1Q09 and by 4.3% against 2Q08. The lower variation in average price in the domestic market influenced the Company’s decision to reduce its exposure to the domestic market and increase its exports. Paraguay The fresh beef operations in Paraguay recorded consolidated net revenue growth of 15.0% in 2Q09 versus 1Q09, to R$28.4 million. This unit's performance has proven positive, with its capacity utilization increasing from 60% in 1Q09 to 80% in 2Q09 and consolidated margins surpassing the level in 1Q09. Other In relation to 1Q09, export revenue from the Company’s other divisions registered growth of 8.3%, while domestic revenue from other divisions fell by 15.0%. This result mainly reflects the exports of live cattle, which were offset by sales in the leather division, given the weak performance of the principal industries with demand for this product, such as the automotive and furniture sectors. The operational startup of the Minerva Dawn Farms joint venture, a cooked frozen plant, performed in line with the established timetable, with an increase in capacity utilization, as expected, and is already processing beef and chicken protein for clients in the food services sgment (i.e., fast food chains). In 2Q09, MDF has already received its first certifications from the Brazilian government to export its production and has received higher than expected demand from the domestic market.
Operational and Financial Data 2Q09 1Q09 Var. %
Total Revenues 28.5 24.7 15.2%
Sub-Total – DM 4.3 3.2 35.7%
Sub-Total – EM 24.1 21.5 12.2%
Net Revenue 28.4 24.7 15.0%
10.913.5
18.8
22.921.0
25.7 27.4
19.8
24.3
20.3
40.5
37.735.7 34.7 36.0
43.039.1
21.0
33.640.5
9
14
19
24
29
34
39
44
49
1Q07 2Q07 3Q07 4Q07 1Q08 2Q08 3Q08 4Q08 1Q09 2Q09
Volume DM (tsd ton) Volume EM (tsd ton)
4.84.5 4.8
5.5 5.7
6.46.8
7.9
6.5
6.7
5.4 5.5 5.5
6.1 6.3
7.0
8.0
9.3
7.3 7.6
3.0
4.0
5.0
6.0
7.0
8.0
9.0
10.0
1Q07 2Q07 3Q07 4Q07 1Q08 2Q08 3Q08 4Q08 1Q09 2Q09
R$/Volume - DM R$/Volume EM

2Q09 Results
9
Consolidated Net Sales Revenue
Net revenue in 2Q09 expanded by 10.9% and 12.7% on 1Q09 and 2Q08, respectively, to R$641.4 million. The increase in net revenue manly reflects the resumption of exports, higher capacity utilization and improvement in the product mix. Net revenue in the last 12 months was 22.6% higher year over year.
R$ Million 2Q09 1Q09 Var. % 2Q08 Var. % Jun09* Jun08* Var. %
Gross Revenue 677.8 629.3 7.7% 620.5 9.2% 2,495.2 2,045.5 22.0%
Sale Tax and Returns (36.4) (51.0) -28.6% (51.4) -29.1% (185.6) (162.2) 14.4%
Net Revenue 641.4 578.3 10.9% 569.1 12.7% 2,309.6 1,883.3 22.6%
* In the last 12 months
Net Revenue
Source: Minerva
Cost of Goods Sold COGS were R$530 million in 2Q09, increasing by 10.6% in relation to 1Q09 and by 14.8% in relation to 2Q08. With the 1.1% decline in the average arroba price against 1Q09, raw materials accounted for 81.9% of COGS in the quarter, versus 83.2% in 1Q09. Gross Income
R$ Million 2Q09 1Q09 Var. % 2Q08 Var. % Jun09* Jun08* Var. %
Net Revenue 641.4 578.3 10.9% 569.1 12.7% 2,309.6 1,883.3 22.6%
Cost of Goods Sold (530.3) (479.4) 10.6% (462.1) 14.8% (1,925.2) (1,517.3) 26.9%
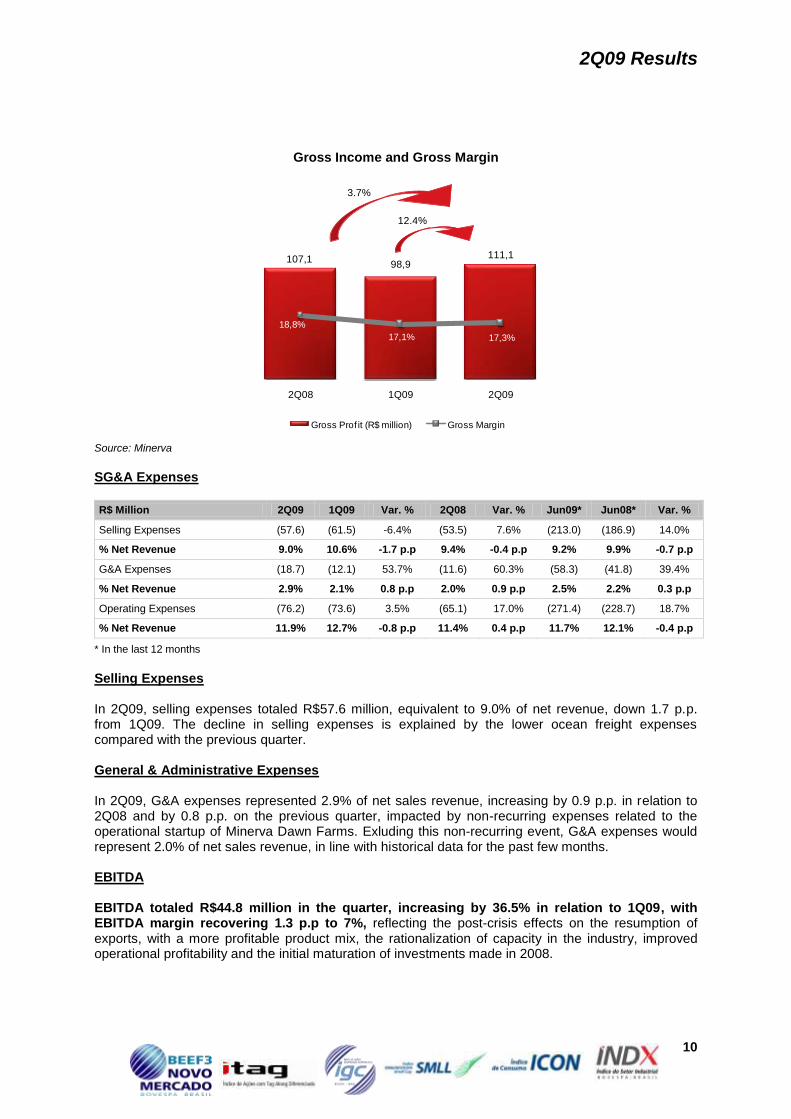
Gross Profit 111.1 98.9 12.4% 107.1 3.8% 384.4 365.9 5.1%
Gross Margin 17.3% 17.1% 0.2 p.p 18.8% -1.5 p.p 16.6% 19.4% -2.8 p.p
* In the last 12 months
Gross income totaled R$111.1 million in the quarter, representing growth of 12.4% versus 1Q09 and of 3.8% in relation to 2Q08, with gross margin of 17.3%, expanding slightly from the previous quarter (0.2 p.p.) due to the combination of stable raw material prices and the initial impacts from the investments in production lines made in the past year.
569.1 578.3
641.4
2Q08 1Q09 2Q09
12.7%
10.9%
2Q09 Results
10
Gross Income and Gross Margin
Source: Minerva
SG&A Expenses
R$ Million 2Q09 1Q09 Var. % 2Q08 Var. % Jun09* Jun08* Var. %
Selling Expenses (57.6) (61.5) -6.4% (53.5) 7.6% (213.0) (186.9) 14.0%
% Net Revenue 9.0% 10.6% -1.7 p.p 9.4% -0.4 p.p 9.2% 9.9% -0.7 p.p
G&A Expenses (18.7) (12.1) 53.7% (11.6) 60.3% (58.3) (41.8) 39.4%
% Net Revenue 2.9% 2.1% 0.8 p.p 2.0% 0.9 p.p 2.5% 2.2% 0.3 p.p
Operating Expenses (76.2) (73.6) 3.5% (65.1) 17.0% (271.4) (228.7) 18.7%
% Net Revenue 11.9% 12.7% -0.8 p.p 11.4% 0.4 p.p 11.7% 12.1% -0.4 p.p
* In the last 12 months
Selling Expenses In 2Q09, selling expenses totaled R$57.6 million, equivalent to 9.0% of net revenue, down 1.7 p.p. from 1Q09. The decline in selling expenses is explained by the lower ocean freight expenses compared with the previous quarter. General & Administrative Expenses In 2Q09, G&A expenses represented 2.9% of net sales revenue, increasing by 0.9 p.p. in relation to 2Q08 and by 0.8 p.p. on the previous quarter, impacted by non-recurring expenses related to the operational startup of Minerva Dawn Farms. Exluding this non-recurring event, G&A expenses would represent 2.0% of net sales revenue, in line with historical data for the past few months. EBITDA EBITDA totaled R$44.8 million in the quarter, increasing by 36.5% in relation to 1Q09, with EBITDA margin recovering 1.3 p.p to 7%, reflecting the post-crisis effects on the resumption of exports, with a more profitable product mix, the rationalization of capacity in the industry, improved operational profitability and the initial maturation of investments made in 2008.
107,198,9
111,1
18,8%
17,1% 17,3%
2Q08 1Q09 2Q09
Gross Prof it (R$ million) Gross Margin
3.7%
12.4%

2Q09 Results
11
EBITDA (R$ million) and EBITDA Margin (%) Source: Minerva
R$ Million 2Q09 1Q09 Var. % 2Q08 Var. % Jun09* Jun08* Var. %
Net (Loss) Income 56.9 1.0 5,902.4% 19.4 194.0% (177.0) 2.1 ns
(+) Deferred Income tax 2.8 (11.1) ns 10.2 ns (26.9) 32.2 -183.6%
(+) IPO Expenses - - ns - ns - 40.2 ns
(+) Other Operating Revenue - 0.6 ns - ns (0.0) 0.4 ns
(+) Financial income, net (24.7) 34.8 ns 12.4 ns 317.1 62.9 404.3%
(+) Depreciation and Amortiz. 9.9 7.5 31.1% 5.1 93.6% 34.0 12.1 180.7%
EBITDA 44.8 32.8 36.5% 47.0 -4.6% 147.1 149.9 -1.9%
EBITDA Magin 7.0% 5.7% 1.3 p.p 8.3% -1.3 p.p 6.4% 8.0% -1.6 p.p
* In the last 12 months
EBIT (Operating Income) EBIT, or operating income before financial expenses, was R$34.9 million in 2Q09, increasing by 38.1% against 1Q09, for operating margin of 5.4%, up 1.1 p.p. on the same comparison basis.
R$ Million 2Q09 1Q09 Var. % 2Q08 Var. % Jun09* Jun08* Var. %
EBITDA 44.8 32.8 36.5% 47.0 -4.6% 147.1 149.9 -1.9%
Depreciation 9.9 7.5 31.1% 5.1 93.6% 34.0 12.1 180.7%
EBIT 34.9 25.3 38.1% 41.9 -16.6% 113.1 137.8 -17.9%
EBIT Margin 5.4% 4.4% 1.1 p.p 7.4% -1.9 p.p 4.9% 7.3% -2.4 p.p
* In the last 12 months
Financial Result Minerva registered net financial income of R$24.7 million in 2Q09, reflecting the positive impacts on foreign-denominated debt from the 10.3% depreciation in the average USD exchange rate during 2Q09. The Company does not hedge its long-term debt, given the high costs involved with protecting the bond issue due in 2017, and the fact that its exports provide a natural hedge. R$ Million 2Q09 1Q09 Var. % 2Q08 Var. % Jun09* Jun08* Var. %
Net Financial Result 24.7 (34.8) -171.1% (12.4) ns (317.1) (53.8) 489%
Net Interest (28.3) (13.9) 103.2% (11.1) 155.2% (82.9) (35.9) 131%
* In the last 12 months
47.0
32.8
44.8
8.3%
5.7%
7.0%
2Q08 1Q09 2Q09
EBITDA (R$ million) EBITDA Margin
-4.6%
36.5%

2Q09 Results
12
Net Income The Company registered net income of R$56.9 million in 2Q09, up significantly in relation to 1Q09, reflecting the Company’s better operating performance and the effects from foreign exchange variation on foreign-denominated debt (non-cash accounting effect).
R$ Million 2Q09 1Q09 Var. % 2Q08 Var. % Jun09* Jun08* Var. %
Net (Loss) Income 56.9 1.0 5,802.4% 19.4 ns (177.0) 2.1 ns
(+) IPO Expenses - - - - - - 40.2 -
(+) BOND Expenses - - - - - - 1.8 -
IPO Corp Tax Benefits - - - - - - (13.7) -
BOND Corp Tax Benefits - - - - - - (0.6) -
Net Income 56.9 1.0 5,802.4% 19.4 194.0% (177.0) 29.9 ns
Net Margin (%) 8.9% 0.2% 8.7 p.p 3.4% 5.5 p.p -7.7% 1.6% -9.3 p.p
* In the last 12 months

2Q09 Results
13
In 2Q09, Minerva maintained its high cash balance and a debt profile with maturities concentrated in the long term. On June 30, 2009, the company held cash and cash equivalents of R$405.7 million, equivalent to more than two months of input purchases, in line with one of the main pillars of our financial policy. Minerva continues to invest its funds in conservative financial instruments at solid institutions, and on the same date, the percentage of cash and cash equivalents denominated in USD waas approximately 21%.
R$ Million 2Q09 1Q09 Var. % 2Q08 Var. %
Short Term Debt 455.0 392.2 16.0% 165.4 175.1%
% Short Term Debt 33.9% 27.2% 6.7 p.p 23.6% 10.3 p.p
Local Currency 189.2 111.1 70.3% 17.9 957.1%
Foreign Currency 265.8 281.1 -5.4% 147.5 80.2%
Long Term Debt 888.1 1.049.7 -15.4% 535.1 66.0%
% Long Term Debt 66.1% 72.8% -6.7 p.p 76.4% -10.3 p.p
Local Currency 242.4 269.9 -10.2% 21.4 1,032.7%
Foreign Currency 645.7 779.8 -17.2% 513.7 25.7%
Total Debt 1,343.1 1,441.9 -6.9% 700.5 91.7%
Local Currency 431.6 381.0 13.3% 39.3 998.2%
Foreign Currency 911.5 1,060.9 -14.1% 661.2 37.9%
Cash and Cash Equivalents (405.7) (456.1) -11.1% (251.3) 61.4%
Net Debt 937.4 985.8 -4.9% 449.1 108.7%
Net Debt/EBITDA 6.37 X 6.57 X -0.20 X 2.97 X 3.40 X
Approximately 66% of debt maturities were concentrated in the long term, corresponding to net debt of R$937 million. The increase in net debt in relation to 2Q08 mainly reflects the impact of FX variation (end-of-period FX variation between 2Q09 and 2Q08 of -23%) on foreign-denominated debt, which represented 68% of total debt. The ratio of net debt to EBITDA in the last 12 months declined by 0.20x to 6.37x in the quarter. However, it is important to note that the Company remains in compliance with the provisions of the prospectus for the bond issue maturing in 2017. Liquidity Ratios
Minerva 2Q09 1Q09 2Q08
Current ratio 1.68 2.05 2.87
Immediate ratio 0.60 0.80 0.66
Competitor A 2Q09 1Q09 2Q08
Current ratio 1.58 1.47 1.77
Immediate ratio 0.52 0.36 0.60
Competitor B 2Q09 1Q09 2Q08
Current ratio 1.73 1.61 1.71
Current ratio 0.46 0.41 0.45
The Company registered a current liquidity ratio of 1.68 and an immediate liquidity ratio of 0.60, which are among the best levels in the industry as the above table shows. Note Minerva’s more comfortable immediate liquidity position in relation to its two main competitors.
CAPITAL STRUCTURE

2Q09 Results
14
Short-term and Long-term Maturities The table below shows our debt by maturity in both domestic and foreign currency. Note the concentration of 29% of maturities in 2017.
LOCAL CURRENCY FOREIGN CURRENCY
1Q09 2Q09 1Q09 2Q09
2Q09 17,518 2Q09 48,853
3Q09 51,959 137,586 3Q09 32,371 45,092
4Q09 20,379 23,923 4Q09 140,293 101,651
1Q10 21,223 7,662 1Q10 59,593 62,714
2Q10 20,044 2Q10 56,359
2010 44,082 41,658 2010 80,249 58,087
2011 94,903 93,625 2011 106,113 100,336
2012 29,032 32,565 2012 68,513 55,122
2013 24,826 27,874 2013 82,855 45,635
2014 6,594 18,737 2014 9,840 -
2015 6,498 15,458 2015 3,184 -
2016 6,498 12,274 2016 - -
2017 57,474 198 2017 429,043 386,512
TOTAL 380,986 431,605 TOTAL 1,060,907 911,506
Minerva currently has R$215 million in financing lines contracted directly from development banks. The release of funds for this purpose occurs as the expenditures for these investments are substantiated, with R$89 million already disbursed during the first six months of 2009.

2Q09 Results
15
Investments in 2Q09 totaled R$41 million, of which approximately R$11 million was related to the incorporation of Lord Meat (Goianésia). Accordingly, the funds invested in capacity expansions at the units in Araguaína, the conclusion of improvements at the José Bonifácio unit, the conclusion of the expansions at the Palmeiras de Goiás unit, the conclusion of construction of the deboning area at the Rolim de Moura unit, and the installation of the freezing tunnel and expansions in Paraguay totaled R$30 million in 2Q09. In the first six months of 2009, excluding the R$11 million related to the merger of Lord Meat, we have already invested R$54 million in fixed assets.
Units Investments in 2Q09
Araguaína Conclusion of the slaughter capacity expansion to 840 head/day and construction of the deboning and related areas, such as the continuous freezing tunnel, cooling and storage rooms and rendering plant.
José Bonifácio In the final phase of installing improvements at the unit, such as the continuous freezing tunnel, improvements in the cooling system, new cafeteria and changing rooms and a new rendering plant.
Barretos Conclusion of expansion works at the Federal Inspection Service (SIF) facilities, cooling rooms for carcasses, construction of new cafeteria and adaptations to the sanitary entry.
Palmeiras de Goiás
Conclusion of the slaughter capacity expansion to 1,680 head/day, including the expansion of feed lots, inventory rooms, cooling rooms for carcasses and expansions in the rendering plant, industrial waste treatment station (ETE), drinking water treatment station (ETA) and other areas.
Asuncion Ongoing investments to expand storage capacity and the shipping area and acquisition of machinery for the slaughter and deboning area, improving the operational flow.
Rolim de Moura Conclusion of construction in the deboning area and support buildings, such as rendering plant, boiler, cooling system, cafeteria, changing rooms, ETE and ETA.
Batayporã
Ongoing investments in the final expansion phase to conclude installation of the continuous freezing tunnel, expansions in the palletizing and shipping areas, cafeteria, changing rooms, laundry facilities and sanitary envelope, and adjustments to the rendering system.
Goianésia Merger of Lord Meat.
INVESTMENTS
2Q09 Results
16
Environmental Conduct Procedure On July 8, 2009, Minerva announced new procedures for its suppliers located in the state of Pará, confirming Minerva’s policy to protect the Amazon Rainforest and comply with environmental regulations. The main changes include Minerva’s commitment not to acquire cattle from farms that: (1) are included on the list of banned areas and areas involved in slave labor practices published on the internet by IBAMA, Brazil’s environmental protection agency, and by the Ministry of Labor; and (2) are involved, following notification of the Company by the Federal Prosecutor’s Office, in judicial actions (criminal or civil) because of slave labor practices or that have received unfavorable court decisions related to invasion of indigenous lands and other agrarian conflicts (e.g., real estate fraud/illegal deforestation). Change in Newspaper Used for Legal Publications On July 24, 2009, following suspension of publication of the newspaper Gazeta Mercantil, Minerva announced its decision to publish its corporate documents in the newspaper O Estado de São Paulo, as well as in the state register Diário Oficial do Estado de São Paulo and in the newspaper Diário de Barretos. Proposal for a Capital Increase with Private Subscription In a meeting held on August 13, 2009, the Board of Directors approved the proposal for an increase in the limit of authorized capital provided for in the bylaws to more than 100 million common shares, which will be submitted to shareholders at an Extraordinary Shareholders’ Meeting in accordance with the respective Call Notice. Authorization of the increase in authorized capital will permit the subsequent approval by the Board of Directors of a capital increase through the issue for private subscription of common shares in the Company within this new limit of authorized capital.
Minerva S.A. is one of the leading producers and sellers of beef, leather and live cattle in Brazil, and is one of the country’s three largest exporters in the sector in terms of gross sales revenue, exporting to some 80 countries. The Company has daily slaughter capacity of 6,600 head of cattle and processing capacity of 1,430 tons of beef, equivalent to approximately 9,500 head of cattle. With a presence in the Brazilian states of São Paulo, Goiás, Tocantins, Mato Grosso do Sul as well as in Paraguay, Minerva operates seven slaughter and deboning plants, one tannery and five distribution centers. Minerva also operates in the food service segment through the joint venture Minerva Dawn Farms (MDF). In the 12 months through June 2009, Minerva recorded net sales revenue of R$2.5 billion, for growth of 22% on the same period a year earlier. This release contains forward-looking statements concerning the business outlook, operating and financial estimates and prospects for Minerva’s growth. These statements are merely projections and as such are based exclusively on management’s expectations for the Company concerning the future of the business and its continuous access to capital finance its business plan. These forward-looking statements depend materially on changes in market conditions, government regulations, pressures from competitors, and the performance of the industry and the Brazilian economy, among other factors, as well as the risks mentioned in the disclosure documents filed by the Company, and as such are subject to change without prior notice.
ABOUT MINERVA S.A.
SUBSEQUENTS EVENTS

2Q09 Results
17
ANNEX 1 - CONSOLIDATED INCOME STATEMENT
2Q09 1Q09 2Q08 2Q09X 1Q09
2Q09X 2Q08
Export Sales 487,923 422,084 32,349 15.6% 1408.3%
Domestic Sales 189,897 207,261 228,172 -8.4% -16.8%
Gross Sales Revenue 677,820 629,345 620,521 7.7% 9.2%
Sales taxes (36,429) (51,033) (51,397) -28.6% -29.1%
Net Sales Revenue 641,391 578,312 569,124 10.9% 12.7%
Cost of Goods Sold (530,251) 479,392 (462,073) -210.6% 14.8%
Gross Profit 111,140 98,920 107,051 12.4% 3.8%
Selling Expenses (57,559) (61,486) (53,504) -6.4% 7.6%
General and Administrative Expenses (18,665) (12,143) (11,646) 53.7% 60.3%
Financial Income (expenses), net 24,732 (34,774) (12,388) -155.3% -255.2%
Other Operating Revenues (expenses) - (649) - - -
Equity Accounting - - - - -
IPO Expenses - - - - -
Operating Revenue (Expenses) (51,492) (109,052) (77,538) -47.7% -26.5%
Operating Income 59,648 (10,132) 29,513 -634.4% 83.5%
Profit Before Income Tax 59,648 (10,132) 29,513 -634.4% 83.5%
Corporate Taxation - current (8,358) (258) (10,811) 3139.5% -22.7%
Corporate Taxation - deferred 5,593 11,348 650 -50.7% 760.5%
Minority Interests 16 6 - 166.7% ns
Net Income 56,899 964 19,352 5231.3% 165.6%
EBITDA 44,825 32,844 47,012 36.5% -4.7%
EBITDA Margin 7.0% 5.7% 8.3% 1.3 p.p -1.3 p.p
2Q09 Results
18
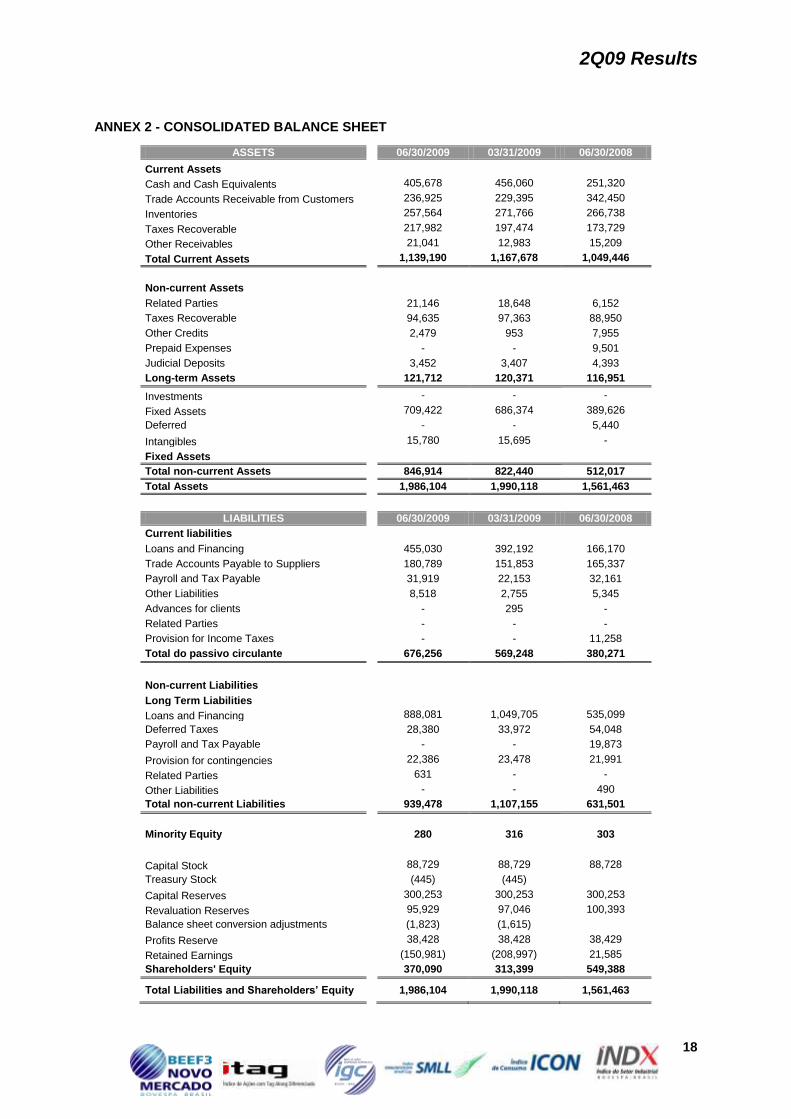
ANNEX 2 - CONSOLIDATED BALANCE SHEET
ASSETS 06/30/2009 03/31/2009 06/30/2008
Current Assets Cash and Cash Equivalents 405,678 456,060 251,320
Trade Accounts Receivable from Customers 236,925 229,395 342,450
Inventories 257,564 271,766 266,738
Taxes Recoverable 217,982 197,474 173,729
Other Receivables 21,041 12,983 15,209
Total Current Assets 1,139,190 1,167,678 1,049,446
Non-current Assets Related Parties 21,146 18,648 6,152
Taxes Recoverable 94,635 97,363 88,950
Other Credits 2,479 953 7,955
Prepaid Expenses - - 9,501
Judicial Deposits 3,452 3,407 4,393
Long-term Assets 121,712 120,371 116,951
Investments - - -
Fixed Assets 709,422 686,374 389,626
Deferred - - 5,440
Intangibles 15,780 15,695 -
Fixed Assets Total non-current Assets 846,914 822,440 512,017
Total Assets 1,986,104 1,990,118 1,561,463
LIABILITIES 06/30/2009 03/31/2009 06/30/2008
Current liabilities Loans and Financing 455,030 392,192 166,170
Trade Accounts Payable to Suppliers 180,789 151,853 165,337
Payroll and Tax Payable 31,919 22,153 32,161
Other Liabilities 8,518 2,755 5,345
Advances for clients - 295 -
Related Parties - - -
Provision for Income Taxes - - 11,258
Total do passivo circulante 676,256 569,248 380,271
Non-current Liabilities
Long Term Liabilities Loans and Financing 888,081 1,049,705 535,099
Deferred Taxes 28,380 33,972 54,048
Payroll and Tax Payable - - 19,873
Provision for contingencies 22,386 23,478 21,991
Related Parties 631 - -
Other Liabilities - - 490
Total non-current Liabilities 939,478 1,107,155 631,501
Minority Equity 280 316 303
Capital Stock 88,729 88,729 88,728
Treasury Stock (445) (445)
Capital Reserves 300,253 300,253 300,253
Revaluation Reserves 95,929 97,046 100,393
Balance sheet conversion adjustments (1,823) (1,615)
Profits Reserve 38,428 38,428 38,429
Retained Earnings (150,981) (208,997) 21,585
Shareholders' Equity 370,090 313,399 549,388
Total Liabilities and Shareholders’ Equity 1,986,104 1,990,118 1,561,463

2Q09 Results
19
ANNEX 3 - CONSOLIDATED CASH FLOW STATEMENT
Cash Flow 2009 2008
Cash Flow From Operating Activities
Net Income (Loss) 57,863 19,350
Adjustments to reconcile net income (loss)
and cash from operating activities:
Depreciation and Amortization 25,952 9,797
Gains on fixed asset disposals - 87
Increase in deferred taxes - temporary differences (16,194) (163)
Decrease in deferred tax liabilities - revaluation of assets (746) (748)
Equity accounting - -
Financial charges 62,579 25,809
Foreign Exchange Variation - Not Realized (173,808) (51,365)
Contingency allowances (684) 4,375
Variation of Operating Assets and Liabilities:
Receivable from customers (19,891) (149,584)
Inventories 39,396 (64,472)
Taxes recoverable 15 (44,766)
Accounts Receivables - Related Parties (2,847) (3,191)
Sundry credits (5,473) (2,695)
Trade accounts payable 40,081 27,577
Labor and tax obligations (15,916) (13,778)
Customer Advances (305) -
Deposits in Court (128) -
Other liabilities (27,538) (5,370)
Net Cash Flow from operating activities (37,644) (249,137)
Net Cash Used in Investment Activities
Investments Write-Offs - -
Intangible (331) -
Additions to investments (65,438) (66,531)
Net Cash Used in Investment Activities (65,769) (66,531)
Net Cash From Financing Activities
Loan repayments (207,538) (28,091)
Interest accrued (70,679) (20,979)
New Loans 322,634 239,612
Net Cash From Financing Activities 44,417 190,542
Related to Shareholders
Minority Interest variation (43) -
Balance Sheet conversion adjustment (1,823) -
Net Cash Flow from shareholder related activities (1,866) -
Net cash / cash equivalent Increase (60,862) (125,126)
Cash and Cash equivalents
Beginning of Period 466,540 376,446
End of Period 405,678 251,320
Net cash / cash equivalent Increase (60,862) (125,126)