Boundary Layer Energy Transport and Cumulus Development ...geerts/bart/demko1_mwr.pdf · Boundary...
22
Boundary Layer Energy Transport and Cumulus Development over a Heated Mountain: An Observational Study J. CORY DEMKO,BART GEERTS, AND QUN MIAO University of Wyoming, Laramie, Wyoming JOSEPH A. ZEHNDER Creighton University, Omaha, Nebraska (Manuscript received 27 November 2007, in final form 2 July 2008) ABSTRACT Aircraft and surface measurements of the boundary layer transport of mass and moisture toward an isolated, heated mountain are presented. The data were collected around the Santa Catalina Mountains in Arizona, 20–30 km in diameter, during the North American monsoon, on days with weak winds and cumulus congestus to cumulonimbus development over the mountain. Flights in the boundary layer around the mountain and surface station data indicate that mountain-scale anabatic surface wind generally develops shortly after sunrise, peaking at 1ms 1 in strength close to solar noon. There is some evidence for a toroidal heat island circulation, with divergence in the upper boundary layer. The aircraft data and mainly the diurnal surface temperature and pressure patterns confirm that this circulation is driven by surface heating over the mountain. Three case studies suggest that growth spurts of orographic cumulus and cumulonimbus are not preceded by enhanced mountain-scale mass convergence near the surface, and that the decay of orographic deep convection is associated with divergence around the mountain. 1. Introduction It is well-known that cumulus convection erupts al- most daily close to solar noon over the mountains in the interior western United States during the summer. Most introductory meteorology textbooks display sche- matics of topographically induced, thermally forced cir- culations over mountains (e.g., Ackerman and Knox 2007, p. 365; Aguado and Burt 2007, p. 238). Even rela- tively simple numerical simulations have shown that under sufficient solar radiation forcing, weak stratifica- tion, and weak wind, a thermally direct circulation de- velops over a mountain, with anabatic flow converging over the mountain, as illustrated in Fig. 1 (e.g., Thyer 1966; McNider and Pielke 1981; Bader and Mckee 1983; Banta 1986). This is referred to as a “toroidal” circula- tion, because the horizontal vorticity forms a ring (or toroid) around the mountain. However, few observations have been able to con- firm the existence of such circulation, and studies gen- erally only document the surface component (e.g., Fujita et al. 1962; Garrett 1980; Banta 1984; Vergeiner and Dreiseitl 1987; Whiteman 1990; Hernández et al. 1998). And, to our knowledge, there are no studies that have linked convective development to the evolution of near-surface convergence around a mountain, although a number of aircraft experiments have focused on flight-level observations of convergent orographic flow and cumulus formation over the Magdalena Mountains in New Mexico (e.g., Braham and Draginis 1960; Ray- mond and Wilkening 1980, 1982, 1985). The daytime anabatic circulation is distinctly different and more complex than the katabatic flow. The katabatic (or drainage) flow is a shallow gravity current concentrated in valleys and is commonly present around dawn. The anabatic flow has received little attention compared to the katabatic flow, both observationally and numeri- cally, yet it is more important in terms of cloud and precipitation development and interactions between the convective boundary layer (CBL) and the free tro- posphere. The anabatic circulation may be hard to detect be- cause of the intense mixing within the CBL. Convective turbulence may mix the anabatic momentum over a Corresponding author address: Bart Geerts, Department of At- mospheric Sciences, University of Wyoming, Laramie, WY 82071. E-mail: [email protected] JANUARY 2009 DEMKO ET AL. 447 DOI: 10.1175/2008MWR2467.1 © 2009 American Meteorological Society
Transcript of Boundary Layer Energy Transport and Cumulus Development ...geerts/bart/demko1_mwr.pdf · Boundary...

Boundary Layer Energy Transport and Cumulus Development over a HeatedMountain: An Observational Study
J. CORY DEMKO, BART GEERTS, AND QUN MIAO
University of Wyoming, Laramie, Wyoming
JOSEPH A. ZEHNDER
Creighton University, Omaha, Nebraska
(Manuscript received 27 November 2007, in final form 2 July 2008)
ABSTRACT
Aircraft and surface measurements of the boundary layer transport of mass and moisture toward anisolated, heated mountain are presented. The data were collected around the Santa Catalina Mountains inArizona, 20–30 km in diameter, during the North American monsoon, on days with weak winds andcumulus congestus to cumulonimbus development over the mountain. Flights in the boundary layer aroundthe mountain and surface station data indicate that mountain-scale anabatic surface wind generally developsshortly after sunrise, peaking at �1 m s�1 in strength close to solar noon. There is some evidence for atoroidal heat island circulation, with divergence in the upper boundary layer. The aircraft data and mainlythe diurnal surface temperature and pressure patterns confirm that this circulation is driven by surfaceheating over the mountain. Three case studies suggest that growth spurts of orographic cumulus andcumulonimbus are not preceded by enhanced mountain-scale mass convergence near the surface, and thatthe decay of orographic deep convection is associated with divergence around the mountain.
1. Introduction
It is well-known that cumulus convection erupts al-most daily close to solar noon over the mountains in theinterior western United States during the summer.Most introductory meteorology textbooks display sche-matics of topographically induced, thermally forced cir-culations over mountains (e.g., Ackerman and Knox2007, p. 365; Aguado and Burt 2007, p. 238). Even rela-tively simple numerical simulations have shown thatunder sufficient solar radiation forcing, weak stratifica-tion, and weak wind, a thermally direct circulation de-velops over a mountain, with anabatic flow convergingover the mountain, as illustrated in Fig. 1 (e.g., Thyer1966; McNider and Pielke 1981; Bader and Mckee 1983;Banta 1986). This is referred to as a “toroidal” circula-tion, because the horizontal vorticity forms a ring (ortoroid) around the mountain.
However, few observations have been able to con-firm the existence of such circulation, and studies gen-
erally only document the surface component (e.g.,Fujita et al. 1962; Garrett 1980; Banta 1984; Vergeinerand Dreiseitl 1987; Whiteman 1990; Hernández et al.1998). And, to our knowledge, there are no studies thathave linked convective development to the evolution ofnear-surface convergence around a mountain, althougha number of aircraft experiments have focused onflight-level observations of convergent orographic flowand cumulus formation over the Magdalena Mountainsin New Mexico (e.g., Braham and Draginis 1960; Ray-mond and Wilkening 1980, 1982, 1985). The daytimeanabatic circulation is distinctly different and morecomplex than the katabatic flow. The katabatic (ordrainage) flow is a shallow gravity current concentratedin valleys and is commonly present around dawn. Theanabatic flow has received little attention compared tothe katabatic flow, both observationally and numeri-cally, yet it is more important in terms of cloud andprecipitation development and interactions betweenthe convective boundary layer (CBL) and the free tro-posphere.
The anabatic circulation may be hard to detect be-cause of the intense mixing within the CBL. Convectiveturbulence may mix the anabatic momentum over a
Corresponding author address: Bart Geerts, Department of At-mospheric Sciences, University of Wyoming, Laramie, WY 82071.E-mail: [email protected]
JANUARY 2009 D E M K O E T A L . 447
DOI: 10.1175/2008MWR2467.1
© 2009 American Meteorological Society
MWR2467
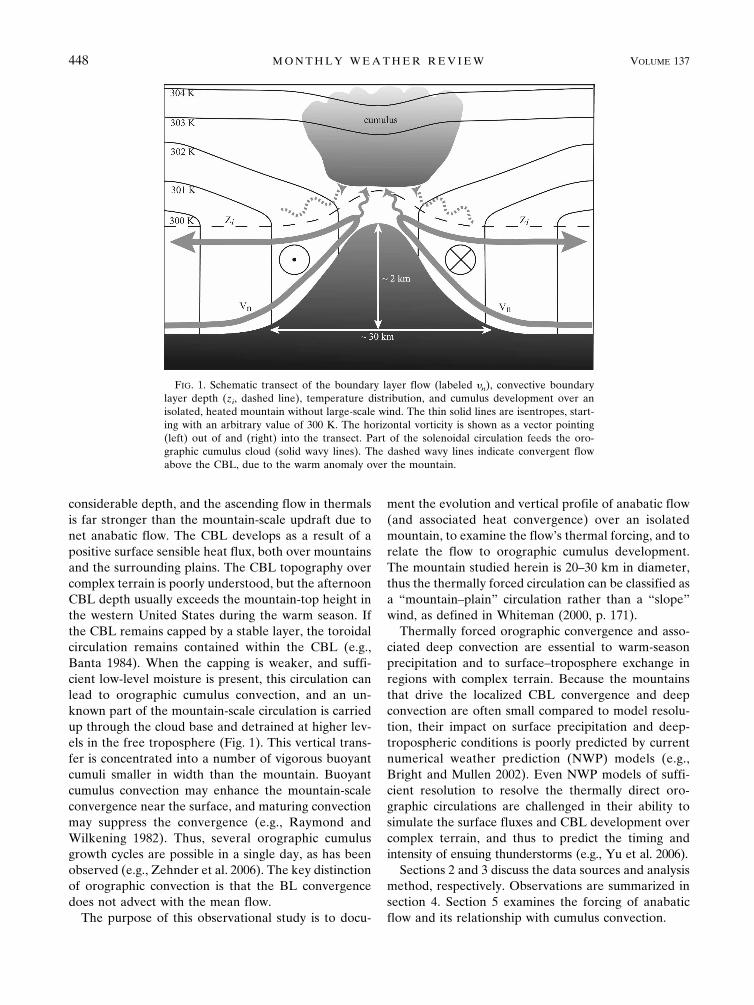
considerable depth, and the ascending flow in thermalsis far stronger than the mountain-scale updraft due tonet anabatic flow. The CBL develops as a result of apositive surface sensible heat flux, both over mountainsand the surrounding plains. The CBL topography overcomplex terrain is poorly understood, but the afternoonCBL depth usually exceeds the mountain-top height inthe western United States during the warm season. Ifthe CBL remains capped by a stable layer, the toroidalcirculation remains contained within the CBL (e.g.,Banta 1984). When the capping is weaker, and suffi-cient low-level moisture is present, this circulation canlead to orographic cumulus convection, and an un-known part of the mountain-scale circulation is carriedup through the cloud base and detrained at higher lev-els in the free troposphere (Fig. 1). This vertical trans-fer is concentrated into a number of vigorous buoyantcumuli smaller in width than the mountain. Buoyantcumulus convection may enhance the mountain-scaleconvergence near the surface, and maturing convectionmay suppress the convergence (e.g., Raymond andWilkening 1982). Thus, several orographic cumulusgrowth cycles are possible in a single day, as has beenobserved (e.g., Zehnder et al. 2006). The key distinctionof orographic convection is that the BL convergencedoes not advect with the mean flow.
The purpose of this observational study is to docu-
ment the evolution and vertical profile of anabatic flow(and associated heat convergence) over an isolatedmountain, to examine the flow’s thermal forcing, and torelate the flow to orographic cumulus development.The mountain studied herein is 20–30 km in diameter,thus the thermally forced circulation can be classified asa “mountain–plain” circulation rather than a “slope”wind, as defined in Whiteman (2000, p. 171).
Thermally forced orographic convergence and asso-ciated deep convection are essential to warm-seasonprecipitation and to surface–troposphere exchange inregions with complex terrain. Because the mountainsthat drive the localized CBL convergence and deepconvection are often small compared to model resolu-tion, their impact on surface precipitation and deep-tropospheric conditions is poorly predicted by currentnumerical weather prediction (NWP) models (e.g.,Bright and Mullen 2002). Even NWP models of suffi-cient resolution to resolve the thermally direct oro-graphic circulations are challenged in their ability tosimulate the surface fluxes and CBL development overcomplex terrain, and thus to predict the timing andintensity of ensuing thunderstorms (e.g., Yu et al. 2006).
Sections 2 and 3 discuss the data sources and analysismethod, respectively. Observations are summarized insection 4. Section 5 examines the forcing of anabaticflow and its relationship with cumulus convection.
FIG. 1. Schematic transect of the boundary layer flow (labeled �n), convective boundarylayer depth (zi, dashed line), temperature distribution, and cumulus development over anisolated, heated mountain without large-scale wind. The thin solid lines are isentropes, start-ing with an arbitrary value of 300 K. The horizontal vorticity is shown as a vector pointing(left) out of and (right) into the transect. Part of the solenoidal circulation feeds the oro-graphic cumulus cloud (solid wavy lines). The dashed wavy lines indicate convergent flowabove the CBL, due to the warm anomaly over the mountain.
448 M O N T H L Y W E A T H E R R E V I E W VOLUME 137

2. Data sources
The data used in this study were collected as part ofthe Cumulus Photogrammetric, In situ and DopplerObservations (CuPIDO) campaign during the 2006monsoon season around the Santa Catalina Mountains(SCM) in southeast Arizona (Damiani et al. 2008; allCuPIDO data are archived online at http://www.eol.ucar.edu/projects/cupido/). This mountain range has ahorizontal scale of 20–30 km and a vertical scale of�2000 m above the surrounding plains. Sixteen dayswere selected, each with orographic cumulus develop-ment, aircraft data, soundings, and surface meteoro-logical data (see Table 1 in Damiani et al. 2008). Wemainly examine data from the three of these 16 dayswith the best aircraft data. The University of WyomingKing Air (WKA) aircraft measured winds, state vari-ables, and humidity at sufficient frequency to computevertical fluxes. Mobile GPS Advanced Upper-AirSounding System (MGAUS) sondes were released at45–90-min intervals during WKA flights, from a loca-tion just upstream of the mountain top. Ten automated
surface meteorological stations were positioned aroundthe mountain (Fig. 2). All measured basic meteorologi-cal variables at 1 Hz; 5-min averages are used in thisstudy. Temperature and humidity was measured at 2 m,wind at 10 m AGL. Four stations were located on suf-ficiently level and homogenous ground that surfaceheat fluxes could be computed using the eddy correla-tion method, from data at 7 m AGL. The 4-station,30-min average sensible and latent heat flux is denotedby SH and LH, respectively. We also use meteorologi-cal data from a tower located on Mt. Bigelow on theSCM spine, and from an astronomical observatory onMt. Lemmon, the highest point of the SCM.
The evolution of orographic cumuli was captured bytwo pairs of digital cameras, one 30 km southwest ofMt. Lemmon and one 20 km northwest of Mt. Lemmon.Each camera in the pair was suitably spaced for ste-reophotogrammetry, and thus cloud edges can begeolocated at high temporal resolution (Zehnder et al.2007). This method was used to obtain the cloud-topchronology (i.e., the evolution of the highest cumuluscloud top over the SCM).
FIG. 2. Flight-level winds, potential temperature �, and mixing ratio r on three WKA circumnavigationlegs between 1600 and 1648 UTC 25 Jul 2006. The grayscale shows the topography (m). Mt. Lemmon,near the center of the three loops, is 2797 m high. The WKA track is colored by flight-level �. Theflight-level wind is shown with barbs; a full barb is 5 m s�1. These barbs are colored by r. The ISFFstations are labeled in white (standard stations) and yellow (eddy flux towers).
JANUARY 2009 D E M K O E T A L . 449
Fig 2 live 4/C
The WKA circumnavigated the SCM 51 times on 16flight days during CuPIDO. About half (24) of theloops followed an outer fixed track at 300 � 30 m AGL.Two other fixed tracks were flown: a middle loop at 780hPa, which is about 640 m below mountain top; and aninner loop at 700 hPa, which is about 270 m abovemountain top.
An example of three successive loops at these threeflight levels is shown in Fig. 2. At most but not all placesalong the outer loop, the wind is directed toward themountain (i.e., it has an anabatic component). Themean anabatic wind speed along the outer loop is 0.9m s�1. Variations exist along this loop (e.g., the poten-tial temperature � is generally higher on the east side ofthe mountain at this time, some 4 h after sunrise, andthe mixing ratio r is generally higher on the west side,where numerous well-watered golf courses are lo-cated). The inner loop (700 hPa) appears to be abovethe CBL at this time, because both � is higher and r islower. Also, the flow along this loop is not clearly con-vergent, although there is still a weak anabatic compo-nent on average, superimposed on a 2.8 m s�1 meannortheast wind.
3. Analysis method
Both the flight loops and the positioning of the sur-face stations around the SCM allow us to calculate the
mountain-wide mass, heat, and moisture budgets. Themethod used here is similar to that used by Raymondand Wilkening (1980) for dry orographic circulations andRaymond and Wilkening (1982) for orographic cumulus.The mass convergence MC (kg m�1 s�1) is defined as
MC � ���n ds, �1�
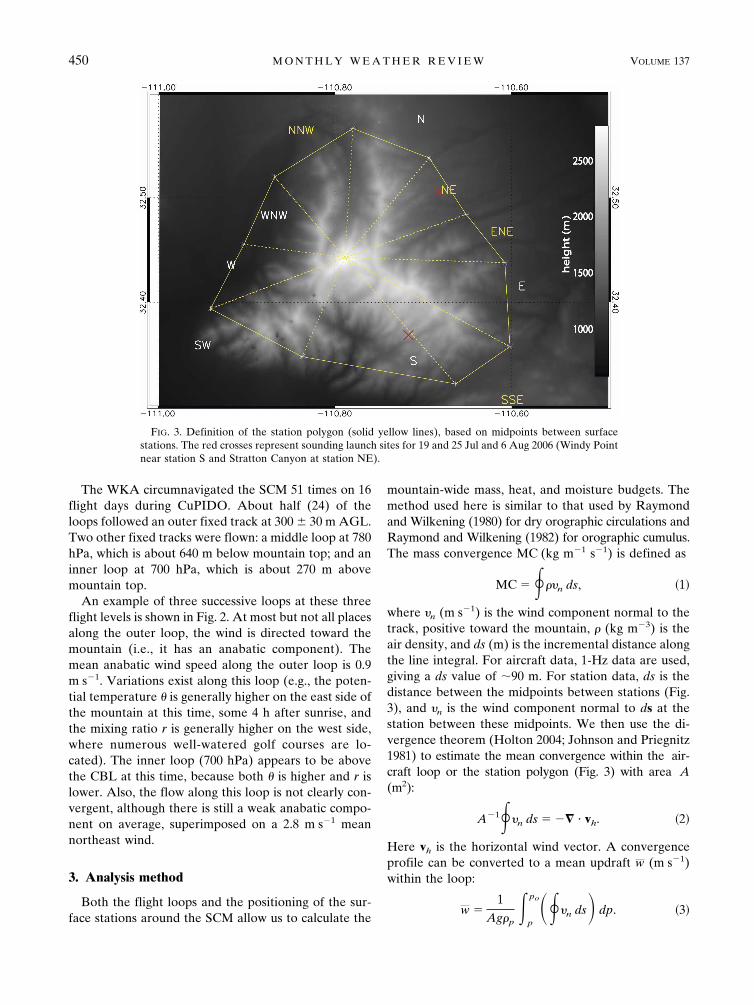
where �n (m s�1) is the wind component normal to thetrack, positive toward the mountain, (kg m�3) is theair density, and ds (m) is the incremental distance alongthe line integral. For aircraft data, 1-Hz data are used,giving a ds value of �90 m. For station data, ds is thedistance between the midpoints between stations (Fig.3), and �n is the wind component normal to ds at thestation between these midpoints. We then use the di-vergence theorem (Holton 2004; Johnson and Priegnitz1981) to estimate the mean convergence within the air-craft loop or the station polygon (Fig. 3) with area A(m2):
A�1��n ds � �� � vh. �2�
Here vh is the horizontal wind vector. A convergenceprofile can be converted to a mean updraft w (m s�1)within the loop:
w �1
Ag�p�
p
po���n ds� dp. �3�
FIG. 3. Definition of the station polygon (solid yellow lines), based on midpoints between surfacestations. The red crosses represent sounding launch sites for 19 and 25 Jul and 6 Aug 2006 (Windy Pointnear station S and Stratton Canyon at station NE).
450 M O N T H L Y W E A T H E R R E V I E W VOLUME 137
Fig 3 live 4/C

This assumes anelastic continuity and w � 0 at the sur-face. The integral bounds are the surface pressure po
and the flight level pressure p (Pa). Area A is computedas the sum of the areas of triangles defined by a base dsand a corner at Mt. Lemmon. These triangles are shownin Fig. 3 for the station polygon area. The area is 576km2 for the station polygon, and about 739, 399, and219 km2 for the 300 m AGL, 780-, and 700-hPa WKAloops, respectively.
The mean inflow �n (m s�1), referred to as the ana-batic flow speed, is computed as follows:
�n �1C��n ds, �4�
where C � � ds is the loop length, ranging from 52 kmfor the inner loop to 102 km for the outer loop (Fig. 2).The uncertainty in �n [i.e., the square root of the errorvariance 2(�n, C)], can be estimated as follows for con-tinuous aircraft measurements (Lenschow et al. 1999):
�2��n, C� � 2��2
��x
C. �5�
Here ��x is the integral length scale of �n along the flightpath and 2
� is the error variance of �n. According toLenschow and Stankov (1986), the integral scale forhorizontal velocity components measured within theCBL with depth zi is ��x � 0.45zi. The gust probe ve-locity error variance is at most 1 m2 s�2. Assuming zi �2 km, we obtain a conservative estimate for the uncer-tainty in �n of 0.13 � (�n, C) � 0.19 m s�1. The ap-pendix in Raymond and Wilkening (1985) contains amore rigorous error analysis of gust probe winds interms of the aircraft slip angle and the angle of attack.A similar uncertainty for �n (�0.18 m s�1) is obtainedfor their circum-mountain flight pattern, which hasabout the same length. Raymond and Wilkening (1982)discuss an additional source of error in �n, that is due tothe Schuler oscillation of the inertial platform. Thisyields an uncertainty in �n of 0.1 m s�1 for the outerloop (our worst case).
The error variance of �n from instantaneous stationmeasurements can be estimated as (Lenschow et al.1999):
�2��n, L� � ��2
�
C� 0.1��
2, �6�
where � is the typical distance between the 10 stationsin the polygon. For 5-min-average wind estimates fromprop-vane anemometers on a 10-m tower, � is at most0.33 m s�1, so the uncertainty in �n is 0.10 m s�1, whichis comparable to that from the aircraft data. As will beshown later, aircraft and station data yield a typicalmagnitude of �n of 1 m s�1 (i.e., a magnitude larger thanits uncertainty).
The mean (advective) wind vm is defined as the vec-tor mean wind along the track. Its magnitude will becompared to �n, to assess whether the flow primarilypasses over/around the mountain, or is drawn towardthe mountain.
We aim to quantify the horizontal flux convergenceof mass and energy over the mountain, and place this inthe context of changes in moist static energy over themountain. Moist static energy h is defined as h �� �gz � L�q, where � is the Exner function (J kg�1 K�1),� � cpT/� � cp(p/po)R/cp, cp (J kg�1 K�1) is the specificheat under constant pressure, R (J kg�1 K�1) is theideal gas constant for dry air, po � 1000 hPa, � (K) is thepotential temperature, T (K) is the temperature, g(m s�2) is gravity, z (m) is height, L� (J kg�1) is thelatent heat of condensation, and q (kg kg�1) is the spe-cific humidity. The conservation equation of h, for in-viscid flow, implies [e.g., Batchelor 1967, Eq. (3.1.16)]:
��h
�t� � � ��hv� � S. �7�
Here (kg m�3) is air density, v is the 3D wind vector,and S (W m�3) is a diabatic heat source other than thatdue to condensation/evaporation (e.g., radiative heatconvergence). Integration of (7) over area A gives
��A
��h
�tdA � � �h�n ds � ��
A
��hw
�zdA � ��
A
S dA.
�8�
The first term on the right of (8) is the horizontal fluxconvergence. This line integral, derived using the 2Ddivergence theorem, is computed over the closed loopdefined by the station polygon (Fig. 3) or the WKAflight loops (Fig. 2). This term is not preceded by aminus sign because the line-normal flow �n is defined aspositive toward the mountain. The second term on theright in (8) denotes the vertical flux convergence. Sub-stitution of the definition of h in (8) yields
��A
���h�
�tdA � � ����n ds � � L�q�n ds � � g�z�n ds � ��
A
���hw�
�zdA � ��
A
S dA. �9�
I II III IV V VI
JANUARY 2009 D E M K O E T A L . 451

According to (9), the net change of moist static ener-gy (I) expressed per unit volume over the mountainequals the horizontal convergence of sensible heat(II), the horizontal convergence of latent heat (III), thehorizontal convergence of potential energy (IV), thevertical flux convergence of h (V), and any diabaticheat sources (VI). Terms II and III are controlled byMC, slightly modulated by variations in temperatureand water vapor, respectively, along the track. Term IVis negligible if the average height of the stations orof the aircraft along the flight loops is set to zero. TermVI is mainly due to surface sensible and latent heatingmixed into the CBL. This term typically is far smallerthan the horizontal heat convergences (terms II andIII) near the surface. But in a control volume centeredover the mountain, horizontally confined by the surfacestations and vertically confined by a capping layerabove the CBL (Fig. 1), the net horizontal heat conver-gence is far smaller in magnitude than that eithernear the surface or that in the upper CBL. Thus, a netchange in h (term I) in the CBL over the mountainmay be dominantly affected by the surface heat flux(term VI). In this paper, we examine the surfaceheat flux (term VI) and the horizontal convergence(terms II and III). We only display horizontal massconvergence (MC), inferred from surface and aircraftdata, because terms II and III are essentially propor-tional to MC.
4. Case studies of mountain-scale convergence andsurface heating
We now illustrate the evolution of mass and moistureconvergence and cumulus growth for three days inCuPIDO. In each of the three cases cumulus congestusgrew over the mountain up to a height of 9–12 km MSLand clouds aloft glaciated. One case produced a benign,short-lived thunderstorm (Cb). None of the CuPIDOcases were cloud free.
To compare �n values and resulting mass and energyconvergence values from aircraft data with those fromstation data, the station data are low-pass filtered to 20min, the time needed to complete the WKA outer loop.The evolution of �n and convergence is interpreted interms of local surface heat fluxes and the profiles ofstability and wind.
We characterize static stability by considering pro-files of �e and the saturated equivalent potential tem-perature (�*e ), as in Fig. 4. The �e is conserved for aclosed, pseudoadiabatic dry or saturated air parcel. The�*e is not conserved; it corresponds to a hypotheticallysaturated atmosphere and depends only on tempera-ture. Regions where �*e decreases with height are con-ditionally unstable, and regions where �e decreases withheight are potentially unstable. The spread between �e
and �*e is a measure of the ambient humidity. Theamount of convective available potential energy(CAPE) can be estimated as the vertically integrated
FIG. 4. Profiles of �, �e, �*e , and wind at 1532 (gray) and 2000 UTC (black) 19 Jul 2006. Thedata are derived from a MGAUS sonde released at Windy Point at 2014 m MSL on the southside of Mt. Lemmon. The lifting condensation level (LCL) is shown for both soundings, aswell as the elevation of Mt. Lemmon. To see more detail in the profile of relatively weakwinds, two full barbs are set to correspond with 5 m s�1, double the standard convention.
452 M O N T H L Y W E A T H E R R E V I E W VOLUME 137

positive difference between the BL �e and the �*e pro-file. The CBL depth is defined as the base of the layerwithin which � increases by at least 1 K, and this in-crease is sustained. The radiosonde release sites werechosen to be just upstream of the mountain, such thatsome sondes would ascent through orographic cumuli.
a. 19 July 2006
This day started off more stable than the other twodays, with virtually no potential instability in the 1532UTC sounding (Fig. 4). This sounding, released 3 hafter sunrise, reveals no mixed layer at Windy Point, arocky outcropping at the south end of the SCM spineabout 1200 m above the Tucson valley floor. In general,the wind was light and variable at most levels (Fig. 4),except for a strong easterly flow below mountain topand below a stable layer, topping at 2.5 km MSL in the1532 UTC sounding.
By 2000 UTC [about 30 min after local solar noon(LSN)], the CBL reached 3.6 km MSL (�2.8 km abovethe valley floor), deeper than observed at any time onthe three days, but the CAPE was only 535 J kg�1.Orographic cumuli had a high cloud base compared tothe other two days (Fig. 5). The CBL was not stronglycapped at this time (Fig. 4). Shallow cumuli first formed1 h before LSN, and they rapidly transitioned to cumu-lus (Cu) congesti (Figs. 6a–c), topping near 7 km MSL(Fig. 5), where they were capped by a stable layer (Fig.4). By 2200 UTC two successive towers grew deeper;
the second of these produced an anvil, lightning, andbrief precipitation at Mt. Lemmon (Fig. 6d).
Divergent drainage flow was commonly recorded bythe Integrated Surface Flux Facility (ISFF) stationsaround sunrise, and mean anabatic surface flow (�n �0) developed some time after sunrise. On 19 July thisoccurred relatively late in the day (�5 h after sunrise),and the anabatic wind remained weak and variablethroughout the day (Fig. 7d). On average the surfaceflow was marginally convergent during the 4 h centeredon LSN (Table 1). No enhanced convergence occurredduring the 2 h that the Cu congesti were trapped by the7 km MSL stable layer (1930–2130 UTC; Fig. 5). Dur-ing the development of the cumulonimbus (Fig. 5) themountain-scale surface flow was divergent, and strongdivergence (�2 � 10�4 s�1) occurred around 2300 UTC(Fig. 7a), due to the outflow of the decaying thunder-storm, evident in surface station data.
Most WKA loop data were collected before the firstorographic Cu. Stronger anabatic flow occurred at 300m AGL than at the surface (Fig. 7e), and the 300 mAGL convergence intensified before the first Cu ap-peared (Fig. 7a). Four loops were flown at 780 hPa, allwithin the developing CBL, all before orographic cu-mulus development. In all four 780-hPa loops the flowwas weakly divergent (Fig. 7e). Four 700 hPa loopswere flown as well. Only the last one of these waswithin the CBL, at the time that Cu congestus waspresent (Fig. 5). The flow was strongly divergent forthis last loop.
FIG. 5. Evolution of the depth of orographic cumuli over the SCM on 19 Jul 2006. Alsoshown are the height of the mountain, the LCL, and the depth of the convective BL. The lattertwo are inferred from the MGAUS soundings. The LCL is computed assuming an air parcelmixed adiabatically in the lowest 500 m.
JANUARY 2009 D E M K O E T A L . 453

Between 1800 and 2000 UTC (around the time offirst Cu growth) a profile of low-level convergence,midlevel (780 hPa) nondivergence, and upper-CBL di-vergence emerges (Fig. 7a). This is evidence for thepresence of a toroidal circulation within the CBL. Thetiming of the low-level mass convergence (Fig. 7a) on19 July suggests that it could explain the observed oro-graphic cumulus development. However, this conver-gence was weak and intermittent.
Cumulus convection could also have been initiatedby local surface heating, so we examine the trend of SH(Fig. 7h). First, SH became positive �75 min after sun-rise and remained positive throughout the day, with amagnitude of about 3 times LH, as soils were quite dryon 19 July. Thus, local surface heating over the moun-tain preceded the horizontal mass convergence on 19July by several hours. While the mountain-scale con-vergence associated with the toroidal circulation wasweak and intermittent during cumulus formation andgrowth, SH was strong, averaging 200 W m�2 (Table 1).
Clearly the development of a short-lived cumulonimbus(Cb) was not the result of low-level convergence, as thesurface flow was divergent at that time. Instead, it prob-ably resulted from the weakening of a stable layer near7 km MSL, possibly because of sustained surface heat-ing.
b. 25 July 2006
The last day of a relatively dry spell around the SCMwas 25 July 2006 (Damiani et al. 2008). The CAPE inthe 1945 UTC sounding (1560 J kg�1; Fig. 8) was nearly3 times that on 19 July (at 2000 UTC, Fig. 4), and thesounding-derived LCL was some 500 m lower than on19 July (Fig. 9). The first Cu in the developing CBLover Mt. Lemmon formed at 1730 UTC, 1 h earlier thanon 19 July. By 1810 UTC, shallow cumuli were presentalong the SCM spine (Fig. 10a). This CBL was wellcapped by a stable layer with strong potential instability(Fig. 8), because of a dry layer between 3 and 4 kmMSL. This stable layer (evident in the 1600 UTC
FIG. 6. Snapshots of cumulus evolution on 19 Jul 2006 from camera CC6 located on the campus of the University of Arizona at (a)1900, (b) 2010, (c) 2120, and (d) 2220 UTC.
454 M O N T H L Y W E A T H E R R E V I E W VOLUME 137

sounding) suppressed cumulus growth for 1 h (Fig. 9),but it was weaker in the sounding released at 1900 UTC(not shown), at which time a Cu tower was growingrapidly (Figs. 9 and 10b).
The soundings were released from the dry, eastern
side of the mountain; hence, the sounding-inferred LCLwas higher than the observed cloud base (Fig. 9). Air-craft and surface data indicate that higher dewpointvalues occurred on the west side, as mentioned in sec-tion 2 (Fig. 2). Even though the prevailing flow wasfrom the northeast (Fig. 8), the low cloud base suggeststhat the orographic circulation incorporated more hu-mid air from the west, as suggested by the low-levelanabatic flow along the outer loop in Fig. 2.
The soundings reveal a moist layer between 6 and 7km MSL (Fig. 8). Altocumulus associated with thislayer was present all morning and slowly cleared with-out entirely disappearing. This layer was not as stableas on 19 July (Fig. 8), and the towering Cu (shown inFig. 10b) rapidly penetrated this layer and grew to adepth of 11 km MSL in just 30 min, without producinglightning or measurable rain on the ground. The result-ing anvil blew to the southwest, obscuring the view of
TABLE 1. Mass and heat fluxes over the SCM averaged for a 4-hperiod centered on LSN. The data are based on 10 stations shownin Fig. 2, except the surface flux data, which are based on fourstations. The variables are defined in section 3. The CBL depth zi
is inferred from soundings (e.g., Fig. 5), and is expressed as heightabove the valley floor.
19 Jul 25 Jul 6 Aug
Adiabatic flow �n (m s�1) 0.02 1.1 0.4Mass convergence MC (10�4 s�1) 0.2 1.8 0.7CBL depth zi (km) 2.6 1.4 1.5Surface sensible heat flux SH (W m�2) 200 225 140Surface latent surface flux LH (W m�2) 60 30 190
FIG. 7. Evolution of (a) mass convergence [Eq. (2)] and (b) wind on 19 Jul 2006 over the SCM. The solid lineis based on 10 ISFF stations; the symbols apply to aircraft measurements at three levels. Sunrise, local solar noon,and time of first Cu are shown. In (b), both the anabatic wind [Eq. (4)] (black line and symbols) and the mean windspeed (gray line and symbols) are shown. (c) Mass convergence profile from surface and airborne measurements.The surface measurements represent 20-min averages at times corresponding to each of the aircraft loops. (d)Average surface sensible and latent heat flux for the four surface flux stations shown in Fig. 2.
JANUARY 2009 D E M K O E T A L . 455

the CC6 camera in Tucson, Arizona (Fig. 10c). A se-quence of Cu towers billowed over Mt. Lemmon duringmuch of the afternoon, with anvils spreading towardCC6 (Fig. 10d). The CBL depth remained shallowerand better capped than on 19 July, according to allMGAUS soundings (Fig. 9) and the 0000 UTC Tucsonsounding (not shown).
Surface data indicate that the anabatic flow com-menced earlier than on 19 July, �70 min after sunrise,and was sustained all morning into the early afternoon
(Fig. 11a). Convergent flow commenced at about thetime that the surface first became a heat source (see theSH curve in Fig. 11d). It takes some time for this heatto mix vertically and develop a deep CBL, thus heatingof the elevated CBL by the underlying surface couldnot have been the dynamic source of the early moun-tain-scale convergence. This convergence may havebeen quite shallow initially. While the SH was sup-pressed until �1700 UTC due to the altostratus, massconvergence was strong before that time (Fig. 11a), and
FIG. 9. As in Fig. 5, but for 25 Jul 2006.
FIG. 8. As in Fig. 4, but at 1600 (gray) and 1945 UTC (black) 25 Jul 2006. The radiosondeswere released from Stratton Canyon at 1390 m MSL on the east side of Mt. Lemmon.
456 M O N T H L Y W E A T H E R R E V I E W VOLUME 137

before the first Cu appeared over Mt. Lemmon. It re-mained strong throughout the day (Table 1). For manyhours the anabatic wind was stronger than the meanadvective wind (Fig. 11b). Only six loops were flownaround the mountain, and most were flown before thefirst orographic Cu formed. The aircraft data indicateconvergent flow at all levels (Fig. 11c), although gen-erally a bit weaker than at the surface. The lone upper-level loop showed convergence; however, it was abovethe CBL (Figs. 2 and 8). This is the kind of convergenceindicated by the dashed arrows in Fig. 1, although itoccurred before the first Cu. Ignoring this data point, alinear fit through the convergence profile (Fig. 11c) in-dicates a decrease with height, as on 19 July.
In summary, surface anabatic flow started earlierthan on 19 July and remained strong. A toroidal circu-lation within the CBL was not documented on this day.It may have been present but we lack aircraft data inthe upper CBL. Low-level convergence did intensify asthe deep Cu congestus formed (Fig. 11a), and contin-ued as a series of isolated Cu congesti followed over Mt.
Lemmon. Since Mt. Lemmon was just above the ambi-ent CBL top (Fig. 11c), it appears that the anabatic flowbroke through the CBL near the mountain top. Thehigh CAPE sustained a sequence of Cu congesti, whichdeposited CBL air into the free troposphere, leading toa buildup of cloud debris in the already moist detrain-ment layer between 7 and 8 km MSL (Figs. 10c,d). Adivergent cold pool containing entrained midtropo-spheric or evaporatively cooled air did not form overthe mountain, possibly because of the stable layer ontop of the CBL.
c. 6 August 2006
On 26 July an unusually wet spell started, with dew-point values well above average (Damiani et al. 2008).The first day since the start of this spell that the daily-mean surface dewpoint dipped below the climatologicalaverage and the early-morning sky was clear was 6 Au-gust. The MGAUS soundings reveal mostly weak andvariable winds (Fig. 12) over the depth of the Cu con-gesti that formed over the mountain in the early after-
FIG. 10. As in Fig. 6, but at (a) 1810, (b) 1910, (c) 2020, and (d) 2130 UTC 25 Jul 2006.
JANUARY 2009 D E M K O E T A L . 457

FIG. 12. As in Fig. 4, but at 1752 (gray) and 1930 UTC (black) 6 Aug 2006. Theradiosonde was released from Stratton Canyon.
FIG. 11. As in Fig. 7, but for 25 Jul 2006.
458 M O N T H L Y W E A T H E R R E V I E W VOLUME 137

noon (Fig. 13). A sounding released during the Cu con-gestus growth phase reveals a CAPE value of just 720 Jkg�1, and essentially no convective inhibition (Fig. 12,1930 UTC sounding). Two layers of potential instabilitywere present at 1930 UTC, one above the CBL and onenear 5.5 km MSL (Fig. 12). A weakly stable layer be-tween 7 and 9 km MSL blocked further growth of theCu congesti.
The first orographic Cu formed fairly late (1800UTC; Fig. 14a), and the cloud tops grew gradually overthe course of 3 h (Figs. 14b–d). No lightning or precipi-tation was recorded. Because of the high soil moisturearound the mountain, the daytime LH exceeded SH(Fig. 15d; Table 1). Also, the east–west asymmetry inhumidity, observed on 19 and 25 July, was absent, andthe sounding LCL corresponded well with the observedcloud base (Fig. 13). The CBL depth was not muchbelow the LCL, and nonorographic BL cumuli devel-oped in the afternoon, mainly east of the SCM (Fig. 14d).
Anabatic flow started rather early on this day, atabout the same time as when SH became positive, as on25 July (Fig. 15b). In strength this flow was intermedi-ate between 19 and 25 July (Table 1). In the early af-ternoon (2100–2300 UTC) the cloud-top heights aboveMt. Lemmon waned (Figs. 13 and 14d). The last avail-able sounding, at 2100 UTC, does not reveal anymidlevel drying or stabilization compared to previoussoundings on this day, thus this cloud-top decline mustbe related to boundary layer processes: both the surfaceenergy fluxes (Fig. 15d) and the mass (and heat) con-
vergence (Fig. 15a) decreased during this period; thelatter even became negative.
Eight loops were flown around the mountain, all afterthe first orographic Cu, unlike the 19 and 25 July cases.The outer and middle loops were within the CBL, theinner loops remained above the CBL (Fig. 15c). Thefive early loops (1750–1920 UTC), flown during theearly Cu growth phase, indicate that the flow was con-vergent at low levels (consistent with surface observa-tions during this period), nondivergent in the upperCBL (780 hPa), and divergent above the CBL (700hPa). This is the strongest evidence yet for a toroidalcirculation, partly contained within the CBL. Duringthe Cu decay phase after 2100 UTC, another stack wasflown. Strong convergence was encountered at low andmidlevels, in discordance with surface measurementsand the observed Cu evolution.
5. Discussion
a. Orographic convergence and cumulus convection
How does the trend of mountain-scale convergencenear the surface affect orographic cumulus evolution,and how do cumuli in turn affect convergence? On 19July, convergence tended to decrease during the cumu-lus deepening stage, while on 25 July the rapid cumulusdeepening to its maximum height for the day coincidedwith a period of strong convergence (Fig. 16). The maincumulus burst on 25 July was followed by three lessimpressive Cu growth cycles. They did not generally
FIG. 13. As in Fig. 5, but for 6 Aug 2006.
JANUARY 2009 D E M K O E T A L . 459

follow (or coincide with) a convergence maximum. Theonly clear relationship appears to occur after a deepcumulus burst, when the convergence tends to mini-mize or become negative (e.g., on 19 July).
We now examine the signature of cumulus develop-ment on surface mass convergence for the 16 flightdays. On each of these days orographic Cu developed,most commonly between 1600 and 1700 UTC (Fig. 17b;i.e., �3 h before LSN). Orographic cumuli reachedtheir maximum height most commonly in the first 2 hafter LSN, and their peak depth was at least 4 km (i.e.,they became at least Cu congesti). The Cu grew to thecumulonimbus stage, with lightning recorded close toMt. Lemmon on 7 out of the 16 days (19 July, and 7, 9,10, 11, 13, and 17 August).
During the 16 days, the WKA flew 24 loops aroundthe mountain at 300 m AGL, all within the CBL, allwithin 3.5 h of LSN. The diurnal trend of mass conver-gence at the surface agrees well with the 24 conver-gence estimates from these flight loops (Fig. 17a), indi-
cating that surface wind data alone are sufficient toestimate the convergence within the CBL. This is im-portant because aircraft data are relatively expensive tocollect, and the number of aircraft loops flown is insuf-ficient to reveal the diurnal trend apparent in the 16-day record.
The composite convergence (Fig. 17a) suggests thatno enhanced convergence was present in the hours be-fore Cb development, and trends for individual daysconfirm this: the convergence on Cb days does not sub-stantially exceed that on congestus-only days at anytime. In fact, over the course of the day, less surfaceconvergence occurs on Cb days compared to congestus-only days. The one feature that distinguishes Cb days isthat surface convergence generally vanished aroundLSN, with clear divergence after 2200 UTC. High vari-ability existed amongst the seven Cb days and analysisof the individual days indicates that surface divergencegenerally developed shortly after the first lightning,suggesting cold pool development, as was observed in
FIG. 14. As in Fig. 6, but at (a) 1810, (b) 1920, (c) 2030, and (d) 2150 UTC 6 Aug 2006.
460 M O N T H L Y W E A T H E R R E V I E W VOLUME 137

one case by Raymond and Wilkening (1982). Thus,while thunderstorms undoubtedly transport more CBLenergy and moisture into the upper troposphere thanCu congesti, surface measurements suggest that oro-graphic thunderstorms suppress the BL solenoidal cir-culation, due to cold-pool spreading.
The weakening of the solenoidal circulation by thun-derstorms is confirmed by aircraft data. The 300 mAGL flight loops support the notion of afternoon di-vergence on Cb days (Fig. 17a). At the midlevel (780hPa), divergence occurs on Cb days, and convergenceoccurs on congestus-only days (Fig. 18). This is espe-cially surprising since all but one 780-hPa loop on Cbdays were flown before Cb occurrence. At 700 hPa nosignificant difference exists between Cb and congestus-only days. Mountain-scale vertical velocity (w) can becomputed from the convergence values at various lev-els, using airmass continuity and assuming w � 0 at thesurface. On congestus-only days deep rising motion ispresent in the CBL, peaking at 0.21 m s�1 or �750 m in1 h. Because of the slope of the terrain (about 0.10between the ISFF stations and the mountain top), andthe mean anabatic flow at the surface (0.4 m s�1 on
average, during the period of the congestus-only flightloops; see Fig. 17a), the peak mountain-scale verticalvelocity may be slightly higher, about 0.25 m s�1. Oro-graphic ascent in the CBL is weaker and shallower onCb days (Fig. 18). Thus, the aircraft data corroboratethe conclusion reached from the surface data.
The two-month long record of ISFF data further cor-roborates that thunderstorms suppress the near-surfaceconvergence: Fig. 19 contrasts the composite mountain-scale convergence on days with thunderstorms (as de-termined by lightning occurrence within 13 km fromMt. Lemmon between 1800 and 0000 UTC, recorded bythe National Lightning Detection Network) againstthat on days with shallow Cu over the mountain only(as inferred from CC6 time lapse photography). Clearlythe solenoidal surface convergence is suppressed on Cbdays, starting around LSN, while it is sustained throughthe afternoon on shallow Cu days. The mountain-scaleconvergence starts about 1 h earlier and is more intensein the morning on Cb days, compared to shallow Cudays. The two-month record will be explored further ina separate study.
This conclusion is counterintuitive, yet it is not in-
FIG. 15. As in Fig. 7, but for 6 Aug 2006.
JANUARY 2009 D E M K O E T A L . 461

consistent with the aircraft data analysis by Raymondand Wilkening (1982). While the mean anabatic flowdoes advect the moist static energy needed to sustainorographic convection, it may not explain the onset oforographic deep convection. In general deep convec-tion is triggered where the CBL reaches the level offree convection, which is most likely where the CBLdomes (Fig. 1). Apparently this doming is not the resultof the solenoidal circulation, but rather local surfaceheating. In terms of eroding the convective inhibition(CIN) and maximizing CAPE, the anabatic flow doesnot help: it is the nature of solenoidal forcing that ana-batic surface flow advects cooler air (Fig. 1) and aims todestroy the horizontal difference of virtual potentialtemperature (��; see section 5b). Thus, ignoring anyhorizontal moisture gradients, anabatic flow lowers the
moist static energy, increases CIN, and decreasesCAPE. This is consistent with the absence of enhancedanabatic flow prior to convective bursts, as discussedabove.
The implications are twofold: (a) mountain-scalemass convergence near the surface cannot be used as aprecursor for convective initiation over mountains, un-like in the plains (e.g., Wilson and Schreiber 1986; Wil-son et al. 1992); and (b) orographic cumulus verticalgrowth is controlled by something else; the most likelycandidate, as suggested by Zehnder et al. (2007), is theevolution of the profile of static stability, which is af-fected by surface heating over the mountain, or bychanges aloft.
The composite surface data in Fig. 17a demonstratethat mountain-scale convergence develops about 1.5 hafter sunrise, at about the same time as surface heatingcommences (SH � 0; Fig. 17c). Such an early start istypical for small-scale upslope flow [p. 179 in Whiteman(2000)], but it is earlier than expected for a mountain–plain circulation of this size. This is addressed further inGeerts et al. (2008). The convergence also peaks about2 h before LSN (the time that SH peaks) on thunder-storm days (Figs. 17a and 19), about 1 h before LSN onCu congestus days, and about 1 h after LSN for dayswith shallow Cu only (Fig. 19). This shift in peak con-vergence time confirms that moist convection sup-presses the solenoidal circulation in the CBL.
These findings are based on a small sample and needto be further corroborated. In a separate study (inprogress), we examine the relationship between cloud-top evolution, moist static energy at Mt. Bigelow, andmountain-scale convergence for the 2-month period ofISFF data in CuPIDO, and statistically assess differ-ences between different convective classes.
b. Thermal forcing of anabatic flow
We now examine the thermal forcing of the low-levelanabatic wind and the toroidal circulation. Such circu-lation mostly contained within the CBL (low-level con-vergence, upper-level divergence) appears to be presenton 6 August (Fig. 15c) and on 19 July (Fig. 7e), as wellas in the 16-day average profile (Fig. 18). The develop-ment of a toroidal vorticity (�) around an isolatedheated mountain is the result of solenoidal forcing [i.e.,a gradient of buoyancy (or ��) toward the mountain(Fig. 1)]:
D
Dt≅
g
��
���
�x. �10�
Numerical simulations have documented the devel-opment of this baroclinicity and resulting circulation
FIG. 16. Correspondence between mountain-scale convergenceand orographic cumulus-top height for the three days studiedherein.
462 M O N T H L Y W E A T H E R R E V I E W VOLUME 137

(e.g., de Wekker et al.1998). Therefore we examine thevariation of �� in a vertical cross section on the 3 daysstudied in section 4 (Fig. 20). The terrain profile is anaverage in all four wind directions, starting at Mt. Lem-mon, but clearly the azimuthal symmetry is significant(e.g., Fig. 3). All aircraft and surface station data areplotted as a function of their distance from Mt. Lem-mon. The vertical position of all data is their heightMSL, rather than their height above the indicative ter-rain, because the solenoidal forcing needs to be evalu-ated on constant pressure surfaces. This places somesurface stations “underground.” In most cases the up-per flight loop data are collected above the CBL, as isevident from the �� profiles (Figs. 20b,d,f). Thus, toreveal radial differences, �� perturbations are plotted.The perturbation �� is defined as the departure fromthe mean at any of the three flight levels, or from themean of the 10 surface stations. Data from the Bigelowflux tower are included (the triangle at 2583 m MSL inFig. 20). For this site the perturbation �� is defined asthe departure from the mean �� at the 780-hPa flight
loop, because that flight level comes closest to the el-evation of Mt. Bigelow. The aircraft data were filteredto 10 s (�800-m along-track distance) and the 5-minstation data were averaged to match the time needed tocollect all aircraft data. The radial extent of the data issomewhat limited because of the flight patterns and thedistribution of surface stations. Mt. Bigelow is on aridge at 6.6 km to the southeast of Mt. Lemmon;thus, itappears much higher than the average terrain height.
One common aspect for the three cross sections inFig. 20 is that Mt. Bigelow has a �2 K higher �� than atthe 780-hPa flight level, including 19 July and 6 August,when the CBL top clearly was above the elevation ofMt. Bigelow. This is true also for other cross sections ofcombined multilevel aircraft data and station data (notshown), except one, at 2113–2201 UTC 6 August, pre-sumably because of a cold pool development associatedwith cloud-top subsidence and divergent flow in theCBL (Fig. 16). One may argue some instrument cali-bration problem at Mt. Bigelow, so we compared theBigelow �� values to those just above the surface in
FIG. 17. (a) Diurnal variation of mass convergence on days with orographic Cb (7 days) andthose with only Cu congestus development (9 days). The lines represent averages based onsurface station data, and the symbols represent 24 loops flown at 300 m AGL. (b) Diurnalvariation of the time of first Cu and of deepest Cu for the 16 flight days, inferred from the CC6camera images. (c) Average surface heat fluxes for the same days.
JANUARY 2009 D E M K O E T A L . 463

soundings released from both Windy Point and Mt.Lemmon (locations are shown in Fig. 3) at several timeswhen the CBL was well developed and deep. Thesevalues corresponded well. This yields evidence of awarm core over the mountain.
Otherwise, the aircraft and surface data do not reveala clear pattern of warmer air (��� � 0) closer to themountain. In essence, the station layout and flight pat-tern were not ideal to measure solenoidal forcing: along line of stations and low-level, terrain-followingflight tracks across the mountain would be superior.The large azimuthal asymmetry of � on 25 July (Fig. 2)explains the large variations in ��� seen in Fig. 20c, es-pecially for the lower, outer loop. Aircraft data givesome indication for the expected baroclinicity on 6 Au-gust (Fig. 20e). This series of loops was flown later thanthe others and closer to LSN. Certainly the difference
in observed surface convergence strength (Fig. 16) can-not be explained by differences in the ��� distribution(Fig. 20). We also plotted the data points at the ob-served height MSL, with their distance from Mt. Lem-mon determined by the condition that their plottedheight above the average terrain profile equals the ac-tual height AGL. This method redistributes the dataand does reveal the expected baroclinicity more clearly,especially in two cross sections on 25 July (Fig. 21),when the anabatic flow was the strongest. Here theaircraft data suggest a radial �� gradient of roughly 1 K(10 km)�1, with warmer air closer to the mountain.
c. Hydrostatic pressure variations and anabatic flow
There is another way to detect the presence ofwarmer BL air closer to the mountain. Hydrostatic bal-ance implies that a higher temperature over some depthin the atmosphere is associated with a lower pressurebelow this layer. Using typical values for the SCM (inparticular, a CBL depth of 1.6 km), a temperature ex-cess of 2 K over the mountain yields a hydrostatic pres-sure deficit of 1.0 hPa, assuming a flat CBL top. Sincethe reference level is the foothills around the mountain,this lower pressure would occur under the mountainbedrock, but the pressure gradient force is neverthelessreal.
Observed pressure perturbations for the three daysstudied herein are shown in Fig. 22. The pressure per-turbation is defined as in Fujita et al. (1962) (i.e., thedaily average value is removed, to eliminate the effectof station elevation). Fujita et al. (1962), examining a
FIG. 18. Mass convergence profiles for the same days as in Fig.17. The solid lines represent the average convergence profiles forCb days and congestus days. The two ISFF measurements repre-sent the time-averaged surface station measurements during theperiod of aircraft measurements, which occurred between 1600and 2200 UTC. The dotted lines are vertical velocity (w) profilesderived from the convergence profile, assuming w � 0 at theground.
FIG. 19. Diurnal variation of the mountain-scale convergence,inferred from the 10-station polygon (Fig. 3), for 15 days withshallow orographic cumuli (gray line), and for 27 days with light-ning over the SCM between 1800 and 0000 UTC (black line)between 22 Jun and 29 Aug 2006.
464 M O N T H L Y W E A T H E R R E V I E W VOLUME 137

mountain of similar relative height as the SCM, assumethat the resulting perturbation pressure gradients canbe interpreted as horizontal pressure gradients. Geertset al. (2008) show that a temperature-dependent cor-rection is needed to obtain horizontal pressure gradi-ents that drive horizontal wind. To reveal anabatic and
katabatic forcing, we have plotted the difference of thispressure perturbation at any station with that at Mt.Bigelow (Fig. 22). Positive differences imply lowerpressure over the mountain, thus anabatic forcing.
A clear stratification with station height is obvious: alarger pressure difference exists at lower stations (in
FIG. 20. (left) Cross sections of virtual potential temperature ��, expressed as a perturbation from the mean value at any of the threeflight levels or at the surface. Aircraft data from the three loops are shown with distinct symbols, and surface data are shown as triangles.The solid black line is an indicative, average terrain profile. (right) The �� profile from a sounding released around the time that thedata in the left panels were collected. They have the same vertical axis as the left panels. (top), (middle), and (bottom) are for 19 Jul,25 Jul, and 6 Aug 2006, respectively.
JANUARY 2009 D E M K O E T A L . 465
Fig 20 live 4/C

red). Assuming a bell-shaped mountain, these lowerstations are also further away, thus the pressure gradi-ent (toward or away from the mountain) varies littlebetween stations. On each of the three days, katabaticforcing prevails at night. Anabatic forcing prevails dur-ing the day, starting about 2 h after sunrise, and peakingclose to LSN. The average anabatic forcing is aboutequally strong on the three days, in other words thedifferences in anabatic flow development between 19and 25 July cannot be explained by differences in theindependently derived horizontal pressure gradient.Nevertheless the general, low-pass-filtered pattern ofanabatic flow evolution matches the average anabaticpressure forcing pattern on each of the three days, sug-gesting that the flow rapidly responds to the pressureforcing, as expected from Eq. (10). Also, the magnitudeof the pressure difference, about 1 hPa, and the mag-nitude of the observed temperature excess at Mt. Big-elow at times that this station is within the CBL (�2 K,
see e.g., Figs. 20a,e) confirm that this pressure differ-ence is hydrostatically driven by a temperature differ-ence in the CBL. The katabatic flow spike associatedwith a thunderstorm outflow on 19 July (Fig. 22b) is notpresent in the pressure forcing, possibly because thecold pool is too shallow. Using a 2-month composite ofhorizontal pressure perturbation differences betweenthe 10 ISFF stations and Mt. Bigelow, Geerts et al.(2008) find good temporal correspondence betweenanabatic forcing and anabatic flow.
6. Conclusions
Surface and aircraft data collected over the SantaCatalina Mountains in Arizona were used to study thedevelopment of mass and heat convergence over anisolated heated mountain, and their relation to oro-graphic convection. This study focused on 3 days, andincluded an additional 13 days, each with Cu congestusor Cb development over the mountain. The main find-ings are as follows:
• Aircraft data collected along a closed loop aroundthe mountain in the lower CBL indicate that moun-tain-scale convergence can be well estimated usingdata from a series of surface stations around themountain.
• An orographic toroidal circulation with low-levelanabatic flow and divergence near the CBL top issometimes, but not always, present prior to oro-graphic cumulus development.
• Station data indicate that mountain-scale conver-gence typically develops shortly after sunrise andpeaks close to local solar noon. The anabatic flow isdriven by surface heating over the mountain, result-ing in solenoidal forcing and a hydrostatic horizontalpressure gradient force toward the mountain.
• Orographic cumulus and cumulonimbus develop-ment are not triggered by mountain-scale mass con-vergence near the surface, but rather probably bylocal surface heating; in fact convergent flow maysuppress the initiation or deepening of convectionover mountains. This does not mean that the low-level convergence of moist static energy by the ana-batic flow is not essential for the maintenance of oro-graphic convection. Surface flow tends to be ka-tabatic following a thunderstorm outbreak over themountain.
The last two conclusions will be corroborated in afollow-up study using two months of station data, col-lected as part of CuPIDO, and results will be stratifiedas a function of stability, thunderstorm development,and soil moisture. Another follow-up study will com-
FIG. 21. Cross sections of virtual potential temperature, ��,based on aircraft and station data, for 25 Jul 2006, for (a) 1601–1647 and (b) 1708–1745 UTC. As in Fig. 20, the actual height MSLof the observations is shown, but unlike in Fig. 20, the x-axis valueis the distance at which the actual height above the ground opti-mally corresponds with the height above the average terrain pro-file (black line).
466 M O N T H L Y W E A T H E R R E V I E W VOLUME 137
Fig 21 live 4/C

pare the above conclusions with those arising from de-tailed numerical simulations.
Acknowledgments. CuPIDO was funded by NationalScience Foundation (NSF) Grants ATM-0444254,ATM-035298, and by the NSF facility deployment pool.Special thanks go to the WKA, ISFF, and MGAUScrews during the CuPIDO field phase. We appreciatethe review comments of Thomas Parish and threeanonymous reviewers.
REFERENCES
Ackerman, S. A., and J. A. Knox, 2007: Meteorology: Understand-ing the Atmosphere. 2nd ed. Thomson, 464 pp.
Aguado, E., and J. E. Burt, 2007: Understanding Weather & Cli-mate. 4th ed. Prentice Hall, 562 pp.
Bader, D. C., and T. B. Mckee, 1983: Dynamical model simulation
of the morning boundary layer development in deep moun-tain valleys. J. Climate Appl. Meteor., 22, 341–351.
Banta, R. M., 1984: Daytime boundary layer evolution overmountainous terrain. Part I: Observations of the dry circula-tions. Mon. Wea. Rev., 112, 340–356.
——, 1986: Daytime boundary layer evolution over mountainousterrain. Part II: Numerical studies of upslope flow duration.Mon. Wea. Rev., 114, 1112–1130.
Batchelor, G. K., 1967: An Introduction to Fluid Mechanics. Cam-bridge Press, 615 pp.
Braham, R. R., and M. Draginis, 1960: Roots of orographic cu-muli. J. Atmos. Sci., 17, 214–226.
Bright, D. R., and S. L. Mullen, 2002: Short-range ensemble fore-casts of precipitation during the Southwest monsoon. Wea.Forecasting, 17, 1080–1100.
Damiani, R., and Coauthors, 2008: Cumulus Photogrammetric,In-situ and Doppler Observations: The CuPIDO 2006 experi-ment. Bull. Amer. Meteor. Soc., 89, 57–73.
de Wekker, S. F. J., S. Zhong, J. D. Fast, and C. D. Whiteman,
FIG. 22. Horizontal pressure perturbation differences between 10 ISSF stations and Mt. Bigelow for the 3 days studied herein: (b) 19Jul, (c) 25 Jul, and (d) 6 Aug 2006. (a) The location and height distribution of the stations is shown. The stations are color coded, thelowest ones in red, and the higher ones in blue. Note that a 24-h period is shown, unlike in previous figures. The pressure perturbationis defined in the text. The mountain-scale convergence traces (gray lines; also shown in Fig. 16) are superimposed for comparison.
JANUARY 2009 D E M K O E T A L . 467
Fig 22 live 4/C

1998: A numerical study of the thermally driven plain-to-basin wind over idealized basin topographies. J. Appl. Me-teor., 37, 606–622.
Fujita, T., K. A. Styber, and R. A. Brown, 1962: On the mesom-eteorological field studies near Flagstaff, Arizona. J. Appl.Meteor., 1, 26–42.
Hernández, E., J. de las Parras, I. Martín, A. Rúa, and L. Gimeno,1998: A field case study and numerical simulation of moun-tain flows with weak ambient winds. J. Appl. Meteor., 37,623–637.
Garrett, A. J., 1980: Orographic cloud over the eastern slopes ofMauna Loa Volcano, Hawaii, related to insolation and wind.Mon. Wea. Rev., 108, 931–941.
Geerts, B., Q. Miao, and J. C. Demko, 2008: Pressure perturba-tions and upslope flow over a heated, isolated mountain.Mon. Wea. Rev., 136, 4272–4288.
Holton, J. R., 2004: An Introduction to Dynamic Meteorology. 4thed. Elsevier/Academic Press, 535 pp.
Johnson, R. H., and D. L. Priegnitz, 1981: Winter monsoon con-vection in the vicinity of north Borneo. Part II: Effects onlarge-scale fields. Mon. Wea. Rev., 109, 1615–1628.
Lenschow, D. H., and B. B. Stankov, 1986: Length scales in theconvective atmospheric boundary layer. J. Atmos. Sci., 43,1198–1209.
——, P. B. Krummel, and S. T. Siems, 1999: Measuring entrain-ment, divergence, and vorticity on the mesoscale from air-craft. J. Atmos. Oceanic Technol., 16, 1384–1400.
McNider, R. T., and R. A. Pielke, 1981: Diurnal boundary-layerdevelopment over sloping terrain. J. Atmos. Sci., 38, 2198–2212.
Raymond, D. J., and M. H. Wilkening, 1980: Mountain-inducedconvection under fair weather conditions. J. Atmos. Sci., 37,2693–2706.
——, and ——, 1982: Flow and mixing in New Mexico mountaincumuli. J. Atmos. Sci., 39, 2211–2228.
——, and ——, 1985: Characteristics of mountain-induced thun-
derstorms and cumulus congestus clouds from budget mea-surements. J. Atmos. Sci., 42, 773–783.
Thyer, N. H., 1966: A theoretical explanation of mountain andvalley winds by a numerical method. Meteor. Atmos. Phys.,15, 318–348.
Vergeiner, I., and E. Dreiseitl, 1987: Valley winds and slopewinds: Observations and elementary thoughts. Meteor. At-mos. Phys., 36, 264–268.
Whiteman, C. D., 1990: Observations of thermally developedwind systems in mountainous terrain. Atmospheric Processesover Complex Terrain, Meteor. Monogr., No. 45, Amer. Me-teor. Soc., 5–42.
——, 2000: Mountain Meteorology: Fundamentals and Applica-tions. Oxford University Press, 376 pp.
Wilson, J. W., and W. E. Schreiber, 1986: Initiation of convectivestorms by radar-observed boundary-layer convergent lines.Mon. Wea. Rev., 114, 2516–2536.
——, G. B. Foote, N. A. Crook, J. C. Fankhauser, C. G. Wade,J. D. Tuttle, and C. K. Mueller, 1992: The role of boundarylayer convergence zones and horizontal rolls in the initiationof thunderstorms: A case study. Mon. Wea. Rev., 120, 1785–1815.
Yu, W., Y. Liu, T. Warner, R. Bullock, B. Brown, and M. Ge,2006: A comparison of very short-term QPFs for summerconvection over complex terrain areas, with the NCAR/ATEC WRF and MM5-based RTFDDA systems. SeventhWRF Users Workshop, Boulder, CO, NCAR, 8.5. [Availableonline at http://www.mmm.ucar.edu/wrf/users/workshops/WS2006/abstracts/Session08/8_5_Yu.pdf.]
Zehnder, J. A., L. Zhang, D. Hansford, A. Radzan, N. Selover,and C. M. Brown, 2006: Using digital cloud photogrammetryto characterize the onset and transition from shallow to deepconvection over orography. Mon. Wea. Rev., 134, 2527–2546.
——, J. Hu, and A. Razdan, 2007: A stereo photogrammetrictechnique applied to orographic convection. Mon. Wea. Rev.,135, 2265–2277.
468 M O N T H L Y W E A T H E R R E V I E W VOLUME 137