Boscombe West 2016 Report Final · The Boscombe West residents’ survey 2016 was a paper survey...
46
Produced by the Corporate Consultation and Research Team January 2017 Boscombe West Residents Survey 2016
Transcript of Boscombe West 2016 Report Final · The Boscombe West residents’ survey 2016 was a paper survey...
Produced by the Corporate Consultation and Research Team
January 2017
Boscombe West
Residents Survey 2016

Contents 1 Introduction .......................................................................... 1
1.1 Methodology ....................................................................... 1
1.2 Results .............................................................................. 1
2 Overall satisfaction ................................................................. 2
3 Residents’ priorities ................................................................ 3
4 Service satisfaction and usage .................................................. 7
4.1 Keeping public land clear of litter and refuse .................................. 9
4.2 Refuse collection ................................................................ 10
4.3 Doorstep recycling .............................................................. 11
4.4 Local transport information ..................................................... 12
4.5 Local bus services .............................................................. 13
4.6 Sport & leisure facilities ........................................................ 14
4.7 Libraries .......................................................................... 15
4.8 Museums & galleries ........................................................... 16
4.9 Theatres & concert halls ....................................................... 17
4.10 Parks & open spaces ........................................................... 18
4.11 Seafront .......................................................................... 19
4.12 Boscombe Market ............................................................... 20
5 Your community .................................................................. 21
5.1 People from different ethnic backgrounds get on well together ........... 22
6 Community safety ................................................................ 23
6.1 Feeling safe after dark .......................................................... 23
6.2 Feeling safe during the day .................................................... 24
6.3 Influencing feelings of safety .................................................. 25
7 Anti-social behaviour ............................................................ 26
7.1 Overall perceptions of anti-social behaviour ................................. 26
7.2 Noisy neighbours and loud parties ............................................ 28
7.3 Rubbish or litter lying around .................................................. 28
7.4 Vandalism, graffiti and other deliberate damage ............................ 29
7.5 People using or dealing drugs ................................................. 29
7.6 People being drunk or rowdy in public places ............................... 30
7.7 Groups hanging around the streets ........................................... 30
7.8 Untidy gardens and other private land ....................................... 31
8 Communication ................................................................... 32
8.1 Improvements to Boscombe ................................................... 33
9 Health and wellbeing ............................................................. 36
9.1 Social contact .................................................................... 37
9.2 Satisfaction with life ............................................................. 38
10 Conclusion ......................................................................... 39
Appendix 1: Respondent profile ........................................................ 40
Appendix 2: Table of figures ............................................................ 41

1 Corporate Consultation & Research
1 Introduction
Bournemouth Borough Council conducted a residents’ survey in Boscombe West in
September and October 2016. The results are reported in this document. The survey used
a similar questionnaire and methodology to the Bournemouth Opinion Survey (BOS).
As part of the Backing Boscombe campaign under the Boscombe Regeneration
Partnership the survey results allow the regeneration team to monitor Boscombe West
resident’s perceptions about the area that they live in. The Boscombe Regeneration Team
have carried out residents’ surveys since the 2008 Place Survey to ensure that the
Partnership is focussing on the issues that matter most to the residents, to establish
baseline figures to set targets against and to monitor changes in residents’ perceptions
over time.
1.1 Methodology
The Boscombe West residents’ survey 2016 was a paper survey and an option for online
completion was offered. The survey was issued on 5th September 2016 and closed on 31st
October 2016 (with one reminder sent out on the 3rd October). Questionnaires were sent to
a random sample of 2000 residents in Boscombe West. A total of 497 responses were
received providing a response rate of 25%.
1.2 Results
The number of responses is sufficient that we can have a reasonable level of confidence in
the results. On an observed statistic of 50%, the 95% confidence interval is +/-4.2%. This
means that we can be reasonably confident that if we surveyed the whole population of
Boscombe West the result would fall between 45.8% and 54.2%.
As with the BOS and previous Boscombe West residents’ surveys, the results have been
weighted by age group, gender, disability and ethnicity.
Where applicable, the 2016 results have been compared to previous Boscombe West
results.
Figures in this report are presented as a percentage of respondents who answered the
question i.e. excluding ‘don’t know’, ‘not applicable’ and ‘no reply’.
The percentages in this report will not always add up to 100% this can be because of
rounding or because respondents are allowed to select more than one response.

2 Corporate Consultation & Research
2 Overall satisfaction
Residents were asked “Overall, how satisfied or dissatisfied are you with your local area as
a place to live.” The local area is defined as the area within 15-20 minutes’ walk from
where you live. Satisfaction with the local area has remained fairly consistent since 2015.
Satisfaction is now 17% higher than it was in 2012. The proportion of residents dissatisfied
with the local area has decreased from one third (33%) in 2012 to less than one quarter
(22%) in 2015 and 2016.
Figure 1: Overall satisfaction with local area (% respondents)
BASE: All respondents
Respondents from other white backgrounds are significantly less satisfied with the local
area than white British and BME respondents.
Figure 2: Satisfaction with local area (% satisfied)
BASE: Varied as labelled *Small base
62
61
55
57
45
16
17
19
14
23
22
22
26
29
33
0% 20% 40% 60% 80% 100%
2016
2015
2014
2013
2012
Satisfied Neutral Dissatisfied
42
52
57
60
62
62
62
62
64
65
66
71
75
0 10 20 30 40 50 60 70 80
White Other (100)
45-54 years (67)
35-44 years (90)
Disability (50)
Male (254)
Total (486)
Female (217)
No disability (422)
16-34 years (206)
55-64 years (51)
White British (315)
65+ years (65)
*BME (47)

3 Corporate Consultation & Research
3 Residents’ priorities
Residents were asked which things are most important in making somewhere a good place
to live. They were asked to identify up to five issues from a list of twenty as well as having
the option to tick an ‘other’ box.
The table below shows how responses compare to 2015. Figures in bold show where a
difference is statistically significant.
The top five things that respondents identified as being the most important in making
somewhere a good place to live has remained consistent since 2015. The top five things
were the level of crime (68%), clean streets (46%), affordable decent housing (44%), parks
and open spaces (40%) and health services (35%).
The most significant change has been in shopping facilities which has increased by 15%
(from 20% in 2015 to 35% in 2016). Other significant changes included cultural facilities
which doubled from 8% in 2015 to 16% in 2016 and activities for teenagers which halved
from 14% in 2015 to 7% in 2016.
Table 1: Things making somewhere a good place to live (% selected as one of top 5)
Things that are most important in making somewhere a good place to live
2016 2015 Difference
The level of crime 68% 67% 1%
Clean streets 46% 49% -3%
Affordable decent housing 44% 46% -2%
Parks and open spaces 40% 38% 2%
Health services 35% 40% -5%
Shopping facilities 35% 20% 15%
Public transport 29% 27% 2%
Access to nature 26% 27% -1%
Job prospects 26% 21% 5%
Wage levels and local cost of living 18% 23% -5%
Cultural facilities (e.g. libraries, museums) 16% 8% 8%
Road and pavement repairs 15% 13% 2%
Education provision 14% 16% -2%
The level of traffic congestion 13% 19% -6%
Sports and leisure facilities 13% 9% 4%
Facilities for young children 12% 8% 4%
Community activities 9% 9% -
Activities for teenagers 7% 14% -7%
The level of pollution 7% 9% -2%
Race relations 6% 4% 2%
BASE: All respondents

4 Corporate Consultation & Research
Residents were also asked, from the same list, which things most needed improving in the
local area. The top five things that respondents identified as most needing improvement
has remained fairly consistent since 2015 with the exception of road and pavement repairs
which wasn’t in the top five in 2015. The top five things in 2016 were the level of crime
(67%), clean streets (42%), affordable decent housing (39%), road and pavement repairs
(36%) and the level of traffic congestion (27%).
The most significant change has been in road and pavement repairs which has increased
by 9% (from 27% in 2015 to 36% in 2016). Other significant changes included wage levels
and cost of living which decreased from 28% in 2015 to 21% in 2016 and facilities for
young children which doubled from 7% in 2015 to 14% in 2016.
Table 2: Things that most need improving (% selected as one of top 5)
Things that most need improving 2016 2015 Difference
The level of crime 67% 66% 1%
Clean streets 42% 36% 6%
Affordable decent housing 39% 43% -4%
Road and pavement repairs 36% 27% 9%
The level of traffic congestion 27% 31% -4%
Wage levels and local cost of living 21% 28% -7%
Job prospects 19% 18% 1%
Shopping facilities 15% 14% 1%
Activities for teenagers 14% 19% -5%
Facilities for young children 14% 7% 7%
Race relations 12% 6% 6%
Health services 11% 17% -6%
Cultural facilities (e.g. libraries, museums) 10% 12% -2%
Sports and leisure facilities 10% 10% -
Parks and open spaces 9% 14% -5%
Community activities 7% 13% -6%
Public transport 6% 5% 1%
Education provision 5% 7% -2%
The level of pollution 4% 7% -3%
Access to nature 2% 7% -5%
BASE: All respondents

5 Corporate Consultation & Research
The graph below shows the things that respondents see as important plotted against the
things that they see as most in need of improvement.
Figure 3: Importance vs. Improvement (% respondents)
BASE: All respondents
A Access to nature K Parks and open spaces
B Activities for teenagers L Public transport
C Affordable decent housing M Race relations
D Clean streets N Road and pavement repairs
E Community activities O Shopping facilities
F Cultural facilities (e.g. libraries, museums) P Sports and leisure facilities
G Education provision Q The level of crime
H Facilities for young children R The level of pollution
I Health services S The level of traffic congestion
J Job prospects T Wage levels and local cost of living
When respondents’ perceptions of importance and improvement are plotted against each
other, four segments are created which can help inform priorities for improvement. The four
segments are as follows:
Segment 1: Things respondents see as most in need of improvement and as most
important
The level of crime
Clean streets
Affordable decent housing
A
B
CD
E
FG
H
I
J
K
L
M
N
O
P
Q
R
S
T
0%
10%
20%
30%
40%
50%
60%
70%
80%
0% 10% 20% 30% 40% 50% 60% 70% 80%
Mo
st im
po
rtan
t
Most needs improving
Segment 1
Segment 3
Segment 2
Segment 4
6 Corporate Consultation & Research
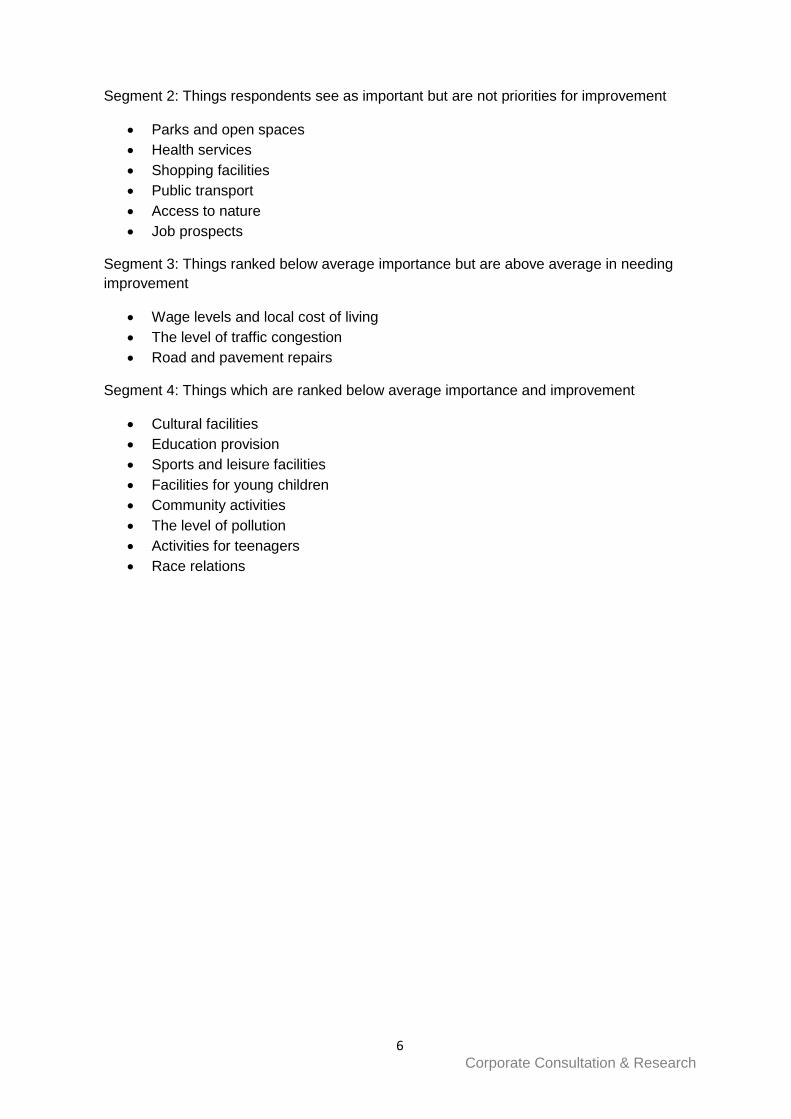
Segment 2: Things respondents see as important but are not priorities for improvement
Parks and open spaces
Health services
Shopping facilities
Public transport
Access to nature
Job prospects
Segment 3: Things ranked below average importance but are above average in needing
improvement
Wage levels and local cost of living
The level of traffic congestion
Road and pavement repairs
Segment 4: Things which are ranked below average importance and improvement
Cultural facilities
Education provision
Sports and leisure facilities
Facilities for young children
Community activities
The level of pollution
Activities for teenagers
Race relations

7 Corporate Consultation & Research
4 Service satisfaction and usage
The majority of services have seen a decrease in satisfaction since 2015, most notably with
keeping public land clear of litter, museums and galleries, sport and leisure facilities and
theatres and concert halls. Boscombe Market was included in the 2016 survey for the first
time so no previous years’ data is available. Satisfaction with each service is reported in
more detail later in this section.
Figure 4: Satisfaction with Council services (% satisfied)
BASE: All respondents
91
78
77
71
69
67
61
58
51
50
46
31
89
77
78
79
70
75
64
67
61
58
47
92
83
76
71
68
70
64
53
44
44
25
88
79
78
81
72
74
65
65
69
55
51
93
78
79
80
75
68
80
66
72
45
47
0 10 20 30 40 50 60 70 80 90 100
Seafront
Local bus services
Parks and open spaces
Refuse collection
Local transport information
Libraries
Boscombe Market
Doorstep recycling
Keeping public land clear of litter & refuse
Theatres/concert halls
Sport/leisure facilities
Museums/galleries
2012 2013 2014 2015 2016
8 Corporate Consultation & Research
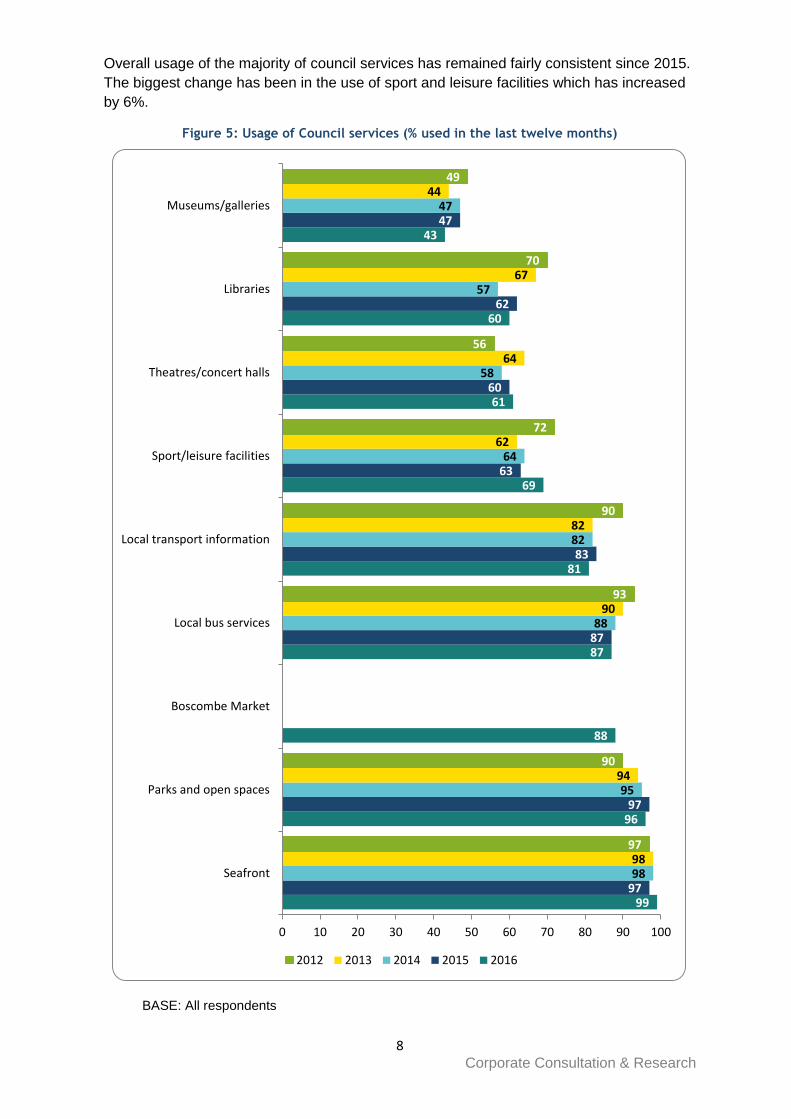
Overall usage of the majority of council services has remained fairly consistent since 2015.
The biggest change has been in the use of sport and leisure facilities which has increased
by 6%.
Figure 5: Usage of Council services (% used in the last twelve months)
BASE: All respondents
99
96
88
87
81
69
61
60
43
97
97
87
83
63
60
62
47
98
95
88
82
64
58
57
47
98
94
90
82
62
64
67
44
97
90
93
90
72
56
70
49
0 10 20 30 40 50 60 70 80 90 100
Seafront
Parks and open spaces
Boscombe Market
Local bus services
Local transport information
Sport/leisure facilities
Theatres/concert halls
Libraries
Museums/galleries
2012 2013 2014 2015 2016
9 Corporate Consultation & Research
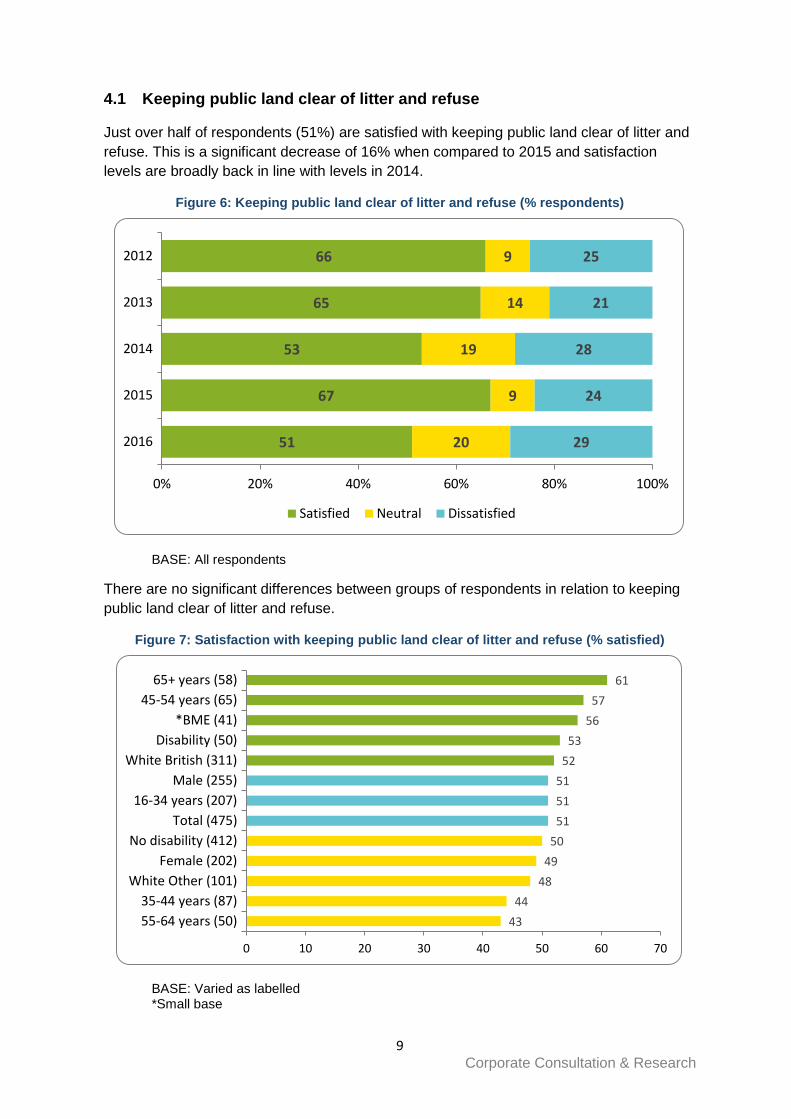
4.1 Keeping public land clear of litter and refuse
Just over half of respondents (51%) are satisfied with keeping public land clear of litter and
refuse. This is a significant decrease of 16% when compared to 2015 and satisfaction
levels are broadly back in line with levels in 2014.
Figure 6: Keeping public land clear of litter and refuse (% respondents)
BASE: All respondents
There are no significant differences between groups of respondents in relation to keeping
public land clear of litter and refuse.
Figure 7: Satisfaction with keeping public land clear of litter and refuse (% satisfied)
BASE: Varied as labelled *Small base
51
67
53
65
66
20
9
19
14
9
29
24
28
21
25
0% 20% 40% 60% 80% 100%
2016
2015
2014
2013
2012
Satisfied Neutral Dissatisfied
43
44
48
49
50
51
51
51
52
53
56
57
61
0 10 20 30 40 50 60 70
55-64 years (50)
35-44 years (87)
White Other (101)
Female (202)
No disability (412)
Total (475)
16-34 years (207)
Male (255)
White British (311)
Disability (50)
*BME (41)
45-54 years (65)
65+ years (58)
10 Corporate Consultation & Research
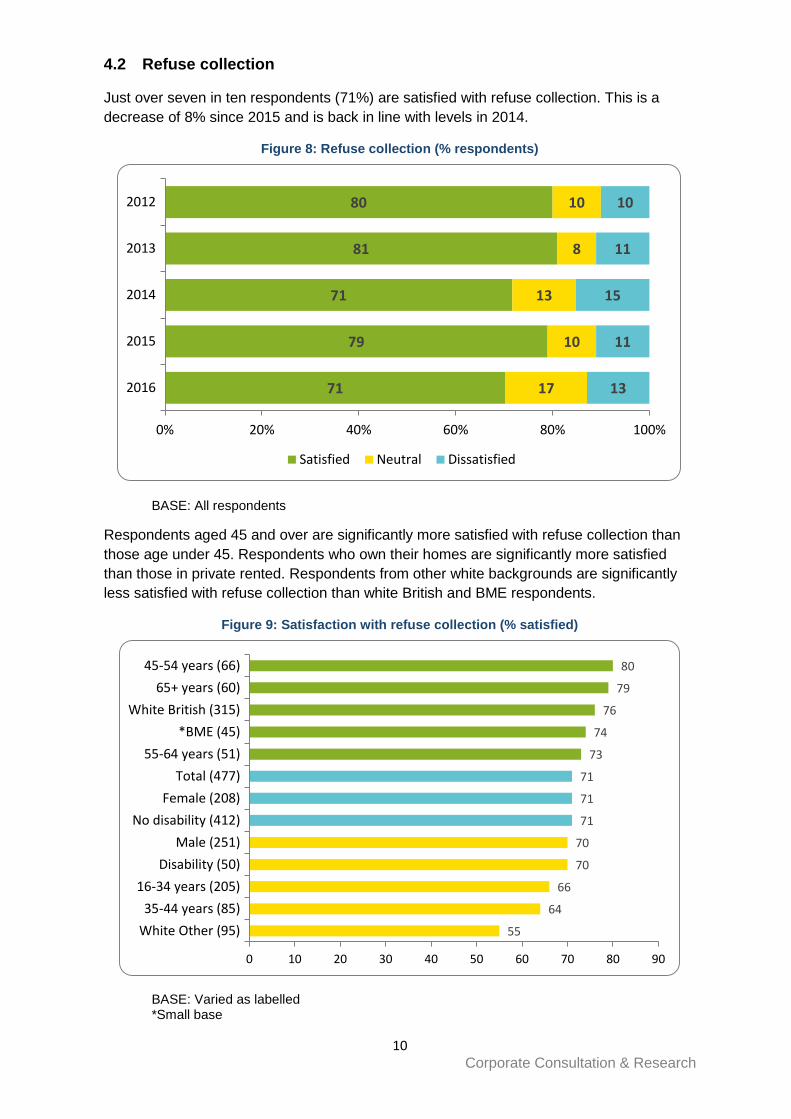
4.2 Refuse collection
Just over seven in ten respondents (71%) are satisfied with refuse collection. This is a
decrease of 8% since 2015 and is back in line with levels in 2014.
Figure 8: Refuse collection (% respondents)
BASE: All respondents
Respondents aged 45 and over are significantly more satisfied with refuse collection than
those age under 45. Respondents who own their homes are significantly more satisfied
than those in private rented. Respondents from other white backgrounds are significantly
less satisfied with refuse collection than white British and BME respondents.
Figure 9: Satisfaction with refuse collection (% satisfied)
BASE: Varied as labelled *Small base
71
79
71
81
80
17
10
13
8
10
13
11
15
11
10
0% 20% 40% 60% 80% 100%
2016
2015
2014
2013
2012
Satisfied Neutral Dissatisfied
55
64
66
70
70
71
71
71
73
74
76
79
80
0 10 20 30 40 50 60 70 80 90
White Other (95)
35-44 years (85)
16-34 years (205)
Disability (50)
Male (251)
No disability (412)
Female (208)
Total (477)
55-64 years (51)
*BME (45)
White British (315)
65+ years (60)
45-54 years (66)
11 Corporate Consultation & Research
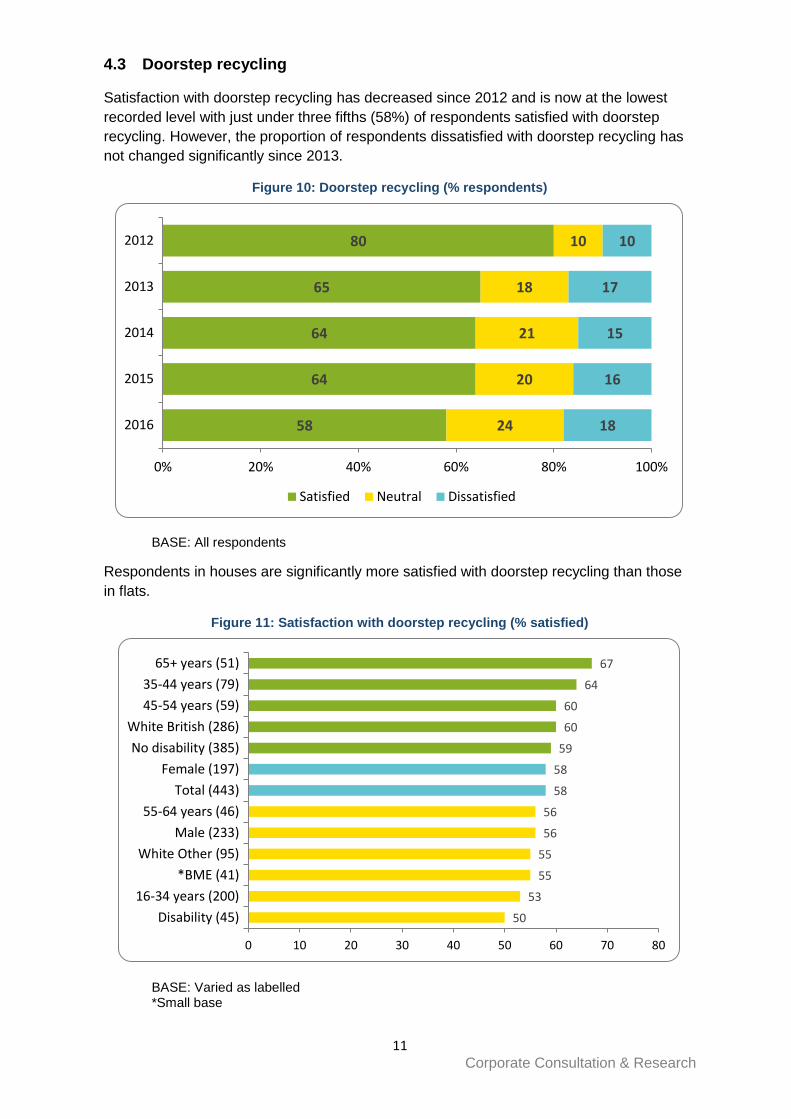
4.3 Doorstep recycling
Satisfaction with doorstep recycling has decreased since 2012 and is now at the lowest
recorded level with just under three fifths (58%) of respondents satisfied with doorstep
recycling. However, the proportion of respondents dissatisfied with doorstep recycling has
not changed significantly since 2013.
Figure 10: Doorstep recycling (% respondents)
BASE: All respondents
Respondents in houses are significantly more satisfied with doorstep recycling than those
in flats.
Figure 11: Satisfaction with doorstep recycling (% satisfied)
BASE: Varied as labelled *Small base
58
64
64
65
80
24
20
21
18
10
18
16
15
17
10
0% 20% 40% 60% 80% 100%
2016
2015
2014
2013
2012
Satisfied Neutral Dissatisfied
50
53
55
55
56
56
58
58
59
60
60
64
67
0 10 20 30 40 50 60 70 80
Disability (45)
16-34 years (200)
*BME (41)
White Other (95)
Male (233)
55-64 years (46)
Total (443)
Female (197)
No disability (385)
White British (286)
45-54 years (59)
35-44 years (79)
65+ years (51)

12 Corporate Consultation & Research
4.4 Local transport information
Almost seven in ten respondents (69%) are satisfied with local transport information.
Satisfaction with local transport information has remained fairly consistent since 2014 and
dissatisfaction is now at its lowest level. Just over four fifths of respondents (81%) use local
transport information which is consistent with previous years.
Figure 12: Local transport information (% respondents)
BASE: All respondents
Female respondents are significantly more satisfied with transport information than male
respondents.
Figure 13: Satisfaction with local transport information (% satisfied)
BASE: Varied as labelled *Small base
69
70
68
72
75
26
17
26
14
14
5
13
6
14
12
0% 20% 40% 60% 80% 100%
2016
2015
2014
2013
2012
Satisfied Neutral Dissatisfied
61
64
66
68
68
68
69
70
70
74
75
76
78
0 10 20 30 40 50 60 70 80 90
*BME (42)
45-54 years (63)
Male (240)
White British (293)
Disability (45)
16-34 years (202)
Total (449)
35-44 years (83)
No disability (392)
Female (194)
55-64 years (44)
White Other (92)
65+ years (51)
13 Corporate Consultation & Research
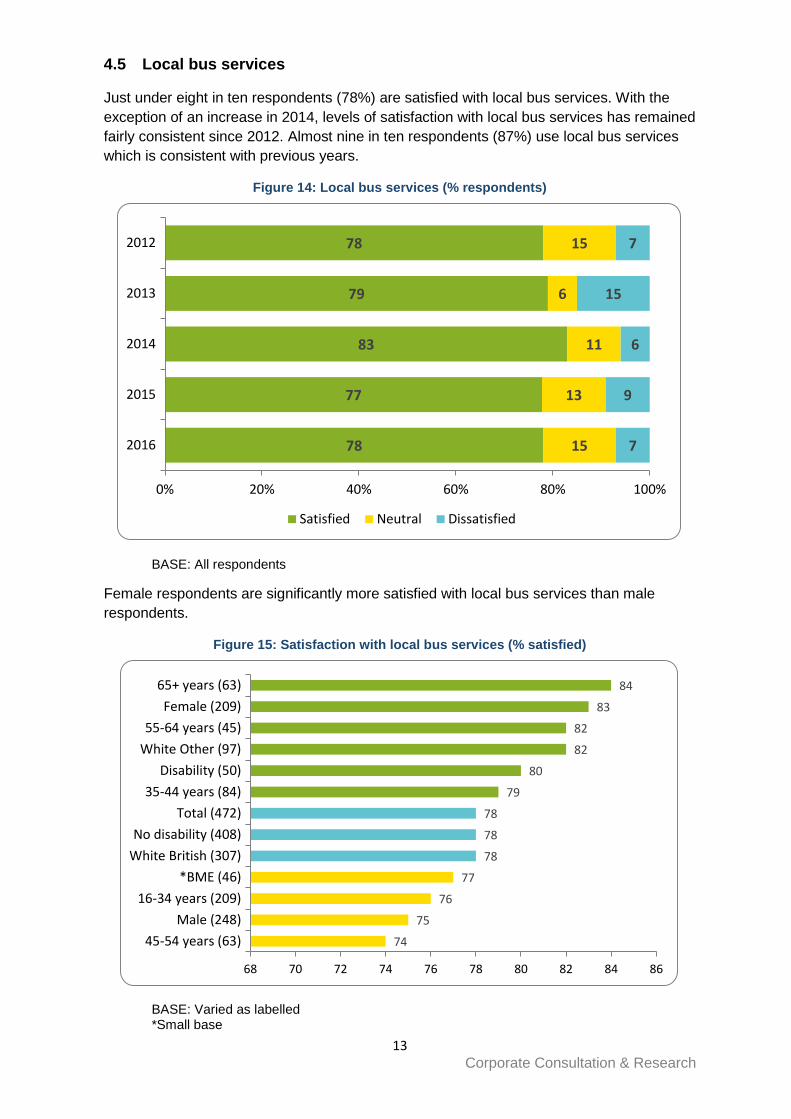
4.5 Local bus services
Just under eight in ten respondents (78%) are satisfied with local bus services. With the
exception of an increase in 2014, levels of satisfaction with local bus services has remained
fairly consistent since 2012. Almost nine in ten respondents (87%) use local bus services
which is consistent with previous years.
Figure 14: Local bus services (% respondents)
BASE: All respondents
Female respondents are significantly more satisfied with local bus services than male
respondents.
Figure 15: Satisfaction with local bus services (% satisfied)
BASE: Varied as labelled *Small base
78
77
83
79
78
15
13
11
6
15
7
9
6
15
7
0% 20% 40% 60% 80% 100%
2016
2015
2014
2013
2012
Satisfied Neutral Dissatisfied
74
75
76
77
78
78
78
79
80
82
82
83
84
68 70 72 74 76 78 80 82 84 86
45-54 years (63)
Male (248)
16-34 years (209)
*BME (46)
White British (307)
No disability (408)
Total (472)
35-44 years (84)
Disability (50)
White Other (97)
55-64 years (45)
Female (209)
65+ years (63)
14 Corporate Consultation & Research
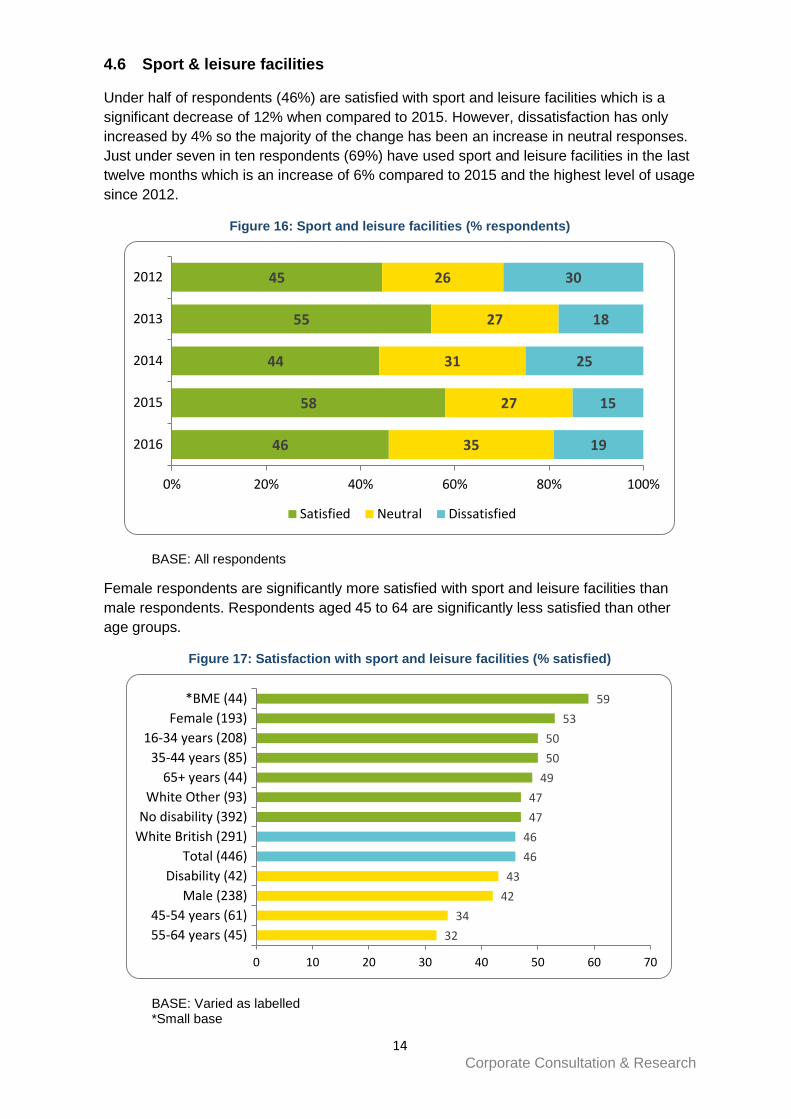
4.6 Sport & leisure facilities
Under half of respondents (46%) are satisfied with sport and leisure facilities which is a
significant decrease of 12% when compared to 2015. However, dissatisfaction has only
increased by 4% so the majority of the change has been an increase in neutral responses.
Just under seven in ten respondents (69%) have used sport and leisure facilities in the last
twelve months which is an increase of 6% compared to 2015 and the highest level of usage
since 2012.
Figure 16: Sport and leisure facilities (% respondents)
BASE: All respondents
Female respondents are significantly more satisfied with sport and leisure facilities than
male respondents. Respondents aged 45 to 64 are significantly less satisfied than other
age groups.
Figure 17: Satisfaction with sport and leisure facilities (% satisfied)
BASE: Varied as labelled *Small base
46
58
44
55
45
35
27
31
27
26
19
15
25
18
30
0% 20% 40% 60% 80% 100%
2016
2015
2014
2013
2012
Satisfied Neutral Dissatisfied
32
34
42
43
46
46
47
47
49
50
50
53
59
0 10 20 30 40 50 60 70
55-64 years (45)
45-54 years (61)
Male (238)
Disability (42)
Total (446)
White British (291)
No disability (392)
White Other (93)
65+ years (44)
35-44 years (85)
16-34 years (208)
Female (193)
*BME (44)
15 Corporate Consultation & Research
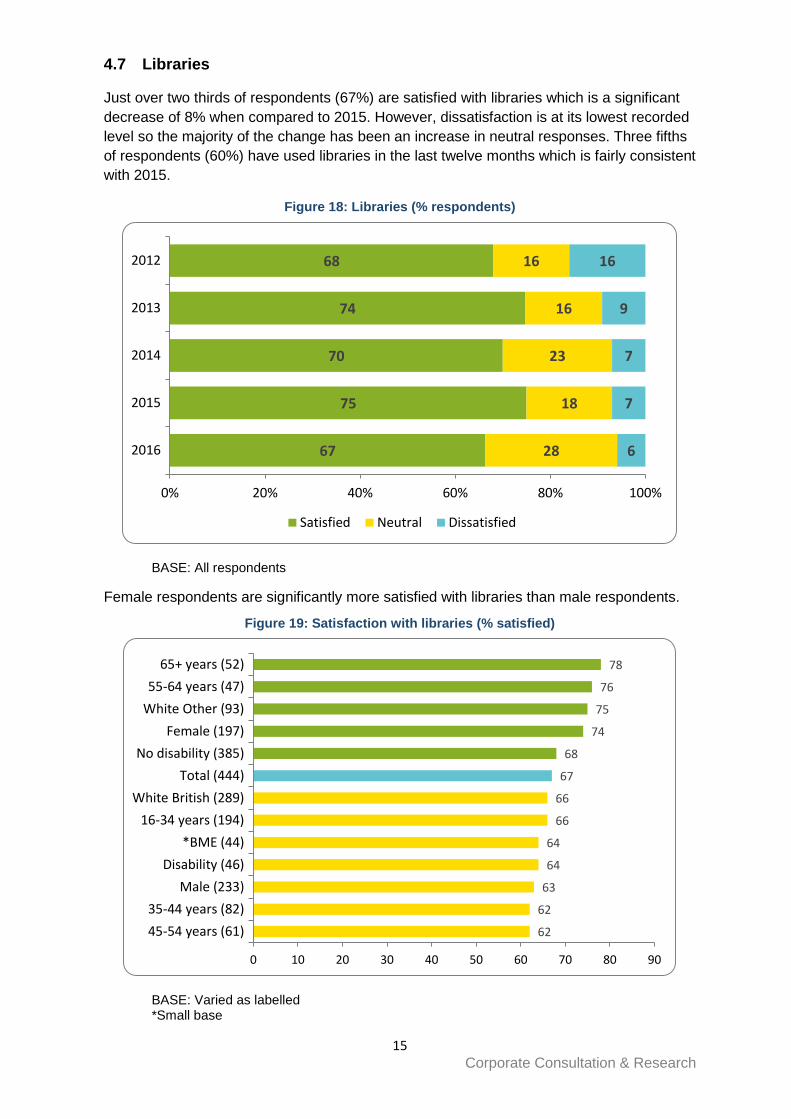
4.7 Libraries
Just over two thirds of respondents (67%) are satisfied with libraries which is a significant
decrease of 8% when compared to 2015. However, dissatisfaction is at its lowest recorded
level so the majority of the change has been an increase in neutral responses. Three fifths
of respondents (60%) have used libraries in the last twelve months which is fairly consistent
with 2015.
Figure 18: Libraries (% respondents)
BASE: All respondents
Female respondents are significantly more satisfied with libraries than male respondents.
Figure 19: Satisfaction with libraries (% satisfied)
BASE: Varied as labelled *Small base
67
75
70
74
68
28
18
23
16
16
6
7
7
9
16
0% 20% 40% 60% 80% 100%
2016
2015
2014
2013
2012
Satisfied Neutral Dissatisfied
62
62
63
64
64
66
66
67
68
74
75
76
78
0 10 20 30 40 50 60 70 80 90
45-54 years (61)
35-44 years (82)
Male (233)
Disability (46)
*BME (44)
16-34 years (194)
White British (289)
Total (444)
No disability (385)
Female (197)
White Other (93)
55-64 years (47)
65+ years (52)
16 Corporate Consultation & Research
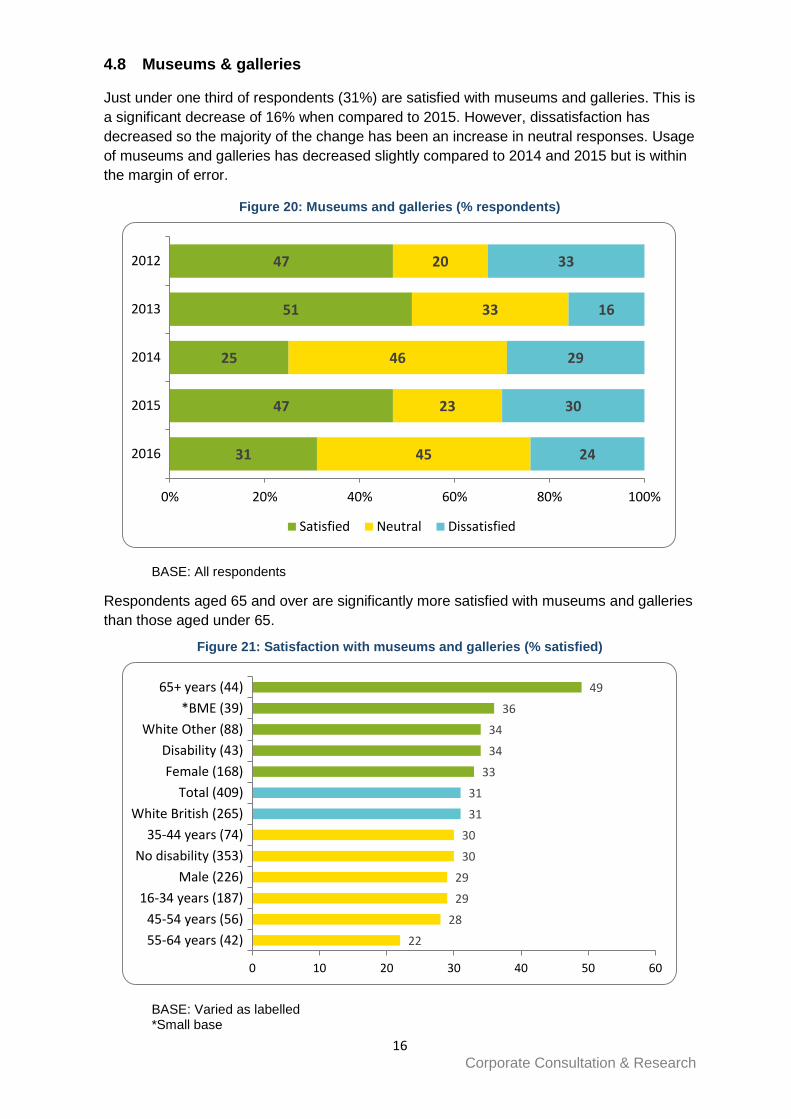
4.8 Museums & galleries
Just under one third of respondents (31%) are satisfied with museums and galleries. This is
a significant decrease of 16% when compared to 2015. However, dissatisfaction has
decreased so the majority of the change has been an increase in neutral responses. Usage
of museums and galleries has decreased slightly compared to 2014 and 2015 but is within
the margin of error.
Figure 20: Museums and galleries (% respondents)
BASE: All respondents
Respondents aged 65 and over are significantly more satisfied with museums and galleries
than those aged under 65.
Figure 21: Satisfaction with museums and galleries (% satisfied)
BASE: Varied as labelled *Small base
31
47
25
51
47
45
23
46
33
20
24
30
29
16
33
0% 20% 40% 60% 80% 100%
2016
2015
2014
2013
2012
Satisfied Neutral Dissatisfied
22
28
29
29
30
30
31
31
33
34
34
36
49
0 10 20 30 40 50 60
55-64 years (42)
45-54 years (56)
16-34 years (187)
Male (226)
No disability (353)
35-44 years (74)
White British (265)
Total (409)
Female (168)
Disability (43)
White Other (88)
*BME (39)
65+ years (44)
17 Corporate Consultation & Research
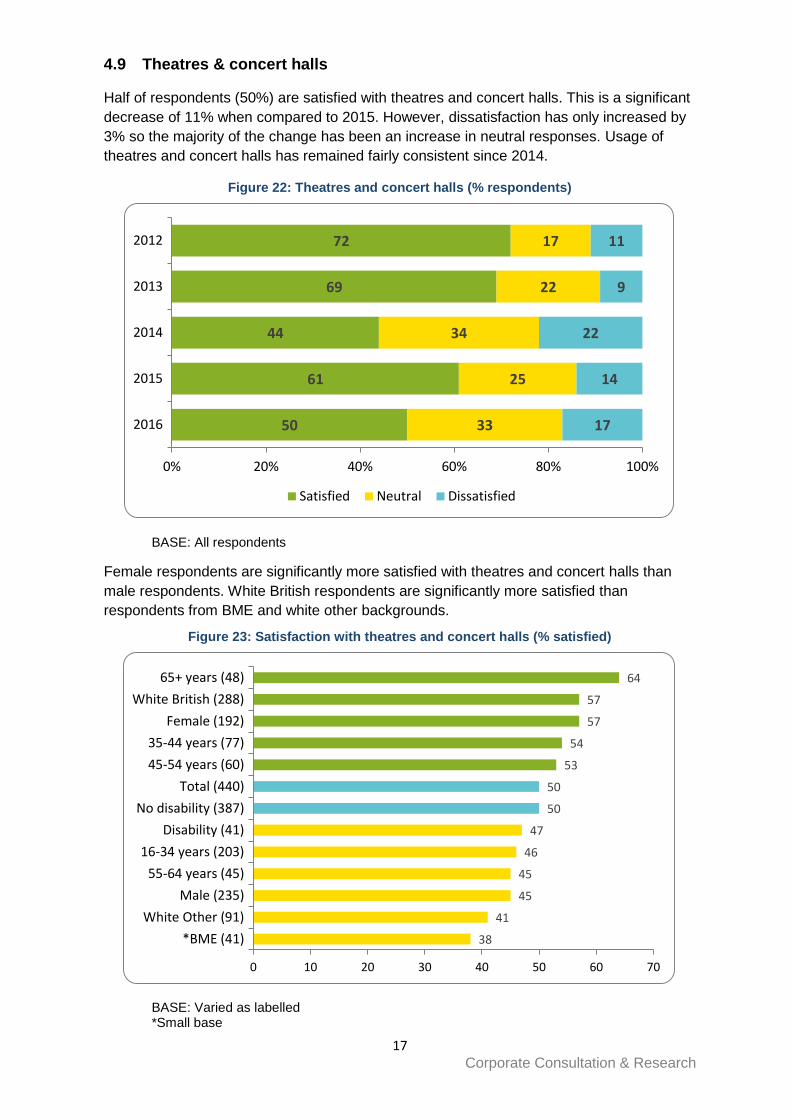
4.9 Theatres & concert halls
Half of respondents (50%) are satisfied with theatres and concert halls. This is a significant
decrease of 11% when compared to 2015. However, dissatisfaction has only increased by
3% so the majority of the change has been an increase in neutral responses. Usage of
theatres and concert halls has remained fairly consistent since 2014.
Figure 22: Theatres and concert halls (% respondents)
BASE: All respondents
Female respondents are significantly more satisfied with theatres and concert halls than
male respondents. White British respondents are significantly more satisfied than
respondents from BME and white other backgrounds.
Figure 23: Satisfaction with theatres and concert halls (% satisfied)
BASE: Varied as labelled *Small base
50
61
44
69
72
33
25
34
22
17
17
14
22
9
11
0% 20% 40% 60% 80% 100%
2016
2015
2014
2013
2012
Satisfied Neutral Dissatisfied
38
41
45
45
46
47
50
50
53
54
57
57
64
0 10 20 30 40 50 60 70
*BME (41)
White Other (91)
Male (235)
55-64 years (45)
16-34 years (203)
Disability (41)
No disability (387)
Total (440)
45-54 years (60)
35-44 years (77)
Female (192)
White British (288)
65+ years (48)
18 Corporate Consultation & Research
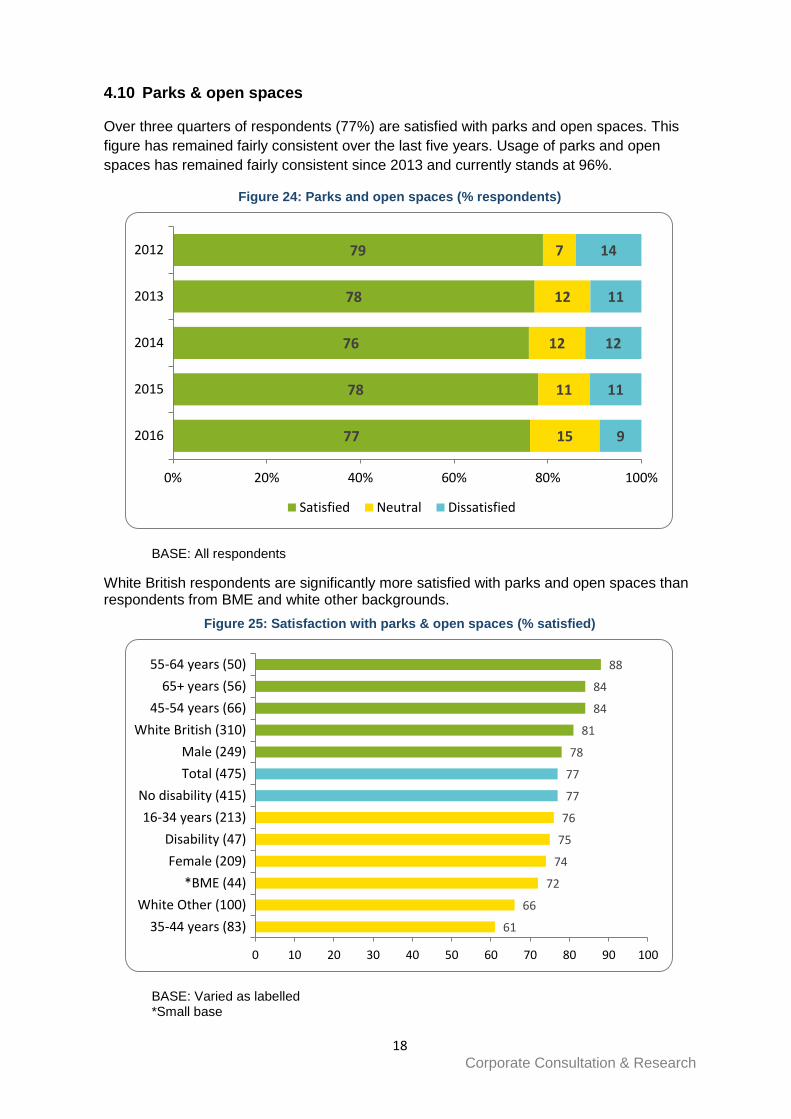
4.10 Parks & open spaces
Over three quarters of respondents (77%) are satisfied with parks and open spaces. This
figure has remained fairly consistent over the last five years. Usage of parks and open
spaces has remained fairly consistent since 2013 and currently stands at 96%.
Figure 24: Parks and open spaces (% respondents)
BASE: All respondents
White British respondents are significantly more satisfied with parks and open spaces than respondents from BME and white other backgrounds.
Figure 25: Satisfaction with parks & open spaces (% satisfied)
BASE: Varied as labelled *Small base
77
78
76
78
79
15
11
12
12
7
9
11
12
11
14
0% 20% 40% 60% 80% 100%
2016
2015
2014
2013
2012
Satisfied Neutral Dissatisfied
61
66
72
74
75
76
77
77
78
81
84
84
88
0 10 20 30 40 50 60 70 80 90 100
35-44 years (83)
White Other (100)
*BME (44)
Female (209)
Disability (47)
16-34 years (213)
No disability (415)
Total (475)
Male (249)
White British (310)
45-54 years (66)
65+ years (56)
55-64 years (50)
19 Corporate Consultation & Research
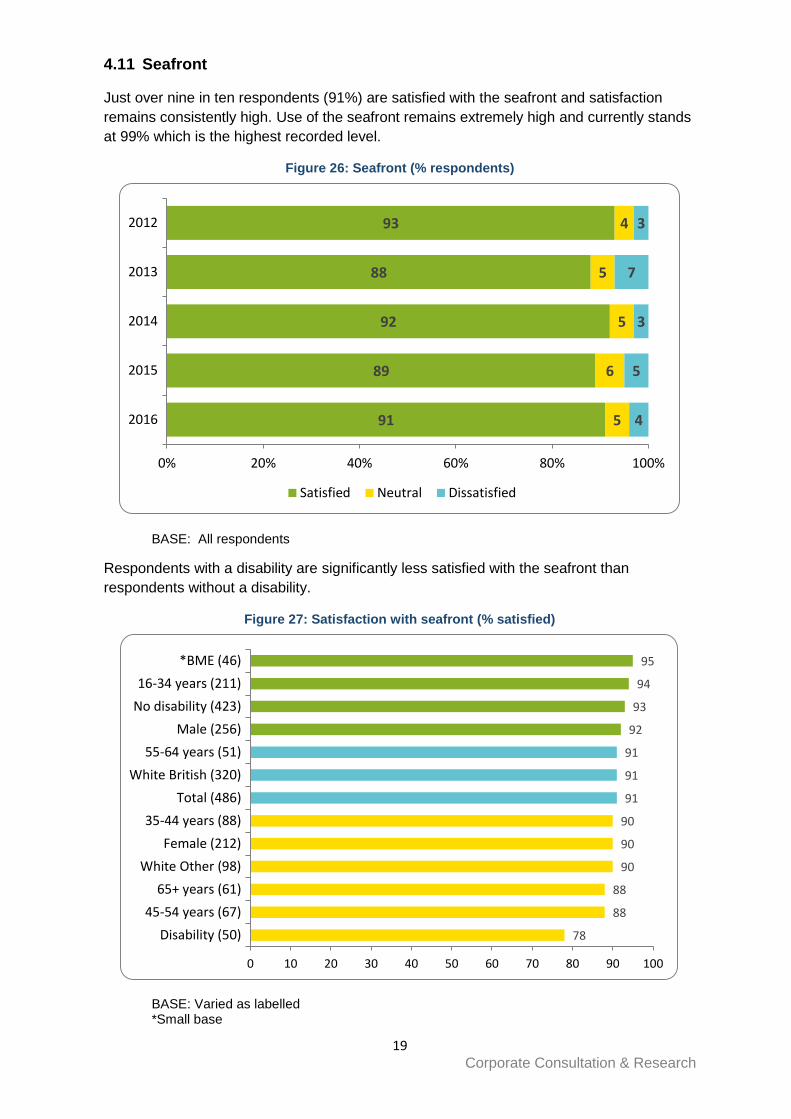
4.11 Seafront
Just over nine in ten respondents (91%) are satisfied with the seafront and satisfaction
remains consistently high. Use of the seafront remains extremely high and currently stands
at 99% which is the highest recorded level.
Figure 26: Seafront (% respondents)
BASE: All respondents
Respondents with a disability are significantly less satisfied with the seafront than
respondents without a disability.
Figure 27: Satisfaction with seafront (% satisfied)
BASE: Varied as labelled *Small base
91
89
92
88
93
5
6
5
5
4
4
5
3
7
3
0% 20% 40% 60% 80% 100%
2016
2015
2014
2013
2012
Satisfied Neutral Dissatisfied
78
88
88
90
90
90
91
91
91
92
93
94
95
0 10 20 30 40 50 60 70 80 90 100
Disability (50)
45-54 years (67)
65+ years (61)
White Other (98)
Female (212)
35-44 years (88)
Total (486)
White British (320)
55-64 years (51)
Male (256)
No disability (423)
16-34 years (211)
*BME (46)
20 Corporate Consultation & Research
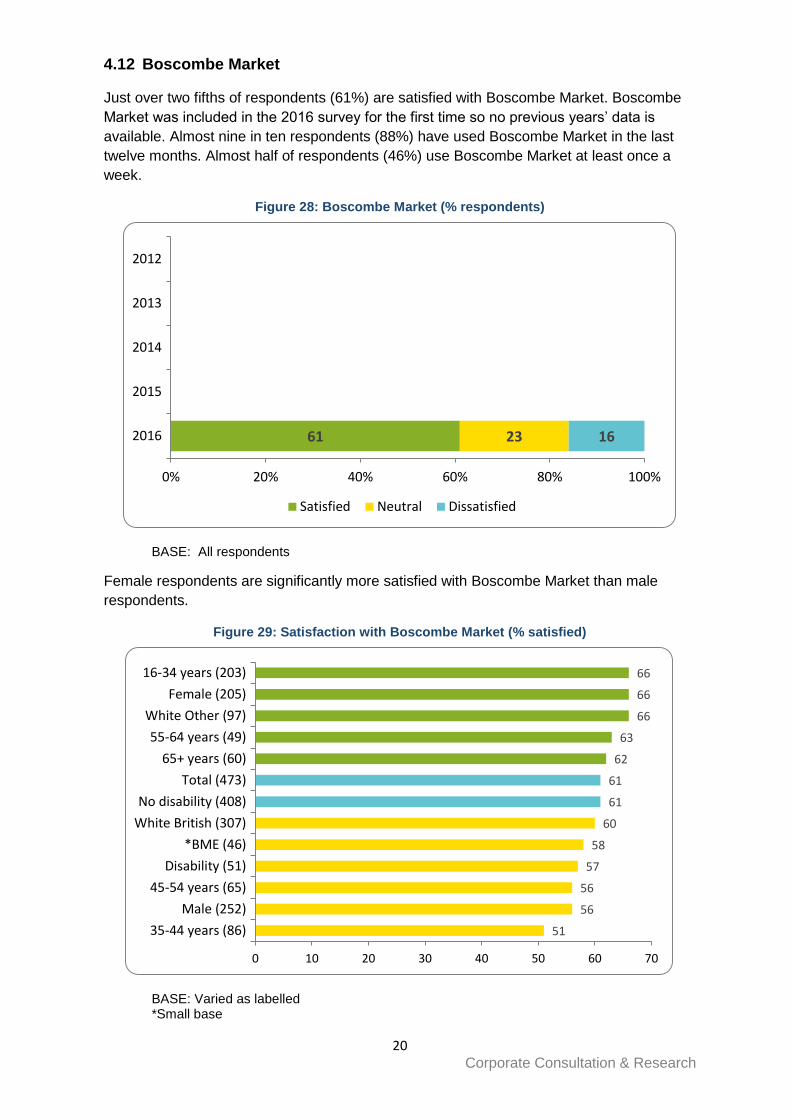
4.12 Boscombe Market
Just over two fifths of respondents (61%) are satisfied with Boscombe Market. Boscombe
Market was included in the 2016 survey for the first time so no previous years’ data is
available. Almost nine in ten respondents (88%) have used Boscombe Market in the last
twelve months. Almost half of respondents (46%) use Boscombe Market at least once a
week.
Figure 28: Boscombe Market (% respondents)
BASE: All respondents
Female respondents are significantly more satisfied with Boscombe Market than male
respondents.
Figure 29: Satisfaction with Boscombe Market (% satisfied)
BASE: Varied as labelled *Small base
61 23 16
0% 20% 40% 60% 80% 100%
2016
2015
2014
2013
2012
Satisfied Neutral Dissatisfied
51
56
56
57
58
60
61
61
62
63
66
66
66
0 10 20 30 40 50 60 70
35-44 years (86)
Male (252)
45-54 years (65)
Disability (51)
*BME (46)
White British (307)
No disability (408)
Total (473)
65+ years (60)
55-64 years (49)
White Other (97)
Female (205)
16-34 years (203)

21 Corporate Consultation & Research
5 Your community
Just under three fifths of respondents (58%) say that they feel they belong to their local
area. This is a significant increase of 7% when compared to the 51% of respondents in
2015 saying they felt they belonged to their local area and is currently at its highest
recorded level.
Figure 30: How strongly do you feel you belong to your local area? (% respondents)
BASE: All respondents
Respondents sense of belonging increases with age and respondents aged under 45 are
significantly less likely to feel a sense of belonging than those aged 65 and over.
Respondents who have lived in the area for three years or more are significantly more likely
to have a sense of belonging than those who have lived in the area for less than three
years.
Figure 31: Sense of belonging to local area (% belonging)
BASE: Varied as labelled *Small base
14
13
11
14
19
44
38
44
38
37
28
34
27
30
25
15
15
18
19
20
0% 20% 40% 60% 80% 100%
2016
2015
2014
2013
2012
Very strongly Fairly strongly Not very strongly Not at all strongly
54
55
55
56
57
57
58
59
59
64
67
68
70
0 10 20 30 40 50 60 70 80
16-34 years (205)
White British (317)
35-44 years (88)
Female (211)
No disability (419)
45-54 years (66)
Total (481)
White Other (99)
Male (255)
Disability (51)
55-64 years (50)
*BME (43)
65+ years (65)

22 Corporate Consultation & Research
5.1 People from different ethnic backgrounds get on well together
Just over half of respondents (53%) agree that people from different ethnic backgrounds
get on well together which is fairly consistent with previous years. Just under one quarter of
respondents (23%) disagreed that people from different ethnic backgrounds get on well
together and a similar proportion of respondents (24%) gave a neutral response.
Figure 32: To what extent do you agree or disagree that your local area is a place where people from different ethnic backgrounds get on well together? (% respondents)
BASE: All respondents
Male respondents are significantly more likely to agree that people from different ethnic
backgrounds get on well together compared to female respondents. White British
respondents are significantly less likely to agree that people from different ethnic
backgrounds get on well together compared to those from other white backgrounds.
Respondents living in flats are significantly more likely to agree that people from different
ethnic backgrounds get on well together compared to those living in houses.
Figure 33: Different ethnic backgrounds get on well together (% agree)
BASE: Varied as labelled *Small base
53
52
54
52
56
24
22
23
21
19
23
26
23
28
25
0% 20% 40% 60% 80% 100%
2016
2015
2014
2013
2012
Agree Neutral Disagree
46
47
48
50
50
52
53
54
58
59
60
63
65
0 10 20 30 40 50 60 70
45-54 years (67)
Disability (50)
Female (195)
White British (293)
16-34 years (201)
*BME (45)
Total (458)
No disability (398)
35-44 years (76)
Male (248)
55-64 years (49)
65+ years (60)
White Other (99)
23 Corporate Consultation & Research
6 Community safety
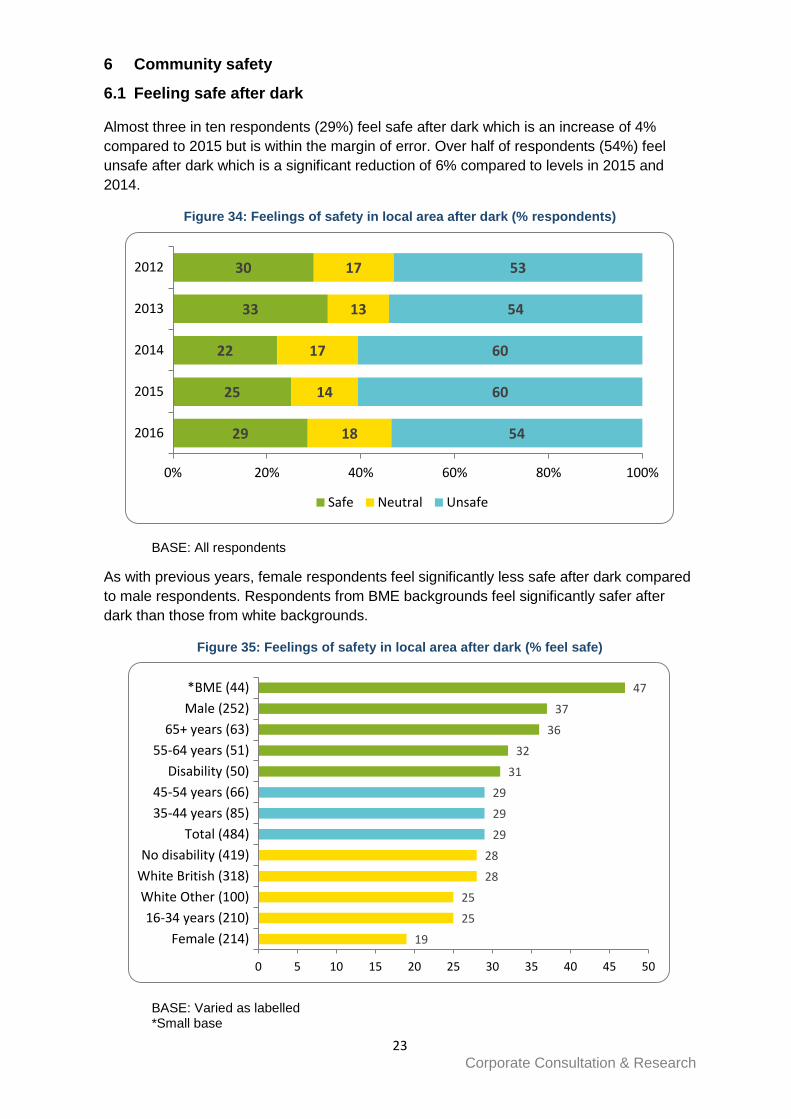
6.1 Feeling safe after dark
Almost three in ten respondents (29%) feel safe after dark which is an increase of 4%
compared to 2015 but is within the margin of error. Over half of respondents (54%) feel
unsafe after dark which is a significant reduction of 6% compared to levels in 2015 and
2014.
Figure 34: Feelings of safety in local area after dark (% respondents)
BASE: All respondents
As with previous years, female respondents feel significantly less safe after dark compared
to male respondents. Respondents from BME backgrounds feel significantly safer after
dark than those from white backgrounds.
Figure 35: Feelings of safety in local area after dark (% feel safe)
BASE: Varied as labelled *Small base
29
25
22
33
30
18
14
17
13
17
54
60
60
54
53
0% 20% 40% 60% 80% 100%
2016
2015
2014
2013
2012
Safe Neutral Unsafe
19
25
25
28
28
29
29
29
31
32
36
37
47
0 5 10 15 20 25 30 35 40 45 50
Female (214)
16-34 years (210)
White Other (100)
White British (318)
No disability (419)
Total (484)
35-44 years (85)
45-54 years (66)
Disability (50)
55-64 years (51)
65+ years (63)
Male (252)
*BME (44)
24 Corporate Consultation & Research
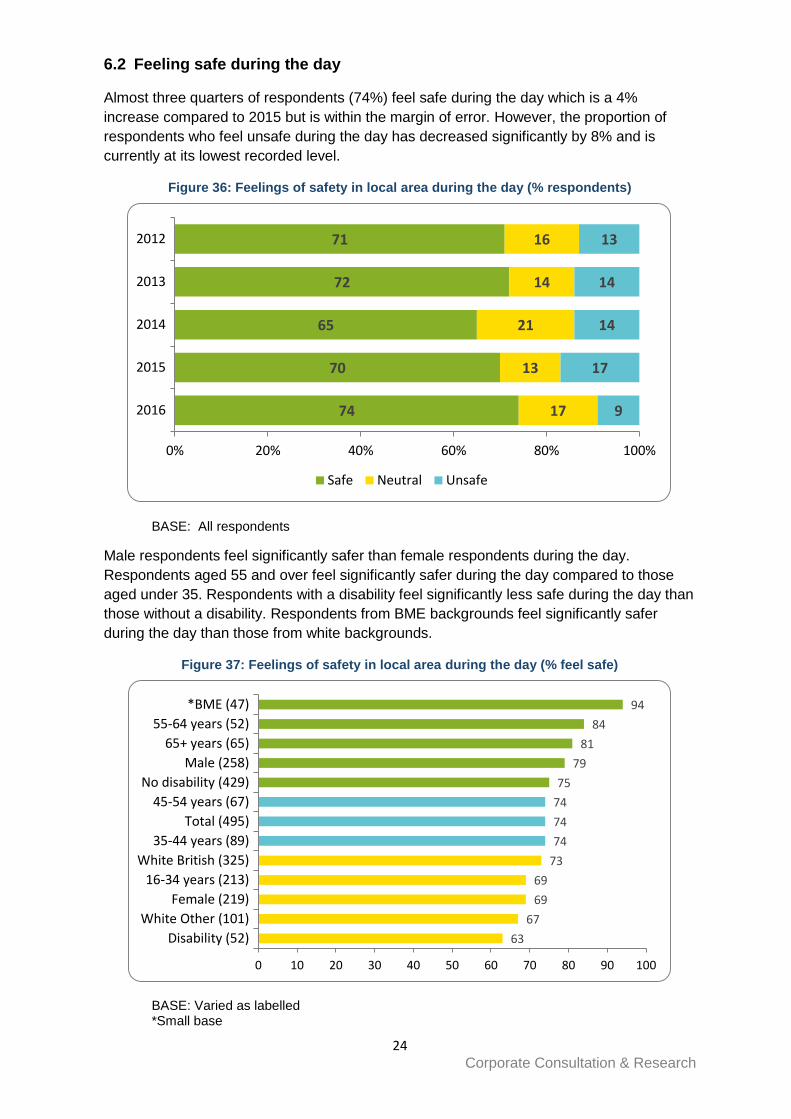
6.2 Feeling safe during the day
Almost three quarters of respondents (74%) feel safe during the day which is a 4%
increase compared to 2015 but is within the margin of error. However, the proportion of
respondents who feel unsafe during the day has decreased significantly by 8% and is
currently at its lowest recorded level.
Figure 36: Feelings of safety in local area during the day (% respondents)
BASE: All respondents
Male respondents feel significantly safer than female respondents during the day.
Respondents aged 55 and over feel significantly safer during the day compared to those
aged under 35. Respondents with a disability feel significantly less safe during the day than
those without a disability. Respondents from BME backgrounds feel significantly safer
during the day than those from white backgrounds.
Figure 37: Feelings of safety in local area during the day (% feel safe)
BASE: Varied as labelled *Small base
74
70
65
72
71
17
13
21
14
16
9
17
14
14
13
0% 20% 40% 60% 80% 100%
2016
2015
2014
2013
2012
Safe Neutral Unsafe
63
67
69
69
73
74
74
74
75
79
81
84
94
0 10 20 30 40 50 60 70 80 90 100
Disability (52)
White Other (101)
Female (219)
16-34 years (213)
White British (325)
35-44 years (89)
Total (495)
45-54 years (67)
No disability (429)
Male (258)
65+ years (65)
55-64 years (52)
*BME (47)
25 Corporate Consultation & Research
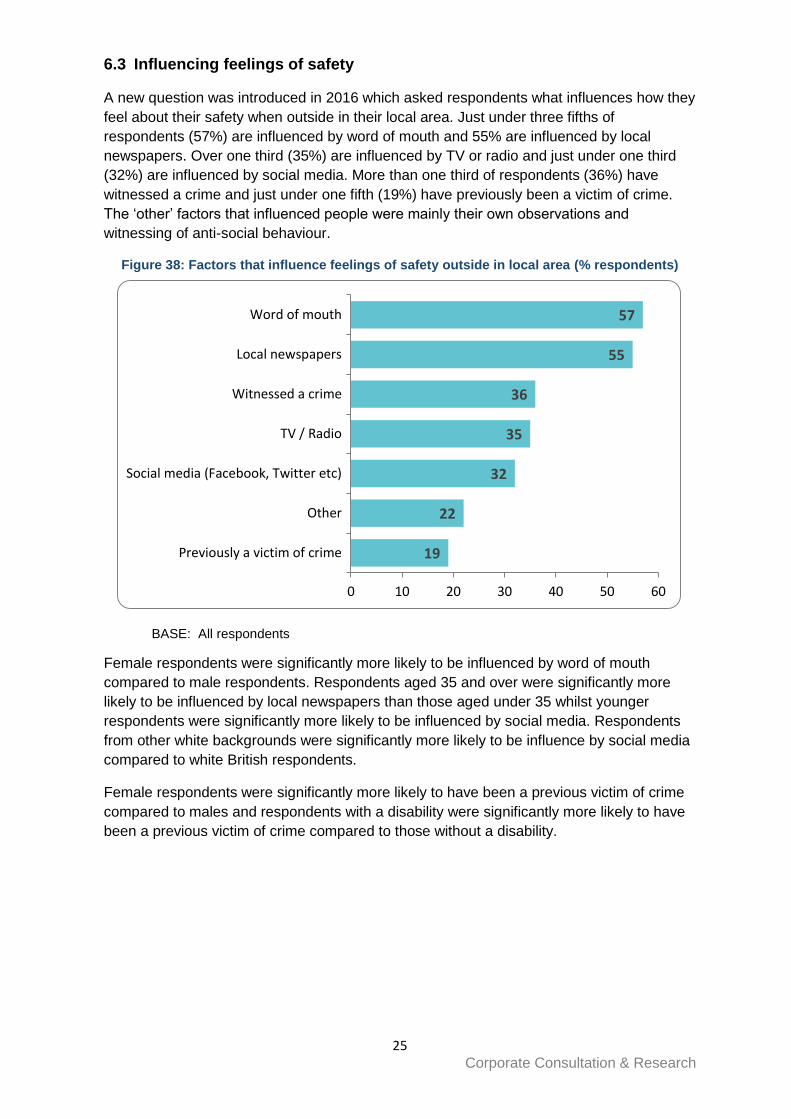
6.3 Influencing feelings of safety
A new question was introduced in 2016 which asked respondents what influences how they
feel about their safety when outside in their local area. Just under three fifths of
respondents (57%) are influenced by word of mouth and 55% are influenced by local
newspapers. Over one third (35%) are influenced by TV or radio and just under one third
(32%) are influenced by social media. More than one third of respondents (36%) have
witnessed a crime and just under one fifth (19%) have previously been a victim of crime.
The ‘other’ factors that influenced people were mainly their own observations and
witnessing of anti-social behaviour.
Figure 38: Factors that influence feelings of safety outside in local area (% respondents)
BASE: All respondents
Female respondents were significantly more likely to be influenced by word of mouth
compared to male respondents. Respondents aged 35 and over were significantly more
likely to be influenced by local newspapers than those aged under 35 whilst younger
respondents were significantly more likely to be influenced by social media. Respondents
from other white backgrounds were significantly more likely to be influence by social media
compared to white British respondents.
Female respondents were significantly more likely to have been a previous victim of crime
compared to males and respondents with a disability were significantly more likely to have
been a previous victim of crime compared to those without a disability.
19
22
32
35
36
55
57
0 10 20 30 40 50 60
Previously a victim of crime
Other
Social media (Facebook, Twitter etc)
TV / Radio
Witnessed a crime
Local newspapers
Word of mouth
26 Corporate Consultation & Research
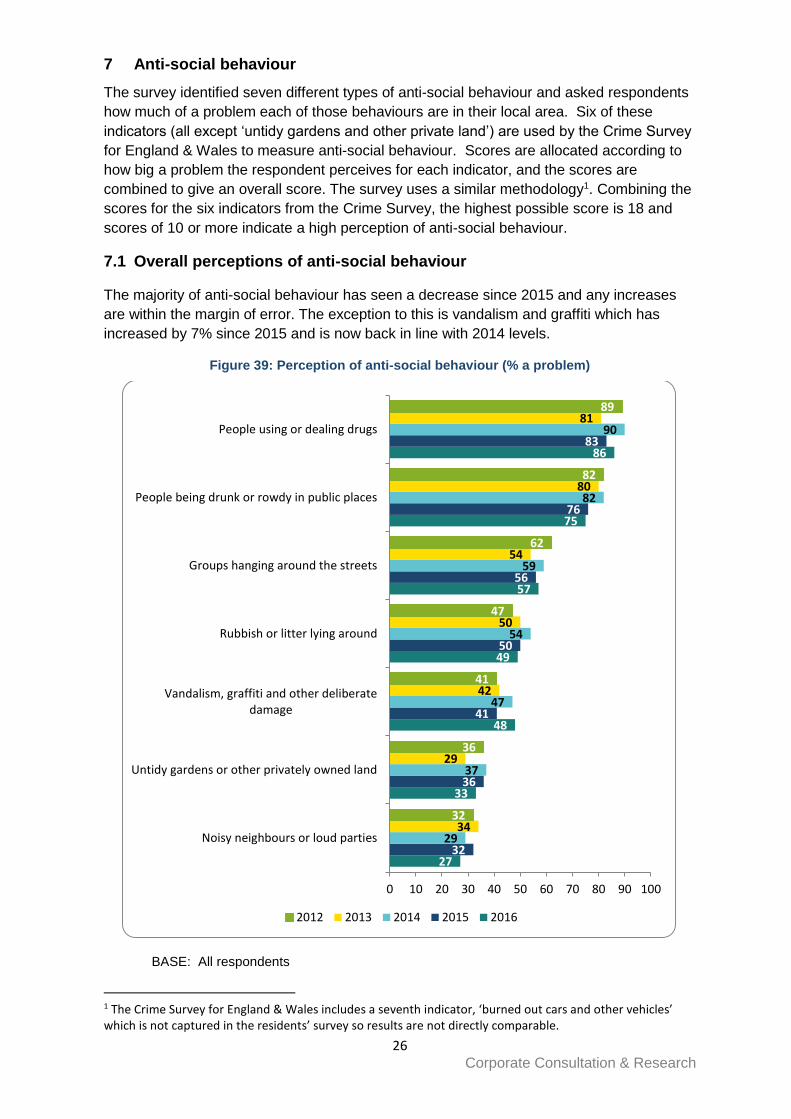
7 Anti-social behaviour
The survey identified seven different types of anti-social behaviour and asked respondents
how much of a problem each of those behaviours are in their local area. Six of these
indicators (all except ‘untidy gardens and other private land’) are used by the Crime Survey
for England & Wales to measure anti-social behaviour. Scores are allocated according to
how big a problem the respondent perceives for each indicator, and the scores are
combined to give an overall score. The survey uses a similar methodology1. Combining the
scores for the six indicators from the Crime Survey, the highest possible score is 18 and
scores of 10 or more indicate a high perception of anti-social behaviour.
7.1 Overall perceptions of anti-social behaviour
The majority of anti-social behaviour has seen a decrease since 2015 and any increases
are within the margin of error. The exception to this is vandalism and graffiti which has
increased by 7% since 2015 and is now back in line with 2014 levels.
Figure 39: Perception of anti-social behaviour (% a problem)
BASE: All respondents
1 The Crime Survey for England & Wales includes a seventh indicator, ‘burned out cars and other vehicles’ which is not captured in the residents’ survey so results are not directly comparable.
27
33
48
49
57
75
86
32
36
41
50
56
76
83
29
37
47
54
59
82
90
34
29
42
50
54
80
81
32
36
41
47
62
82
89
0 10 20 30 40 50 60 70 80 90 100
Noisy neighbours or loud parties
Untidy gardens or other privately owned land
Vandalism, graffiti and other deliberatedamage
Rubbish or litter lying around
Groups hanging around the streets
People being drunk or rowdy in public places
People using or dealing drugs
2012 2013 2014 2015 2016

27 Corporate Consultation & Research
The proportion of respondents who have a high perception of anti-social behaviour
(combined score of ten or more) has decreased slightly since 2015 but is within the margin
of error.
Figure 40: Perception of anti-social behaviour (% high perception)
BASE: All respondents
Respondents aged 35 to 44 are significantly more likely to perceive high levels of anti-
social behaviour compared to all other age groups. Respondents who have lived in the
local area for two years or more are significantly more likely to perceive high levels of anti-
social behaviour than those who have lived in the area for less than two years.
Figure 41: High perception of anti-social behaviour (% respondents)
BASE: Varied as labelled *Small base
5147
5856
54
0
10
20
30
40
50
60
70
2012 2013 2014 2015 2016
48
50
52
53
53
54
55
56
56
58
62
64
71
0 10 20 30 40 50 60 70 80
16-34 years (204)
65+ years (54)
White British (305)
Male (240)
No disability (405)
Total (464)
45-54 years (65)
*BME (39)
Female (210)
55-64 years (48)
White Other (97)
Disability (48)
35-44 years (86)

28 Corporate Consultation & Research
7.2 Noisy neighbours and loud parties
Respondents aged 35 to 44 are significantly more likely to perceive noisy neighbours as a
problem compared to all other age groups and respondents with a disability are significantly
more likely to perceive noisy neighbours as a problem than those without a disability.
Respondents from BME backgrounds are significantly less likely to perceive noisy
neighbours as a problem compared to respondents from white backgrounds.
Figure 42: Problem with noisy neighbours & loud parties (% problem)
BASE: Varied as labelled *Small base
7.3 Rubbish or litter lying around
Respondents aged 16 to 34 are significantly less likely to perceive rubbish as a problem
than all other age groups. Respondents from BME backgrounds are significantly less likely
to perceive rubbish as a problem compared to respondents from white backgrounds.
Figure 43: Problem with rubbish or litter lying around (% problem)
BASE: Varied as labelled *Small base
8
19
24
25
26
27
27
27
28
29
36
39
39
0 5 10 15 20 25 30 35 40 45
*BME (40)65+ years (57)
55-64 years (50)16-34 years (205)
No disability (410)Male (248)
White British (309)Total (470)
Female (208)45-54 years (66)
White Other (99)35-44 years (86)
Disability (51)
25
36
46
48
49
49
49
52
54
58
58
61
62
0 10 20 30 40 50 60 70
*BME (41)16-34 years (207)
Male (251)No disability (418)
Total (479)White British (317)
45-54 years (66)Female (213)
White Other (98)65+ years (60)Disability (51)
35-44 years (89)55-64 years (51)

29 Corporate Consultation & Research
7.4 Vandalism, graffiti and other deliberate damage
Respondents from BME backgrounds are significantly more likely to perceive vandalism
and graffiti as a problem compared to white British respondents.
Figure 44: Problem with vandalism & graffiti (% problem)
BASE: Varied as labelled *Small base
7.5 People using or dealing drugs
Respondents aged 65 and over are significantly less likely to perceive drugs as a problem
compared to all other age groups.
Figure 45: Problem with people using or dealing drugs (% problem)
BASE: Varied as labelled *Small base
39
41
43
45
47
48
49
49
50
50
50
51
63
0 10 20 30 40 50 60 70
Disability (47)
45-54 years (64)
55-64 years (45)
Male (236)
White British (298)
Total (457)
35-44 years (85)
No disability (399)
65+ years (56)
White Other (97)
16-34 years (202)
Female (206)
*BME (40)
76
82
82
84
85
86
86
86
86
88
88
89
89
0 10 20 30 40 50 60 70 80 90 100
65+ years (56)
*BME (34)
White Other (90)
Male (227)
55-64 years (47)
Disability (49)
Total (436)
No disability (378)
16-34 years (182)
White British (290)
Female (196)
35-44 years (83)
45-54 years (62)
30 Corporate Consultation & Research
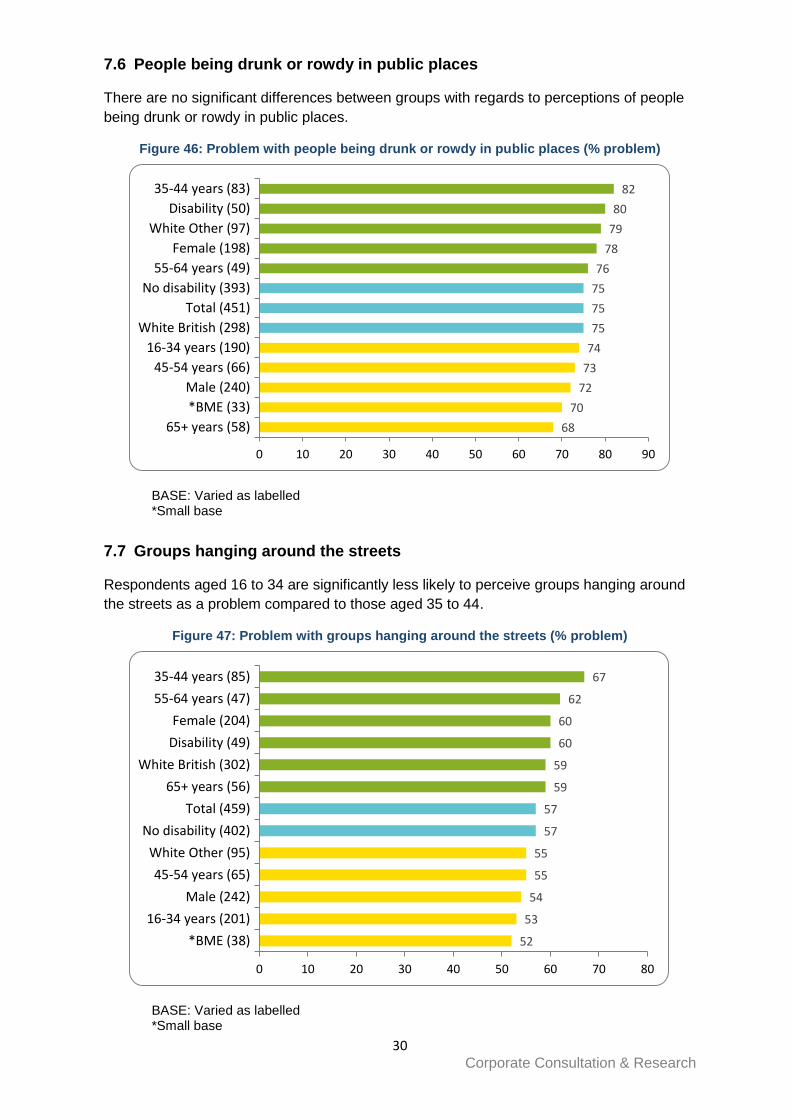
7.6 People being drunk or rowdy in public places
There are no significant differences between groups with regards to perceptions of people
being drunk or rowdy in public places.
Figure 46: Problem with people being drunk or rowdy in public places (% problem)
BASE: Varied as labelled *Small base
7.7 Groups hanging around the streets
Respondents aged 16 to 34 are significantly less likely to perceive groups hanging around
the streets as a problem compared to those aged 35 to 44.
Figure 47: Problem with groups hanging around the streets (% problem)
BASE: Varied as labelled *Small base
68
70
72
73
74
75
75
75
76
78
79
80
82
0 10 20 30 40 50 60 70 80 90
65+ years (58)
*BME (33)
Male (240)
45-54 years (66)
16-34 years (190)
White British (298)
Total (451)
No disability (393)
55-64 years (49)
Female (198)
White Other (97)
Disability (50)
35-44 years (83)
52
53
54
55
55
57
57
59
59
60
60
62
67
0 10 20 30 40 50 60 70 80
*BME (38)
16-34 years (201)
Male (242)
45-54 years (65)
White Other (95)
No disability (402)
Total (459)
65+ years (56)
White British (302)
Disability (49)
Female (204)
55-64 years (47)
35-44 years (85)

31 Corporate Consultation & Research
7.8 Untidy gardens and other private land
Respondents aged 35 to 44 are significantly more likely to perceive untidy gardens as a
problem compared to all other age groups. White British respondents are significantly more
likely to perceive untidy gardens as a problem compared to all other ethnicities.
Figure 48: Problem with untidy gardens or other private land (% problem)
BASE: Varied as labelled *Small base
24
25
29
29
30
32
33
35
36
37
38
39
50
0 10 20 30 40 50 60
16-34 years (192)
White Other (95)
*BME (39)
55-64 years (49)
Male (238)
No disability (402)
Total (456)
White British (301)
65+ years (59)
Female (204)
45-54 years (64)
Disability (48)
35-44 years (87)
32 Corporate Consultation & Research
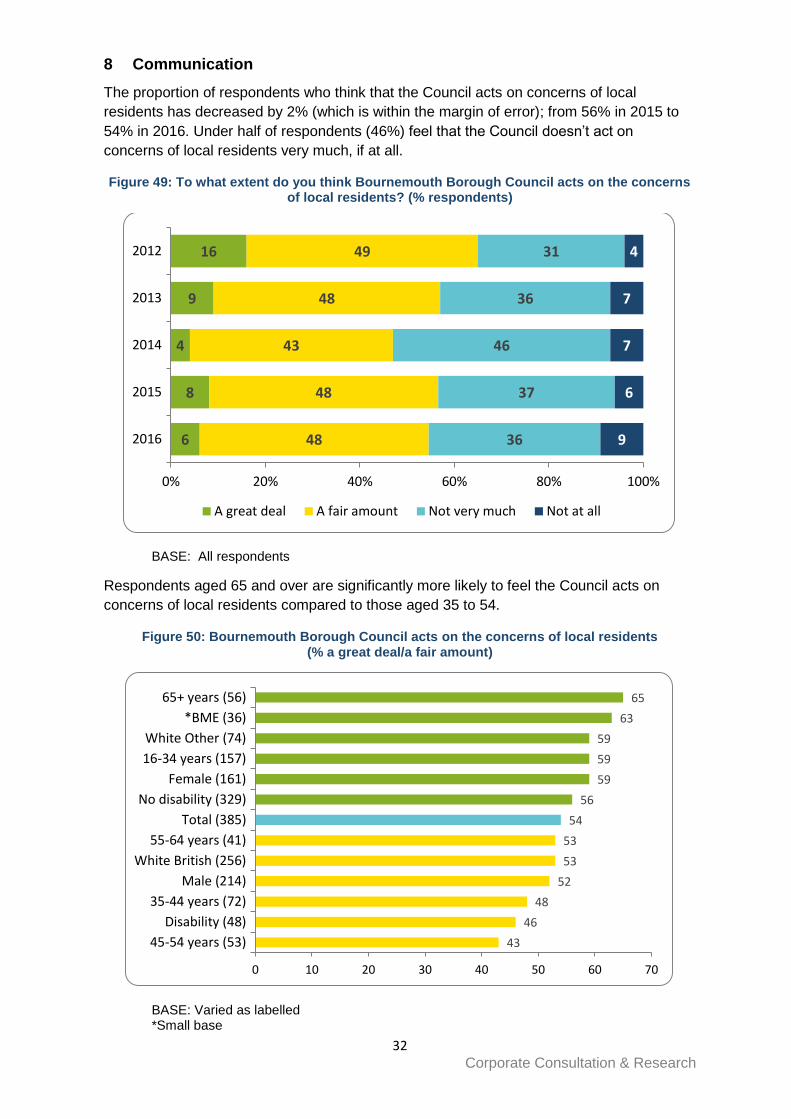
8 Communication
The proportion of respondents who think that the Council acts on concerns of local
residents has decreased by 2% (which is within the margin of error); from 56% in 2015 to
54% in 2016. Under half of respondents (46%) feel that the Council doesn’t act on
concerns of local residents very much, if at all.
Figure 49: To what extent do you think Bournemouth Borough Council acts on the concerns of local residents? (% respondents)
BASE: All respondents
Respondents aged 65 and over are significantly more likely to feel the Council acts on
concerns of local residents compared to those aged 35 to 54.
Figure 50: Bournemouth Borough Council acts on the concerns of local residents (% a great deal/a fair amount)
BASE: Varied as labelled *Small base
6
8
4
9
16
48
48
43
48
49
36
37
46
36
31
9
6
7
7
4
0% 20% 40% 60% 80% 100%
2016
2015
2014
2013
2012
A great deal A fair amount Not very much Not at all
43
46
48
52
53
53
54
56
59
59
59
63
65
0 10 20 30 40 50 60 70
45-54 years (53)
Disability (48)
35-44 years (72)
Male (214)
White British (256)
55-64 years (41)
Total (385)
No disability (329)
Female (161)
16-34 years (157)
White Other (74)
*BME (36)
65+ years (56)
33 Corporate Consultation & Research
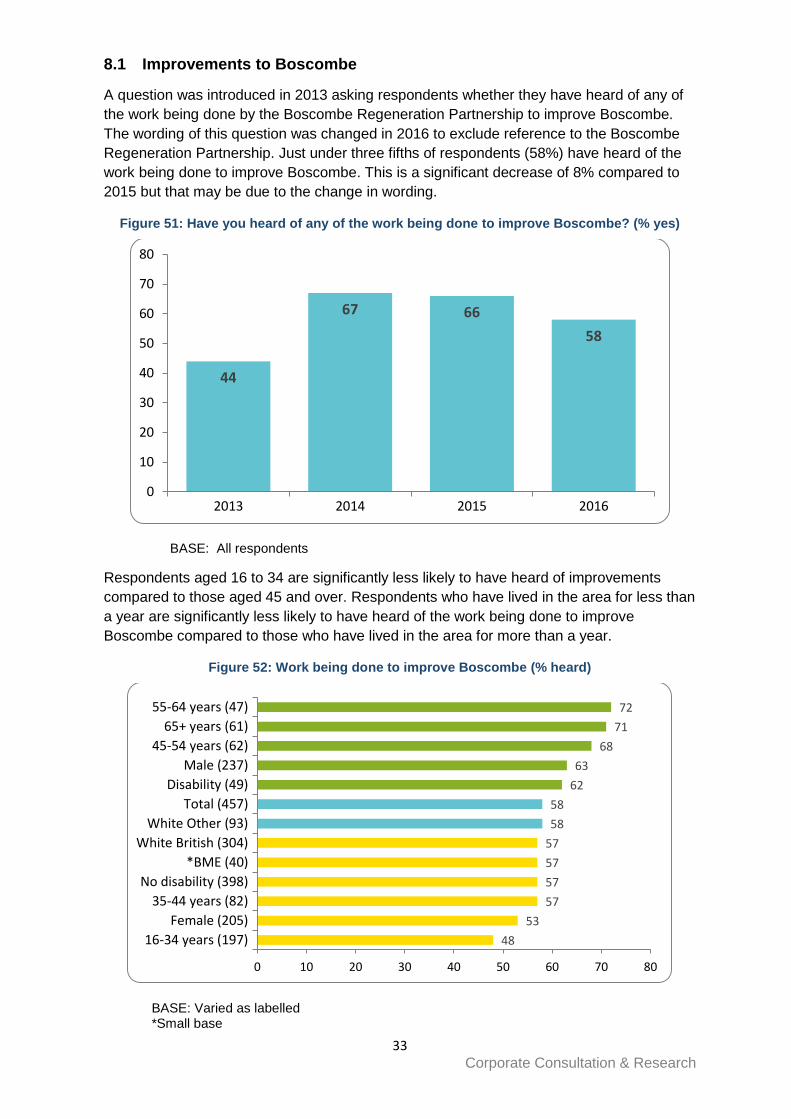
8.1 Improvements to Boscombe
A question was introduced in 2013 asking respondents whether they have heard of any of
the work being done by the Boscombe Regeneration Partnership to improve Boscombe.
The wording of this question was changed in 2016 to exclude reference to the Boscombe
Regeneration Partnership. Just under three fifths of respondents (58%) have heard of the
work being done to improve Boscombe. This is a significant decrease of 8% compared to
2015 but that may be due to the change in wording.
Figure 51: Have you heard of any of the work being done to improve Boscombe? (% yes)
BASE: All respondents
Respondents aged 16 to 34 are significantly less likely to have heard of improvements
compared to those aged 45 and over. Respondents who have lived in the area for less than
a year are significantly less likely to have heard of the work being done to improve
Boscombe compared to those who have lived in the area for more than a year.
Figure 52: Work being done to improve Boscombe (% heard)
BASE: Varied as labelled *Small base
44
67 66
58
0
10
20
30
40
50
60
70
80
2013 2014 2015 2016
48
53
57
57
57
57
58
58
62
63
68
71
72
0 10 20 30 40 50 60 70 80
16-34 years (197)
Female (205)
35-44 years (82)
No disability (398)
*BME (40)
White British (304)
White Other (93)
Total (457)
Disability (49)
Male (237)
45-54 years (62)
65+ years (61)
55-64 years (47)

34 Corporate Consultation & Research
A new question was introduced in 2016 which asked respondents if they thought
Boscombe was improving. Almost two thirds of respondents (65%) thought Boscombe was
improving.
Figure 53: Do you think Boscombe is improving? (% yes)
BASE: All respondents
Respondents who have lived in the area for twenty years or more are significantly less
likely to think that Boscombe is improving compared to those who have lived in the area for
less than twenty years.
Figure 54: Boscombe improving (% yes)
BASE: Varied as labelled *Small base
65 35
0% 20% 40% 60% 80% 100%
2016
2015
2014
2013
2012
Yes No
54
59
59
59
62
63
65
67
67
68
70
70
72
0 10 20 30 40 50 60 70 80
Disability (44)
35-44 years (78)
45-54 years (59)
65+ years (58)
White British (259)
Female (177)
Total (404)
No disability (353)
White Other (81)
Male (213)
*BME (45)
55-64 years (44)
16-34 years (160)

35 Corporate Consultation & Research
Another new question introduced in 2016 asked respondents how they would prefer to
receive information about the work taking place to improve Boscombe. Over half of
respondents (52%) would prefer to receive information from local media whilst 46% would
prefer to receive information from a Council or partner publication. Just over one third
(35%) would prefer BH Live as a source of information and just over one quarter (27%)
would prefer email. Just over one fifth (21%) would prefer using websites. Other
suggestions included noticeboards, displays and social media.
Figure 55: How would you prefer to receive information about the work taking place to improve Boscombe? (% respondents)
BASE: All respondents
Respondents aged 16 to 34 are significantly less likely to want to receive information from
BH Life compared to those aged 35 and over. Respondents from BME backgrounds are
significantly more likely to want to receive information from local media compared to those
from white backgrounds.
4
21
27
35
46
52
0 10 20 30 40 50 60
Other
Website
BH Life
Council or partner publication / leaflet
Local media (newspapers / radio /television etc)
36 Corporate Consultation & Research
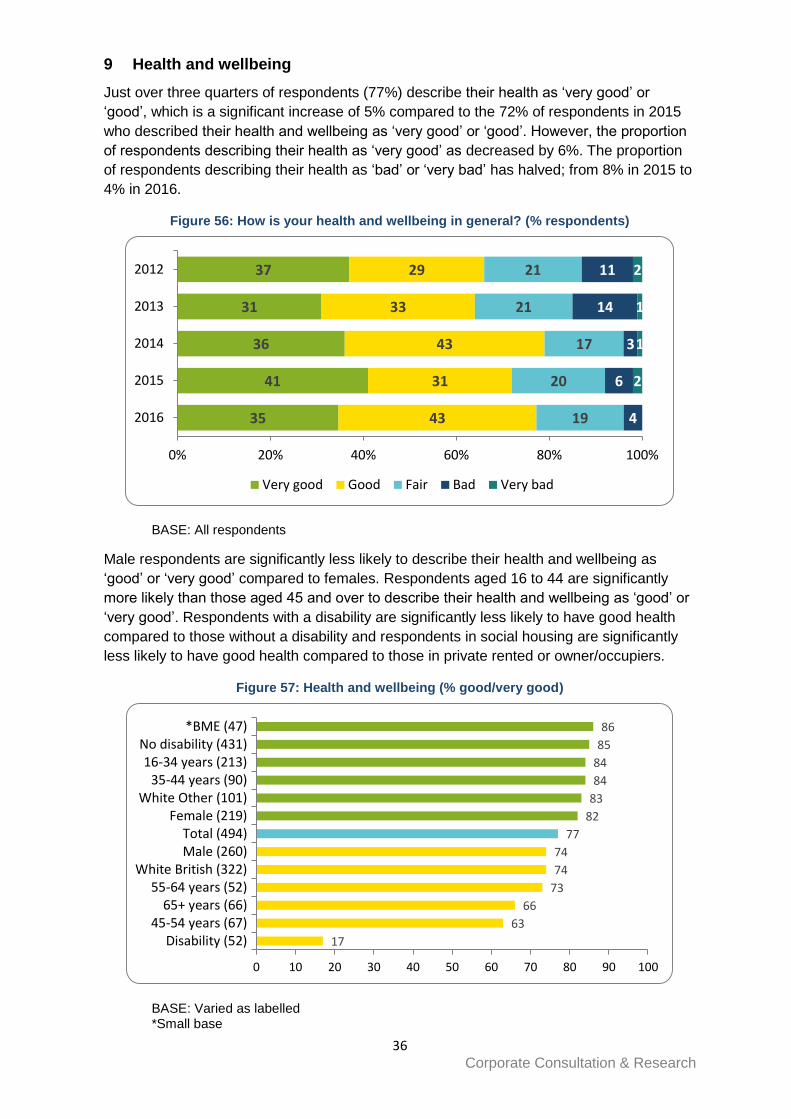
9 Health and wellbeing
Just over three quarters of respondents (77%) describe their health as ‘very good’ or
‘good’, which is a significant increase of 5% compared to the 72% of respondents in 2015
who described their health and wellbeing as ‘very good’ or ‘good’. However, the proportion
of respondents describing their health as ‘very good’ as decreased by 6%. The proportion
of respondents describing their health as ‘bad’ or ‘very bad’ has halved; from 8% in 2015 to
4% in 2016.
Figure 56: How is your health and wellbeing in general? (% respondents)
BASE: All respondents
Male respondents are significantly less likely to describe their health and wellbeing as
‘good’ or ‘very good’ compared to females. Respondents aged 16 to 44 are significantly
more likely than those aged 45 and over to describe their health and wellbeing as ‘good’ or
‘very good’. Respondents with a disability are significantly less likely to have good health
compared to those without a disability and respondents in social housing are significantly
less likely to have good health compared to those in private rented or owner/occupiers.
Figure 57: Health and wellbeing (% good/very good)
BASE: Varied as labelled *Small base
35
41
36
31
37
43
31
43
33
29
19
20
17
21
21
4
6
3
14
11
2
1
1
2
0% 20% 40% 60% 80% 100%
2016
2015
2014
2013
2012
Very good Good Fair Bad Very bad
17
63
66
73
74
74
77
82
83
84
84
85
86
0 10 20 30 40 50 60 70 80 90 100
Disability (52)45-54 years (67)
65+ years (66)55-64 years (52)
White British (322)Male (260)Total (494)
Female (219)White Other (101)
35-44 years (90)16-34 years (213)
No disability (431)*BME (47)

37 Corporate Consultation & Research
9.1 Social contact
Over eight in ten respondents (83%) have sufficient social contact which is a significant
increase of 6% when compared to 2015 and is back to the same level as 2014. The
proportion of respondents who say they have little social contact and feel socially isolated
has decreased significantly by 6% and is back to a similar level as seen in 2014.
Figure 58: Which of the following statements best describes your social situation? (% respondents)
BASE: All respondents
Respondents with a disability are significantly less likely to have sufficient social contact
compared to those without a disability.
Figure 59: Social contact (% at least adequate social contact)
BASE: Varied as labelled *Small base
56
51
58
46
50
27
26
25
25
26
13
12
14
16
13
4
10
3
13
12
0% 20% 40% 60% 80% 100%
2016
2015
2014
2013
2012
I have as much social contact as I want with people I like
I have adequate social contact with people
I have some social contact with people but not enough
I have little social contact and feel socially isolated
60
74
80
81
81
83
84
84
84
86
86
88
89
0 10 20 30 40 50 60 70 80 90 100
Disability (50)
45-54 years (67)
35-44 years (90)
Male (257)
White Other (100)
Total (491)
*BME (47)
16-34 years (211)
White British (320)
No disability (430)
Female (218)
55-64 years (51)
65+ years (65)

38 Corporate Consultation & Research
9.2 Satisfaction with life
A question about satisfaction with life was introduced in 2013. Respondents are asked to
rate their life on a scale of 1 to 10. Seven in ten respondents (70%) rate their life as 7 or
more which is in line with 2015 and 2014. The proportion of respondents rating their life as
4 or less is currently at its lowest recorded level (8%).
Figure 60: On a scale of 1 to 10, how satisfied are you overall with your life nowadays? (% respondents)
BASE: All respondents
Respondents with a disability are significantly less likely to rate their lives as seven or more
compared to those without a disability. Respondents in social housing are significantly less
likely to rate their life as seven or more compared to owner/occupiers.
Figure 61: Current life satisfaction (% 7 or more out of 10)
BASE: Varied as labelled *Small base
2
3
2
7
6
9
8
11
22
20
21
24
47
47
49
44
23
22
19
13
0% 20% 40% 60% 80% 100%
2016
2015
2014
2013
1 - 2 3 - 4 5 - 6 7 - 8 9 - 10
36
63
68
68
69
70
71
72
74
75
75
76
82
0 10 20 30 40 50 60 70 80 90
Disability (52)
45-54 years (67)
16-34 years (210)
*BME (47)
Male (257)
Total (491)
White Other (101)
White British (319)
Female (219)
35-44 years (90)
55-64 years (52)
No disability (427)
65+ years (66)
39 Corporate Consultation & Research
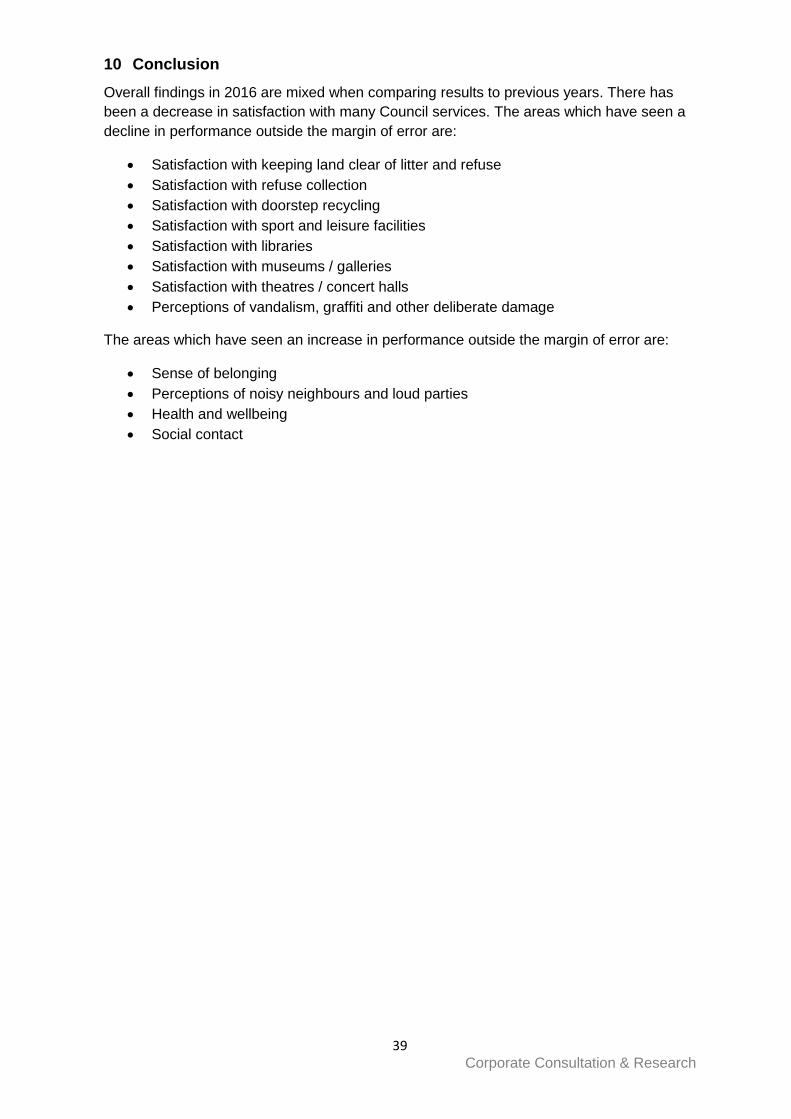
10 Conclusion
Overall findings in 2016 are mixed when comparing results to previous years. There has
been a decrease in satisfaction with many Council services. The areas which have seen a
decline in performance outside the margin of error are:
Satisfaction with keeping land clear of litter and refuse
Satisfaction with refuse collection
Satisfaction with doorstep recycling
Satisfaction with sport and leisure facilities
Satisfaction with libraries
Satisfaction with museums / galleries
Satisfaction with theatres / concert halls
Perceptions of vandalism, graffiti and other deliberate damage
The areas which have seen an increase in performance outside the margin of error are:
Sense of belonging
Perceptions of noisy neighbours and loud parties
Health and wellbeing
Social contact

40 Corporate Consultation & Research
Appendix 1: Respondent profile
Weighted Unweighted
Gender Male 260 237
Female 219 242
Age
16 - 34 years 213 92
35 - 44 years 90 77
45 - 54 years 67 93
55 - 64 years 52 81
65+ years 66 145
Disability Yes 52 108
No 431 375
Ethnicity
White British 325 354
White Other 101 95
BME 47 24
Religion
No religion 204 165
Christian 223 266
Other religion 38 30
Sexual Orientation Heterosexual 431 431
Bisexual, Gay, Lesbian 30 26
Accommodation
Owner / Occupier 175 210
Renting - Social 57 60
Renting - Private 239 201
Employment
In employment 320 260
Unemployed 19 15
Retired 58 119
Economically inactive 59 67
Children 17 and under
None 386 404
One 64 49
Two or more 31 24
Adults 18 and over
One 226 243
Two 207 189
Three or more 29 25

41 Corporate Consultation & Research
Appendix 2: Table of figures
Figure 1: Overall satisfaction with local area (% respondents) ................................. 2
Figure 2: Satisfaction with local area (% satisfied) ............................................... 2
Figure 3: Importance vs. Improvement (% respondents) ........................................ 5
Figure 4: Satisfaction with Council services (% satisfied) ........................................ 7
Figure 5: Usage of Council services (% used in the last twelve months) ...................... 8
Figure 6: Keeping public land clear of litter and refuse (% respondents) ...................... 9
Figure 7: Satisfaction with keeping public land clear of litter and refuse (% satisfied) ....... 9
Figure 8: Refuse collection (% respondents) ..................................................... 10
Figure 9: Satisfaction with refuse collection (% satisfied) ....................................... 10
Figure 10: Doorstep recycling (% respondents) .................................................. 11
Figure 11: Satisfaction with doorstep recycling (% satisfied) ................................... 11
Figure 12: Local transport information (% respondents) .................................................... 12
Figure 13: Satisfaction with local transport information (% satisfied) .......................... 12
Figure 14: Local bus services (% respondents) .................................................. 13
Figure 15: Satisfaction with local bus services (% satisfied) ................................... 13
Figure 16: Sport and leisure facilities (% respondents) ......................................... 14
Figure 17: Satisfaction with sport and leisure facilities (% satisfied) .......................... 14
Figure 18: Libraries (% respondents) .............................................................. 15
Figure 19: Satisfaction with libraries (% satisfied) ............................................... 15
Figure 20: Museums and galleries (% respondents) ............................................ 16
Figure 21: Satisfaction with museums and galleries (% satisfied) ............................. 16
Figure 22: Theatres and concert halls (% respondents) ........................................ 17
Figure 23: Satisfaction with theatres and concert halls (% satisfied) .......................... 17
Figure 24: Parks and open spaces (% respondents) ............................................ 18
Figure 25: Satisfaction with parks & open spaces (% satisfied)................................ 18
Figure 26: Seafront (% respondents) .............................................................. 19
Figure 27: Satisfaction with seafront (% satisfied) ............................................... 19
Figure 28: Boscombe Market (% respondents) .................................................. 20
Figure 29: Satisfaction with Boscombe Market (% satisfied) ................................... 20
Figure 30: How strongly do you feel you belong to your local area? (% respondents) ...... 21
Figure 31: Sense of belonging to local area (% belonging) ..................................... 21
Figure 32: To what extent do you agree or disagree that your local area is a place where
people from different ethnic backgrounds get on well together? (% respondents) .......... 22
Figure 33: Different ethnic backgrounds get on well together (% agree) ..................... 22
Figure 34: Feelings of safety in local area after dark (% respondents) ....................... 23
Figure 35: Feelings of safety in local area after dark (% feel safe) ........................... 23
Figure 36: Feelings of safety in local area during the day (% respondents) ................. 24
Figure 37: Feelings of safety in local area during the day (% feel safe) ...................... 24
Figure 38: Factors that influence feelings of safety outside in local area (% respondents) 25
Figure 39: Perception of anti-social behaviour (% a problem) ................................. 26
Figure 40: Perception of anti-social behaviour (% high perception) .......................... 27
Figure 41: High perception of anti-social behaviour (% respondents) ........................ 27
Figure 42: Problem with noisy neighbours & loud parties (% problem) ...................... 28
Figure 43: Problem with rubbish or litter lying around (% problem) ........................... 28
Figure 44: Problem with vandalism & graffiti (% problem) ..................................... 29
Figure 45: Problem with people using or dealing drugs (% problem) ......................... 29
Figure 46: Problem with people being drunk or rowdy in public places (% problem) ....... 30
Figure 47: Problem with groups hanging around the streets (% problem) ................... 30
42 Corporate Consultation & Research
Figure 48: Problem with untidy gardens or other private land (% problem) .................. 31
Figure 49: To what extent do you think Bournemouth Borough Council acts on the concerns
of local residents? (% respondents) ............................................................... 32
Figure 50: Bournemouth Borough Council acts on the concerns of local residents (% a
great deal/a fair amount) ............................................................................ 32
Figure 51: Have you heard of any of the work being done to improve Boscombe? (% yes)
......................................................................................................... 33
Figure 52: Work being done to improve Boscombe (% heard) ................................ 33
Figure 53: Do you think Boscombe is improving? (% yes) ..................................... 34
Figure 54: Boscombe improving (% yes) ......................................................... 34
Figure 55: How would you prefer to receive information about the work taking place to
improve Boscombe? (% respondents) ............................................................ 35
Figure 56: How is your health and wellbeing in general? (% respondents) .................. 36
Figure 57: Health and wellbeing (% good/very good) ........................................... 36
Figure 58: Which of the following statements best describes your social situation? (%
respondents) .......................................................................................... 37
Figure 59: Social contact (% at least adequate social contact) ................................ 37
Figure 60: On a scale of 1 to 10, how satisfied are you overall with your life nowadays? (%
respondents) .......................................................................................... 38
Figure 61: Current life satisfaction (% 7 or more out of 10) ..................................... 38
Table 1: Things making somewhere a good place to live (% selected as one of top 5) ..... 3
Table 2: Things that most need improving (% selected as one of top 5) ...................... 4