
Bornemann, Tobias / Laplante Stacie K. / Osswald, … · Bornemann and Osswald gratefully...
51
No. 33 / January 2018 Bornemann, Tobias / Laplante Stacie K. / Osswald, Benjamin The Effect of Intellectual Property Boxes on Innovative Activity & Effective Tax Rates
Transcript of Bornemann, Tobias / Laplante Stacie K. / Osswald, … · Bornemann and Osswald gratefully...
No. 33 / January 2018 Bornemann, Tobias / Laplante Stacie K. / Osswald, Benjamin The Effect of Intellectual Property Boxes on Innovative Activity & Effective Tax Rates
Electronic copy available at: https://ssrn.com/abstract=3115977
The Effect of Intellectual Property Boxes on
Innovative Activity & Effective Tax Rates
Tobias Bornemann
Vienna University of Economics and Business
Stacie K. Laplante
University of Wisconsin - Madison
Benjamin Osswald*
Vienna University of Economics and Business / University of Wisconsin - Madison
January 2018
Abstract. We examine the effect of the introduction of a large tax rate cut on patent income in Belgium on
firms’ patenting activities and effective tax rates (ETRs). In contrast to contemporaneous research on
intellectual property (IP) boxes that examines multiple countries, we focus on one country because it allows
us to cleanly identify targeted innovative activity and resulting tax benefits around the adoption of the IP
box. We find that relative to firms in an adjoining country with no IP box, patent applications and patent
grants increase after the introduction of an IP box regime, while patent quality decreases. This pattern is
robust across both a balanced and unbalanced sample of firm-years, patent intense industries, as well as
domestic and multinational firm years respectively. Moreover, we find that firms separate into three groups
when considering ETRs. Tax savings are most pronounced for subsidiaries of multinational firms without
opportunities to shift income out of the country followed by domestic firms. In contrast, subsidiaries of
multinational firms with opportunities to shift income out of the country do not experience significant
reductions in effective tax rates. Overall, we provide initial evidence that IP boxes provide benefits for
domestic firms and multinationals without income shifting opportunities.
JEL Classification: H21, H25
Keywords: IP boxes; tax avoidance; income shifting
* Corresponding author: [email protected] Vienna University of Economics and Business, Department of
Finance, Accounting and Statistics, Welthandelsplatz 1, 1020 Vienna, Austria.
This paper has benefited from helpful comments by Harald Amberger, Kathleen Andries (discussant), Christof
Beuselinck, Paul Demeré (discussant), Wim Eynatten, Michele Hanlon, Martin Jacob, Dirk Kiesewetter (discussant),
Pete Lisowsky, Jens Müller (discussant), Jochen Pierk, Silke Ruenger (discussant), James Stekelberg (discussant),
Caren Sureth-Sloane, Brian Williams (discussant), Kaishu Wu (discussant), participants at the arqus Doctoral
Workshop 2016, 2017 ATA Midyear Meeting, 3rd Doctoral Research Seminar at Vienna University of Economics and
Business, DIBT Research Seminar, 40th Annual Congress of the European Accounting Association, 79th Annual
Meeting of German Academic Association for Business Research, 7th Conference on Current Research in Taxation,
NTA 110th Annual Conference on Taxation, 2017 University of Illinois Tax Doctoral Consortium, 1st Hawaiian
Accounting Research Conference, workshop participants at the University of Wisconsin-Madison , WHU Brown Bag
Seminar. Bornemann and Osswald gratefully acknowledge financial support by the Austrian Science Fund (FWF):
W1235-G16. Laplante gratefully acknowledges support from the Wisconsin School of Business.
Electronic copy available at: https://ssrn.com/abstract=3115977
- 1 -
The Effect of IP Boxes on Innovative Activity
& Effective Tax Rates
1. Introduction
Intellectual property (IP) box regimes, or patent boxes, are a tool that some countries use to
promote innovative activity, and to attract or retain mobile income and research and development
(R&D) activities within the country. While tax benefits vary across regimes, in theory, IP boxes
reduce the effective tax burden on successful R&D investments (Evers, Miller and Spengel
2015). However, it is difficult to empirically evaluate the effectiveness of IP boxes due to the
heterogeneity in the characteristics and scope of IP box regimes across jurisdictions.1 We
overcome this limitation by identifying a quasi-experimental setting around the adoption of an IP
box regime in Belgium to investigate two research questions.2 First, do IP box regimes increase
firms’ innovative activity? Second, what type of firms benefit from the introduction of the IP box
regime?
Governments routinely use tax expenditures to foster innovative activities. For example,
in 2013 U.S. taxpayers spent approximately $11.3 billion to fund the U.S. R&D tax credit (IRS
2013). Prior empirical research suggests that one dollar of tax revenue spent on the R&D tax
credit induces firms to invest anywhere from $ 1 to $ 2.96 in R&D activities (Berger 1993,
Klassen et al. 2004). Given that U.S. firms invested approximately $ 502.9 billion in R&D
activities in 2013 (OECD 2015), this suggests that the U.S. R&D tax credit induces anywhere
between 2.2% and 6.6% of total corporate R&D investment. With respect to IP boxes, Merrill et
al. (2012) estimate the cost of a U.S. version of an IP box regime at $9 billion (if enacted in the
1 See section 2 for a discussion of recent literature that provides limited evidence on the effectiveness of IP box
regimes. 2 See section 2 for an explanation of the institutional setting.

- 2 -
same form as in the U.K.) to $11 billion (if enacted in the same form as Belgium) per year.
Given the heterogeneous nature of IP box regimes across countries, however, it is unclear
whether and to what extent IP boxes increase innovative activities (e.g., Alstadsæter, Barrios,
Nicodeme, Skonieczna and Vezzani 2015, Bradley, Dauchy and Robinson 2015, Chen, De
Simone, Hanlon and Lester 2016) and what type of firms benefit from these regimes. Because
governments are potentially sacrificing large amounts of tax revenue in exchange for vague and
uncertain benefits, it is important to understand how specific elements of an IP box affect firms’
innovative activities.
In contrast to contemporaneous research on IP boxes that examines multiple countries,
we focus on one country because it allows us to cleanly identify targeted innovative activity and
resulting tax benefits around the adoption of the IP box. We exploit the Belgian IP box regime
applicable for fiscal years ending after December 31, 2007 for numerous reasons. First, the tax
benefits conferred by the Belgian IP box are only for gross income from new patents and exclude
income from other forms of IP such as trademarks, know-how, or other secretly held innovation.3
Second, in contrast to most other forms of IP, we can observe firms' patent applications, grants
and holdings before and after the tax rate change. Third, the Belgian IP box decreases the tax rate
on gross patent income by approximately 80%, from 33.99% to 6.8%, with no other tax rate
changes in 2007 and 2008.4 Fourth, Belgium maintains strict reporting requirements providing
comfort that our sample captures substantially all firms that benefit from this law change.
Finally, this IP box applies to revenues for patents exploited after the IP box adoption earned by
3 A “new” patent is one that did not lead to the sale of a patented product or service to an unrelated party prior to
January 1, 2007. Therefore, the patent can exist before this date as long as it was not “exploited” prior to this date. 4 See http://www.vandendijk-taxlaw.be/pdf/TNI087.pdf. We address other potential law changes in our robustness
tests and alterative empirical specifications using year fixed effects. We are also not aware of any regulatory
changes in the patent filing process in our sample period in either Belgium or Germany.

- 3 -
any domestic firm or subsidiary of a foreign parent that demonstrates nexus in Belgium.5
Therefore, the Belgian IP box provides for a strong quasi-experimental setting.
We investigate the effect of the adoption of the Belgian IP box on Belgian firms’
innovative activity using a difference in difference specification with German firms as our
comparison group.6 Using data from 2003 to 2012, our results suggest that, relative to firms in
Germany, patent applications and patent grants increase by 0.4 percent and 1 percent after the
introduction of an IP box regime, while patent quality appears to decrease. This pattern is robust
across both a balanced and unbalanced sample of firm-years, within patent intense industries, as
well as within domestic and multinational firm years respectively.
We also examine the types of firms that benefit from the Belgian IP Box, and find that
patent owning firms on average reduce their GAAP ETRs by approximately 1.9 (3.6) percentage
points compared to non-patent owning firms for our balanced (unbalanced) sample. In addition,
we find cross sectional variation in the type of firms that enjoy tax benefits of the IP box. The
reduction in GAAP ETRs is most pronounced for multinationals that do not have an opportunity
to shift income out of the country. In contrast, multinationals with an income shifting opportunity
do not experience significant reductions in ETRs after the introduction of the IP box regime.
Our research contributes to the literature that investigates the impact of targeted tax
incentives and is of interest to policymakers, as well as academics. Theoretical evidence suggests
IP boxes increase returns to successful R&D, leading to more innovation (Evers et al. 2015). The
size of the effect varies across countries, however, due to the heterogeneous nature of the
regimes. Cross-country studies of IP boxes make it difficult to isolate how specific elements of
5 We use “nexus” to mean that the firm meets the requirements of an R&D certified center. This is different than the
“modified nexus” approach adopted by the OECD (2016). 6 We discuss the merits of using German firms as a control group in Section 2.

- 4 -
any one IP box affect innovative activity, and also suffer from typical confounds such as culture,
correlated omitted tax law changes and other related law changes. From a policy perspective,
evidence from multiple regimes is difficult to interpret when deciding on the structure of an IP
box because it is not clear which regime is driving the results, if any. We identify a strong setting
that allows us to investigate the direct impact of an IP box regime on patenting activity in a
country with a substantial tax benefit for one type of IP revenue (patents). Our results suggest
that adopting a substantial tax benefit on gross IP income is related to an increase in patent
applications and grants at the expense of patent quality.
We also examine the type of firm that reaps the benefits of IP box tax incentives. To our
knowledge, this is the first paper on IP boxes that is able to disentangle this effect. We measure
the tax benefits accruing to firms by examining cross sectional differences between domestic and
multinational firms, and separately between multinationals with different income shifting
opportunities. We provide evidence that, while firms with patents on average enjoy lower
effective tax rates after the adoption of the IP box, multinational firms with fewer income
shifting opportunities receive the greatest tax benefits, followed by domestic firms and
multinational firms with greater income shifting opportunities.
Our paper proceeds as follows. In the next section we provide institutional details on the
Belgian IP box regime and derive our hypotheses. In section 3, we present the research design,
including our identification strategy. Section 4 includes our sample selection process and data
summary, while section 5 presents results. We conclude in section 6.
2. Institutional background and hypothesis development
2.1 Institutional background

- 5 -
Intellectual property box regimes are a tax policy tool used to increase innovative
activities, and attract and retain investment related to research and development activities from
abroad (Bradley et al. 2015; Brannon and Hanlon 2015; Evers et al. 2015; Chen et al. 2016).
Unlike input-based R&D tax incentives such as R&D tax credits, IP boxes target successful
R&D activities that generally result in commercially viable products by providing a reduction in
the tax rate applicable to IP income. Across the 17 countries currently using IP boxes, the scope
of tax benefits with respect to qualified IP ranges from patents only to an array of IP, such as
patents, trade secrets, trademarks, know how, and domains. Table 2 provides an overview of the
different IP box regimes.7
We examine the Belgian IP box because it offers a relatively clean research setting.
Belgium adopted an IP box regime to meet three goals.8 First, to foster technical innovation and
increase R&D leading to commercial applications (Belgische Kamer Van
Volksvertegenwoordigers 2007, p. 37-38). Second, to prevent the erosion of its (mobile) tax base
due to its relatively high statutory tax rate of 33.99%; and third, to compete with its neighboring
countries, the Netherlands and Luxembourg, that adopted IP boxes in 2007 and 2008
respectively (Eynatten 2008; Eynatten and Brauns 2010; Bradley et al. 2015; Evers et al. 2015).
In structuring its IP box to meet these goals, Belgium created relatively strong incentives for
firms to engage in innovative activity in Belgium. Incentives include an 80% deduction on gross
patent income (royalties, sales income and notional royalties) less costs of acquired IP for patents
7 See Evers et al. (2015) for a more comprehensive overview and calculations of effective tax rates of IP box regimes
in various countries. 8 In accordance with the OECD’s BEPS project, the Belgian Council of Ministers modified its IP Box on December
2, 2016 (effective from July 1, 2016 going forward) to include more categories of income, maintain validity of the
IP box income deduction if a company is involved in a merger or acquisition, allow unused deductions to carry
forward; increase the deduction to 85%; and replace the qualifying R&D center requirement with a nexus ratio.
- 6 -
commercialized after January 1, 2007, resulting in an effective tax rate of 6.8% on patent
income.9
The Belgian IP box also applies relatively strong substance requirements compared to
other IP boxes, and is applicable to any domestic firm or subsidiary of a foreign parent that can
demonstrate R&D activities within Belgium (Eynatten and Brauns 2010; Faulhaber 2016). To
qualify for the IP box, firms must run a “qualifying research center” (Eynatten 2008), which is a
division of a firm capable of operating autonomously (Merrill et al. 2012). Intangibles developed
abroad also qualify for the Belgian IP box as long as the qualified research center belongs to a
Belgian legal entity (Eynatten 2008). As a result, the Belgian IP box regime provides a
significant tax incentive to both domestic firms and subsidiaries of multinationals that
commercialize a patent within Belgium.
2.2 Hypotheses development
2.2.1 The effect of IP box regimes on patenting activities
Tax incentives are important policy tools to boost socially desired innovation and
compensate firms for negative externalities triggered by the public good character of intangible
assets. The public good character of intangible assets prevents firms from reaping the full
benefits of their innovative activities. Ideas and inventions eventually spill over to competitors
through high-skilled labor exchanges across firms, penetrable internal information systems, or
business secrets falling outside the scope of patent laws and copyrights. Hence, firms cannot
internalize the full benefits of their innovative activities pushing private returns to R&D below
socially desired returns (Arrow 1962; Hall 1996). The public good character of intangible assets
also prevents firms from disseminating value-relevant information on their innovative activities
9 Belgium continues to allow firms to deduct related R&D expenses against other ordinary income as well.
- 7 -
to the capital markets increasing the cost of R&D capital (Hall 2010). As a result, knowledge
spillovers and higher costs of R&D capital drive a wedge between investments in tangible and
intangible assets leading to underinvestment in innovative activities of firms.
Several countries provide a myriad of input tax incentives (e.g., tax credits) for
expenditures on research and development to help close the gap between investment in tangible
and intangible assets (OECD 2016). A substantial body of research on input tax incentives shows
that these incentives increase firms' R&D spending across different countries, such as the U.S.
(Cordes 1989; Berger 1993; Finley, Lusch, and Cook 2015), Canada (Klassen, Pittman, and Reed
2004), Norway (Cappelen, Raknerud, and Rybalka 2012), Italy (Carboni 2011), the Netherlands
(Lokshin and Mohnen 2012), and various OECD countries (Bloom, Griffith, and vanReenen
2002). However, evidence on IP boxes is still emerging.
IP box regimes provide output-oriented tax incentives that condition the incentive on the
success of the innovative activity. Because the commercialization and timing of future returns of
an R&D investment are uncertain, any tax benefits granted by an IP box regime are uncertain or
risky. Therefore, risk-averse managers may not respond to uncertain tax benefits despite
seemingly large tax incentives. Recent research provides some support for this conjecture. Evers
et al. (2015) derive effective tax burdens on marginal R&D investments for several IP box
regimes across Europe and show analytically that IP box regimes can significantly decrease the
effective tax burdens on marginal R&D investments, but significant variation in tax burdens
across countries exists. Chen et al. (2016) empirically assess the introduction of IP box regimes
across several countries and find an increase in employment, but no increase in fixed asset
investment after the introduction of the IP boxes.10 Other research across multiple jurisdictions
10 Employment encompasses both R&D and non-R&D related activities.
- 8 -
finds that an IP box increases the responsiveness of patent applications to tax rates on patent
income, but only when inventors and patent owners are located in the same host country
(Bradley, Dauchy and Robinson 2015). Alstadsæter et al. (2015) find that IP boxes attract high-
value patents primarily for R&D intensive firms, whereas Merrill (2016) suggests IP boxes are
effective only for firms with relatively immobile R&D activity. Given the heterogeneous nature
of IP box benefits across countries, it is difficult to conclude which elements of an IP box
significantly increase innovative activity within a country. Merrill (2016)
As discussed above, the Belgian IP box provides generous incentives for innovative
activity, an 80% tax rate reduction on IP income as well as a deduction for R&D expenditures
incurred to create the patent against ordinary income taxed at 33.99%. Evers et al. (2015)
estimate that the combined effect of these provisions make Belgium one of the most attractive IP
box regimes with the second lowest tax rate on IP in 2008. Furthermore, using country-level
data, Bradley et al. (2015) find that the responsiveness of patent applications to tax rates on
patent income is increasing in the “generosity” of the tax rate on patent income as well as the
favorable treatment of R&D expenses. Brannon and Hanlon (2015) also provide survey evidence
within a single jurisdiction (the U.S.) suggesting firms would consider increasing innovative
activity upon implementation of an IP box. Therefore, while the nature of successful innovative
activities (riskiness, timeliness) coupled with some recent empirical evidence that implies
uncertainty as to whether IP boxes increase innovative activities per se, Belgium provides a
relatively strong setting where we expect to find a relation between an IP box regime and
innovative activity. Our first hypothesis, stated in the alternative, is as follows:
H1: Firms subject to the Belgian IP box increase their patenting activities after
the introduction of the Belgian IP box regime.
- 9 -
Firm-level characteristics also likely affect how firms respond to IP box regimes.
Multinational firms choose from a broad range of possible locations to carry out R&D
investment and exploit successfully developed intangible assets. Prior research suggests that
MNEs distort the location of R&D activity and the location of intangible assets toward low tax
jurisdictions (Dischinger and Riedel 2011; Karkinsky and Riedel 2012). Therefore, IP box
regimes commonly tie their benefits to substance requirements regarding the R&D activity
and/or the exploitation of the resulting intangible asset to prevent an artificial dispersion of the
location of the R&D activity and the location of the intangible asset. Hence, we expect possible
differences in responses to the introduction of IP box regimes between domestic only firms and
MNEs because MNEs are presumably more flexible in separating the location of the R&D from
the location of the intangible. However, we have no expectation regarding the sign or magnitude
of the difference. In our tests of the effect of IP boxes on patenting activities, therefore, we
separately examine domestic and multinational firms.
2.2.2 The effect of IP box regimes on effective tax rates
Governments use tax policy to induce certain behavior creating potential cross-sectional
differences in the types of firms that benefit from each policy. We argue that intangible intensive
firms, domestic firms, and firms with fewer alternative tax shields benefit more from an IP box.
IP boxes generally provide an incremental tax incentive to develop successful intangible assets.
For example, in Belgium, R&D investments are tax deductible at the ordinary tax rate of 33.99%
while income from successful IP assets are taxed at the preferential 6.8% tax rate. Evers et al.
(2015) estimate effective tax burdens on marginal R&D investments and show that one
additional dollar spent on R&D yields an average effective tax rate of -1.88% for the Belgian IP

- 10 -
box. Therefore, we expect firms with successful IP assets to reap the tax benefits of the IP box
regime ceteris paribus.
H2a: Firms that hold eligible IP decrease their effective tax rate relatively more than
firms that do not hold eligible IP after the introduction of the Belgian IP box regime.
Further, we expect cross-sectional differences in the extent to which firms benefit from
the IP box tax rates across domestic and multinational firms. Intangible assets are mobile and
feature high degrees of private information on their true value, providing firms with significant
opportunities to avoid taxes (Dischinger and Riedel 2011; Klassen and Laplante 2012, Griffith et
al. 2014). Recent research suggests that low-tax countries attract intangible assets such as patents
(Dischinger and Riedel 2011; Karkinsky and Riedel 2012; Ernst, Richter, and Riedel 2014) or
trademarks (Heckemeyer, Olligs, and Overesch 2016). In addition, Weichenrieder and Mintz
(2008) find that firms set up cross-country group structures allowing them to exploit tax
loopholes, while other research shows that multinational firms shift income to low-tax countries
(Huizinga and Laeven 2008; Klassen and Laplante 2012). Multinational firms appear to be
responsive to tax rate differentials across countries, shift income to, and locate intangibles in low
tax rate countries as part of their tax planning process. In contrast, domestic firms are unable to
exploit tax rate differentials across countries or other IP box regimes. We argue that domestic
firms’ tax rates are relatively more responsive on average than MNEs’ tax rates to the
introduction of an IP box. Our next hypothesis, stated in the alternative, is as follows:
H2b: Domestic firms with access to the Belgian IP box regime decrease their effective tax
rates relatively more than subsidiaries of MNEs with access to the Belgian IP box
regime.
Tax avoidance is costly, but it is difficult to determine if it is relatively more costly for
some firms. Firms commit to intra-group transfer prices for goods and services on a long-term
basis to avoid potential concerns by tax authorities of frequently adjusted intra-group transfer

- 11 -
prices (Lohse and Riedel 2013). Shifting intangible assets to and setting up special entities in
low-tax countries triggers a variety of costs including administrative costs, regulatory costs (e.g.,
potential penalties for misconduct), additional interest on subsequent tax payments or double
taxation. Recent research provides evidence that firms are sensitive to a variety of increasing
costs of tax avoidance including, for example, transfer pricing documentation (Beer and
Loeprick 2015); anti avoidance rules (Dischinger and Riedel 2011; Lohse and Riedel 2013)
financial constraints (Dyreng and Markle 2016). However, it appears that tax avoidance activities
benefit from scale effects as larger firms can spread costs for tax avoidance across larger sales
bases (Mills, Erickson, and Maydew 1998; Rego 2003).
We also expect cross-sectional differences in the extent to which firms benefit from the
IP box tax rates across firms with relatively more income shifting opportunities. Not all
subsidiaries of multinationals have similar tax avoidance opportunities. If, for example, the
subsidiary of the multinational enterprise has no opportunities to shift income out of the country,
the subsidiary should benefit from the introduction of an IP box regime in the same way as a
domestic firm. Therefore, we further hypothesize:
H2c: Subsidiaries of MNEs with access to the Belgian IP box, but no opportunities to
shift income out of the country, decrease their ETRs relatively more than subsidiaries of
MNEs with access to the Belgian IP box and income shifting opportunities after the
introduction of the Belgian IP box.
3. Research design
3.1 Identification strategy
We exploit the unique institutional setting of the Belgian IP box because, unlike other IP
box regimes that provide tax benefits for both observable and unobservable intangible assets, the
Belgian IP box regime limits tax benefits to income derived from patents only. Patents are

- 12 -
observable in archival data. To examine the effect of IP boxes on patenting activities (H1), we
employ a difference in difference design and identify Belgian firms (BE) as treatment firms
because they are potentially able to benefit from the IP box regime. We select German firms as
control firms because Germany is a direct neighbor of Belgium, shares economic and
institutional similarities, and importantly does not have an IP box (Andrews et al. 2014).11 We
compare patenting activities in the pre-reform period (pre-2008) versus activities in the post
reform period (post January 1, 2008) for Belgian and German firms to test our first hypothesis.
We assume that absent the introduction of the IP box regime, patenting activities of Belgian and
German firms evolve similarly (parallel trends assumption).12 Applying a difference-in-
difference design helps overcome drawbacks of comparing differences in activities before and
after the reform across all firms, which might capture a spurious correlations or time trends.
To examine our second set of hypotheses regarding the types of firms that benefit from
the IP box regime, we are unable to use German firms as control firms because Germany
lowered its statutory tax rate in 2008, making it difficult to discern the impact on tax rates from
patenting activities versus other activities. Therefore, we identify Belgian firms with a patent
application prior to the implementation of the IP box as “treatment” firms and all other Belgian
firms as “control” firms. We also split the sample into domestic and multinational firms, and
firms with relatively more or less income shifting opportunities. Belgium cut its tax rate on
11 Both countries are a member of the Euro Zone, have a similar composition of industries (Andrews et al. 2014),
and show a similar pattern of economic development within the sample period (retrieved from: Eurostat,
http://ec.europa.eu/eurostat/tgm/table.do?tab=table&init=1&language=en&pcode=tec00115&plugin=1). Other
BeNeLux countries and France introduced IP boxes prior to, or concurrent with, Belgium. 12 We assess the appropriateness of our difference-in-difference methodology by investigating the parallel trends
assumptions (Roberts and Whited 2012). We use placebo treatment tests and also calculate the percentage growth
rate of our dependent variables in the period preceding the IP Box adoption in Belgium. Both tests confirm the
parallel trend assumption.
- 13 -
patent-related income from 33.99% to 6.8% on January 1, 2008, and we assume that eligible
firms act rationally and opt in to the IP box regime once they hold patents.
3.2 Innovative activity
We use four patent-related metrics derived from the innovation economics literature to
measure firms’ innovative activities (Hall, Thoma, and Torrisi 2007; Hall et al. 2014). Patents
grant the right to exclude others from making, using or selling an invention, arguably reflecting
firms’ innovative activities. Patent applications, therefore, reflect an investment in innovation
and is a common proxy for innovative activities (Hall et al. 2007; Hall et al. 2014; Alstadsæter et
al. 2015, Bradley et al. 2015).13 Not every patent application results in a commercially
exploitable patent,14 so we also use patent grants as an alternative proxy for successful R&D
activities (Hall et al. 2007; Hall et al. 2014). In addition, we use patent stock as a metric to proxy
for the firm's total number of patents available for commercial exploitation. Patent stock is an
aggregated measure of granted patents from year t-19 through t and reflects re-assignments or
purchases of patents. While a stickier measure of patent activity, patent stock puts a firm’s
available patent pool in perspective relative to current patent applications and grants. Following
prior literature (Hall et al. 2007; Alstadsæter et al. 2015; Balsmeier, Fleming, and Manso 2017),
we use the natural logarithm of each of these measures to account for the skewness of the
underlying patenting metrics ln(Patent Applications), ln(Patent Grants), ln(Patent Stock).15 Our
fourth metric is Patent Quality. We acknowledge that patent quality is a poor proxy for the level
of innovative activity, however, we include it to provide an indication of the quality of
13 R&D expenditures are also used to proxy for innovative activities, but our data does not provide sufficient
observations to use this proxy. 14 The patent grant rate varies among the different patent offices. For example, the acceptance rate for the USPTO
was approximately 55.8% in 2014 whereas the acceptance rate of the EPO was about 23.6% (64,613 grants vs.
274,367 applications) (https://www.epo.org/about-us/annual-reports-statistics/statistics.html#granted). 15 We set the logarithm to zero when the logarithm is not defined. See Appendix, Table 1 for further details.

- 14 -
innovative activity induced by an IP box. We follow Lanjouw and Schankerman (2004), Hall et
al. (2007), and Ernst et al. (2014) and use a composite quality indicator accounting for three
factors of patents held (forward citations, family size, and technological scope of the patent) to
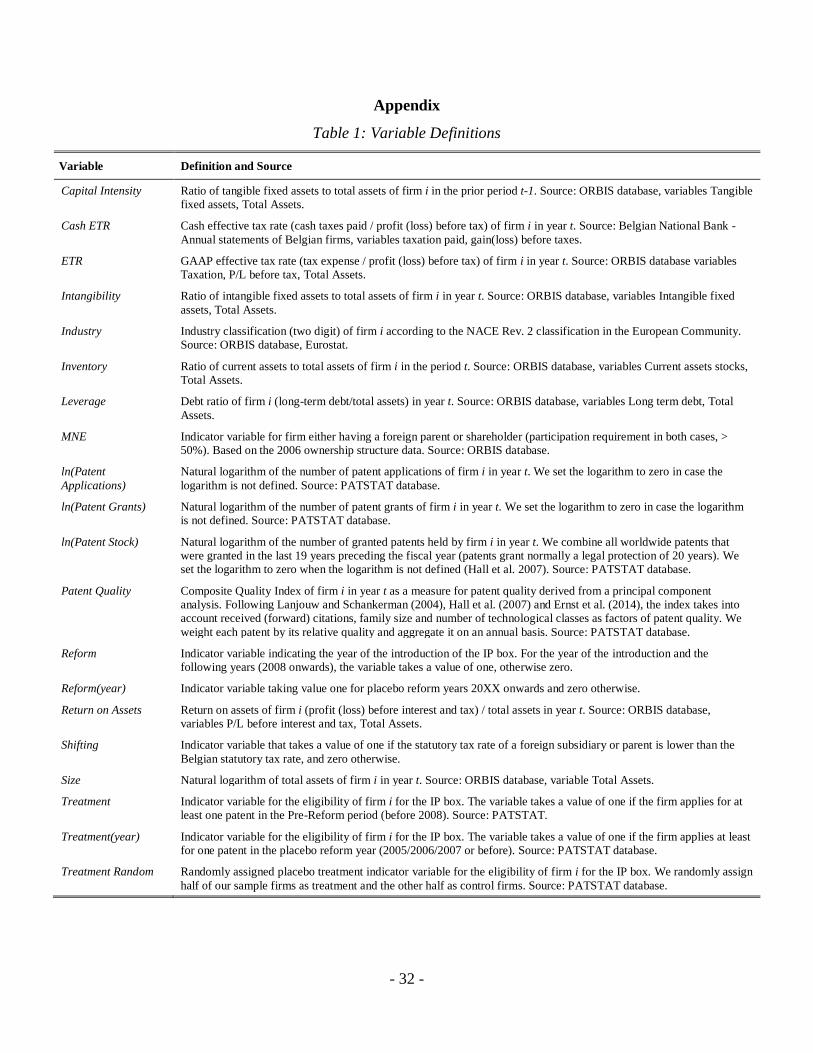
proxy for the quality of innovative activities.16 Table 1 provides definitions and the data sources
for all variables.
3.3 Empirical specification
3.3.1 The effect of the IP box on firms' patenting activities
To address whether the Belgian IP box regime increases firms' innovative activities, we
examine changes in patenting activities around the adoption of the IP box regime. Specifically,
we estimate the following model:
Patit =α+λ1 Reform+λ2 BEi+λ3 Reform × BE + θ Yit + εit, (1)
where Pat is one of the four proxies for patenting activities, the natural logarithm of patent
applications, patent grants or patent stock, or patent quality, of firm i in year t.17 Reform is an
indicator variable equal to one for all years after the introduction of the IP box regime (2008
onwards) and zero otherwise. BE is an indicator variable equal to one if firm i is a firm located in
Belgium and zero otherwise. Y is a vector of control variables, including Size and Leverage,
because larger firms are likely to have more innovative activity and to account for financial
constraints of firms (Hall et al. 2007; Balsmeier et al. 2017). Due to the inclusion of firms in
multiple years, we report robust standard errors clustered at the firm level (Petersen 2009). Table
1 presents detailed definitions of each variable, including the source of data. The coefficient on
16 We obtain similar results as in the above-mentioned papers with an average Patent Quality of approximately 0,
varying between -3.00 and +1.67 for the underlying patents (Hall et al. 2007; Ernst et al. 2014). We weight each
patent by its relative quality and aggregate it on an annual basis. 17 While we predict an increase in innovative activity, we recognize quality measures an aspect of the activity as
opposed to the level of activity. Incentives to increase activity encourage firms to apply for more patents though not
necessarily for better patents.
- 15 -
the interaction between Reform and BE, λ3, captures the incremental patenting activities of
Belgian firms relative to German firms after the introduction of the Belgian IP box regime. A
positive and significant λ3 suggests the Belgian IP box increased patenting activities in Belgium.
3.3.2 The effect of the IP box on firms’ ETR
Next, we assess the effect of the Belgian IP box regime on firms’ effective tax rates. We
use the following OLS specification to identify any change in the effective tax rate of firms able
to take advantage of the Belgian IP box regime. We estimate the following regression model to
test hypotheses 2a:
ETRit = α + β1 Reformt + β2 Treatit + β3 Reform
t × Treatit + δ Xit + εit (2)
where ETR is either GAAP ETR or Cash ETR for firm i in year t.18 Reform is an indicator
variable that equals one for all years after the introduction of the IP box regime (2008 onwards)
and zero otherwise. Following Hall et al. (2007), we use patent applications as a proxy for firms
patenting activities.19 Therefore, Treat is an indicator variable equal to one for firms that file for
at least one patent in the pre-reform period. MNE is an indicator variable equal to one if firm i is
held by a foreign shareholder or owns foreign subsidiaries. We also include a vector of variables
that control for other determinants of ETRs including Size, Leverage, Intangibility, Return on
Assets, Capital Intensity and Inventory. Moreover, we include industry fixed effects.20 Table1
presents detailed definitions of each covariate and predicted variable.
18 Only certain large Belgian firms are required to report cash taxes paid, so our sample is greatly reduced for these
tests. Requirements for reporting cash taxes paid include, among other things, total assets greater than €4.5 million,
revenue greater than €9 million, and more than 50 employees. Other cross-country studies using a European setting
do not provide this measure. 19 R&D is a common proxy for innovative activities, but this line item is poorly populated in European countries.
Firms are eligible for the reduced tax rates on IP income if they commercialize a patent after 2008 in Belgium, so we
designate firms filing for patents prior to the implementation of the IP box to avoid inducing treatment effects. 20 We also run all regressions with year fixed and industry-year fixed effects and the results are substantially the
same. While the inclusion of year fixed effects limits the ability to interpret any coefficients on Reform, it allows us
- 16 -
In equation (2), our main coefficient of interest is β3. It estimates the incremental change
in the effective tax rate of the treatment group relative to the control group after the introduction
of the IP box regime (Hypothesis 2a). We expect β3 to be negative and significant if firms with
patenting activities in the pre-period pay relatively less taxes than non-treated firms after the
introduction of the IP box regime. If multinational enterprises respond relatively less to the
introduction of the IP box regime, we expect β3 to be less pronounced for multinational firms
consistent with Hypothesis 2b.
To test whether MNEs with income shifting opportunities respond less to the introduction
of the IP box regimes than their counterparts without incentives to shift income (Hypothesis 2c),
we estimate the following regression in a sub-sample of Belgian multinational firms
ETRit
= α+γ1 Reform
t+ γ
2 Treatit+ γ
3 Shift
it + γ4 Reform
t × Shiftit + γ
5 Treatit × Shift
it +
γ6 Reform
it × Treatit + γ
7 Reformit × Treat
it× Shift
it+ δ X
it+ εit, (3)
where Shift takes value one if the firm is a multinational enterprise with an opportunity to
shift income out of Belgium and zero otherwise.21 We construct Shift following Huizinga and
Laeven (2008) and Markle (2016) to capture the incentives and opportunities to shift income
among countries in which the multinational operates. Due to data constraints, however, we can
only compute this measure based on the statutory tax rates of the immediate parent and/or
subsidiary of the Belgian firm. Hence, we model income shifting opportunities by calculating the
to control for macroeconomic correlated omitted variables and reduces the impact of cross-sectional correlation on
standard errors. 21 Shift takes the value of one if any of the two tax rate differentials results in an incentive to shift income out of
Belgium and zero otherwise.

- 17 -
tax rate differentials between Belgium and the jurisdiction in which the parent and/or subsidiary
of the MNE is located.22 We expect the coefficient γ6 to be negative if MNEs respond to the
introduction of the IP box regime. The coefficient γ7 captures expected moderating effects of
MNEs' income shifting opportunities on the effectiveness of the IP box regime. If patent-owning
Belgian subsidiaries with an incentive to shift income out of the country respond relatively less
to the introduction of the IP box regime, we expect coefficient γ7 to be positive. Thus, γ6 + γ7
captures the additional change in effective tax rate of patent-owning MNEs' subsidiaries with an
income shifting incentive. If income shifting opportunities curb the effectiveness of IP box
regimes, γ6 + γ7 should be insignificantly different from zero.
Consistent with prior research, we include controls for Leverage and Intangibility to
account for the effect of debt and mobile income on firms’ tax rates (e.g., Chen et al. 2010;
Dyreng, Hanlon, and Maydew 2008). We include Return on Assets as more successful firms
likely pay relatively more taxes (Gupta and Newberry 1997; Rego 2003; Chen et al. 2010). We
also control for Capital Intensity and Inventory as prior research shows each has a negative effect
on tax rates. Finally, we control for Size (e.g., Zimmerman 1983, Rego 2003, Gupta and
Newberry 1997). We use robust standard errors clustered at the firm level to mitigate potential
concerns of understated standard errors (Peterson, 2009).
4. Data and sample
Our primary sample comprises Belgian industrial firms from 2003 to 2012. We choose a
ten-year sample period including five years before and after the introduction of the Belgian IP
22 We obtain our data from unconsolidated financial statements that reflect profits of a MNE’s parent/subsidiary
after any income shifting, which likely affects effective tax rates. While only using the tax rate differential of the
parent and subsidiary is a potential concern, the evidence in Markle (2016) suggests that shifting involving the
parent country is especially relevant for firms in territorial tax systems.
- 18 -
box regime in 2008 because patenting is a lengthy process. In our sample, it takes an average of
approximately 2.5 years after the filing of the patent until it is ultimately granted or refused, at
which time it appears in the database. Therefore, we end the sample period in 2012 to ensure
comparability across sample years. A ten-year sample period should reliably capture firms'
patenting activities and financial data.
We construct our sample from unconsolidated financial and ownership data from Bureau
van Dijk's ORBIS database. Our sample selection procedure is documented in Table 3. Panel A
shows the sample selection for hypothesis H1. We begin with 3,380,860 Belgian and 8,449,146
German firm-year observations.23 We exclude firm-years with missing values for total assets,
missing control variables for hypothesis H1, firm-years with negative total assets, and firms with
missing observations for a balanced panel. We retrieve patent data from the Worldwide Patent
Statistical Database (PATSTAT) (Autumn 2015 edition) that is maintained and distributed by the
European Patent Office (EPO). PATSTAT offers rich bibliographic patent data of more than 100
patent offices including information on firms' patent applications, patent grants and patent
citations.24 We use Bureau van Dijk's reverse search algorithm, taking into account the firm's
name, city and country of residence, to merge the patent data into our sample.25 This process
yields an unbalanced (balanced) panel of 4,459,893 (749,550) firm-year observations. We
modify the sample selection for testing hypothesis H2 using only Belgian firm-year observations.
We exclude firm-years with missing values for total assets, missing ETR and control variable
data, total assets less than or equal to zero, and profits before tax of less than or equal to zero.
23 Initial sample sizes appear large because reporting requirements induce all types and sizes of businesses to report
financial information. Belgian firms report financial information to the Belgian National Bank from which Bureau
van Dijk acquires its data. 24 The database covers patent applications of European Patent Convention (EPC) member states and other major
patent offices in the world like the United States Patent and Trademark Office (USPTO). For more information, see
https://www.epo.org/searching-for-patents/business/patstat.html#tab-1. 25 We are able to merge over 80% of Belgian firms in PATSTAT to firms retrieved from ORBIS.

- 19 -
This process yields an unbalanced (balanced) sample of 1,143,191 (244,450) firm years for
Belgian firms.26 We winsorize all covariates at the 1st and 99th percentile to accommodate for
potential outliers. We also winsorize GAAP ETR at [0,1] (Dyreng at al. 2008).
5. Results
5.1 Descriptive statistics
Table 4 Panel A presents descriptive statistics for our balanced sample of Belgian treated
and German control firms used to test hypothesis H1. Approximately 0.76% (10.29%) of Belgian
(German) firm-year observations in this sample hold patents. The combined average is
approximately 3.92% and is consistent with findings of the innovation economics literature
(Andrews et al. 2014; Hall et al. 2014).27 The German firms-years also contain significantly
more patent applications and grants, and are of higher quality.28
Panel B of Table 4 reports information for the sample of Belgian firms used to test
hypotheses H2a-H2c. The treatment group includes all Belgian firm years over the sample period
for firms that file for at least one patent in the pre-reform period. Patent applications, grants,
stock, and patent quality are significantly bigger for the treatment group, 29 consistent with a
successful partitioning of the data. The mean GAAP ETR for the treatment (control) group is
27.8% (30.6%), while the mean Cash ETR for the treatment (control) group is 27.6% (32.8%),
Note the substantial loss of observations for Cash ETR. Therefore, we rely on the GAAP ETR for
evidence of H2a-H2c. Firms that hold patents are larger, more likely to be multinational firms,
26 We use data provided by the National Bank of Belgium to derive firms’ Cash ETRs. This information is reported
by a limited number of sample firm years, further restricting our sample size for our analysis on the relation between
IP boxes and cash ETRs. 27 Prior literature documents great variation of innovation activities among countries (Andrews et al. 2014). For
example, Hall et al. (2014) conduct a large-scale survey among UK firms and find that only 4% of UK companies that
conduct some form of R&D apply for a patent. 28 A t-test between Belgian and German firms indicate differences that are significant at the 1% level. 29 A t-test between treatment and control firms indicate differences that are significant at the 5% level.
- 20 -
have higher Leverage ratios, lower ROA and Capital Intensity ratios, more Inventory and
comparable Intangibility ratios.
Similar to Table 4, Table 5 presents Pearson correlations for both the balanced sample of
Belgian and German firms used to test hypothesis H1 in Panel A and for only the Belgian firms
used to test hypothesis H2a-H2c in Panel B. Correlation coefficients significant at the 1% level
are marked bold in each panel. As expected, the correlation among the proxies for patent activity
(Patent Applications, Patent Grants, Patent Stock and Patent Quality) are high in both panels. In
Panel B, we note that the correlation between GAAP ETR and cash ETR is high, providing us
some comfort in making inferences about the benefits of the IP box from the GAAP ETRs. The
correlation coefficients of Size, ROA, and Inventory are negatively correlated with ETR whereas
the coefficients of Leverage, Capital Intensity and MNE are positively correlated.30 ETR exhibits
a significant but relatively small correlation with three of four variables proxying for innovative
activities Patent Applications, Patent Grant, and Patent Stock.
5.2 The effect of the IP box on firms' patenting activities
We first test whether the Belgian IP box affects patenting activities of firms using the
specification presented in Equation (1). In Table 6, we report results from both a balanced
(Panels A-C) and unbalanced (Panels D-E) panel of firms to provide information about whether
any change in activity originates from existing or new firms.31 In Panel A columns (1), (3), (5)
30 We attribute the positive coefficient for Leverage to the notional interest regime that was enacted in Belgium in
2006. Since this covers a major part of our sample period, the benefit of using high leverage to reduce tax payments
is small in Belgium. To mitigate concerns that our results are driven by the adoption of the notional interest regime,
we conduct placebo reform tests in section 5.4. The results indicate that the reduction in ETRs cannot be attributed to
the adoption of notional interest regime in 2006. 31 The number of firm-year observations in the unbalanced panels (for testing H1 an H2) are increasing over our
sample period. For the unbalanced panel that includes Belgian and German firms (H1), the number of observations
increase from 129,480 in 2003 to 581,246 in 2012. For the Belgian firms in H2, the number of firm-year
observations increase from 86,499 in 2003 to 157,009 in 2012.

- 21 -
and (7) we initially report results excluding control variables. The constant term in these columns
represents the average level of activity in German firms prior to adoption of the Belgian IP box.
Across both balanced and unbalanced observations, the coefficients on the patenting activities of
Belgian firms relative to German firms, BE, are negative and significant consistent with German
firms engaging in more innovative activity on average (Andrews et al. 2014). We also provide
results separately for domestic and MNEs in Panel B (balanced) and Panel E (unbalanced), and
large firms and patent intensive firms in Panel C (balanced) and Panel E (unbalanced).
The interaction term of Reform and BE (β3) provides an indication of any incremental
innovative activity of Belgian firms during the reform period. Results from the balanced sample,
reported in Panel A of Table 6, suggest that relative to firms in Germany, patent applications and
patent grants for Belgian firms in existence throughout the sample period increase after the
introduction of an IP box regime, while both patent stock and quality decrease. This pattern is
robust for both domestic and MNE firms (Panel B), larger firms, and firms within patent intense
industries (Panel C).32 Specifically, the signs of the coefficients on the interaction term, Reform x
BE, in Columns (2) and (4) of Panel A are significantly positive, indicating an increase in patent
applications and grants for Belgian firms relative to German firms after 2007 (0.4 percent for
patent applications; 1.0 percent for patent grants). The negative and significant coefficient on the
interaction term, Reform x BE, in Columns (6) and (8) of Panel A suggests that the stock and
quality of Belgian patents decreased even further after introduction of the IP box relative to
German firms.33 Our results indicate a decrease in patent stocks of 4.1 percent after 2007 and a
reduction in patent quality. While we make no prediction regarding the level of patent activity in
32 Given Germany had a statutory tax rate reduction in 2008, our difference-in-difference results are biased towards
understating the impact of the IP box regime. 33 Patent stock aggregates the prior 20 years of patent grants and German firms historically have a higher number of
grants, and hence a higher stock.
- 22 -
domestic firms versus MNEs, the results in Panel B suggest that MNEs have relatively more
patent applications and grants after 2007 compared to domestic firms.
We find a similar pattern for Patent Applications, Patent Grants and Patent Quality in
our unbalanced sample. For Patent Stocks, however, we find a significantly positive coefficient
on the interaction term in Table 6 Panels D and E across all splits of the data (All, Large Firms,
Patent-Intensive Industries, MNEs and domestic firms).34 This suggests firms entering Belgium
after the introduction of the IP box hold relatively more patents than firms that existed over the
entire sample period. Taken together, we interpret the results reported in Table 6 as generally
supporting hypothesis H1 that the Belgian IP box increased patenting activities. In addition, we
find patent stocks and quality are significantly smaller after the adoption of the Belgian IP box
for our balanced sample of Belgian firms. However, we find a significant increase in patent
stocks for our unbalanced sample of Belgian firms after the adoption of the IP box in Panel E.
Given patent stocks are measured over the period from t-19 to t, this is consistent with
transferring existing patents to new Belgian firms to take advantage of the favorable treatment
of patent income.
5.3 The effect of the IP box on firms’ Effective Tax Rates
We start our next analysis by assessing the overall effect of the introduction of the IP box
regime on Belgian firms' GAAP and Cash ETRs. We predict that firms with patenting activities
in the pre-period experience an additional reduction in GAAP and Cash ETRs after the adoption
of the IP box regime relative to firms in the control group (Hypothesis 2a). The coefficient on the
34 As a robustness test, we use entropy balancing to match German firms with Belgian firms using Size and Leverage
across all years prior to 2008. Results hold across all proxies for activity except patent applications where the results
are weaker.
- 23 -
interaction of Reform and Treatment (β3) in equation (2) captures additional changes in the
effective tax rates of treated firms relative to control firms. Table 7 presents the results.
Panel A presents the results for domestic and multinational firms. Consistent with
hypothesis (2a), the coefficient of the interaction of Reform and Treatment (β3) is negative across
three out of four specifications. The interaction of Reform and Treatment suggests an incremental
reduction in GAAP ETR of 1.9 percentage points but no reduction in Cash ETR for treated firms
relative to control firms in our full sample. The coefficients for GAAP ETRs are statistically
significant at the 5 % level. Overall, these results suggest that the introduction of the IP box
regime confers a tax benefit to patent-owning firms consistent with Hypothesis 2a.
In Hypothesis 2b we predict that treated domestic firms experience a higher reduction in
ETR than their treated multinational counterparts. Results for domestic firms, reported in Table
7, Panel B, suggest effects on GAAP and Cash ETRs with a similar magnitude as for the whole
sample.35 However, only the estimations for GAAP ETR are significant (at the 5% and 10% level,
respectively). Panel C presents the results for multinational firms, which indicate no effect on
ETRs after the adoption of the IP box (Columns (9) to (12). To further corroborate our findings,
we interact Reform x Treatment x MNE and find an insignificant difference between MNEs and
domestic firms for GAAP ETR (Prob > F = 0.0076) and Cash ETR (Prob > F = 0.0372) levels.36
Overall, these results are consistent with Hypothesis 2b indicating that domestic and
multinational firms benefit to a different extent from the IP box.
To test Hypothesis 2c, we examine firms with and without an incentive to shift income
out of Belgium. Based on Hypothesis 2c we expect firms with an incentive to shift income out of
Belgium to respond less to the introduction of an IP box regime than their counterparts without
35 This is in line with the composition of our sample that includes mainly domestic firms. 36 Reform x Treatment + Reform x Treatment x MNE = 0, one-tailed.

- 24 -
an incentive to shift income out of Belgium. We estimate equations (2) for MNEs with and
without shifting opportunities and equation (3) to test this hypothesis.
Comparable to our prior estimation, the coefficient γ6 (Reform x Treatment) in equation
(3) captures the additional decrease in ETR of eligible (patenting) multinationals relative to non-
eligible (non-patent owning) multinationals. Different from our previous regression model (2),
we use γ7 (Reform x Treatment x Shifting) to additionally estimate the difference between MNEs
with and without income shifting opportunities. Table 8 presents results for the MNEs without
shifting opportunities (Panel A), MNEs with shifting opportunities (Panel B), and for all MNEs
in the sample (Panel C).
Comparing the coefficients reflecting the interaction of Reform and Treatment (γ3 to β3)
in Panel A of Table 8 shows a more pronounced negative effect on the GAAP and Cash ETRs of
multinational firms without shifting opportunities after introduction of the IP box. For Panel A
(MNEs without shifting opportunities), coefficient estimates for GAAP ETR indicate a 10.6
percentage point additional reduction in GAAP ETR of patenting multinationals without shifting
opportunities relative to non-patenting multinationals. Despite significance in its economic
magnitude, we do not find a statistically significant decrease in Cash ETR. The large scale of the
ETR reduction suggests that a substantial amount of MNEs’ taxable income for our sample firms
is attributable to patent income.
For firms with an incentive to shift income out of Belgium (Table 8, Panel B) the
coefficients for Reform x Treatment are positive, but insignificant in each specification. These
results provide first evidence for Hypothesis 2c. To mitigate concerns about the statistical
comparability of the two groups, we re-run our results using equation (3). Panel C presents the
results. Similar to the prior specification, the estimates of coefficient γ3 (Reform x Treatment)
- 25 -
indicate a 10.2 percentage points decrease in GAAP ETR for multinational firms without profit
shifting opportunities. Alternatively, estimates of coefficient γ7 (Reform x Treatment x Shifting)
suggest that firms with a shifting opportunity experience increasing GAAP and Cash ETRs after
the introduction of the IP box regime relative to non-patenting multinationals. The significant
coefficient on the triple interaction (Reform x Treatment x Shifting and F-Test) indicate that the
changes in GAAP ETRs are significantly different between these two. Panel D of Table 8 shows
a similar pattern for the unbalanced panel but a lower magnitude. Consistent with our findings in
Table 6 Panel E (more pronounced increase in patent applications and grants), Table 8 Panel E
shows that the difference between multinationals with and without profit shifting opportunities is
most pronounced for firms in patent-intensive industries.
Our results suggest that in general the introduction of the IP box regime confers a
significant tax benefit on firms as reflected in reductions in GAAP ETRs. This effect is most
pronounced for multinationals that do not have an opportunity to shift income out of the country.
In contrast, multinationals with an income shifting opportunity do not experience significant
reductions in GAAP and Cash ETR after the introduction of the IP box regime. Coupled with our
findings in section 5.2 these findings imply two important effects of IP boxes. First, an IP box
with characteristics like the one Belgium adopted is an effective tool to increase patent
applications and grants, but potentially at the expense of patent quality. Second, the effect of IP
box regimes varies cross-sectionally based on income shifting opportunities.
5.4 Robustness tests
Difference in difference estimation requires that treatment and control firms exhibit
parallel trends in the outcome variable in the period prior to the treatment. Therefore, we conduct
several additional tests to examine whether this assumption is fulfilled. First, we calculate the
- 26 -
percentage growth rate of our dependent variables in the period preceding the IP Box adoption in
Belgium (e.g., Roberts and Whited 2012). We find statistically indistinguishable growth rates for
GAAP ETR (p = 0.1594), Cash ETR (p = 0.2971), Patent Applications (p = 0.1438), Patent
Stocks (p = 0.1056), and Patent Quality (p = 0.1538) but not for Patent Grants (p = 0.000)
suggesting that five out of six of our tests meet the parallel trends assumptions necessary for a
valid difference-in-difference estimation. Second, we conduct placebo tests where we randomly
assign the treatment indicator variable for the eligibility of firm i for the IP box,
TreatmentRandom, to half of our sample firms and use the other half as control firms. We re-
estimate equation 2. As depicted in Table 9, we do not observe any significant coefficient (β3) for
the interaction term of Reform and TreatmentRandom for all dependent variables used in H1 and
H2.
Third, we change the post-reform period for the tests of hypothesis H2. This ensures that
we do not capture other tax-policy changes that lead to a reduction of firms' effective tax rates
(e.g. the introduction of the R&D tax credit in 2006). We re-estimate equation (2) assuming
placebo reforms in 2005, 2006 and 2007. If the parallel trends assumption is satisfied, we expect
the coefficients (β3) to be insignificant. Table 10 depicts the results in the respective placebo
reform years. Panel A presents the results for equations (2) and (3). The results indicate no
significant coefficient for β3 (Interaction of Reform x Treatment as well as Reform x Treatment x
Shifting Indicators) for any GAAP ETR or Cash ETR specification. This suggests that other tax-
policy related events do not explain the changes in effective tax rates described in section 5.3.
Based on these results, we believe that the parallel trend assumption holds.
- 27 -
6. Conclusion
We investigate whether IP box regimes increase firms’ innovative activities and which
firms benefit from the adoption of the IP box regime. In contrast to contemporaneous research on
IP boxes that examines multiple countries, we focus on one country because it allows us to
cleanly identify targeted innovative activity and resulting tax benefits around the adoption of the
IP box. Using as a quasi-experiment. We investigate the effect of the adoption of the Belgian IP
box regime on patenting activities and effective tax rates. Our results suggest that relative to
firms in Germany, patent applications and patent grants increase by 0.4 percent and one percent
after the introduction of an IP box regime, while patent quality appears to decrease. This pattern
is robust across both a balanced and unbalanced sample of firm-years, within patent intense
industries, as well as within domestic and multinational firm years respectively.
We also examine the types of firms that benefit from the Belgian IP Box, and find that
patent owning firms on average reduce their GAAP ETRs by approximately 1.9 (3.6) percentage
points compared to non-patent owning firms for our balanced (unbalanced) sample. In addition,
we find cross sectional variation in the type of firms that enjoy tax benefits of the IP box. In
general, the introduction of the IP box regime appears to confer a significant tax benefit on firms
in the form of reductions in GAAP ETRs. This effect is most pronounced for multinationals that
do not have an opportunity to shift income out of the country. In contrast, multinationals with an
income shifting opportunity do not experience significant reductions in ETRs after the
introduction of the IP box regime.
We contribute to two streams of research. First, we add to the growing IP box literature
(e.g., Evers et al. 2015; Alstadsæter et al. 2015; Chen et al. 2016) by linking effects of the tax
regime on patenting activities and ETRs. This allows us to disentangle the effects of an IP box on

- 28 -
different groups of firms and draw conclusions on the types of firms that benefit from IP boxes.
Our findings indicate firms patenting activities after the adoption of an IP box consistent with the
intent of increasing innovative activity. We also examine the type of firm that reaps the benefits
of IP box tax incentives. To our knowledge, this is the first paper on IP boxes that is able to
disentangle this effect. We measure the tax benefits accruing to firms by examining cross
sectional difference between domestic and multinational firms, and separately between
multinationals with different income shifting opportunities. We provide evidence that
multinational firms with fewer income shifting opportunities receive the greatest tax benefits
from the Belgian IP box, followed by domestic firms, and then by multinational firms with
greater income shifting opportunities.
- 29 -
References
Alstadsæter, A., S. Barrios, G. Nicodeme, A. M. Skonieczna, and A. Vezzani (2015): “Patent
Boxes Design, Patents Location and Local R&D,” IPTS Working Papers on Corporate R&D
and Innovation, (No 6/2015).
Andrews, D., C. Criscuolo, and C. Menon (2014): “Do Resources Flow to Patenting Firms? –
Cross-Country Evidence From Firm Level Data,” OECD Economics Department Working
Papers No. 1127.
Arrow, K. (1962): “Economic Welfare and the Allocation of Resources for Invention,” in The
Rate and Direction of Inventive Activity: Economic and Social Factors. National Bureau for
Economic Research, pp. 609–626.
Balsmeier, B., L. Fleming, and G. Manso (2017): “Independent boards and innovation,” Journal
of Financial Economics 123(3), 536-557.
Beer, S., and J. Loeprick (2015): “Profit shifting: drivers of transfer (mis)pricing and the
potential of countermeasures,” International Tax and Public Finance, 22(3), 426–451.
Belgische Kamer Van Volksvertegenwoordigers (2007) Apr 4, 2007.
Berger, P. (1993): “Explicit and Implicit Tax Effects of the R&D Tax Credit,” The Accounting
Review, 31(2), 131–171.
Bloom, N., R. Griffith, and J. Van Reenen (2002): “Do R&D tax credits work? Evidence from a
panel of countries 1979-1997,” Journal of Public Economics, 85(1), 1–31.
Bradley, S., E. Dauchy, and L. Robinson. 2015. “Cross-Country Evidence on the Preliminary
Effects of Patent Box Regimes on Patent Activity and Ownership.” National Tax Journal
68(4), 1047-1072.
Brannon, I., and M. Hanlon (2015) “How a Patent Box Would Affect the U.S.
Biopharmaceutical Sector,” Tax Notes, 146 (5), 635-639.
Cappelen, A., A. Raknerud, and M. Rybalka (2012): “The effects of R&D tax credits on
patenting and innovations,” Research Policy, 41(2), 334–345.
Carboni, O. (2011): “R&D subsidies and private R&D expenditures: evidence from Italian
manufacturing data,” International Review of Applied Economics, 25(4), 419– 439.
Chen, S., L. De Simone, M. Hanlon, and R. Lester (2016): “The effect of Innovation Box
regimes on income shifting and real activity,” Working Paper, University of Texas, Stanford
University and MIT.
Chen, S. P., X. Chen, Q. Cheng, and T. Shevlin (2010): “Are family firms more tax aggressive
than non-family firms?” Journal of Financial Economics, 95(1), 41–61.
Cordes, J. J. (1989): “Tax Incentives and R-and-D Spending - a Review of the Evidence,”
Research Policy, 18(3), 119–133.
Dischinger, M., and N. Riedel (2011): “Corporate Taxes and the Location of Intangible Assets
within Multinational Firms,” Journal of Public Economics, 95(7-8), 691–707.
Dyreng, S., and K. Markle (2016): “The Effect of Financial Constraints on Income Shifting by
U.S. Multinationals,” The Accounting Review, 91(6), 1601–1627.
Dyreng, S. D., M. Hanlon, and E. L. Maydew (2008): “Long-run corporate tax avoidance,” The
Accounting Review, 83(1), 61–82.
Dyreng, S. D., J. L. Hoopes, and J. H. Wilde (2016): “Public Pressure and Corporate Tax
Behavior,” Journal of Accounting Research, 54(1), 147–186.
Ernst, C., K. Richter, and N. Riedel (2014): “Corporate taxation and the quality of research and
development,” International Tax and Public Finance, 21(4), 694–719.

- 30 -
Evers, L., H. Miller, and C. Spengel (2015): “Intellectual Property Box Regimes: Effective Tax
Rates and Tax Policy Considerations,” International Tax and Public Finance, 22(3), 502–
530.
E&Y (2014): “Worldwide R&D incentives reference guide,” Available at:
http://www.ey.com/Publication/vwLUAssets/EY-worldwide-randd-incentives-reference-
guide/$FILE/EY-worldwide-randd-incentives-reference-guide.pdf/.
Eynatten, W. (2008): “European R&D and IP tax regimes: a comparative study,” Intertax,
36(11), 502–519.
Eynatten, W., and P. Brauns (2010): “Benelux tax competition to attract IP income is on again,”
International Tax Review, 21(2), 43–45.
Faulhaber, L. V. (2016): “The Luxembourg Effect: Patent Boxes and the Limits of International
Cooperation,” Georgetown University Law Center.
Finley, A., S. Lusch, and K. Cook (2015): “The Effectiveness of the R&D Tax Credit: Evidence
from the Alternative Simplified Credit,” Journal of the American Taxation Association,
37(1), 157–181.
Griffith, R., H. Miller and M. O’Connell. (2014): “Ownership of intellectual property and
corporate taxation,” Journal of Public Economics, 112, 12-23.
Gupta, S., and K. Newberry (1997): “Determinants of the variability in corporate effective tax
rates: Evidence from longitudinal data.,” Journal of Accounting and Public Policy, 16(1), 1–
34.
Hall, B. H. (1996): “The Private and Social Returns to Research and Development,” in
Technology, R&D, and the Economy, ed. by R. Smith, and C. Barfield. Brookings
Institution, pp. 140–183.
Hall, B. H. (2010): “The Financing of Innovative Firms,” Review of Economics and Institutions,
1(1), 1–30.
Hall, B. H., C. Helmers, M. Rogers, and V. Sena (2014): “The Choice between Formal and
Informal Intellectual Property: A Review,” Journal of Economic Literature, 52(2), 375–423.
Hall, B. H., G. Thoma, and S. Torrisi (2007): “The Market Value of Patents and R&D: Evidence
from European Firms.,” Academy of Management Annual Meeting Proceedings, 8(1), 1–6.
Hanlon, M., and J. Slemrod (2009): “What does tax aggressiveness signal? Evidence from stock
price reactions to news about tax shelter involvement,” Journal of Public Economics, 93(1-
2), 126–141.
Heckemeyer, J., P. Olligs, and M. Overesch (2016): “Corporate Taxes and the Location of US
Trademarks.,” Working Paper.
Huizinga, H., and L. Laeven (2008): “International profit shifting within multination- als: A
multi-country perspective,” Journal of Public Economics, 92(5-6), 1164–1182.
IRS (2013): “SOI Tax Stats - Corporation Research Credit,” https://www.irs.gov/uac/soi-tax-
stats-corporation-research-credit, retrieved on 25 May 2017.
Karkinsky, T., and N. Riedel (2012): “Corporate taxation and the choice of patent location within
multinational firms,” Journal of International Economics, 88(1), 176– 185.
Klassen, K. J., and S. K. Laplante (2012): “Are US Multinational Corporations Becoming More
Aggressive Income Shifters?,” Journal of Accounting Research, 50(5), 1245–1285.
Klassen, K. J., J. A. Pittman, and M. P. Reed (2004): “A cross-national comparison of R&D
expenditure decisions: Tax incentives and financial constraints,” Contemporary Accounting
Research, 21(3), 639–680.
Lanjouw, J. O, and Schankerman, M. (2004): “Patent quality and research productivity:
- 31 -
Measuring innovation with multiple indicators,” The Economic Journal, 114(495), 441-465.
Lohse, T., and N. Riedel (2013): “Do Transfer Pricing Laws International Income Shifting?
Evidence from European Multinationals,“ CESifo Working Paper No. 4404.
Lokshin, B., and P. Mohnen (2012): “How effective are level-based R&D tax credits? Evidence
from the Netherlands,” Applied Economics, 44(12), 1527–1538.
Markle, K. (2016): “A Comparison of the Tax-Motivated Income Shifting of Multinationals in
Territorial and Worldwide Countries,” Contemporary Accounting Research, 33(1), 7–43.
Merrill, P., et al. (2012): “Is it Time for the United States to Consider the Patent Box?,” Tax
Notes, pp. 1665–1675.
Merrill, P. (2016): “Innovation Boxes: BEPS and Beyond,” National Tax Journal, 69(4), 847–
862.
Mills, L., M. Erickson, and E. Maydew (1998): “Investments in tax planning,” Journal of the
American Taxation Association, 20(1), 1–20.
OECD (2015): “OECD/G20 Base Erosion and Profit Shifting Project – 2015 Final Reports,”
available at: http://www.oecd.org/ctp/beps-actions.htm.
OECD (2016): “Compendium of R&D tax incentive schemes: OECD countries and selected
economies,” available at: http://oe.cd/rdtax, retrieved on 25 May 2017.
Petersen, M. A. (2009): "Estimating standard errors in finance panel data sets: Comparing
approaches." The Review of Financial Studies, 22(1), 435-480.
Rego, S. O. (2003): “Tax-avoidance activities of US multinational corporations,” Contemporary
Accounting Research, 20(4), 805–833.
Roberts, M., and T. Whited. 2012. Endogeneity in Empirical Corporate Finance. Available
at: http://papers.ssrn.com/sol3/papers.cfm?abstract_id¼1748604.
Weichenrieder, A. J., and J. Mintz (2008): “What Determines the use of Holding Companies and
Ownership Chains?,” Oxford University Centre for Business Taxation, Working Paper Series
No. 803.
Zimmerman, J. L. (1983): “Taxes and Firm Size,” Journal of Accounting & Economics, 5(2),
119–149.
- 32 -
Appendix
Table 1: Variable Definitions
Variable Definition and Source
Capital Intensity Ratio of tangible fixed assets to total assets of firm i in the prior period t-1. Source: ORBIS database, variables Tangible
fixed assets, Total Assets.
Cash ETR Cash effective tax rate (cash taxes paid / profit (loss) before tax) of firm i in year t. Source: Belgian National Bank -
Annual statements of Belgian firms, variables taxation paid, gain(loss) before taxes.
ETR GAAP effective tax rate (tax expense / profit (loss) before tax) of firm i in year t. Source: ORBIS database variables
Taxation, P/L before tax, Total Assets.
Intangibility Ratio of intangible fixed assets to total assets of firm i in year t. Source: ORBIS database, variables Intangible fixed
assets, Total Assets.
Industry
Industry classification (two digit) of firm i according to the NACE Rev. 2 classification in the European Community.
Source: ORBIS database, Eurostat.
Inventory Ratio of current assets to total assets of firm i in the period t. Source: ORBIS database, variables Current assets stocks,
Total Assets.
Leverage Debt ratio of firm i (long-term debt/total assets) in year t. Source: ORBIS database, variables Long term debt, Total
Assets.
MNE Indicator variable for firm either having a foreign parent or shareholder (participation requirement in both cases, >
50%). Based on the 2006 ownership structure data. Source: ORBIS database.
ln(Patent
Applications)
Natural logarithm of the number of patent applications of firm i in year t. We set the logarithm to zero in case the
logarithm is not defined. Source: PATSTAT database.
ln(Patent Grants) Natural logarithm of the number of patent grants of firm i in year t. We set the logarithm to zero in case the logarithm
is not defined. Source: PATSTAT database.
ln(Patent Stock) Natural logarithm of the number of granted patents held by firm i in year t. We combine all worldwide patents that
were granted in the last 19 years preceding the fiscal year (patents grant normally a legal protection of 20 years). We
set the logarithm to zero when the logarithm is not defined (Hall et al. 2007). Source: PATSTAT database.
Patent Quality Composite Quality Index of firm i in year t as a measure for patent quality derived from a principal component
analysis. Following Lanjouw and Schankerman (2004), Hall et al. (2007) and Ernst et al. (2014), the index takes into
account received (forward) citations, family size and number of technological classes as factors of patent quality. We
weight each patent by its relative quality and aggregate it on an annual basis. Source: PATSTAT database.
Reform Indicator variable indicating the year of the introduction of the IP box. For the year of the introduction and the
following years (2008 onwards), the variable takes a value of one, otherwise zero.
Reform(year) Indicator variable taking value one for placebo reform years 20XX onwards and zero otherwise.
Return on Assets Return on assets of firm i (profit (loss) before interest and tax) / total assets in year t. Source: ORBIS database,
variables P/L before interest and tax, Total Assets.
Shifting Indicator variable that takes a value of one if the statutory tax rate of a foreign subsidiary or parent is lower than the
Belgian statutory tax rate, and zero otherwise.
Size Natural logarithm of total assets of firm i in year t. Source: ORBIS database, variable Total Assets.
Treatment Indicator variable for the eligibility of firm i for the IP box. The variable takes a value of one if the firm applies for at
least one patent in the Pre-Reform period (before 2008). Source: PATSTAT.
Treatment(year) Indicator variable for the eligibility of firm i for the IP box. The variable takes a value of one if the firm applies at least
for one patent in the placebo reform year (2005/2006/2007 or before). Source: PATSTAT database.
Treatment Random
Randomly assigned placebo treatment indicator variable for the eligibility of firm i for the IP box. We randomly assign
half of our sample firms as treatment and the other half as control firms. Source: PATSTAT database.
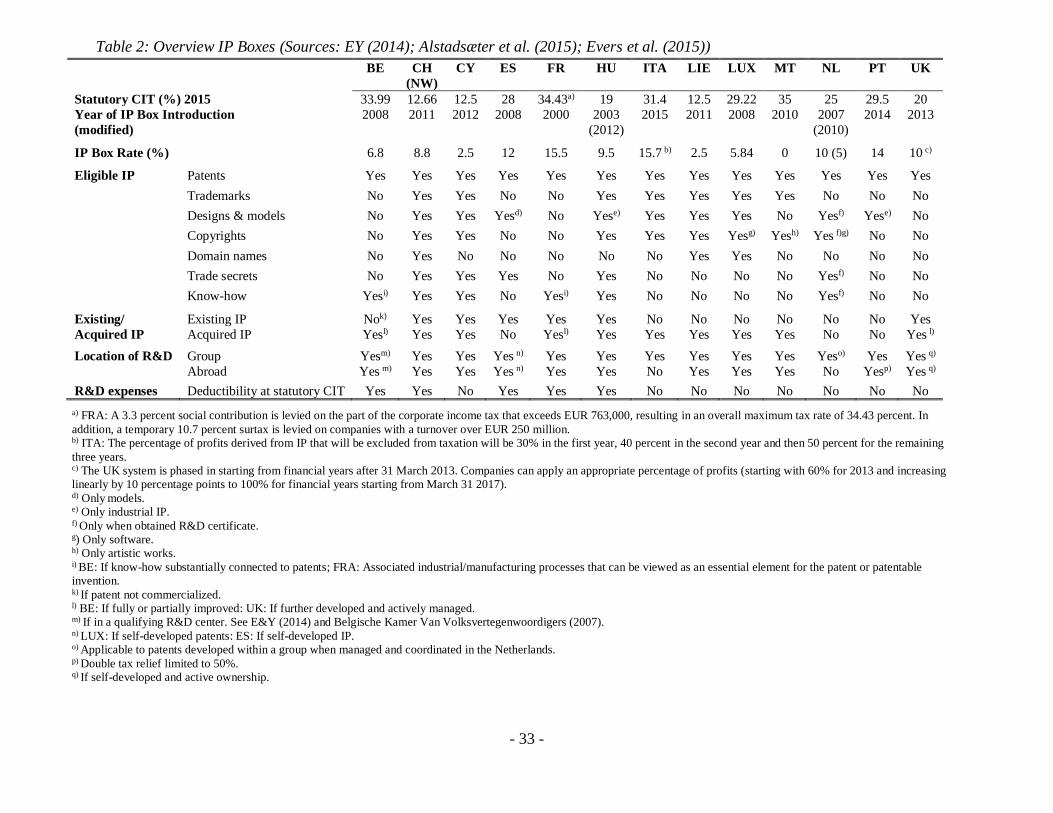
- 33 -
Table 2: Overview IP Boxes (Sources: EY (2014); Alstadsæter et al. (2015); Evers et al. (2015))
BE CH
(NW)
CY ES FR HU ITA LIE LUX MT NL PT UK
Statutory CIT (%) 2015 33.99 12.66 12.5 28 34.43a) 19 31.4 12.5 29.22 35 25 29.5 20
Year of IP Box Introduction
(modified)
2008 2011 2012 2008 2000 2003
(2012)
2015 2011 2008 2010 2007
(2010)
2014 2013
IP Box Rate (%) 6.8 8.8 2.5 12 15.5 9.5 15.7 b) 2.5 5.84 0 10 (5) 14 10 c)
Eligible IP Patents Yes Yes Yes Yes Yes Yes Yes Yes Yes Yes Yes Yes Yes
Trademarks No Yes Yes No No Yes Yes Yes Yes Yes No No No
Designs & models No Yes Yes Yesd) No Yese) Yes Yes Yes No Yesf) Yese) No
Copyrights No Yes Yes No No Yes Yes Yes Yesg) Yesh) Yes f)g) No No
Domain names No Yes No No No No No Yes Yes No No No No
Trade secrets No Yes Yes Yes No Yes No No No No Yesf) No No
Know-how Yesi) Yes Yes No Yesi) Yes No No No No Yesf) No No
Existing/
Acquired IP
Existing IP Nok) Yes Yes Yes Yes Yes No No No No No No Yes
Acquired IP Yesl) Yes Yes No Yesl) Yes Yes Yes Yes Yes No No Yes l)
Location of R&D Group Yesm) Yes Yes Yes n) Yes Yes Yes Yes Yes Yes Yeso) Yes Yes q)
Abroad Yes m) Yes Yes Yes n) Yes Yes No Yes Yes Yes No Yesp) Yes q)
R&D expenses Deductibility at statutory CIT Yes Yes No Yes Yes Yes No No No No No No No
a) FRA: A 3.3 percent social contribution is levied on the part of the corporate income tax that exceeds EUR 763,000, resulting in an overall maximum tax rate of 34.43 percent. In
addition, a temporary 10.7 percent surtax is levied on companies with a turnover over EUR 250 million. b) ITA: The percentage of profits derived from IP that will be excluded from taxation will be 30% in the first year, 40 percent in the second year and then 50 percent for the remaining
three years. c) The UK system is phased in starting from financial years after 31 March 2013. Companies can apply an appropriate percentage of profits (starting with 60% for 2013 and increasing
linearly by 10 percentage points to 100% for financial years starting from March 31 2017). d) Only models. e) Only industrial IP. f) Only when obtained R&D certificate. g) Only software. h) Only artistic works. i) BE: If know-how substantially connected to patents; FRA: Associated industrial/manufacturing processes that can be viewed as an essential element for the patent or patentable
invention. k) If patent not commercialized. l) BE: If fully or partially improved: UK: If further developed and actively managed. m) If in a qualifying R&D center. See E&Y (2014) and Belgische Kamer Van Volksvertegenwoordigers (2007). n) LUX: If self-developed patents: ES: If self-developed IP. o) Applicable to patents developed within a group when managed and coordinated in the Netherlands. p) Double tax relief limited to 50%. q) If self-developed and active ownership.
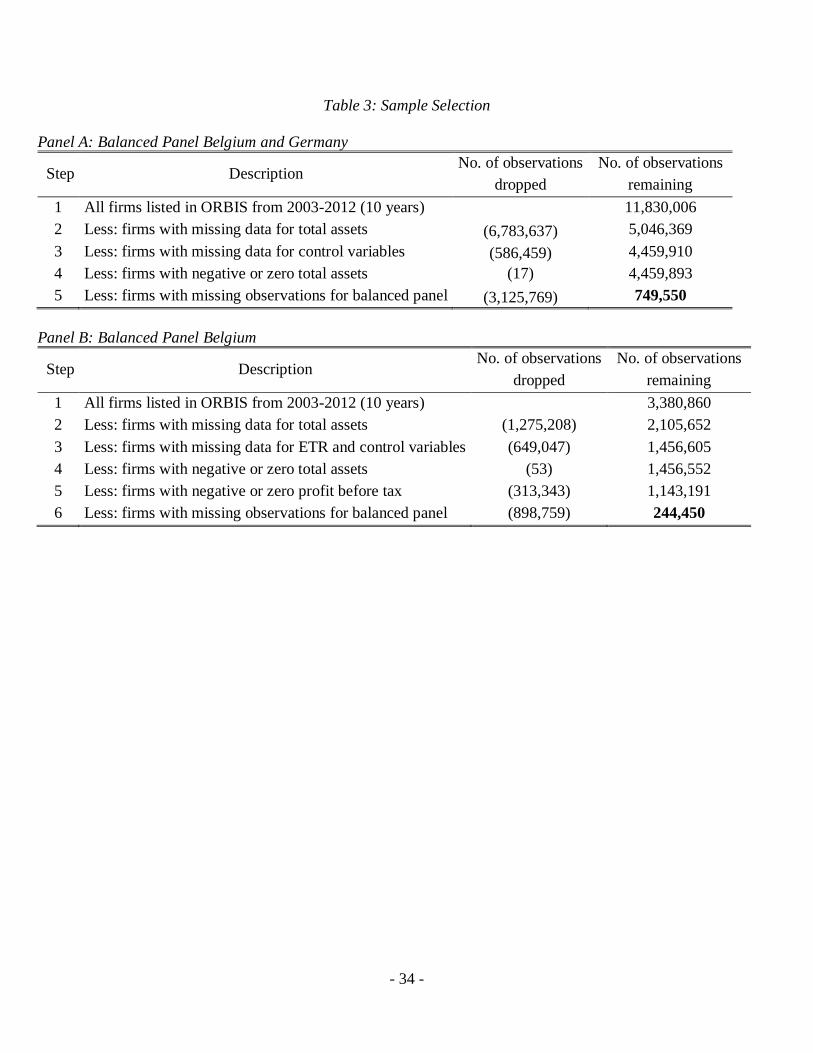
- 34 -
Table 3: Sample Selection
Panel A: Balanced Panel Belgium and Germany
Step Description No. of observations
dropped
No. of observations
remaining
1 All firms listed in ORBIS from 2003-2012 (10 years) 11,830,006
2 Less: firms with missing data for total assets (6,783,637) 5,046,369
3 Less: firms with missing data for control variables (586,459) 4,459,910
4 Less: firms with negative or zero total assets (17) 4,459,893
5 Less: firms with missing observations for balanced panel (3,125,769) 749,550
Panel B: Balanced Panel Belgium
Step Description No. of observations
dropped
No. of observations
remaining
1 All firms listed in ORBIS from 2003-2012 (10 years) 3,380,860
2 Less: firms with missing data for total assets (1,275,208) 2,105,652
3 Less: firms with missing data for ETR and control variables (649,047) 1,456,605
4 Less: firms with negative or zero total assets (53) 1,456,552
5 Less: firms with negative or zero profit before tax (313,343) 1,143,191
6 Less: firms with missing observations for balanced panel (898,759) 244,450
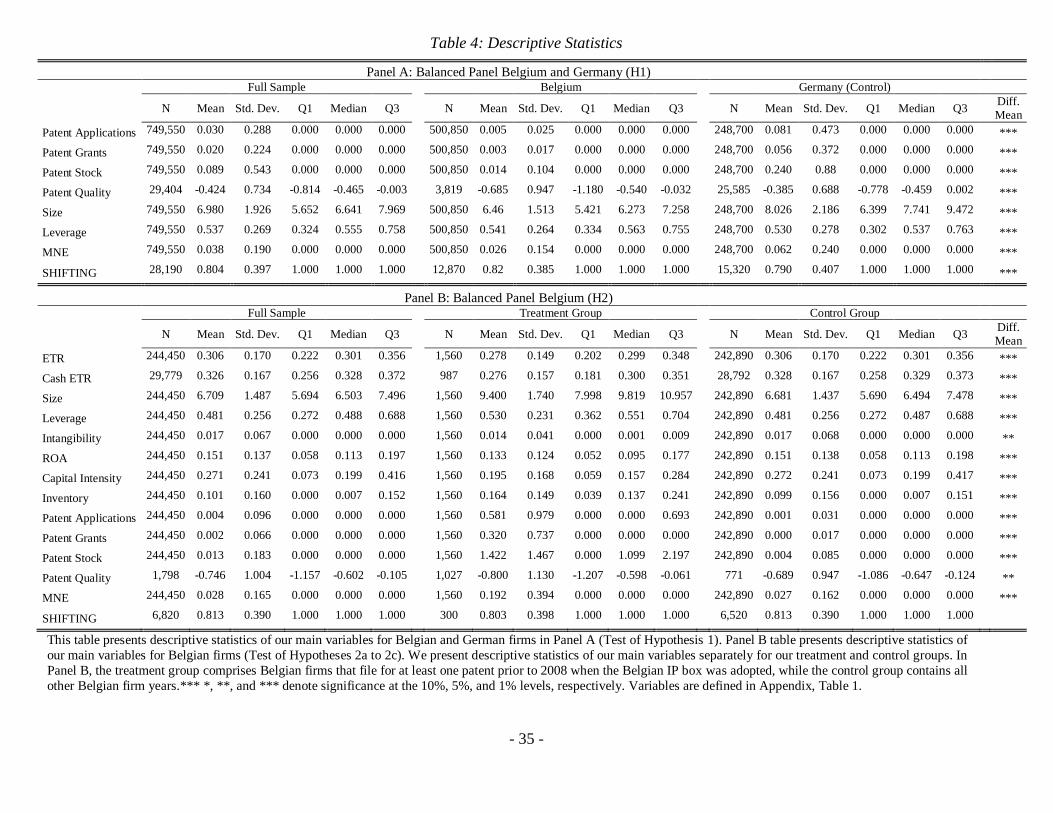
- 35 -
Table 4: Descriptive Statistics
Panel A: Balanced Panel Belgium and Germany (H1)
Full Sample Belgium Germany (Control)
N Mean Std. Dev. Q1 Median Q3 N Mean Std. Dev. Q1 Median Q3 N Mean Std. Dev. Q1 Median Q3 Diff.
Mean
Patent Applications 749,550 0.030 0.288 0.000 0.000 0.000 500,850 0.005 0.025 0.000 0.000 0.000 248,700 0.081 0.473 0.000 0.000 0.000 ***
Patent Grants 749,550 0.020 0.224 0.000 0.000 0.000 500,850 0.003 0.017 0.000 0.000 0.000 248,700 0.056 0.372 0.000 0.000 0.000 ***
Patent Stock 749,550 0.089 0.543 0.000 0.000 0.000 500,850 0.014 0.104 0.000 0.000 0.000 248,700 0.240 0.88 0.000 0.000 0.000 ***
Patent Quality 29,404 -0.424 0.734 -0.814 -0.465 -0.003 3,819 -0.685 0.947 -1.180 -0.540 -0.032 25,585 -0.385 0.688 -0.778 -0.459 0.002 ***
Size 749,550 6.980 1.926 5.652 6.641 7.969 500,850 6.46 1.513 5.421 6.273 7.258 248,700 8.026 2.186 6.399 7.741 9.472 ***
Leverage 749,550 0.537 0.269 0.324 0.555 0.758 500,850 0.541 0.264 0.334 0.563 0.755 248,700 0.530 0.278 0.302 0.537 0.763 ***
MNE 749,550 0.038 0.190 0.000 0.000 0.000 500,850 0.026 0.154 0.000 0.000 0.000 248,700 0.062 0.240 0.000 0.000 0.000 ***
SHIFTING 28,190 0.804 0.397 1.000 1.000 1.000 12,870 0.82 0.385 1.000 1.000 1.000 15,320 0.790 0.407 1.000 1.000 1.000 ***
Panel B: Balanced Panel Belgium (H2)
Full Sample Treatment Group Control Group
N Mean Std. Dev. Q1 Median Q3 N Mean Std. Dev. Q1 Median Q3 N Mean Std. Dev. Q1 Median Q3 Diff.
Mean
ETR 244,450 0.306 0.170 0.222 0.301 0.356 1,560 0.278 0.149 0.202 0.299 0.348 242,890 0.306 0.170 0.222 0.301 0.356 ***
Cash ETR 29,779 0.326 0.167 0.256 0.328 0.372 987 0.276 0.157 0.181 0.300 0.351 28,792 0.328 0.167 0.258 0.329 0.373 ***
Size 244,450 6.709 1.487 5.694 6.503 7.496 1,560 9.400 1.740 7.998 9.819 10.957 242,890 6.681 1.437 5.690 6.494 7.478 ***
Leverage 244,450 0.481 0.256 0.272 0.488 0.688 1,560 0.530 0.231 0.362 0.551 0.704 242,890 0.481 0.256 0.272 0.487 0.688 ***
Intangibility 244,450 0.017 0.067 0.000 0.000 0.000 1,560 0.014 0.041 0.000 0.001 0.009 242,890 0.017 0.068 0.000 0.000 0.000 **
ROA 244,450 0.151 0.137 0.058 0.113 0.197 1,560 0.133 0.124 0.052 0.095 0.177 242,890 0.151 0.138 0.058 0.113 0.198 ***
Capital Intensity 244,450 0.271 0.241 0.073 0.199 0.416 1,560 0.195 0.168 0.059 0.157 0.284 242,890 0.272 0.241 0.073 0.199 0.417 ***
Inventory 244,450 0.101 0.160 0.000 0.007 0.152 1,560 0.164 0.149 0.039 0.137 0.241 242,890 0.099 0.156 0.000 0.007 0.151 ***
Patent Applications 244,450 0.004 0.096 0.000 0.000 0.000 1,560 0.581 0.979 0.000 0.000 0.693 242,890 0.001 0.031 0.000 0.000 0.000 ***
Patent Grants 244,450 0.002 0.066 0.000 0.000 0.000 1,560 0.320 0.737 0.000 0.000 0.000 242,890 0.000 0.017 0.000 0.000 0.000 ***
Patent Stock 244,450 0.013 0.183 0.000 0.000 0.000 1,560 1.422 1.467 0.000 1.099 2.197 242,890 0.004 0.085 0.000 0.000 0.000 ***
Patent Quality 1,798 -0.746 1.004 -1.157 -0.602 -0.105 1,027 -0.800 1.130 -1.207 -0.598 -0.061 771 -0.689 0.947 -1.086 -0.647 -0.124 **
MNE 244,450 0.028 0.165 0.000 0.000 0.000 1,560 0.192 0.394 0.000 0.000 0.000 242,890 0.027 0.162 0.000 0.000 0.000 ***
SHIFTING 6,820 0.813 0.390 1.000 1.000 1.000 300 0.803 0.398 1.000 1.000 1.000 6,520 0.813 0.390 1.000 1.000 1.000
This table presents descriptive statistics of our main variables for Belgian and German firms in Panel A (Test of Hypothesis 1). Panel B table presents descriptive statistics of
our main variables for Belgian firms (Test of Hypotheses 2a to 2c). We present descriptive statistics of our main variables separately for our treatment and control groups. In
Panel B, the treatment group comprises Belgian firms that file for at least one patent prior to 2008 when the Belgian IP box was adopted, while the control group contains all
other Belgian firm years.*** *, **, and *** denote significance at the 10%, 5%, and 1% levels, respectively. Variables are defined in Appendix, Table 1.
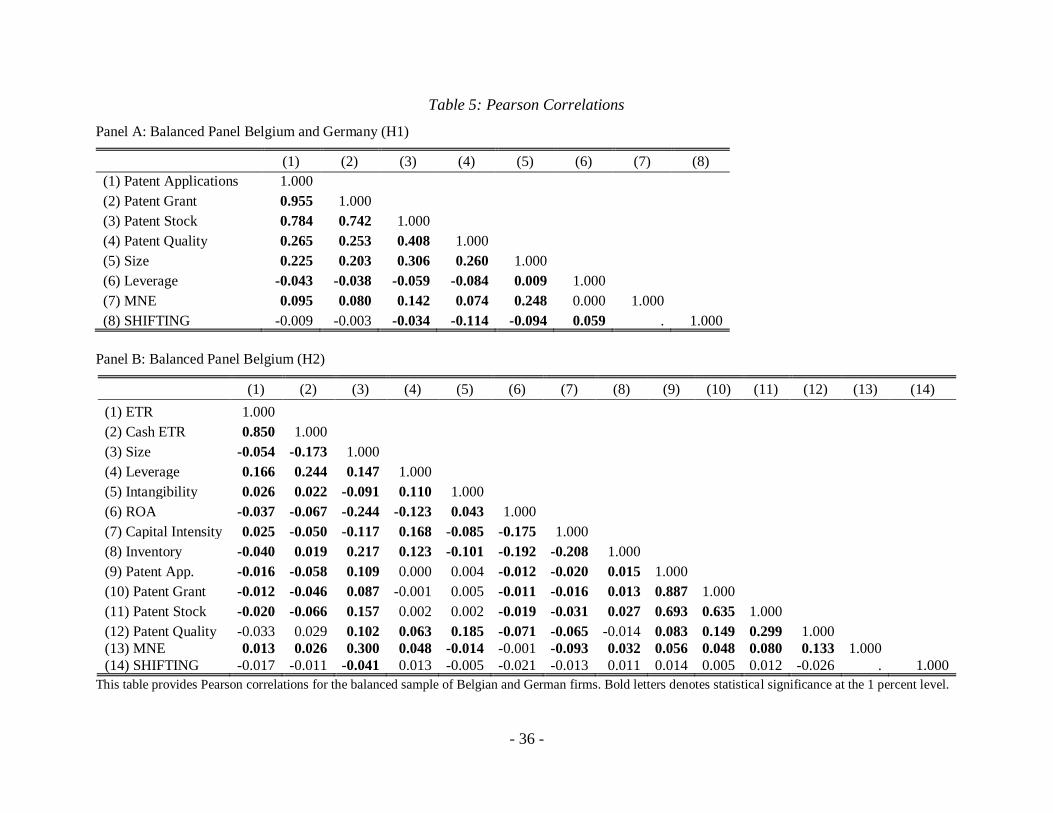
- 36 -
Table 5: Pearson Correlations
Panel A: Balanced Panel Belgium and Germany (H1)
(1) (2) (3) (4) (5) (6) (7) (8)
(1) Patent Applications 1.000
(2) Patent Grant 0.955 1.000
(3) Patent Stock 0.784 0.742 1.000
(4) Patent Quality 0.265 0.253 0.408 1.000
(5) Size 0.225 0.203 0.306 0.260 1.000
(6) Leverage -0.043 -0.038 -0.059 -0.084 0.009 1.000
(7) MNE 0.095 0.080 0.142 0.074 0.248 0.000 1.000
(8) SHIFTING -0.009 -0.003 -0.034 -0.114 -0.094 0.059 . 1.000
Panel B: Balanced Panel Belgium (H2)
(1) (2) (3) (4) (5) (6) (7) (8) (9) (10) (11) (12) (13) (14)
(1) ETR 1.000
(2) Cash ETR 0.850 1.000
(3) Size -0.054 -0.173 1.000
(4) Leverage 0.166 0.244 0.147 1.000
(5) Intangibility 0.026 0.022 -0.091 0.110 1.000
(6) ROA -0.037 -0.067 -0.244 -0.123 0.043 1.000
(7) Capital Intensity 0.025 -0.050 -0.117 0.168 -0.085 -0.175 1.000
(8) Inventory -0.040 0.019 0.217 0.123 -0.101 -0.192 -0.208 1.000
(9) Patent App. -0.016 -0.058 0.109 0.000 0.004 -0.012 -0.020 0.015 1.000
(10) Patent Grant -0.012 -0.046 0.087 -0.001 0.005 -0.011 -0.016 0.013 0.887 1.000
(11) Patent Stock -0.020 -0.066 0.157 0.002 0.002 -0.019 -0.031 0.027 0.693 0.635 1.000
(12) Patent Quality -0.033 0.029 0.102 0.063 0.185 -0.071 -0.065 -0.014 0.083 0.149 0.299 1.000
(13) MNE 0.013 0.026 0.300 0.048 -0.014 -0.001 -0.093 0.032 0.056 0.048 0.080 0.133 1.000
(14) SHIFTING -0.017 -0.011 -0.041 0.013 -0.005 -0.021 -0.013 0.011 0.014 0.005 0.012 -0.026 . 1.000
This table provides Pearson correlations for the balanced sample of Belgian and German firms. Bold letters denotes statistical significance at the 1 percent level.
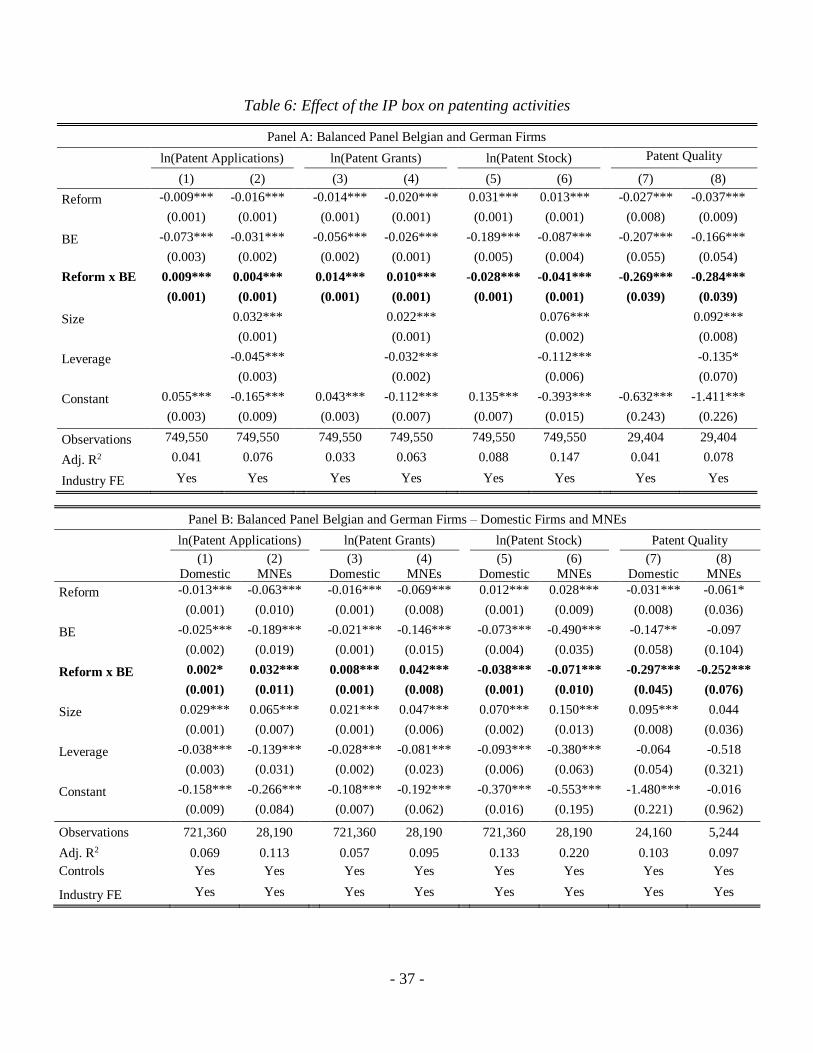
- 37 -
Table 6: Effect of the IP box on patenting activities
Panel A: Balanced Panel Belgian and German Firms
ln(Patent Applications) ln(Patent Grants) ln(Patent Stock) Patent Quality
(1) (2) (3) (4) (5) (6) (7) (8)
Reform -0.009*** -0.016*** -0.014*** -0.020*** 0.031*** 0.013*** -0.027*** -0.037***
(0.001) (0.001) (0.001) (0.001) (0.001) (0.001) (0.008) (0.009)
BE -0.073*** -0.031*** -0.056*** -0.026*** -0.189*** -0.087*** -0.207*** -0.166***
(0.003) (0.002) (0.002) (0.001) (0.005) (0.004) (0.055) (0.054)
Reform x BE
0.009*** 0.004*** 0.014*** 0.010*** -0.028*** -0.041*** -0.269*** -0.284***
(0.001) (0.001) (0.001) (0.001) (0.001) (0.001) (0.039) (0.039)
Size 0.032*** 0.022*** 0.076*** 0.092***
(0.001) (0.001) (0.002) (0.008)
Leverage -0.045*** -0.032*** -0.112*** -0.135*
(0.003) (0.002) (0.006) (0.070)
Constant 0.055*** -0.165*** 0.043*** -0.112*** 0.135*** -0.393*** -0.632*** -1.411***
(0.003) (0.009) (0.003) (0.007) (0.007) (0.015) (0.243) (0.226)
Observations 749,550 749,550 749,550 749,550 749,550 749,550 29,404 29,404
Adj. R2 0.041 0.076 0.033 0.063 0.088 0.147 0.041 0.078
Industry FE Yes Yes Yes Yes Yes Yes Yes Yes
Panel B: Balanced Panel Belgian and German Firms – Domestic Firms and MNEs
ln(Patent Applications) ln(Patent Grants) ln(Patent Stock) Patent Quality
(1)
Domestic
(2)
MNEs (3)
Domestic
(4)
MNEs (5)
Domestic
(6)
MNEs
(7)
Domestic
(8)
MNEs
Reform -0.013*** -0.063*** -0.016*** -0.069*** 0.012*** 0.028*** -0.031*** -0.061*
(0.001) (0.010) (0.001) (0.008) (0.001) (0.009) (0.008) (0.036)
BE -0.025*** -0.189*** -0.021*** -0.146*** -0.073*** -0.490*** -0.147** -0.097
(0.002) (0.019) (0.001) (0.015) (0.004) (0.035) (0.058) (0.104)
Reform x BE 0.002* 0.032*** 0.008*** 0.042*** -0.038*** -0.071*** -0.297*** -0.252***
(0.001) (0.011) (0.001) (0.008) (0.001) (0.010) (0.045) (0.076)
Size 0.029*** 0.065*** 0.021*** 0.047*** 0.070*** 0.150*** 0.095*** 0.044
(0.001) (0.007) (0.001) (0.006) (0.002) (0.013) (0.008) (0.036)
Leverage -0.038*** -0.139*** -0.028*** -0.081*** -0.093*** -0.380*** -0.064 -0.518
(0.003) (0.031) (0.002) (0.023) (0.006) (0.063) (0.054) (0.321)
Constant -0.158*** -0.266*** -0.108*** -0.192*** -0.370*** -0.553*** -1.480*** -0.016
(0.009) (0.084) (0.007) (0.062) (0.016) (0.195) (0.221) (0.962)
Observations 721,360 28,190 721,360 28,190 721,360 28,190 24,160 5,244
Adj. R2 0.069 0.113 0.057 0.095 0.133 0.220 0.103 0.097
Controls Yes Yes Yes Yes Yes Yes Yes Yes
Industry FE Yes Yes Yes Yes Yes Yes Yes Yes
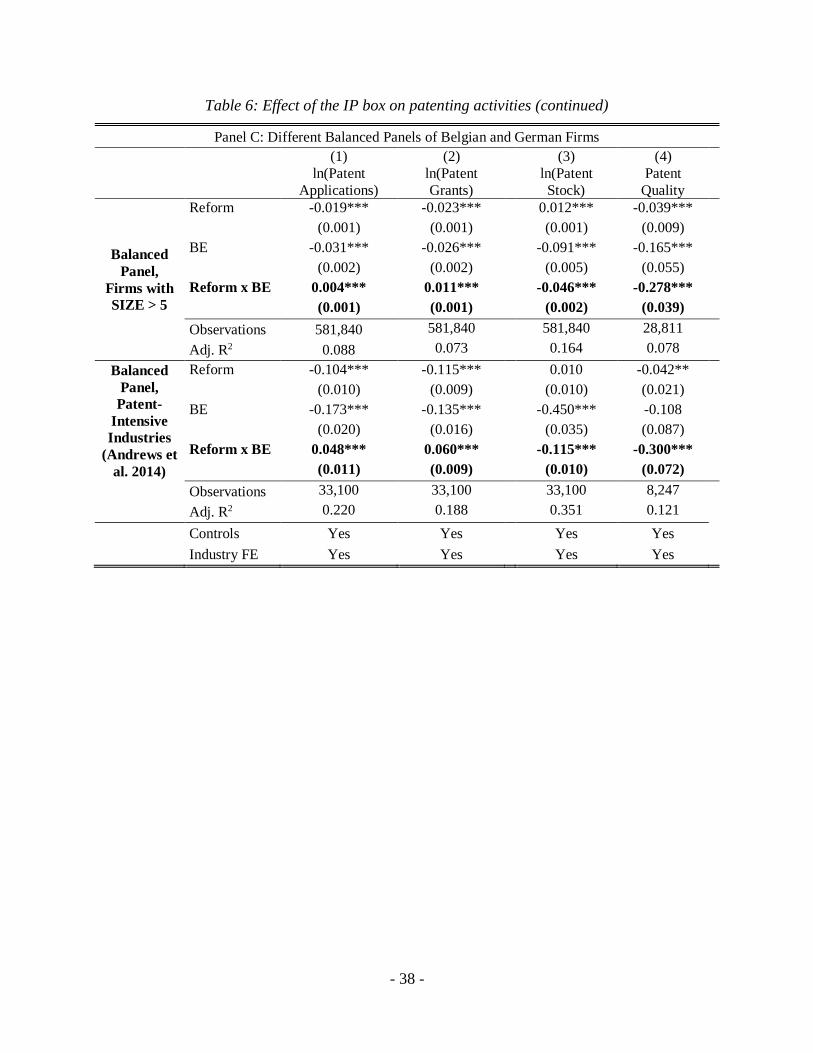
- 38 -
Table 6: Effect of the IP box on patenting activities (continued)
Panel C: Different Balanced Panels of Belgian and German Firms
(1)
ln(Patent
Applications)
(2)
ln(Patent
Grants)
(3)
ln(Patent
Stock)
(4)
Patent
Quality
Balanced
Panel,
Firms with
SIZE > 5
Reform -0.019*** -0.023*** 0.012*** -0.039***
(0.001) (0.001) (0.001) (0.009)
BE -0.031*** -0.026*** -0.091*** -0.165***
(0.002) (0.002) (0.005) (0.055)
Reform x BE 0.004*** 0.011*** -0.046*** -0.278***
(0.001) (0.001) (0.002) (0.039)
Observations 581,840 581,840 581,840 28,811
Adj. R2 0.088 0.073 0.164 0.078
Balanced
Panel,
Patent-
Intensive
Industries
(Andrews et
al. 2014)
Reform -0.104*** -0.115*** 0.010 -0.042**
(0.010) (0.009) (0.010) (0.021)
BE -0.173*** -0.135*** -0.450*** -0.108
(0.020) (0.016) (0.035) (0.087)
Reform x BE 0.048*** 0.060*** -0.115*** -0.300***
(0.011) (0.009) (0.010) (0.072)
Observations 33,100 33,100 33,100 8,247
Adj. R2 0.220 0.188 0.351 0.121
Controls Yes Yes Yes Yes
Industry FE Yes Yes Yes Yes
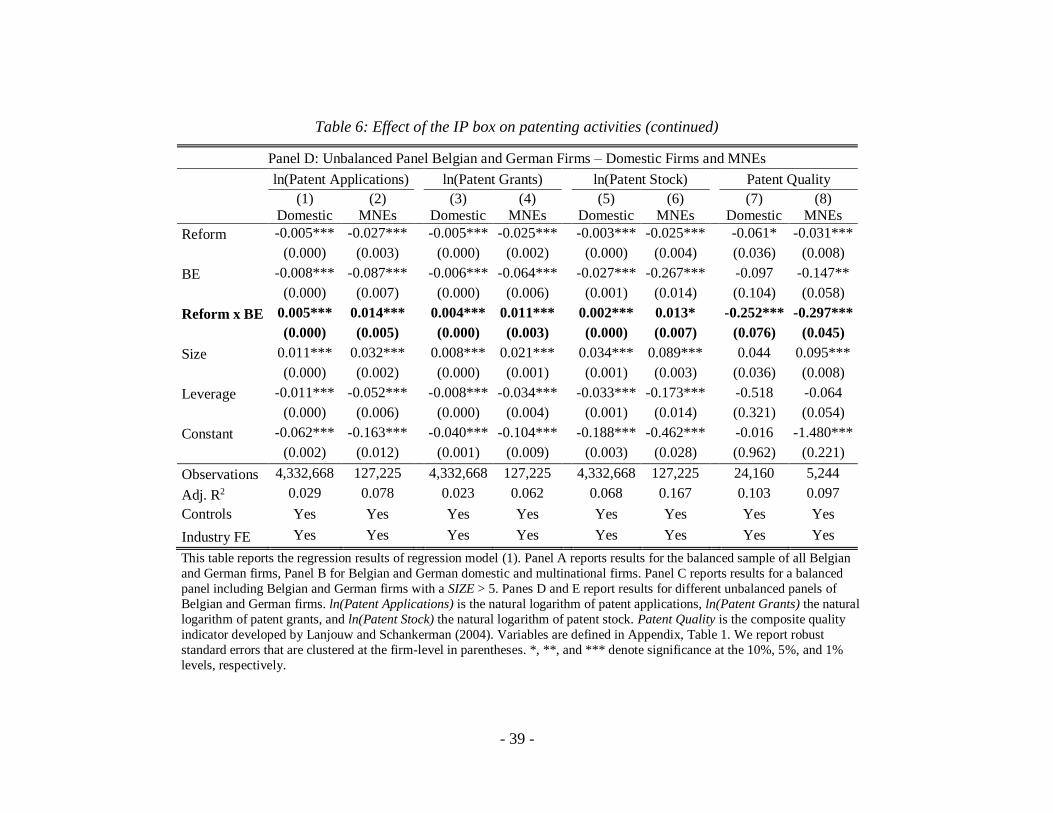
- 39 -
Table 6: Effect of the IP box on patenting activities (continued)
Panel D: Unbalanced Panel Belgian and German Firms – Domestic Firms and MNEs
ln(Patent Applications) ln(Patent Grants) ln(Patent Stock) Patent Quality
(1)
Domestic
(2)
MNEs (3)
Domestic
(4)
MNEs (5)
Domestic
(6)
MNEs
(7)
Domestic
(8)
MNEs
Reform -0.005*** -0.027*** -0.005*** -0.025*** -0.003*** -0.025*** -0.061* -0.031***
(0.000) (0.003) (0.000) (0.002) (0.000) (0.004) (0.036) (0.008)
BE -0.008*** -0.087*** -0.006*** -0.064*** -0.027*** -0.267*** -0.097 -0.147**
(0.000) (0.007) (0.000) (0.006) (0.001) (0.014) (0.104) (0.058)
Reform x BE 0.005*** 0.014*** 0.004*** 0.011*** 0.002*** 0.013* -0.252*** -0.297***
(0.000) (0.005) (0.000) (0.003) (0.000) (0.007) (0.076) (0.045)
Size 0.011*** 0.032*** 0.008*** 0.021*** 0.034*** 0.089*** 0.044 0.095***
(0.000) (0.002) (0.000) (0.001) (0.001) (0.003) (0.036) (0.008)
Leverage -0.011*** -0.052*** -0.008*** -0.034*** -0.033*** -0.173*** -0.518 -0.064
(0.000) (0.006) (0.000) (0.004) (0.001) (0.014) (0.321) (0.054)
Constant -0.062*** -0.163*** -0.040*** -0.104*** -0.188*** -0.462*** -0.016 -1.480***
(0.002) (0.012) (0.001) (0.009) (0.003) (0.028) (0.962) (0.221)
Observations 4,332,668 127,225 4,332,668 127,225 4,332,668 127,225 24,160 5,244
Adj. R2 0.029 0.078 0.023 0.062 0.068 0.167 0.103 0.097
Controls Yes Yes Yes Yes Yes Yes Yes Yes
Industry FE Yes Yes Yes Yes Yes Yes Yes Yes
This table reports the regression results of regression model (1). Panel A reports results for the balanced sample of all Belgian
and German firms, Panel B for Belgian and German domestic and multinational firms. Panel C reports results for a balanced
panel including Belgian and German firms with a SIZE > 5. Panes D and E report results for different unbalanced panels of
Belgian and German firms. ln(Patent Applications) is the natural logarithm of patent applications, ln(Patent Grants) the natural
logarithm of patent grants, and ln(Patent Stock) the natural logarithm of patent stock. Patent Quality is the composite quality
indicator developed by Lanjouw and Schankerman (2004). Variables are defined in Appendix, Table 1. We report robust
standard errors that are clustered at the firm-level in parentheses. *, **, and *** denote significance at the 10%, 5%, and 1%
levels, respectively.
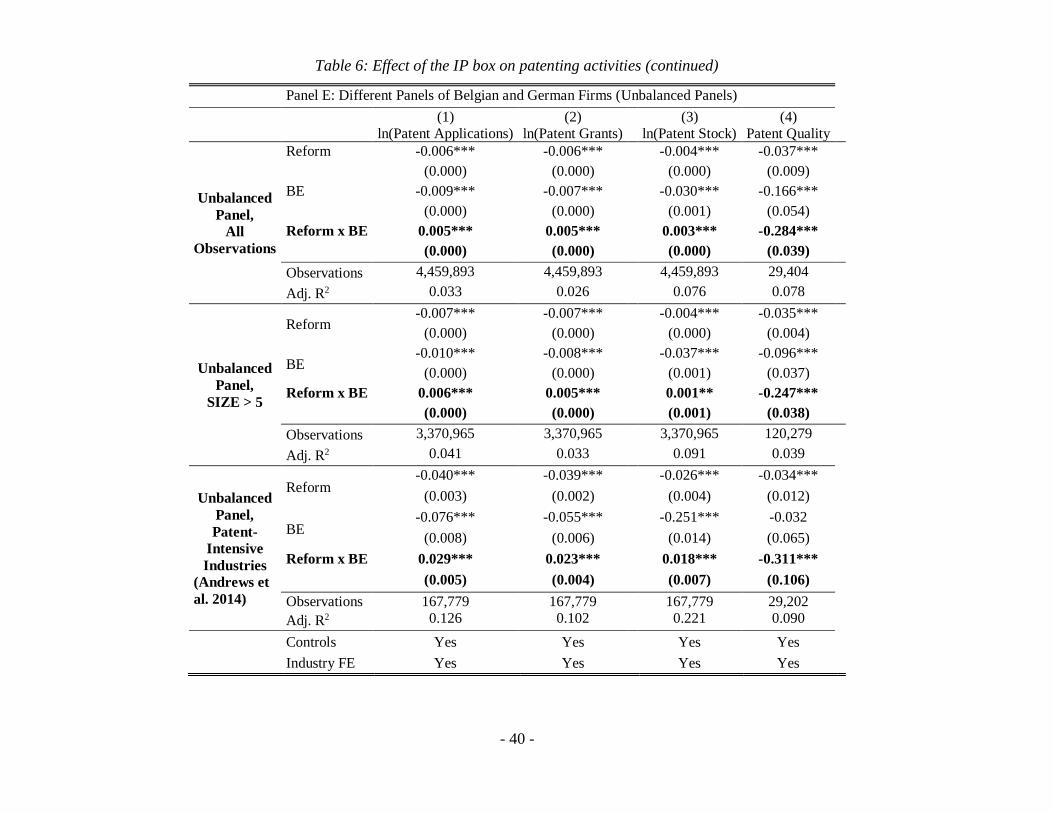
- 40 -
Table 6: Effect of the IP box on patenting activities (continued)
Panel E: Different Panels of Belgian and German Firms (Unbalanced Panels)
(1)
ln(Patent Applications)
(2)
ln(Patent Grants) (3)
ln(Patent Stock)
(4)
Patent Quality
Unbalanced
Panel,
All
Observations
Reform -0.006*** -0.006*** -0.004*** -0.037***
(0.000) (0.000) (0.000) (0.009)
BE -0.009*** -0.007*** -0.030*** -0.166***
(0.000) (0.000) (0.001) (0.054)
Reform x BE 0.005*** 0.005*** 0.003*** -0.284***
(0.000) (0.000) (0.000) (0.039)
Observations 4,459,893 4,459,893 4,459,893 29,404
Adj. R2 0.033 0.026 0.076 0.078
Unbalanced
Panel,
SIZE > 5
Reform -0.007*** -0.007*** -0.004*** -0.035***
(0.000) (0.000) (0.000) (0.004)
BE -0.010*** -0.008*** -0.037*** -0.096***
(0.000) (0.000) (0.001) (0.037)
Reform x BE 0.006*** 0.005*** 0.001** -0.247***
(0.000) (0.000) (0.001) (0.038)
Observations 3,370,965 3,370,965 3,370,965 120,279
Adj. R2 0.041 0.033 0.091 0.039
Unbalanced
Panel,
Patent-
Intensive
Industries
(Andrews et
al. 2014)
Reform -0.040*** -0.039*** -0.026*** -0.034***
(0.003) (0.002) (0.004) (0.012)
BE -0.076*** -0.055*** -0.251*** -0.032
(0.008) (0.006) (0.014) (0.065)
Reform x BE 0.029*** 0.023*** 0.018*** -0.311***
(0.005) (0.004) (0.007) (0.106)
Observations 167,779 167,779 167,779 29,202
Adj. R2 0.126 0.102 0.221 0.090
Controls Yes Yes Yes Yes
Industry FE Yes Yes Yes Yes
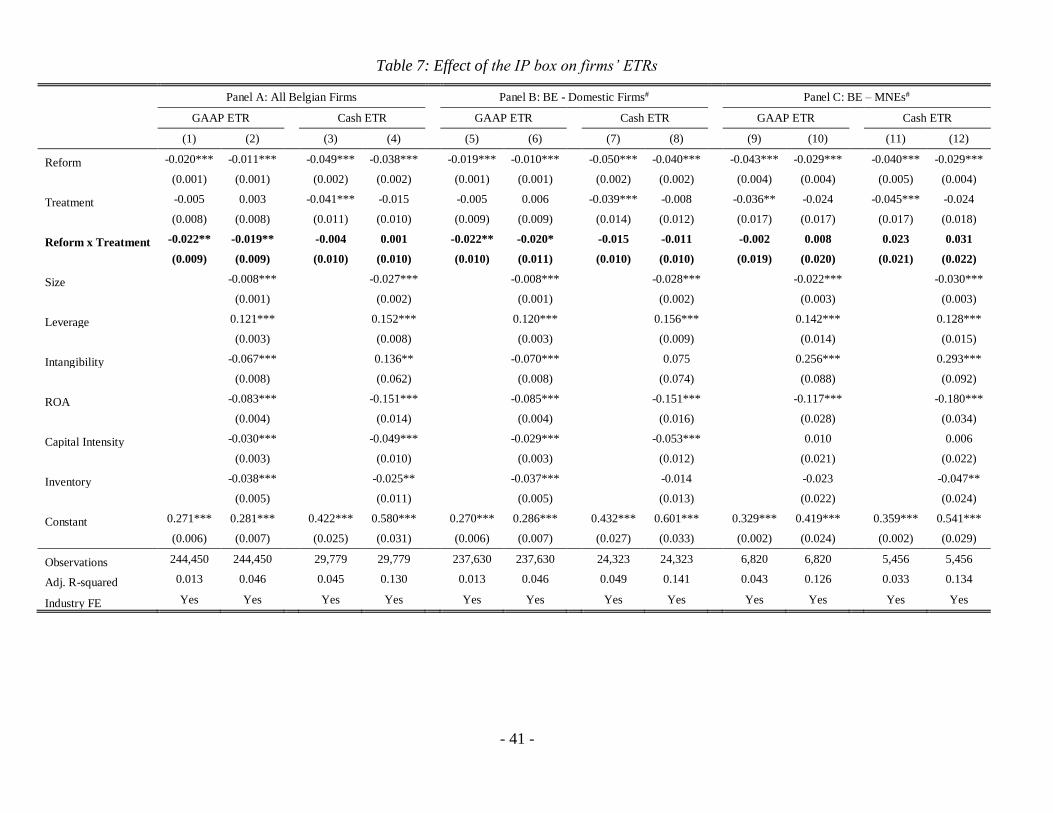
- 41 -
Table 7: Effect of the IP box on firms’ ETRs
Panel A: All Belgian Firms Panel B: BE - Domestic Firms# Panel C: BE – MNEs#
GAAP ETR Cash ETR GAAP ETR Cash ETR GAAP ETR Cash ETR
(1) (2) (3) (4) (5) (6) (7) (8) (9) (10) (11) (12)
Reform -0.020*** -0.011*** -0.049*** -0.038*** -0.019*** -0.010*** -0.050*** -0.040*** -0.043*** -0.029*** -0.040*** -0.029***
(0.001) (0.001) (0.002) (0.002) (0.001) (0.001) (0.002) (0.002) (0.004) (0.004) (0.005) (0.004)
Treatment -0.005 0.003 -0.041*** -0.015 -0.005 0.006 -0.039*** -0.008 -0.036** -0.024 -0.045*** -0.024
(0.008) (0.008) (0.011) (0.010) (0.009) (0.009) (0.014) (0.012) (0.017) (0.017) (0.017) (0.018)
Reform x Treatment -0.022** -0.019** -0.004 0.001 -0.022** -0.020* -0.015 -0.011 -0.002 0.008 0.023 0.031
(0.009) (0.009) (0.010) (0.010) (0.010) (0.011) (0.010) (0.010) (0.019) (0.020) (0.021) (0.022)
Size -0.008*** -0.027*** -0.008*** -0.028*** -0.022*** -0.030***
(0.001) (0.002) (0.001) (0.002) (0.003) (0.003)
Leverage 0.121*** 0.152*** 0.120*** 0.156*** 0.142*** 0.128***
(0.003) (0.008) (0.003) (0.009) (0.014) (0.015)
Intangibility -0.067*** 0.136** -0.070*** 0.075 0.256*** 0.293***
(0.008) (0.062) (0.008) (0.074) (0.088) (0.092)
ROA -0.083*** -0.151*** -0.085*** -0.151*** -0.117*** -0.180***
(0.004) (0.014) (0.004) (0.016) (0.028) (0.034)
Capital Intensity -0.030*** -0.049*** -0.029*** -0.053*** 0.010 0.006
(0.003) (0.010) (0.003) (0.012) (0.021) (0.022)
Inventory -0.038*** -0.025** -0.037*** -0.014 -0.023 -0.047**
(0.005) (0.011) (0.005) (0.013) (0.022) (0.024)
Constant 0.271*** 0.281*** 0.422*** 0.580*** 0.270*** 0.286*** 0.432*** 0.601*** 0.329*** 0.419*** 0.359*** 0.541***
(0.006) (0.007) (0.025) (0.031) (0.006) (0.007) (0.027) (0.033) (0.002) (0.024) (0.002) (0.029)
Observations 244,450 244,450 29,779 29,779 237,630 237,630 24,323 24,323 6,820 6,820 5,456 5,456
Adj. R-squared 0.013 0.046 0.045 0.130 0.013 0.046 0.049 0.141 0.043 0.126 0.033 0.134
Industry FE Yes Yes Yes Yes Yes Yes Yes Yes Yes Yes Yes Yes
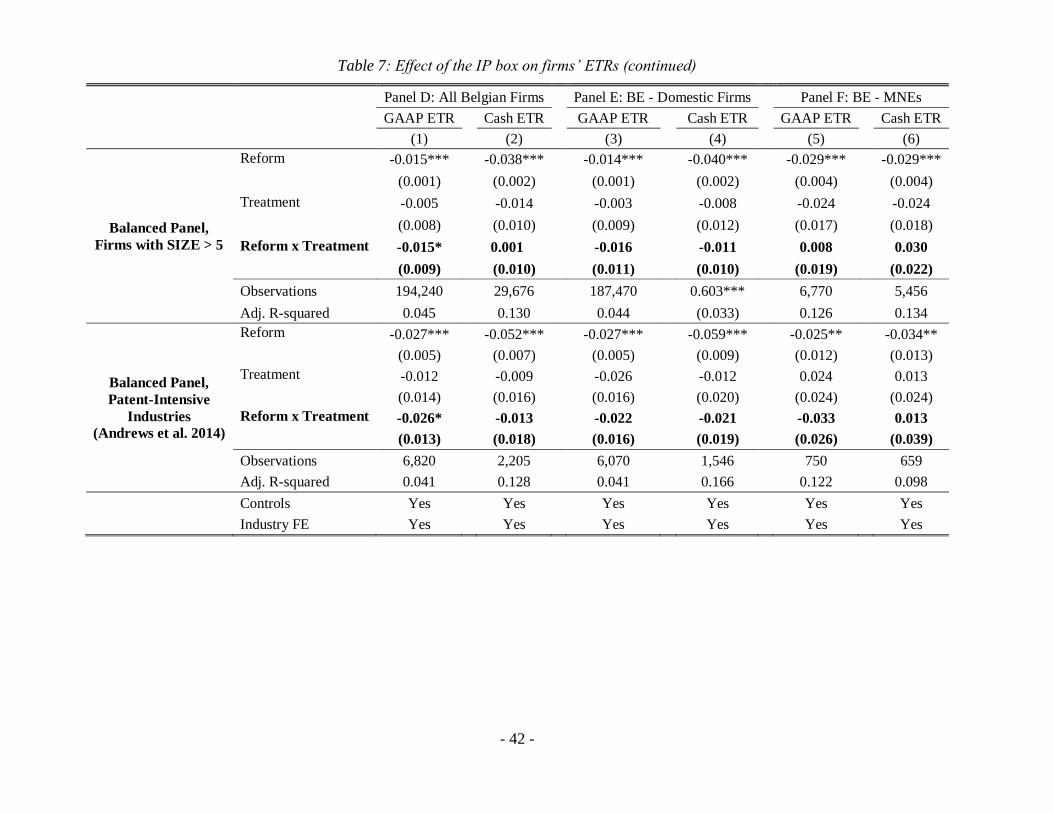
- 42 -
Table 7: Effect of the IP box on firms’ ETRs (continued)
Panel D: All Belgian Firms Panel E: BE - Domestic Firms Panel F: BE - MNEs
GAAP ETR Cash ETR GAAP ETR Cash ETR GAAP ETR Cash ETR
(1) (2) (3) (4) (5) (6)
Balanced Panel,
Firms with SIZE > 5
Reform -0.015*** -0.038*** -0.014*** -0.040*** -0.029*** -0.029***
(0.001) (0.002) (0.001) (0.002) (0.004) (0.004)
Treatment -0.005 -0.014 -0.003 -0.008 -0.024 -0.024
(0.008) (0.010) (0.009) (0.012) (0.017) (0.018)
Reform x Treatment -0.015* 0.001 -0.016 -0.011 0.008 0.030
(0.009) (0.010) (0.011) (0.010) (0.019) (0.022)
Observations 194,240 29,676 187,470 0.603*** 6,770 5,456
Adj. R-squared 0.045 0.130 0.044 (0.033) 0.126 0.134
Balanced Panel,
Patent-Intensive
Industries
(Andrews et al. 2014)
Reform -0.027*** -0.052*** -0.027*** -0.059*** -0.025** -0.034**
(0.005) (0.007) (0.005) (0.009) (0.012) (0.013)
Treatment -0.012 -0.009 -0.026 -0.012 0.024 0.013
(0.014) (0.016) (0.016) (0.020) (0.024) (0.024)
Reform x Treatment -0.026* -0.013 -0.022 -0.021 -0.033 0.013
(0.013) (0.018) (0.016) (0.019) (0.026) (0.039)
Observations 6,820 2,205 6,070 1,546 750 659
Adj. R-squared 0.041 0.128 0.041 0.166 0.122 0.098
Controls Yes Yes Yes Yes Yes Yes Industry FE Yes Yes Yes Yes Yes Yes
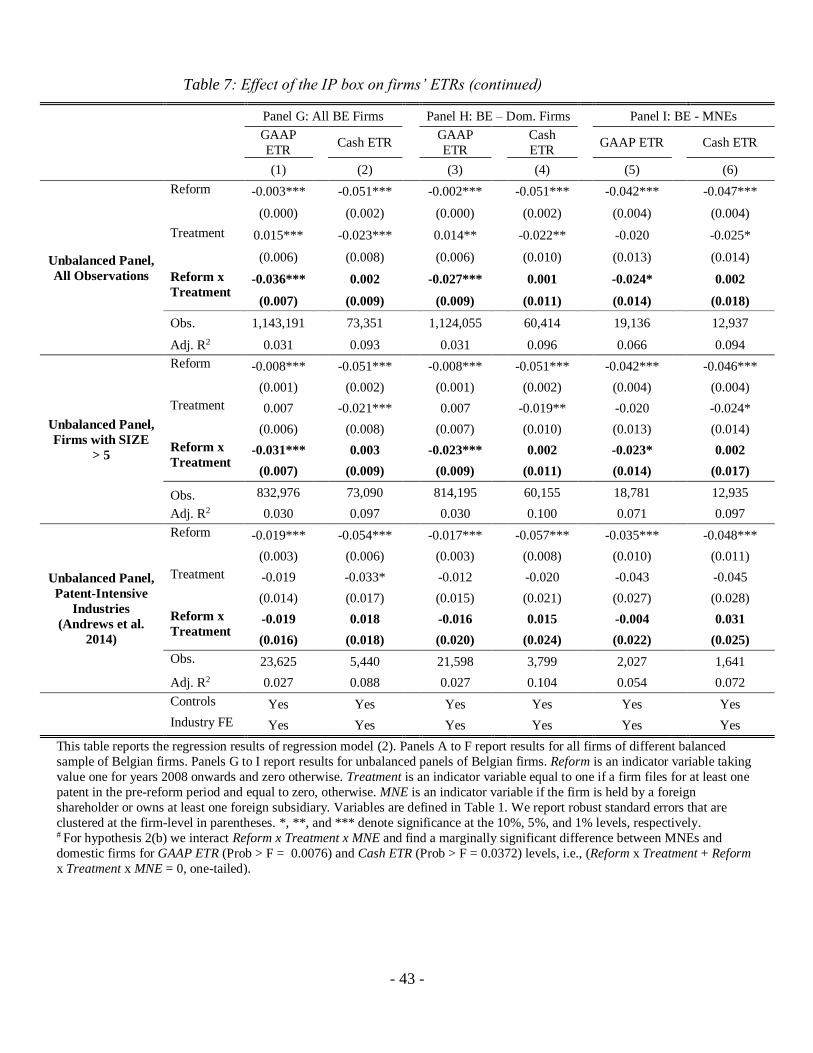
- 43 -
Table 7: Effect of the IP box on firms’ ETRs (continued)
Panel G: All BE Firms Panel H: BE – Dom. Firms Panel I: BE - MNEs
GAAP
ETR Cash ETR GAAP
ETR Cash
ETR GAAP ETR Cash ETR
(1) (2) (3) (4) (5) (6)
Unbalanced Panel,
All Observations
Reform -0.003*** -0.051*** -0.002*** -0.051*** -0.042*** -0.047***
(0.000) (0.002) (0.000) (0.002) (0.004) (0.004)
Treatment 0.015*** -0.023*** 0.014** -0.022** -0.020 -0.025*
(0.006) (0.008) (0.006) (0.010) (0.013) (0.014)
Reform x
Treatment -0.036*** 0.002 -0.027*** 0.001 -0.024* 0.002
(0.007) (0.009) (0.009) (0.011) (0.014) (0.018)
Obs. 1,143,191 73,351 1,124,055 60,414 19,136 12,937
Adj. R2 0.031 0.093 0.031 0.096 0.066 0.094
Unbalanced Panel,
Firms with SIZE
> 5
Reform -0.008*** -0.051*** -0.008*** -0.051*** -0.042*** -0.046***
(0.001) (0.002) (0.001) (0.002) (0.004) (0.004)
Treatment 0.007 -0.021*** 0.007 -0.019** -0.020 -0.024*
(0.006) (0.008) (0.007) (0.010) (0.013) (0.014)
Reform x
Treatment -0.031*** 0.003 -0.023*** 0.002 -0.023* 0.002
(0.007) (0.009) (0.009) (0.011) (0.014) (0.017)
Obs. 832,976 73,090 814,195 60,155 18,781 12,935
Adj. R2 0.030 0.097 0.030 0.100 0.071 0.097
Unbalanced Panel,
Patent-Intensive
Industries
(Andrews et al.
2014)
Reform -0.019*** -0.054*** -0.017*** -0.057*** -0.035*** -0.048***
(0.003) (0.006) (0.003) (0.008) (0.010) (0.011)
Treatment -0.019 -0.033* -0.012 -0.020 -0.043 -0.045
(0.014) (0.017) (0.015) (0.021) (0.027) (0.028)
Reform x
Treatment -0.019 0.018 -0.016 0.015 -0.004 0.031
(0.016) (0.018) (0.020) (0.024) (0.022) (0.025)
Obs. 23,625 5,440 21,598 3,799 2,027 1,641
Adj. R2 0.027 0.088 0.027 0.104 0.054 0.072
Controls Yes Yes Yes Yes Yes Yes
Industry FE Yes Yes Yes Yes Yes Yes
This table reports the regression results of regression model (2). Panels A to F report results for all firms of different balanced
sample of Belgian firms. Panels G to I report results for unbalanced panels of Belgian firms. Reform is an indicator variable taking
value one for years 2008 onwards and zero otherwise. Treatment is an indicator variable equal to one if a firm files for at least one
patent in the pre-reform period and equal to zero, otherwise. MNE is an indicator variable if the firm is held by a foreign
shareholder or owns at least one foreign subsidiary. Variables are defined in Table 1. We report robust standard errors that are
clustered at the firm-level in parentheses. *, **, and *** denote significance at the 10%, 5%, and 1% levels, respectively. # For hypothesis 2(b) we interact Reform x Treatment x MNE and find a marginally significant difference between MNEs and
domestic firms for GAAP ETR (Prob > F = 0.0076) and Cash ETR (Prob > F = 0.0372) levels, i.e., (Reform x Treatment + Reform
x Treatment x MNE = 0, one-tailed).
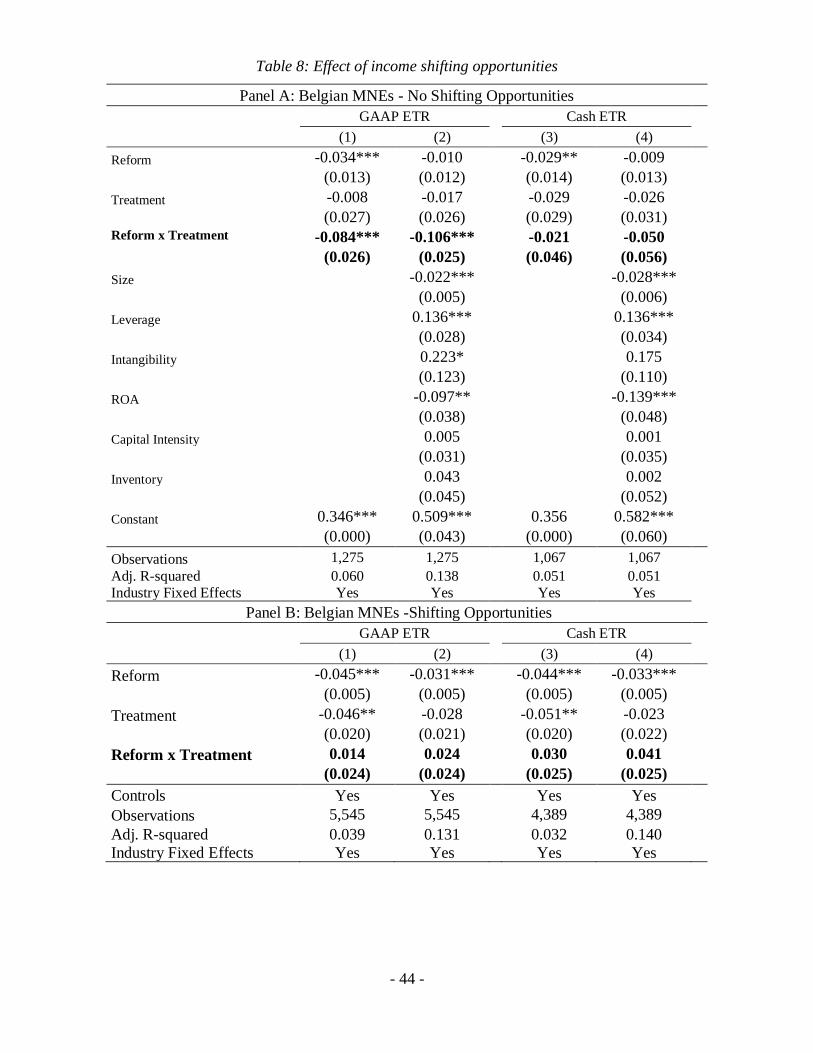
- 44 -
Table 8: Effect of income shifting opportunities
Panel A: Belgian MNEs - No Shifting Opportunities
GAAP ETR Cash ETR
(1) (2) (3) (4)
Reform -0.034*** -0.010 -0.029** -0.009
(0.013) (0.012) (0.014) (0.013)
Treatment -0.008 -0.017 -0.029 -0.026
(0.027) (0.026) (0.029) (0.031)
Reform x Treatment -0.084*** -0.106*** -0.021 -0.050
(0.026) (0.025) (0.046) (0.056)
Size -0.022*** -0.028***
(0.005) (0.006)
Leverage 0.136*** 0.136***
(0.028) (0.034)
Intangibility 0.223* 0.175
(0.123) (0.110)
ROA -0.097** -0.139***
(0.038) (0.048)
Capital Intensity 0.005 0.001
(0.031) (0.035)
Inventory 0.043 0.002
(0.045) (0.052)
Constant 0.346*** 0.509*** 0.356 0.582***
(0.000) (0.043) (0.000) (0.060)
Observations 1,275 1,275 1,067 1,067
Adj. R-squared 0.060 0.138 0.051 0.051
Industry Fixed Effects Yes Yes Yes Yes
Panel B: Belgian MNEs -Shifting Opportunities
GAAP ETR Cash ETR
(1) (2) (3) (4)
Reform -0.045*** -0.031*** -0.044*** -0.033***
(0.005) (0.005) (0.005) (0.005)
Treatment -0.046** -0.028 -0.051** -0.023
(0.020) (0.021) (0.020) (0.022)
Reform x Treatment 0.014 0.024 0.030 0.041
(0.024) (0.024) (0.025) (0.025)
Controls Yes Yes Yes Yes
Observations 5,545 5,545 4,389 4,389
Adj. R-squared 0.039 0.131 0.032 0.140
Industry Fixed Effects Yes Yes Yes Yes
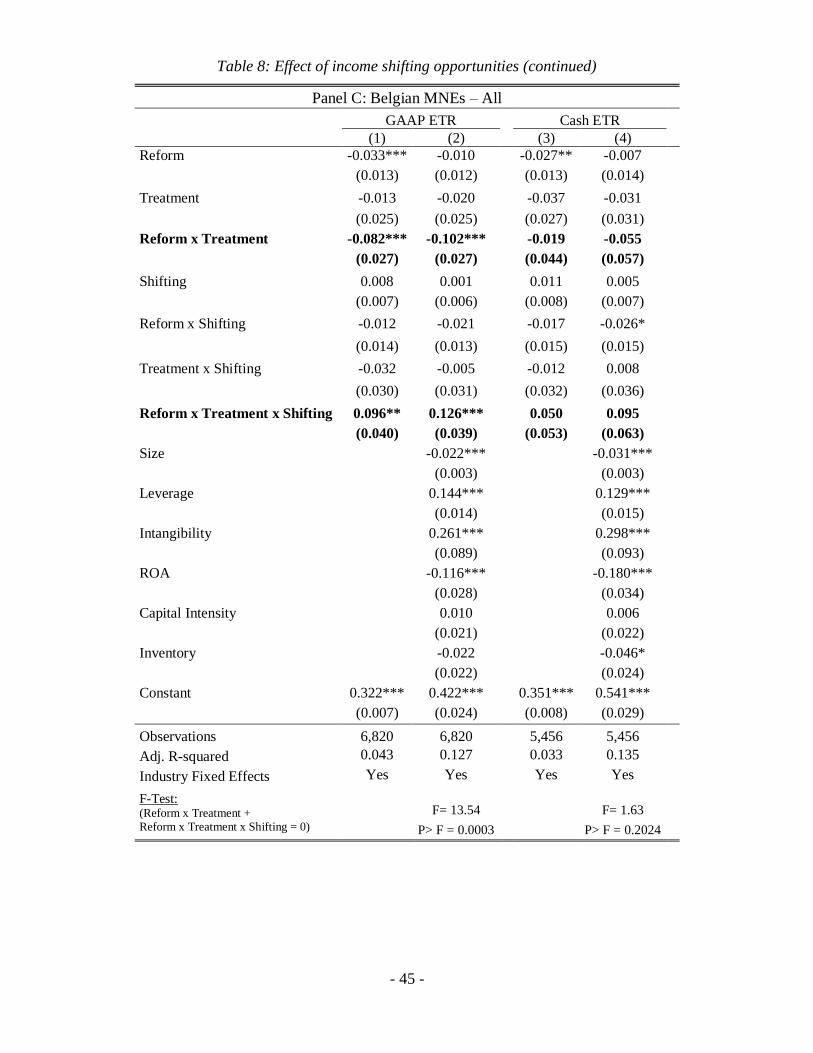
- 45 -
Table 8: Effect of income shifting opportunities (continued)
Panel C: Belgian MNEs – All
GAAP ETR Cash ETR (1) (2) (3) (4)
Reform -0.033*** -0.010 -0.027** -0.007
(0.013) (0.012) (0.013) (0.014)
Treatment -0.013 -0.020 -0.037 -0.031
(0.025) (0.025) (0.027) (0.031)
Reform x Treatment -0.082*** -0.102*** -0.019 -0.055
(0.027) (0.027) (0.044) (0.057)
Shifting 0.008 0.001 0.011 0.005
(0.007) (0.006) (0.008) (0.007)
Reform x Shifting -0.012 -0.021 -0.017 -0.026*
(0.014) (0.013) (0.015) (0.015)
Treatment x Shifting -0.032 -0.005 -0.012 0.008
(0.030) (0.031) (0.032) (0.036)
Reform x Treatment x Shifting 0.096** 0.126*** 0.050 0.095
(0.040) (0.039) (0.053) (0.063)
Size -0.022*** -0.031***
(0.003) (0.003)
Leverage 0.144*** 0.129***
(0.014) (0.015)
Intangibility 0.261*** 0.298***
(0.089) (0.093)
ROA -0.116*** -0.180***
(0.028) (0.034)
Capital Intensity 0.010 0.006
(0.021) (0.022)
Inventory -0.022 -0.046*
(0.022) (0.024)
Constant 0.322*** 0.422*** 0.351*** 0.541***
(0.007) (0.024) (0.008) (0.029)
Observations 6,820 6,820 5,456 5,456
Adj. R-squared 0.043 0.127 0.033 0.135
Industry Fixed Effects Yes Yes Yes Yes
F-Test: (Reform x Treatment +
Reform x Treatment x Shifting = 0)
F= 13.54 F= 1.63
P> F = 0.0003 P> F = 0.2024
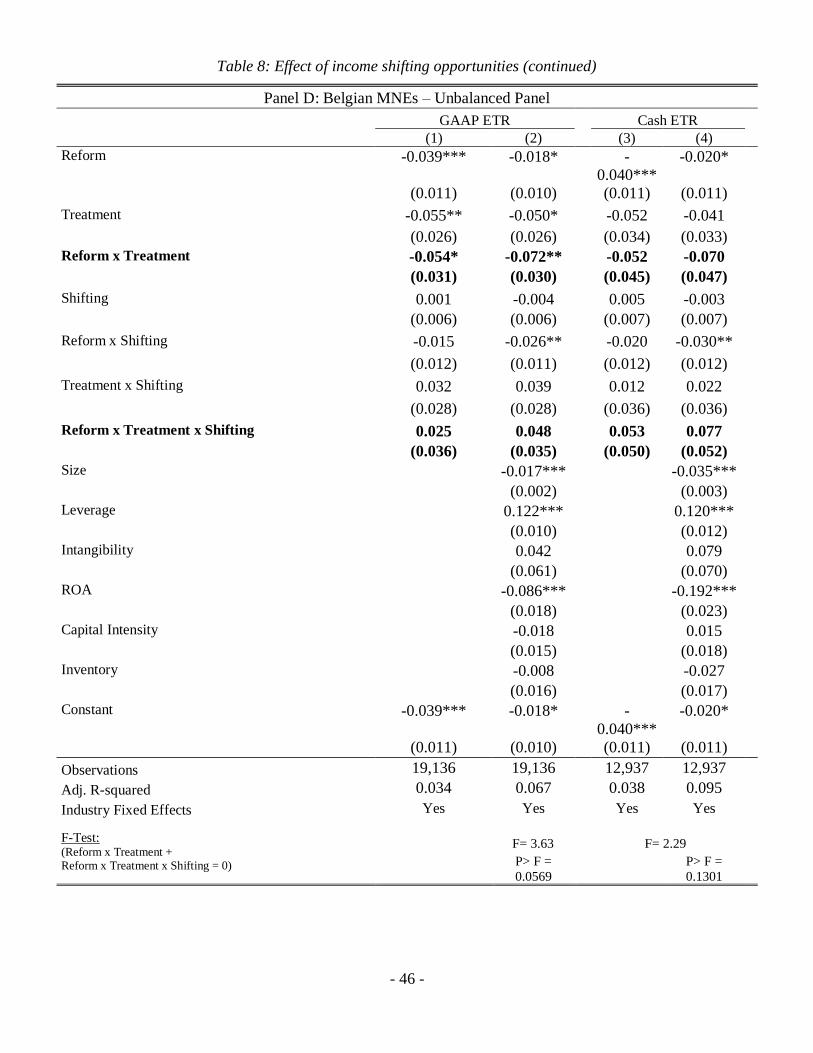
- 46 -
Table 8: Effect of income shifting opportunities (continued)
Panel D: Belgian MNEs – Unbalanced Panel
GAAP ETR Cash ETR (1) (2) (3) (4)
Reform -0.039*** -0.018* -
0.040***
-0.020*
(0.011) (0.010) (0.011) (0.011)
Treatment -0.055** -0.050* -0.052 -0.041
(0.026) (0.026) (0.034) (0.033)
Reform x Treatment -0.054* -0.072** -0.052 -0.070
(0.031) (0.030) (0.045) (0.047)
Shifting 0.001 -0.004 0.005 -0.003
(0.006) (0.006) (0.007) (0.007)
Reform x Shifting -0.015 -0.026** -0.020 -0.030**
(0.012) (0.011) (0.012) (0.012)
Treatment x Shifting 0.032 0.039 0.012 0.022
(0.028) (0.028) (0.036) (0.036)
Reform x Treatment x Shifting 0.025 0.048 0.053 0.077
(0.036) (0.035) (0.050) (0.052)
Size -0.017*** -0.035***
(0.002) (0.003)
Leverage 0.122*** 0.120***
(0.010) (0.012)
Intangibility 0.042 0.079
(0.061) (0.070)
ROA -0.086*** -0.192***
(0.018) (0.023)
Capital Intensity -0.018 0.015
(0.015) (0.018)
Inventory -0.008 -0.027
(0.016) (0.017)
Constant -0.039*** -0.018*
-
0.040***
-0.020*
(0.011) (0.010) (0.011) (0.011)
Observations 19,136 19,136 12,937 12,937
Adj. R-squared 0.034 0.067 0.038 0.095
Industry Fixed Effects Yes Yes Yes Yes
F-Test: (Reform x Treatment +
Reform x Treatment x Shifting = 0)
F= 3.63 F= 2.29
P> F =
0.0569
P> F =
0.1301
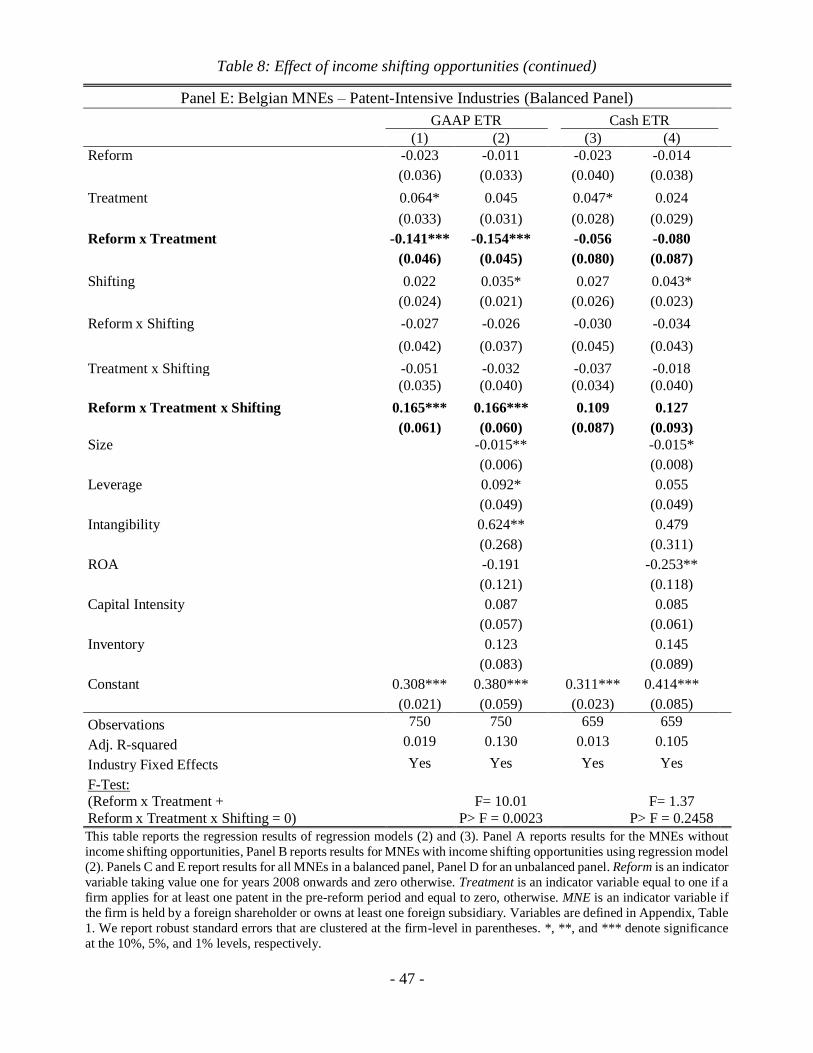
- 47 -
Table 8: Effect of income shifting opportunities (continued)
Panel E: Belgian MNEs – Patent-Intensive Industries (Balanced Panel)
GAAP ETR Cash ETR (1) (2) (3) (4)
Reform -0.023 -0.011 -0.023 -0.014
(0.036) (0.033) (0.040) (0.038)
Treatment 0.064* 0.045 0.047* 0.024
(0.033) (0.031) (0.028) (0.029)
Reform x Treatment -0.141*** -0.154*** -0.056 -0.080
(0.046) (0.045) (0.080) (0.087)
Shifting 0.022 0.035* 0.027 0.043*
(0.024) (0.021) (0.026) (0.023)
Reform x Shifting -0.027 -0.026 -0.030 -0.034
(0.042) (0.037) (0.045) (0.043)
Treatment x Shifting -0.051 -0.032 -0.037 -0.018
(0.035) (0.040) (0.034) (0.040)
Reform x Treatment x Shifting 0.165*** 0.166*** 0.109 0.127
(0.061) (0.060) (0.087) (0.093)
Size -0.015** -0.015*
(0.006) (0.008)
Leverage 0.092* 0.055
(0.049) (0.049)
Intangibility 0.624** 0.479
(0.268) (0.311)
ROA -0.191 -0.253**
(0.121) (0.118)
Capital Intensity 0.087 0.085
(0.057) (0.061)
Inventory 0.123 0.145
(0.083) (0.089)
Constant 0.308*** 0.380*** 0.311*** 0.414***
(0.021) (0.059) (0.023) (0.085)
Observations 750 750 659 659
Adj. R-squared 0.019 0.130 0.013 0.105
Industry Fixed Effects Yes Yes Yes Yes
F-Test:
(Reform x Treatment +
Reform x Treatment x Shifting = 0)
F= 10.01 F= 1.37
P> F = 0.0023 P> F = 0.2458
This table reports the regression results of regression models (2) and (3). Panel A reports results for the MNEs without
income shifting opportunities, Panel B reports results for MNEs with income shifting opportunities using regression model
(2). Panels C and E report results for all MNEs in a balanced panel, Panel D for an unbalanced panel. Reform is an indicator
variable taking value one for years 2008 onwards and zero otherwise. Treatment is an indicator variable equal to one if a
firm applies for at least one patent in the pre-reform period and equal to zero, otherwise. MNE is an indicator variable if
the firm is held by a foreign shareholder or owns at least one foreign subsidiary. Variables are defined in Appendix, Table
1. We report robust standard errors that are clustered at the firm-level in parentheses. *, **, and *** denote significance
at the 10%, 5%, and 1% levels, respectively.
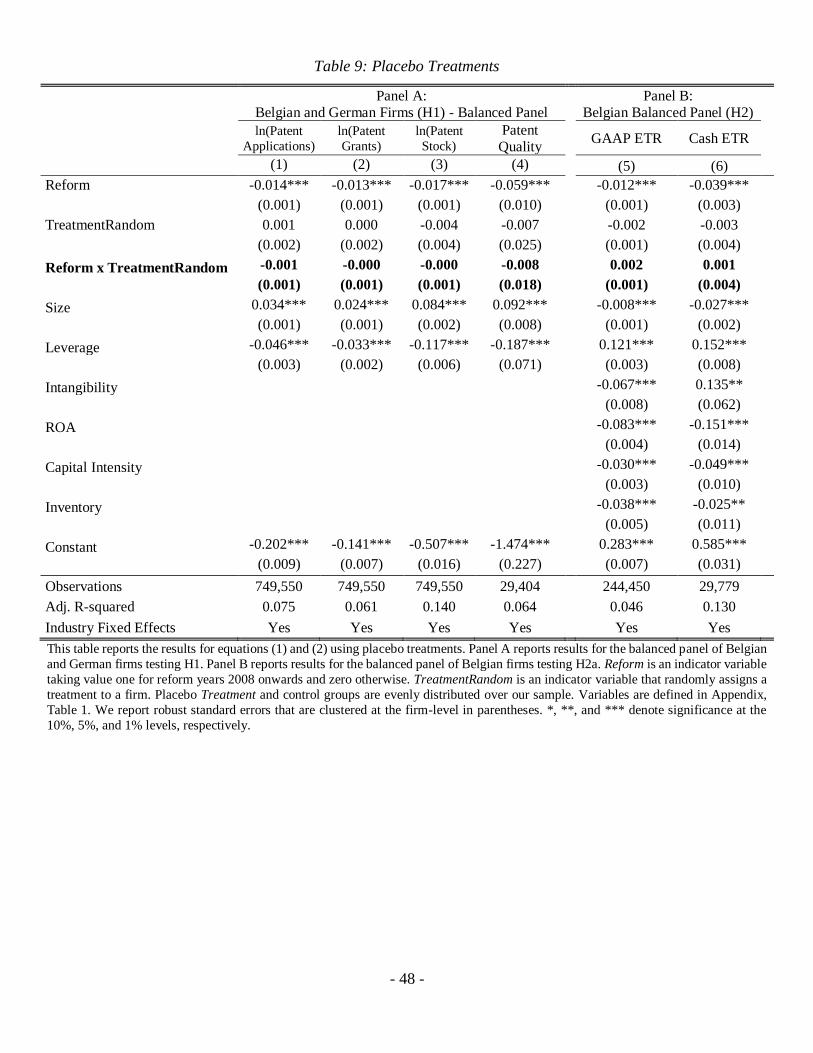
- 48 -
Table 9: Placebo Treatments
Panel A:
Belgian and German Firms (H1) - Balanced Panel
Panel B:
Belgian Balanced Panel (H2)
ln(Patent
Applications) ln(Patent
Grants) ln(Patent
Stock) Patent
Quality GAAP ETR Cash ETR
(1) (2) (3) (4) (5) (6)
Reform -0.014*** -0.013*** -0.017*** -0.059*** -0.012*** -0.039***
(0.001) (0.001) (0.001) (0.010) (0.001) (0.003)
TreatmentRandom 0.001 0.000 -0.004 -0.007 -0.002 -0.003
(0.002) (0.002) (0.004) (0.025) (0.001) (0.004)
Reform x TreatmentRandom -0.001 -0.000 -0.000 -0.008 0.002 0.001
(0.001) (0.001) (0.001) (0.018) (0.001) (0.004)
Size 0.034*** 0.024*** 0.084*** 0.092*** -0.008*** -0.027***
(0.001) (0.001) (0.002) (0.008) (0.001) (0.002)
Leverage -0.046*** -0.033*** -0.117*** -0.187*** 0.121*** 0.152***
(0.003) (0.002) (0.006) (0.071) (0.003) (0.008)
Intangibility -0.067*** 0.135**
(0.008) (0.062)
ROA -0.083*** -0.151***
(0.004) (0.014)
Capital Intensity -0.030*** -0.049***
(0.003) (0.010)
Inventory -0.038*** -0.025**
(0.005) (0.011)
Constant -0.202*** -0.141*** -0.507*** -1.474*** 0.283*** 0.585***
(0.009) (0.007) (0.016) (0.227) (0.007) (0.031)
Observations 749,550 749,550 749,550 29,404 244,450 29,779
Adj. R-squared 0.075 0.061 0.140 0.064 0.046 0.130
Industry Fixed Effects Yes Yes Yes Yes Yes Yes
This table reports the results for equations (1) and (2) using placebo treatments. Panel A reports results for the balanced panel of Belgian
and German firms testing H1. Panel B reports results for the balanced panel of Belgian firms testing H2a. Reform is an indicator variable
taking value one for reform years 2008 onwards and zero otherwise. TreatmentRandom is an indicator variable that randomly assigns a
treatment to a firm. Placebo Treatment and control groups are evenly distributed over our sample. Variables are defined in Appendix,
Table 1. We report robust standard errors that are clustered at the firm-level in parentheses. *, **, and *** denote significance at the
10%, 5%, and 1% levels, respectively.
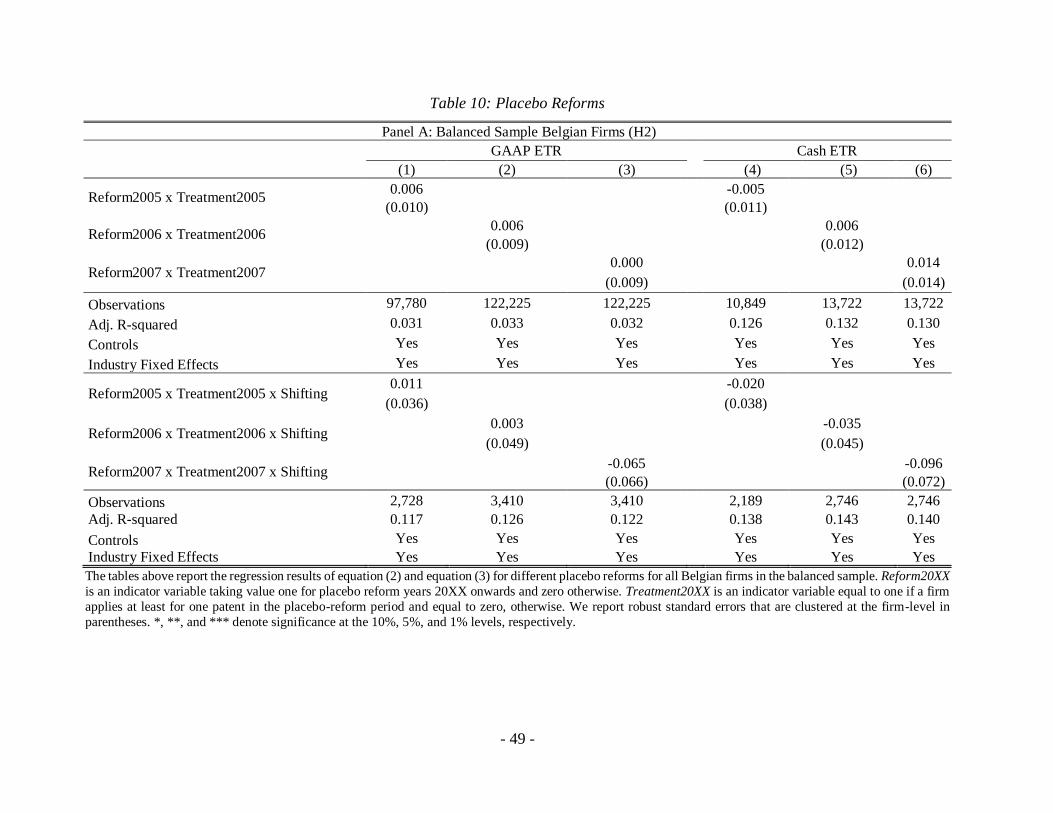
- 49 -
Table 10: Placebo Reforms
Panel A: Balanced Sample Belgian Firms (H2)
GAAP ETR Cash ETR
(1) (2) (3) (4) (5) (6)
Reform2005 x Treatment2005 0.006 -0.005
(0.010) (0.011)
Reform2006 x Treatment2006 0.006 0.006
(0.009) (0.012)
Reform2007 x Treatment2007 0.000 0.014
(0.009) (0.014)
Observations 97,780 122,225 122,225 10,849 13,722 13,722
Adj. R-squared 0.031 0.033 0.032 0.126 0.132 0.130
Controls Yes Yes Yes Yes Yes Yes
Industry Fixed Effects Yes Yes Yes Yes Yes Yes
Reform2005 x Treatment2005 x Shifting 0.011 -0.020
(0.036) (0.038)
Reform2006 x Treatment2006 x Shifting 0.003 -0.035
(0.049) (0.045)
Reform2007 x Treatment2007 x Shifting -0.065 -0.096
(0.066) (0.072)
Observations 2,728 3,410 3,410 2,189 2,746 2,746
Adj. R-squared 0.117 0.126 0.122 0.138 0.143 0.140
Controls Yes Yes Yes Yes Yes Yes
Industry Fixed Effects Yes Yes Yes Yes Yes Yes
The tables above report the regression results of equation (2) and equation (3) for different placebo reforms for all Belgian firms in the balanced sample. Reform20XX
is an indicator variable taking value one for placebo reform years 20XX onwards and zero otherwise. Treatment20XX is an indicator variable equal to one if a firm
applies at least for one patent in the placebo-reform period and equal to zero, otherwise. We report robust standard errors that are clustered at the firm-level in
parentheses. *, **, and *** denote significance at the 10%, 5%, and 1% levels, respectively.