Televizor Tesla Tesla ‚Minor 1956 Tesla Sonet duo Tesla Reno 1971 Tesla Monika 1965 Tesla Sonet duo.

www.cambridge.org© in this web service Cambridge University Press
Cambridge University Press978-0-521-19486-0 - Body MR Imaging at 3 TeslaEdited by Ihab R. Kamel and Elmar M. MerkleExcerptMore information
Chapter
1Body MR imaging at 3T: basic considerationsabout artifacts and safetyKevin J. Chang and Ihab R. Kamel
IntroductionThree Tesla magnetic resonance (MR) imaging scan-ners have been seeing steadily increasing use recentlyas hardware has matured and pulse sequences havebecome more optimized for a higher field strength.This increase in popularity has been more pro-nounced for neurologic and musculoskeletal imagingthan for body imaging, however, due to the fact that3T imaging with the larger field of view required forthe torso tends to be more susceptible to artifacts andenergy absorption limits than the imaging of smallerbody parts.
Imaging artifacts at 3T tend to be more numerousand/or more pronounced than at lower field strengths[1]. While most of these artifacts are the same onesencountered at lower field strengths (e.g., flow arti-facts, motion artifacts, Gibbs ringing), many are morepeculiar to high-field imaging. This chapter will dis-cuss these field strength-related artifacts at 3T as theyapply to body imaging with specific comparisonsmadeto 1.5T. The differences in relaxation times, chemicalshift effects, and issues related to field inhomogeneitywill also be discussed. Various approaches to mitigat-ing artifacts peculiar to an increase in field strength at3T will also be addressed.
Signal-to-noise ratioMR signal relates directly to the ratio of protonsaligned parallel rather than anti-parallel to the staticmagnetic field (B0). This ratio varies by the square ofthe magnetic field strength so a doubling of fieldstrength from 1.5T to 3T should result in a quadru-pling of MR signal. However, the doubling of fieldstrength is also accompanied by a doubling of noise.The net effect of these changes results in an overall
theoretical doubling of the signal-to-noise ratio (SNR).Thus, the theoretical SNR varies directly with theincrease in magnetic field strength. It is this promisedgain in SNR from an increase in field strength thatallows for a boost in spatial resolution, temporal reso-lution, or some combination of the two. An increasein SNR also promises to improve MR spectroscopyand diffusion-weighted imaging. In practice, however,moving from 1.5T to 3T usually results in a less thantwofold realized gain in SNR due to physiologic noiseand limitations in energy deposition as well as otherfactors such as inadequate optimization of scannerhardware and software, radiofrequency (RF) field(B1) inhomogeneity, and increased magnetic suscepti-bility effects.
T1 relaxation timesFor most physiologic tissues an increase in magneticfield strength leads to a prolongation of T1 relaxationtimes [2]. When attempting to generate soft tissuecontrast at 3T, a longer repetition time (TR) may berequired to obtain a similar imaging appearance thatone may be accustomed to at 1.5T and lower fieldstrengths (Figures 1.1 and 1.2) [3]. The downside of alonger TR is a concomitant increase in imaging time.T1 relaxation times tend to be approximately 20–40%longer at 3T when compared with 1.5T [2].
Approaches to addressing this problem withunenhanced T1-weighted images include the additionof an inversion recovery preparatory pulse to accentu-ate T1 contrast (e.g., T1 fluid-attenuated inversionrecovery [FLAIR]). Other possibilities include theuse of magnetization preparation pulses, short echotime (TE) gradient echo pulses, as well as parallelimaging techniques to decrease overall imaging time[4, 5].
Body MR Imaging at 3 Tesla, ed. Ihab R. Kamel and Elmar M. Merkle. Published by Cambridge University Press.# Cambridge University Press 2011.
1

www.cambridge.org© in this web service Cambridge University Press
Cambridge University Press978-0-521-19486-0 - Body MR Imaging at 3 TeslaEdited by Ihab R. Kamel and Elmar M. MerkleExcerptMore information
Gadolinium contrast effectsWhile the T1 relaxation time of unenhanced softtissues is longer at 3T compared with lower fieldstrengths, the T1 relaxation time of gadoliniumchelate-based contrast agents is relatively unaffected.As a result, post-contrast imaging at 3T yields a moreconspicuous degree of contrast enhancement. This
wider dynamic range of effect leads to an increase inthe contrast-to-noise ratio (CNR), an effect illustratedin Figures 1.3 and 1.4.
An increase in CNR at 3T leads to increasedtarget conspicuity on post-contrast imaging, improvedvessel delineation and visualization on MR angiog-raphy (MRA), as well as the possibility of decreasingcontrast dose compared with 1.5T [6–8] This latteroption is becoming increasingly relevant due to theheightened awareness of the risks of nephrogenic sys-temic fibrosis (NSF). In fact, for imaging of braintumors, a half dose of gadolinium-based contrast at3T approximates the CNR of a full dose of contrast at1.5T [8].
T2 and T2* relaxation times(magnetic susceptibility)The effects of an increase in field strength on the T2relaxation times of tissues are less predictable than thechanges in T1 relaxation times. While for lattice-fixedprotons, T2 relaxation times may be similarly pro-longed with an increase in field strength, most tissuesexperience an increase in efficiency of chemicalexchange mechanisms at 3T which tends to result ina net shortening of T2 relaxation times (the efficiencyof proton exchange between molecules varies with thesquare of the magnetic field strength). While for mostsoft tissues, T2 relaxation times are slightly shorter,T2 relaxation times for adipose tissues remain slightly
1.5T
1.5T
3T
3T
TR
Sig
nal
inte
nsi
ty
Figure 1.1 Signal intensity–time curves show longer T1 relaxationtimes at MR imaging in liver (black curves) and tumor tissue (graycurves) at 3T than at 1.5T. To generate a level of T1 contrast betweenthe two tissue types at 3T commensurate with that at 1.5T, longerrepetition times (TR, represented by dotted vertical lines) arerequired. Reproduced with permission from Chang KJ, Kamel IR,Macura KJ, Bluemke DA. 3T MR imaging of the abdomen:comparison with 1.5T. RadioGraphics 2008; 28: 1983–98.# Radiological Society of North America.
(a) (b)
Figure 1.2 Effect of higher magnetic field strength on the visibility of a colon adenocarcinoma metastasis in the liver of a 32-year-old woman.Unenhanced T1-weighted gradient echo images obtained at 1.5T with 180/4.4 (TR ms/echo time [TE] ms), 90� flip angle, and 8-mmsection thickness (a) and at 3T with 263/2.3, 75� flip angle, and 8-mm section thickness (b) show higher SNR but decreased lesionconspicuity in (b).
Chapter 1: Considerations about artifacts and safety
2

www.cambridge.org© in this web service Cambridge University Press
Cambridge University Press978-0-521-19486-0 - Body MR Imaging at 3 TeslaEdited by Ihab R. Kamel and Elmar M. MerkleExcerptMore information
longer and T2 relaxation times for fluids are largelyunchanged [2].
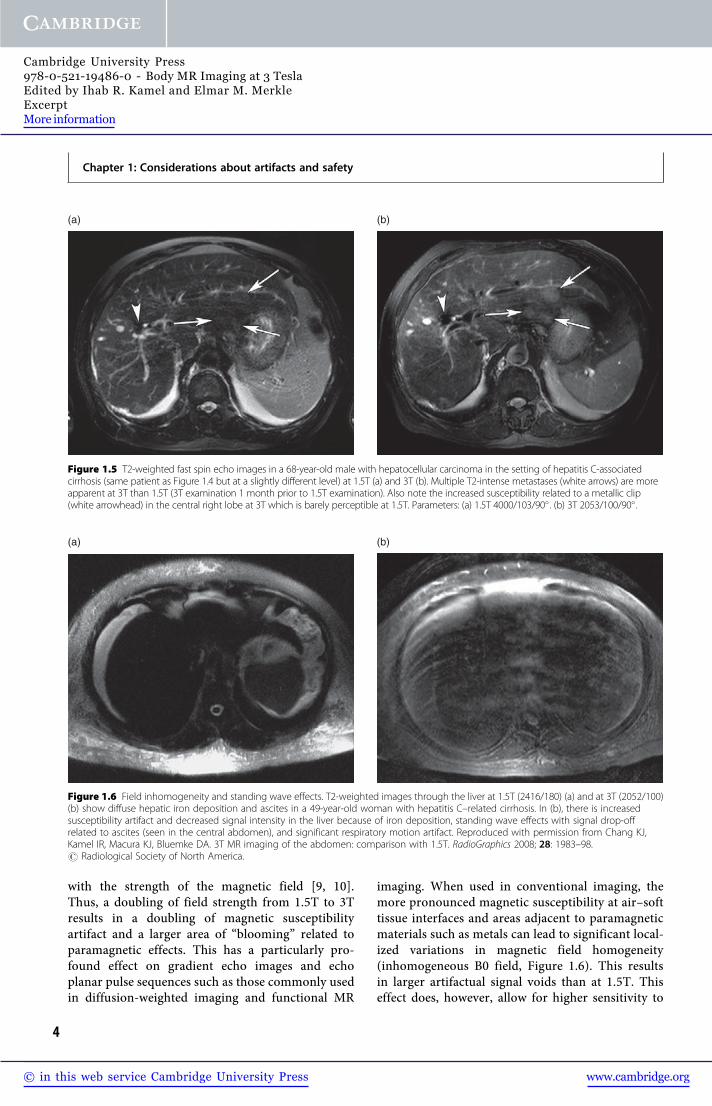
Nevertheless, there is a significant perceivedimprovement in image quality on T2-weighted imageswith a move to a higher field strength (Figure 1.5).This is chiefly related to an increase in SNR and ismore pronounced on T2-weighted imaging than T1-weighted imaging as the longer TR of T2-weightedpulse sequences allows for more recovery of
longitudinal magnetization than on T1-weightedsequences. Sequences such as single-shot fast spinecho (SSFSE), half-Fourier acquisition single-shotturbo spin echo (HASTE), as well as three-dimensional(3D) turbo spin echo (such as in 3D MR cholangio-pancreatography) stand to benefit the most from ahigher field strength.
T2* relaxation times are affected much morepredictably with a move to 3T and vary inversely
(a) (b)
Figure 1.3 Increased conspicuity of lesions at 3T MR. Gadolinium-induced contrast enhancement of a moderately differentiatedcholangiocarcinoma in an 82-year-old woman is less pronounced on the 1.5T three-dimensional (3D) volumetric interpolated breath-holdexamination (VIBE; 4.9/2.5, 10� flip angle) image (a) than on the 3T 3D T1-weighted high-resolution isotropic volume examination (THRIVE;3.3/1.6, 10� flip angle) image (b) because of lower CNR at 1.5T compared with 3T, even allowing for equipment differences.
(a) (b)
Figure 1.4 Increased conspicuity of lesions at 3T MR. Comparison of 1.5T 3D VIBE (4.9/2.5, 10� flip angle) (a) and 3T 3D THRIVE (3.3/1.6,10� flip angle) (b) MR images in a 68-year-old man with hepatitis C-related cirrhosis shows greater contrast of a wedge-shaped region ofhyperperfusion (transient hepatic signal intensity difference) (arrows) at 3T than at 1.5T. Magnetic susceptibility artifacts related to a surgicalclip (arrowheads) also are partially mitigated in (b) because of the use of a shorter TE.
Chapter 1: Considerations about artifacts and safety
3
www.cambridge.org© in this web service Cambridge University Press
Cambridge University Press978-0-521-19486-0 - Body MR Imaging at 3 TeslaEdited by Ihab R. Kamel and Elmar M. MerkleExcerptMore information
with the strength of the magnetic field [9, 10].Thus, a doubling of field strength from 1.5T to 3Tresults in a doubling of magnetic susceptibilityartifact and a larger area of “blooming” related toparamagnetic effects. This has a particularly pro-found effect on gradient echo images and echoplanar pulse sequences such as those commonly usedin diffusion-weighted imaging and functional MR
imaging. When used in conventional imaging, themore pronounced magnetic susceptibility at air–softtissue interfaces and areas adjacent to paramagneticmaterials such as metals can lead to significant local-ized variations in magnetic field homogeneity(inhomogeneous B0 field, Figure 1.6). This resultsin larger artifactual signal voids than at 1.5T. Thiseffect does, however, allow for higher sensitivity to
(a) (b)
Figure 1.5 T2-weighted fast spin echo images in a 68-year-old male with hepatocellular carcinoma in the setting of hepatitis C-associatedcirrhosis (same patient as Figure 1.4 but at a slightly different level) at 1.5T (a) and 3T (b). Multiple T2-intense metastases (white arrows) are moreapparent at 3T than 1.5T (3T examination 1 month prior to 1.5T examination). Also note the increased susceptibility related to a metallic clip(white arrowhead) in the central right lobe at 3T which is barely perceptible at 1.5T. Parameters: (a) 1.5T 4000/103/90� . (b) 3T 2053/100/90� .
(a) (b)
Figure 1.6 Field inhomogeneity and standing wave effects. T2-weighted images through the liver at 1.5T (2416/180) (a) and at 3T (2052/100)(b) show diffuse hepatic iron deposition and ascites in a 49-year-old woman with hepatitis C–related cirrhosis. In (b), there is increasedsusceptibility artifact and decreased signal intensity in the liver because of iron deposition, standing wave effects with signal drop-offrelated to ascites (seen in the central abdomen), and significant respiratory motion artifact. Reproduced with permission from Chang KJ,Kamel IR, Macura KJ, Bluemke DA. 3T MR imaging of the abdomen: comparison with 1.5T. RadioGraphics 2008; 28: 1983–98.# Radiological Society of North America.
Chapter 1: Considerations about artifacts and safety
4

www.cambridge.org© in this web service Cambridge University Press
Cambridge University Press978-0-521-19486-0 - Body MR Imaging at 3 TeslaEdited by Ihab R. Kamel and Elmar M. MerkleExcerptMore information
the detection of gas, items such as surgical clips, andareas of iron deposition in solid organs. This effect,in fact, makes 3T imaging more sensitive to super-paramagnetic iron oxide contrast agents (SPIO) aswell as the blood oxygen level-dependent (BOLD)phenomenon used extensively in functional MRimaging [11–13].
Approaches to minimizing magnetic suscepti-bility artifacts include shortening TE, using parallelimaging to shorten imaging time and decrease echotrain length, and increasing receiver bandwidth todecrease the echo spacing of the readout train. Theseapproaches have already shown significant success inreducing artifacts on diffusion-weighted imaging inthe brain [14, 15].
Chemical shift effectsJust as with magnetic susceptibility effects, chemicalshift effects also directly vary with an increase in themagnetic field strength. For chemical shift effects ofthe first kind, the difference in precession frequencyof water protons and fat protons holds steady at3.5 ppm. With a doubling of field strength from1.5T to 3T the Larmor frequency doubles from64MHz to 128MHz, respectively. Accompanying thisdoubling of Larmor frequency is a chemical shiftseparation between water and fat which also doublesfrom approximately 220Hz to 440Hz, respectively
(Larmor frequency� 3.5 ppm). This means at a con-stant bandwidth, the misregistration artifacts betweenfat voxels and water voxels in the frequency-encodingdirection doubles in conspicuity with a doubling infield strength (Figure 1.7). While this misregistrationartifact is more pronounced at 3T, this wider spectralseparation between fat and water also allows forimproved spectral resolution in MR spectroscopy aswell as improved fat suppression limited only by thedegree of magnetic field inhomogeneity [16, 17].
There are various approaches to decreasing theconspicuity of the misregistration artifact associatedwith chemical shift effects of the first kind. Anincrease in bandwidth will counteract an increase inchemical shift at the cost of SNR. For example, adoubling of bandwidth to fully offset a doubling offield strength will result in a 29% decrease in relativeSNR. This ability to increase bandwidth is limitedby gradient coil strength. Another approach tomitigating fat–water misregistration is utilizing fatsuppression.
Chemical shift artifacts of the second kind are alsosignificantly affected by an increase in magnetic fieldstrength. These phase cancellation or “India ink”artifacts are seen in voxels sharing both fat and waterprotons at specific TEs corresponding to times whenfat and water protons precess out of phase with eachother resulting in signal cancellation. This is mostcommonly seen at the edges of solid organs where
(a) (b)
Figure 1.7 Chemical shift artifact at 1.5T (a) and 3T (b) in normal kidneys. Note increased water–fat misregistration at the renal cortex at 3T(white arrow). Parameters: (a) 1.5T SSFSE 1759/88, slice thickness 8mm. (b) 3T SSFSE 4500/90, slice thickness 8mm. Reproduced withpermission from Chang KJ, Kamel IR, Macura KJ, Bluemke DA. 3T MR imaging of the abdomen: comparison with 1.5T. RadioGraphics 2008;28: 1983–98. # Radiological Society of North America.
Chapter 1: Considerations about artifacts and safety
5

www.cambridge.org© in this web service Cambridge University Press
Cambridge University Press978-0-521-19486-0 - Body MR Imaging at 3 TeslaEdited by Ihab R. Kamel and Elmar M. MerkleExcerptMore information
they interface with surrounding fat. A doubling offield strength will double the precession frequencyof these protons and, correspondingly, halve theirout-of-phase and in-phase TEs from approximately2.3 and 4.6ms respectively at 1.5T to approximately1.15 and 2.3ms at 3T (Figure 1.8) [18]. When gradi-ent coils are incapable of imaging with a TE as shortas 1.15ms, significant changes may need to be incorp-orated when obtaining T1-weighted in- and out-of-phase images routine in abdominal imaging. If thenext shortest out-of-phase TE of 3.45ms is obtained,if compared with an in-phase image at TE 2.3ms,magnetic susceptibility effects related to a longer TEcannot be differentiated from signal dropout relatedto chemical shift effects of the second kind. An
alternative approach is obtaining two separate imageacquisitions rather than using a dual-echo pulsesequence; however, this introduces problems relatedto imperfect image co-registration of the two acquisi-tions and necessitates longer imaging time. Anotherapproach is the use of a dual-echo 3D fast spoiledgradient echo pulse sequence [19].
Field inhomogeneity (B0, B1,and dielectric shading)One of the most apparent challenges faced with MRimaging at 3T relates to significant variations in signalintensity that are often encountered across the field of
(a) (b)
(c) (d)
Figure 1.8 In-phase and out-of-phase imaging at 1.5T and 3T. (a) 1.5T in-phase TE 4.6 ms. (b) 1.5T out-of-phase TE 2.3ms. (c) 3T in-phaseTE 2.3ms. (d) 3T out-of-phase TE 1.15ms. Note increased chemical shift at 3T (white arrow).
Chapter 1: Considerations about artifacts and safety
6

www.cambridge.org© in this web service Cambridge University Press
Cambridge University Press978-0-521-19486-0 - Body MR Imaging at 3 TeslaEdited by Ihab R. Kamel and Elmar M. MerkleExcerptMore information
view, especially with the larger field of view requiredin imaging the human torso. Multiple factors canaccount for these signal intensity variations acrossan image. As has been discussed above, increasedsensitivity to T2* effects can lead to pronounced mag-netic susceptibility effects, especially in areas adjacentto air or the skin surface. This effect is commonlyseen in the upper abdomen adjacent to the lung basesas well as around gas-filled loops of bowel. Gradientecho and echo planar acquisitions such as those typ-ically used in diffusion-weighted imaging can be quitesusceptible to these effects (Figure 1.9), although,when combined with the use of parallel imaging,diffusion-weighted imaging at 3T can be performedmore quickly and with higher SNR [15]. In addition,underlying B0 field inhomogeneities have been achallenge addressed with some success on newer-generation 3T scanners, with improvements in B0field homogeneity through better shimming andmagnet design. Other approaches to limiting B0 fieldinhomogeneity are similar to limiting susceptibilityartifact and include shortening TE (which mayrequire an increase in bandwidth and resultantdecrease in SNR), using parallel imaging to shortenimaging time, and decreasing voxel size to limit intra-voxel dephasing.
Another major factor accounting for signal inten-sity variations on 3T images is inhomogeneity in theB1 or RF field. Particularly with larger fields of view
such as in the abdomen and pelvis, standing wave ordielectric effects become a significant source of RFfield inhomogeneity at 3T. The reason why theseeffects are so much more pronounced at 3T than atlower field strengths is related to the RF wavelengthcorresponding to the resonant frequency (Larmorfrequency) of water protons. While at 1.5T a Larmorfrequency of 64MHz corresponds to an RF wave-length of 52 cm, at 3T a higher Larmor frequency of128MHz corresponds to a shorter wavelength of26 cm, which is much closer in dimension to thehuman abdomen or pelvis. These wavelengths leadto areas of constructive and destructive interferencewithin the torso, termed standing wave or “dielectricshading” effects, which can lead to large variations inlocal signal intensity across an image [20]. This find-ing is more apparent in those with a wider bodyhabitus or more ellipsoid body cross section [21].Similar-appearing artifacts can be even more trouble-some in patients with a large volume of conductiveintra-abdominal fluid such as ascites or amnioticfluid. Rapid alterations in the magnetic field causedby changing RF currents tend to induce circulatingcurrents within large volumes of conductive fluid thatcounteract or “shield” the RF field and attenuatesignal intensity within the central torso (Figure 1.10)[22]. This “black-hole” artifact tends to be morenoticeable with fast spin echo pulse sequences thangradient echo sequences.
(a) (b)
Figure 1.9 Diffusion-weighted imaging of normal kidneys in the axial plane at 1.5T (a) and 3T (b), B¼ 750 s/mm2. Higher SNR at 3Tincreases sensitivity for areas of restricted diffusion. Image quality may be limited by increased sensitivity to magnetic susceptibility artifact.Reproduced with permission from Chang KJ, Kamel IR, Macura KJ, Bluemke DA. 3T MR imaging of the abdomen: comparison with 1.5T.RadioGraphics 2008; 28: 1983–98. # Radiological Society of North America.
Chapter 1: Considerations about artifacts and safety
7

www.cambridge.org© in this web service Cambridge University Press
Cambridge University Press978-0-521-19486-0 - Body MR Imaging at 3 TeslaEdited by Ihab R. Kamel and Elmar M. MerkleExcerptMore information
There are many ways to attempt to alleviate theissues related to standing wave artifacts and B1 fieldinhomogeneity. One of the simplest ways to decreasedielectric shading is through the use of dielectric padsor “RF cushions,” pads or bags of conductive fluid orgel which are placed on the region of interest in anattempt to change the shape of the torso or partiallymitigate standing waves within the torso [23]. Manyrecent hardware advances have also resulted in sig-nificant improvements in B1 field homogeneitythrough more efficient and homogeneously designedRF coils as well as the use of multi-transmitter coils“tuned” to fit the body part to be imaged [24].
Combined transmit–receive coils are also in develop-ment to improve RF transmission and signal detec-tion efficiency at 3T. These alternative coil designs areof particular importance as well, given the specificabsorption rate (SAR) intensity of pulse sequencesat 3T.
Specific absorption rateThe US Food and Drug Administration and the Inter-national Electrotechnical Commission limit the SARto 4W/kg over 15 minutes or 8W/kg over 5 minutes,a limit intended to prevent tissues from heating more
(a) (b)
(c) (d)
Figure 1.10 Standing wave artifacts. T1-weighted images at 1.5T (a) and 3T (b). Standing wave effects in the upper abdomen causesignificant artifact at 3T. Note inhomogeneity around the spine in (b). T2-weighted images in a patient with ascites at 1.5T (c) and3T (d). Note large region of signal dropout in the central abdomen at 3T accentuated by ascites in (d). Parameters: (a) 1.5T T1 gradientecho in-phase 200/4.4/90� , (b) 3T T1 GRE in-phase 263/2.3/75� , (c) 1.5T T2 FSE 4000/103, (d) 3T T2 FSE 2053/100.
Chapter 1: Considerations about artifacts and safety
8

www.cambridge.org© in this web service Cambridge University Press
Cambridge University Press978-0-521-19486-0 - Body MR Imaging at 3 TeslaEdited by Ihab R. Kamel and Elmar M. MerkleExcerptMore information
than 1 �C. This limit holds regardless of the fieldstrength of a magnet. When compared with 1.5T, adoubling of field strength to 3T is accompanied bya quadrupling of the SAR. At 3T, SAR limits becomea much more realistic limitation to the use of pulsesequences such as fast spin echo, 3D gradient echo,and steady-state free precession sequences. As SARalso directly relates to the imaged volume, SAR limi-tations become more of an issue with body MRimaging than with the imaging of smaller body parts.
SAR / B20�
2DV
The relationship of SAR to various imaging param-eters can be illustrated with the above equationwhere B0 represents the magnetic field strength, arepresents the flip angle, D represents the duty cycle(the number and spacing of RF pulses), and V rep-resents the volume imaged. While doubling B0 quad-ruples SAR, altering the other parameters canmitigate these effects to avoid exceeding SAR restric-tions. Decreasing flip angles can lead to significantdecreases in SAR at the potential expense of pro-longed acquisition time and decreased T1 contrast.More sophisticated techniques for varying flip anglesinclude the use of RF refocusing pulse sequencessuch as flip angle sweep and hyperechoes at a slightcost of SNR [25, 26]. Techniques related to reducingthe duty cycle of a pulse sequence include increasingTR (at the expense of prolonging scan time),decreasing the number of phase-encode or slice-select steps (at the cost of decreased spatial reso-lution, slice thickness, or field of view), alternatinghigh and low SAR pulse sequences during the courseof an examination, and using parallel imaging (at aslight cost of SNR – an effect which is less noticeableat 3T than at 1.5T). Imaging volume is less easilyvaried but can be affected by the use of more RFefficient transmit–receive coils or with the use of ashorter magnet bore.
SafetySafety considerations remain a significant consider-ation when moving to a higher magnetic fieldstrength. Implanted medical devices that are deemedMR compatible at 1.5T or lower are not necessarilyapproved for MR imaging at 3T. Metallic devicesrequire further testing in the 3T environment priorto 3T approval as there is a proportional increasein translational attraction and torque upon these
implanted devices with an increase in magnetic fieldstrength [27]. This is especially true in the latestgeneration of wider- and shorter-bore magnets dueto their increased spatial gradients and higher associ-ated deflection angles [28]. With an ever-expandingclinical experience with 3T MR imaging, more deviceswill eventually gain 3T approval.
In addition to device safety, MR imaging sitingissues are also important to consider with a higherfield strength. A higher field strength results in alarger magnetic fringe field. This requires either awider 5 Gauss safety margin increasing the 3T MRsuite’s “footprint” or the use of active shielding tocounteract the larger fringe field (not without add-itional installation and maintenance cost). Acousticnoise concerns are also an issue with higher fieldstrength imaging although this has been mitigatedon newer scanners with improved acoustic shielding.
ConclusionMR imaging at 3T is becoming more popular, morewidespread, and increasingly accepted as the current“cutting edge” in clinical MR imaging. This is espe-cially the case for neurologic and musculoskeletalimaging. However, the adoption of 3T in bodyimaging has been comparatively slower and much ofthis is related to the imaging challenges that a higherfield strength presents in the abdomen and pelvis.
There are many differences in the behavior ofprotons at 3T compared with lower field strengthsand this accounts for many of the artifacts encoun-tered at 3T MR imaging. T1 relaxation times arelonger with a significant effect on soft tissue contrast,particularly on pre-contrast imaging. T2* effects aremore pronounced with an increase in magnetic sus-ceptibility artifacts as well as difficulties in maintain-ing a homogeneous B0 field. Chemical shift artifactsof both the first and second kind are also predictablydifferent at 3T and require adjustments in imagingparameters and changes in pulse sequence timing.And last, but definitely not least, standing wave arti-facts (“dielectric shading”) are a source of significantlocal variation in signal intensity across the largerimaging field of view utilized in the abdomen andpelvis. Many options exist in addressing these artifactsat 3T including changes in TE, use of parallelimaging, changes in bandwidth, as well as more hard-ware-oriented solutions such as the use of dielectricpads and various strategies employed to generate a
Chapter 1: Considerations about artifacts and safety
9

www.cambridge.org© in this web service Cambridge University Press
Cambridge University Press978-0-521-19486-0 - Body MR Imaging at 3 TeslaEdited by Ihab R. Kamel and Elmar M. MerkleExcerptMore information
more homogeneous B0 and B1 field. Only when pulsesequences and image quality can be sufficiently opti-mized for 3T imaging can the promise of an increasedSNR truly yield perceptible improvements in spatialand temporal resolution.
AcknowledgementsSpecial thanks to David A. Bluemke, MD, PhD andKatarzyna J. Macura, MD, PhD for their additionalhelp and guidance during the preparation of thistopic.
References1. Vargas MI, Delavelle J, Kohler R, Becker CD, Lovblad
K. Brain and spine MRI artifacts at 3 Tesla.J Neuroradiol 2009; 36(2): 74–81.
2. de Bazelaire CM, Duhamel GD, Rofsky NM, AlsopDC. MR imaging relaxation times of abdominal andpelvic tissues measured in vivo at 3T: preliminaryresults. Radiology 2004; 230(3): 652–9.
3. Bushberg J. The Essential Physics of Medical Imaging,2nd edn. Philadelphia, PA, Lippincott Williams &Wilkins, 2002. pp. xvi, 933.
4. Lee JH, Garwood M, Menon R, et al. High contrastand fast three-dimensional magnetic resonanceimaging at high fields. Magn Reson Med 1995; 34(3):308–12.
5. Wolff SD, Eng J, Balaban RS. Magnetizationtransfer contrast: method for improving contrast ingradient-recalled-echo images. Radiology 1991; 179(1):133–7.
6. Elster AD. How much contrast is enough? Dependenceof enhancement on field strength and MR pulsesequence. Eur Radiol 1997; 7 Suppl 5: 276–80.
7. Fukatsu H. 3T MR for clinical use: update.Magn ResonMed Sci 2003; 2(1): 37–45.
8. Krautmacher C, Willinek WA, Tschampa HJ, et al.Brain tumors: full- and half-dose contrast-enhancedMR imaging at 3T compared with 1.5T – initialexperience. Radiology 2005; 237(3): 1014–19.
9. Lewin JS, Duerk JL, Jain VR, et al. Needle localizationin MR-guided biopsy and aspiration: effects of fieldstrength, sequence design, and magnetic fieldorientation. AJR Am J Roentgenol 1996; 166(6):1337–45.
10. Olsrud J, Latt J, Brockstedt S, Romner B, Bjorkman-Burtscher IM. Magnetic resonance imaging artifactscaused by aneurysm clips and shunt valves:dependence on field strength (1.5 and 3T) andimaging parameters. J Magn Reson Imaging 2005;22(3): 433–7.
11. Chang JM, Lee JM, Lee MW, et al. Superparamagneticiron oxide-enhanced liver magnetic resonanceimaging: comparison of 1.5T and 3T imaging fordetection of focal malignant liver lesions. Invest Radiol2006; 41(2): 168–74.
12. Simon GH, Bauer J, Saborovski O, et al. T1 and T2relaxivity of intracellular and extracellular USPIO at1.5T and 3T clinical MR scanning. Eur Radiol 2006;16(3): 738–45.
13. Li LP, Vu AT, Li BS, Dunkle E, Prasad PV. Evaluationof intrarenal oxygenation by BOLD MRI at 3T. J MagnReson Imaging 2004; 20(5): 901–4.
14. Kuhl CK, Textor J, Gieseke J, et al. Acute and subacuteischemic stroke at high-field-strength (3.0-T)diffusion-weighted MR imaging: intraindividualcomparative study. Radiology 2005; 234(2): 509–16.
15. Kuhl CK, Gieseke J, von Falkenhausen M, et al.Sensitivity encoding for diffusion-weighted MRimaging at 3T: intraindividual comparative study.Radiology 2005; 234(2): 517–26.
16. Gruetter R, Weisdorf SA, Rajanayagan V, et al.Resolution improvements in in vivo 1H NMR spectrawith increased magnetic field strength. J Magn Reson1998; 135(1): 260–4.
17. Katz-Brull R, Rofsky NM, Lenkinski RE. Breathholdabdominal and thoracic proton MR spectroscopy at3T. Magn Reson Med 2003; 50(3): 461–7.
18. Wehrli FW, Perkins TG, Shimakawa A, Roberts F.Chemical shift-induced amplitude modulations inimages obtained with gradient refocusing. Magn ResonImaging 1987; 5(2): 157–8.
19. Cornfeld DM, Israel G, McCarthy SM, Weinreb JC.Pelvic imaging using a T1W fat-suppressed three-dimensional dual echo Dixon technique at 3T. J MagnReson Imaging 2008; 28(1): 121–7.
20. Collins CM, Liu W, Schreiber W, Yang QX, Smith MB.Central brightening due to constructive interferencewith, without, and despite dielectric resonance. J MagnReson Imaging 2005; 21(2): 192–6.
21. Hussain S. Body MR Imaging: Current Practice andFuture Horizons. Scientific Assembly and AnnualMeeting of Radiological Society of North America,Chicago, IL, 2006.
22. Merkle EM, Dale BM, Paulson EK. Abdominal MRimaging at 3T. Magn Reson Imaging Clin N Am 2006;14(1): 17–26.
23. Franklin KM, Dale BM, Merkle EM. Improvement inB1-inhomogeneity artifacts in the abdomen at 3T MRimaging using a radiofrequency cushion. J Magn ResonImaging 2008; 27(6): 1443–7.
24. Tomanek B, Ryner L, Hoult DI, Kozlowski P, SaundersJK. Dual surface coil with high-B1 homogeneity for
Chapter 1: Considerations about artifacts and safety
10