A classification of living and fossil genera of - Raffles Museum
Upload
american-geodeCategory
view
40download
2description

2010
BLUE BEACH FOSSIL MUSEUM SOCIETY DRAFT BUSINESS PLAN VERSION #3 APRIL 19, 2010

May 2010 BLUE BEACH FOSSIL MUSEUM: BUSINESS PLAN & ECONOMIC IMPACT STUDY
2
Table of Contents
Introduction and Project Overview……………………………………….…………………………………….
3
Organizational History………………………………………………………………………………………………….
5
Museum Management Business Models……………………………..……………………………………….
7
Market………………………………………………………………………………………………………………………..
17
Public Programming…………………………………………………………………………………………………….
25
Operational Planning…………………..………………………………………………………………………………..
27
Potential for Strategic Alliances……………………………………………………………………………………..
30
Financial Analysis…………………………………………………………………………………………………………..
33
Potential Funding Sources…………………………………………………………………………………………….
40
Economic Impact Analysis…………………………………………………………………………………………….
41
Other Recommendations………………………………………………………………………………………………
55
Appendix A: Canadian Paleontology Museums…………………………..……………………………….
56
Appendix B: Seasonal Staff Estimates…………………………………………………………………………..
57
Appendix C: International Acclaim……………………………………………………………………………….
59
May 2010 BLUE BEACH FOSSIL MUSEUM: BUSINESS PLAN & ECONOMIC IMPACT STUDY
3
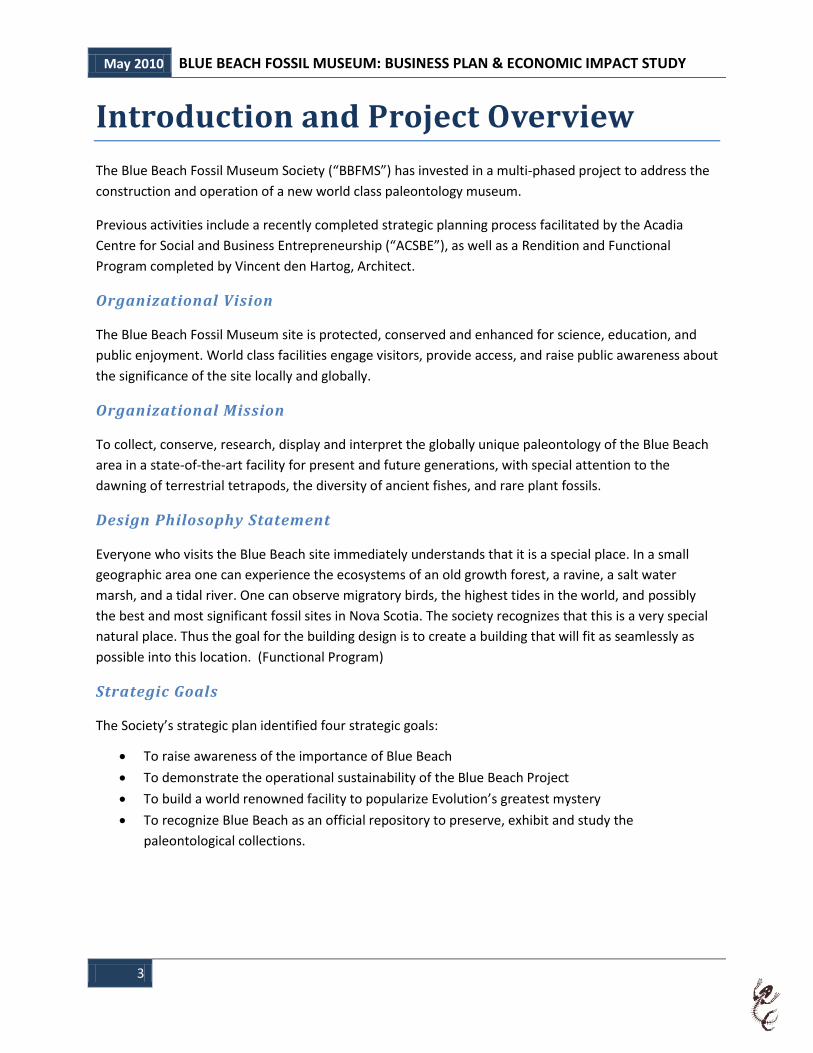
Introduction and Project Overview
The Blue Beach Fossil Museum Society (“BBFMS”) has invested in a multi-phased project to address the
construction and operation of a new world class paleontology museum.
Previous activities include a recently completed strategic planning process facilitated by the Acadia
Centre for Social and Business Entrepreneurship (“ACSBE”), as well as a Rendition and Functional
Program completed by Vincent den Hartog, Architect.
Organizational Vision
The Blue Beach Fossil Museum site is protected, conserved and enhanced for science, education, and
public enjoyment. World class facilities engage visitors, provide access, and raise public awareness about
the significance of the site locally and globally.
Organizational Mission
To collect, conserve, research, display and interpret the globally unique paleontology of the Blue Beach
area in a state-of-the-art facility for present and future generations, with special attention to the
dawning of terrestrial tetrapods, the diversity of ancient fishes, and rare plant fossils.
Design Philosophy Statement
Everyone who visits the Blue Beach site immediately understands that it is a special place. In a small
geographic area one can experience the ecosystems of an old growth forest, a ravine, a salt water
marsh, and a tidal river. One can observe migratory birds, the highest tides in the world, and possibly
the best and most significant fossil sites in Nova Scotia. The society recognizes that this is a very special
natural place. Thus the goal for the building design is to create a building that will fit as seamlessly as
possible into this location. (Functional Program)
Strategic Goals
The Society’s strategic plan identified four strategic goals:
To raise awareness of the importance of Blue Beach
To demonstrate the operational sustainability of the Blue Beach Project
To build a world renowned facility to popularize Evolution’s greatest mystery
To recognize Blue Beach as an official repository to preserve, exhibit and study the
paleontological collections.

May 2010 BLUE BEACH FOSSIL MUSEUM: BUSINESS PLAN & ECONOMIC IMPACT STUDY
4
Purpose of this report
The purpose of this report is to provide a business plan in support of the Society’s efforts to move from
its current state (small, limited resources) to a large, commercially viable, paleontology museum. The
planning process is informed by the Society’s Strategic Plan as well as the preliminary facility design
outlined in the Functional Program. This plan must take into account the limitations of the society’s
current and future resources. The society will need to secure both capital and operating funds for a new
facility, work to raise awareness of the importance of the site while at the same time maintaining the
current operation. Change of this magnitude is never easy, and always strains an organizations fiscal and
human resource capacities. This is particularly the case at Blue Beach, where for the past 9 years the
museum has been financed and staffed by two local entrepreneurs.
This business plan is intended to be a valuable resource for the Blue Beach Fossil Museum Society as it
moves into the next phase of the project and seeks partners to fund the development of the new
facility.
The Business Plan will:
Identify opportunities available to the Blue Beach Fossil Museum Society including market
trends, partnership opportunities, and identification of potential funding partners.
Examine organizational best practices for Canadian museums to assist in the identification and
assessment of operational changes that will result from the successful development of the new
museum structure.
Address challenges facing the Society as it moves through the various stages of development.
Include an economic impact analysis that will further assist in building the business case for
capital funding partners.
Provide a five year financial plan that will include projected visitor counts and revenue expense
statements.
Provide a number of short term recommendations (6-24 months) in support of the Society’s
strategic goals.
To prepare this business plan, ACSBE undertook the following research activities:
Numerous site visits and consultations with members of the Board of Directors and advisors to
the Blue Beach Fossil Museum Society.
Publications and literature review, telephone and in person interviews with data gathered from
a variety of sources including:
Nova Scotia Department of Tourism,
Culture, and Heritage
Nova Scotia Department of Economic
Development
Nova Scotia Department of Natural
Resources
Courtenay & District Museum &
Paleontology Centre
Kings Regional Development Authority The Joggins Fossil Institute

May 2010 BLUE BEACH FOSSIL MUSEUM: BUSINESS PLAN & ECONOMIC IMPACT STUDY
5
The Fundy Geological Society Societe Promotion Grand-Pre
The Canadian Fossil Discovery Centre The Royal Tyrell Museum
Federal Department of Canadian Heritage Canadian Museum Association
Statistics Canada Industry Canada
Atlantic Canada Opportunities Agency Hill Strategies
MNPH Project Managers
The Economic Impact Analysis was completed by Dr. Brian Van Blarcom, Acadia University
Organizational History
Although the Blue Beach Fossil Museum Society was incorporated in 2009, the Museum has been in
operation for nine years. It has been driven by the vision, passion, and hard work of Sonja Wood and
Chris Mansky – both of whom have long believed in the potential for the Museum to be a much larger
and internationally recognized enterprise.
Although small in size, the Museum has been successful in attracting visitors from around the world.
Since 2002 the Blue Beach Fossil Museum has entertained visitors from 23 international destinations
(outside of North America), and there is clear evidence that the Museum has been targeted by geo-
tourists from far away locales such as the UK, Germany, Korea, Australia and Sweden. This interest is in
spite of the fact that the
Museum has no marketing
budget, with only a very
basic Facebook site.
Potential visitors,
especially those planning
trips from abroad, have to
search very hard to learn
about the Blue Beach
Fossil Museum.
Entrance to the museum is
free, with a voluntary
donation box and guest
book. These records
suggest that as many as
15,000 people have
visited the museum at
Blue Beach, with approximately 8,000 of those visits in the last three years. It should be noted that
many more visitors head straight to the beach and don’t make their way up to the small Quonset hut
An artist’s rendering of a proposed Fossil Museum located at Blue Beach, Nova Scotia.
Although the museum (not seen) has been operating in Blue Beach for several years, the
proposed expansion would create a unique economic attraction for Kings County while
adding to a growing cluster of paleontological destinations in Nova Scotia.

May 2010 BLUE BEACH FOSSIL MUSEUM: BUSINESS PLAN & ECONOMIC IMPACT STUDY
6
which currently houses the museum, not realizing that this simple building houses an astonishing
collection of fossils dating back some 350 million years.
Both the BBFM collection and fossil site itself have been universally acclaimed. Robert L. Carroll, one of
Canada’s most highly esteemed scientists and former Chairman, Department of Biology and Curator of
the Redpath Museum at Montreal’s McGill University had this to say about the site.
“From these few miles of sea cliff and beach have come a host of fossils providing the only evidence,
anywhere in the world, that provides a link between the very archaic amphibians of the Upper Devonian
and the subsequent radiation of all later land vertebrates. I have been consulted by the group that have
submitted the proposal for Joggins to be accepted as a World Heritage Site, and specifically argued that
Blue Beach should be considered as an equally important locality for our understanding of the early
history of land vertebrates. Together with the Parrsboro locality, these sites provide a spectrum across
the geological time scale that has no equal anywhere else in the world.”
Increased attendance at the museum itself can be directly linked to the growing importance of the fossil
collection at the Blue Beach Museum. Currently, this collection is:
The world’s oldest and largest collection of tetrapod bone fossils dating from the Earliest
Carboniferous interval known as “Romer’s Gap” (more than 500 specimens).
Recognized as earth’s earliest known assemblage of terrestrial tetrapods, showing a well-
established population and previously unsuspected level of diversity with at least six species.
The oldest and largest collection of Carboniferous Tracks on earth (with over 1,700 specimens)
Soon to be the most completely known and important fossil Rhizodontid fish in the world (over
2,000 specimens)
Overall the BBFM collection Includes close to 10,000 specimens, 5,000 of which have been catalogued in
three searchable databases with close to 3,000 digital images. A limited number of these specimens are
on display at the current museum and the remaining specimens are held in storage. Were it not for the
efforts of Sonja Wood, Chris Mansky, and other volunteers at the BBFM, many of these fossils would
have been washed away and/or severely damaged by the destructive forces of the world’s strongest
tides.

May 2010 BLUE BEACH FOSSIL MUSEUM: BUSINESS PLAN & ECONOMIC IMPACT STUDY
7
Museum Management Business Models
Inventory of Models
Our research identified twenty-one Canadian Paleontology Museums. Thirteen are affiliated with or
operated by provincial government departments (including the Fundy Geological Museum which is
operated by the Cumberland Geological Society as part of the Nova Scotia Museum). Four facilities are
affiliated with or are owned and operated by universities, and four are operated by not for profit
societies including the Joggins Fossil Institute (see Appendix A for a complete listing of Canadian
Paleontology Museums). From this list, five museums were selected for more in-depth study to inform
the development of the organizational and operational model that would best suit the Blue Beach Fossil
Museum Society. The museums selected for in-depth review were:
1. Joggins Fossil Institute, Joggins Nova Scotia
2. Fundy Geological Museum, Parrsboro, Nova Scotia
3. Courtenay & District Museum and Palaeontology Centre, Courtenay British Columbia
4. Royal Tyrell Museum, Drumheller, Alberta
5. Canadian Fossil Discovery Centre, Morden, Manitoba
For each of these museums we attempted to capture the following information:
Mission statements and/or visions
Organizational structure
Programming - examination of the types of programming offered
Operating expenses (annually)
Revenues (annually)
Sources of revenue
Annual attendance
Partners and sponsors
Capital expenditures
Situational Factors

May 2010 BLUE BEACH FOSSIL MUSEUM: BUSINESS PLAN & ECONOMIC IMPACT STUDY
8
Joggins Fossil Cliffs, Joggins, Nova Scotia
Organizational Structure: Operated by the Joggins Fossil Institute (registered not-for-profit charitable
organization). The Joggins Fossil Institute works closely with the Cumberland Regional Economic
Development Authority (“CREDA”). CREDA provided blanket insurance coverage and administrative
support for the institute through its development – for example – assistance with promotion, outreach,
bookkeeping, advice on business strategies and partner relations. The institute is a separate entity that
works closely with CREDA to achieve common goals. The land and building was turned over to the
Municipality, resulting in a significant
reduction in risk to the Society (liability, etc)
Vision: The aim of the Joggins Fossil
Institute is to hold for the benefit and
education of humanity a collection and a
geographic site representative of the
Carboniferous Period and ensure that the
site and collection is conserved and safely
studied and exhibited. The Joggins Fossil
Cliffs provide engaging visitor experiences
that inspire wonder and build an
understanding of the natural world.
Mission: The Joggins Fossil Institute is a non-
profit organization, which was developed to
aid in the promotion, development and
management of the Joggins Fossil Cliffs and
to protect, conserve, present, and transmit
to future generations the values of this
wonderful place. The Joggins Fossil Institute
will be a world leader in communicating research (and the collections of the Province of Nova Scotia) to
increase understanding of the natural diversity in the Carboniferous Period and protecting and
conserving the natural fossil heritage.
Building: Project scope: 1182 square metres (m2) Capital Costs: $6.5 million
Opening Hours:
April 22-October 31st 9:30-5:30
After October 31st by appointment (Mon-Fri only)
Annual Visitors: Approximately 20,000 paid admissions. Many other visitors head straight to the beach.
Joggins Nova Scotia is famous for its record of fossils dating to
the Pennsylvanian “Coal Age” of earth history, approximately 310
million years ago. A 15 kilometre length of coast was officially
inscribed on UNESCO’s World Heritage List in 2008. At 350
millions years old, the fossils at Blue Beach provide a never-
before-seen snapshot into Romer’s Gap.

May 2010 BLUE BEACH FOSSIL MUSEUM: BUSINESS PLAN & ECONOMIC IMPACT STUDY
9
Operating Expenses: Approximately $550,000. Wages account for approximately $300,000 of the
operating budget. Heating costs are substantially reduced by the Leeds Certification, although there has
been a need to repair the wind turbine ahead of schedule.
Sources of Revenue: Admissions (Adult $8, Senior and Student $6, Family $25), Season Passes (Adult
$24, Senior and Student $18, Family $75), Three guided tours ($5, $12, and $55). Joggins Fossil Institute
lists the following as partners: NS Departments of Natural Resources, Economic Development, Tourism,
Culture and Heritage, and ACOA, CREDA, Municipality of the County of Cumberland, and the YMCA. As
part of the UNESCO Heritage application process, the Province of Nova Scotia provided a statement of
sustainability.
Programming:
Paleontology Museum and research centre with services including:
Educational Programming:
Interpretive displays in the Joggins Fossil Centre (including interactive lab activities)
Guided tours
School Visits: Guided tours of the property, workshops and other educational programs. Explore
interpretive displays in the Joggins Fossil Centre before heading out to the beach and cliffs with
your interpreter.
Research Facilities:
Space rental
Basic Laboratory
Partnership with Fundy Geological Museum with fully operational lab Marketing and Positioning Strategies:
UNESCO World Heritage Site Designation
Provincial Special Places Designation
Research focus with large number of recent publications
Working with all levels of government
Strong leadership
Science and Education Coordinator to work with education and research partners
Partnership with Fundy Geological Society
Strong website, updated regularly, blog
Key Employees:
Jenna Boon, Director
Dr. Melissa Grey, Curator of Palaeontology
May 2010 BLUE BEACH FOSSIL MUSEUM: BUSINESS PLAN & ECONOMIC IMPACT STUDY
10
Organization chart shows a further 13 positions (9 vacant). Presumably many of those vacant positions are seasonal.
Situational Factors:
Twenty minutes from Fundy Geological Museum
Tourists entering the province from New Brunswick have easy access
UNESCO World Heritage Site Designation
Access to the beach requires reasonable level of fitness
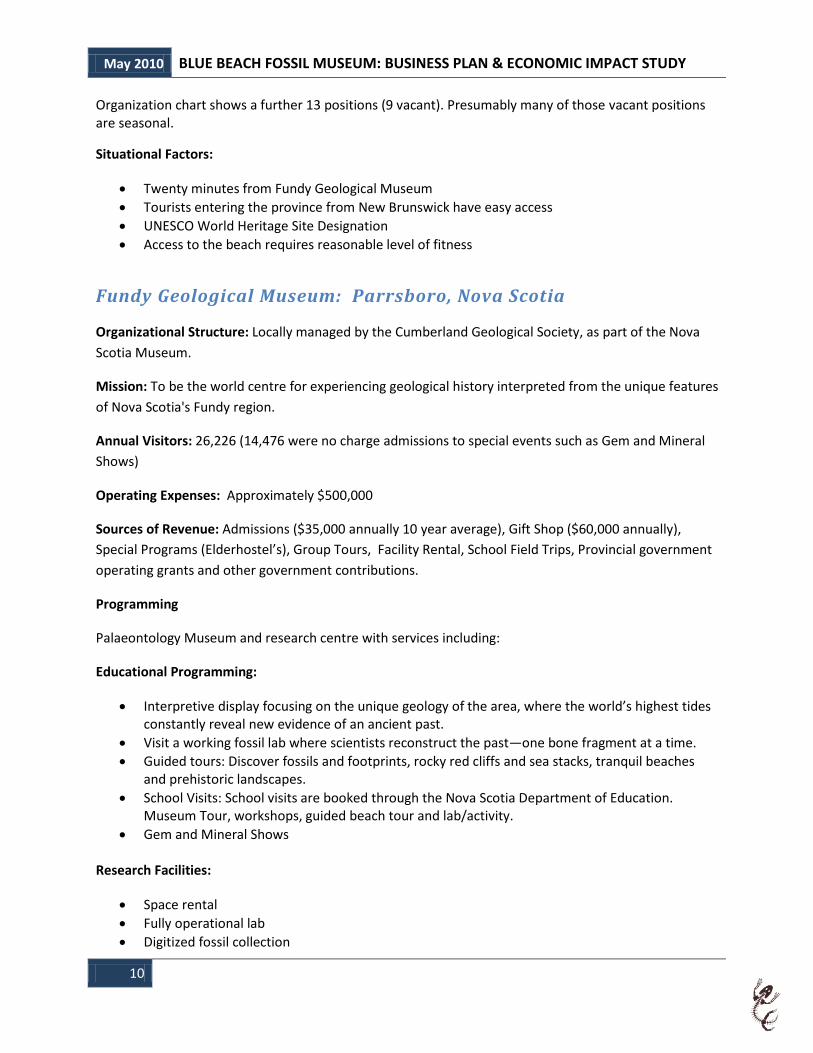
Fundy Geological Museum: Parrsboro, Nova Scotia
Organizational Structure: Locally managed by the Cumberland Geological Society, as part of the Nova
Scotia Museum.
Mission: To be the world centre for experiencing geological history interpreted from the unique features
of Nova Scotia's Fundy region.
Annual Visitors: 26,226 (14,476 were no charge admissions to special events such as Gem and Mineral
Shows)
Operating Expenses: Approximately $500,000
Sources of Revenue: Admissions ($35,000 annually 10 year average), Gift Shop ($60,000 annually),
Special Programs (Elderhostel’s), Group Tours, Facility Rental, School Field Trips, Provincial government
operating grants and other government contributions.
Programming
Palaeontology Museum and research centre with services including:
Educational Programming:
Interpretive display focusing on the unique geology of the area, where the world’s highest tides constantly reveal new evidence of an ancient past.
Visit a working fossil lab where scientists reconstruct the past—one bone fragment at a time.
Guided tours: Discover fossils and footprints, rocky red cliffs and sea stacks, tranquil beaches and prehistoric landscapes.
School Visits: School visits are booked through the Nova Scotia Department of Education. Museum Tour, workshops, guided beach tour and lab/activity.
Gem and Mineral Shows
Research Facilities:
Space rental
Fully operational lab
Digitized fossil collection
May 2010 BLUE BEACH FOSSIL MUSEUM: BUSINESS PLAN & ECONOMIC IMPACT STUDY
11
Marketing and Positioning Strategies
Promoted through the Nova Scotia Museum
Special Places Designation
Direct Links with NS Department of Education
Dinosaur exhibits
Opportunity to visit working lab
Excellent Research facilities
Academic Support includes large number of recent publications
Strong leadership
Partnership with Joggins Fossil Institute
Strong website
Key Employees:
Ken Adams, Curator. Masters of Science Geology (Acadia)
Situational Factors:
Member of the Nova Scotia Museum
Special Places Designation
Dinosaur exhibits
Somewhat off the beaten path on winding road
Twenty minutes from Joggins Fossil Institute
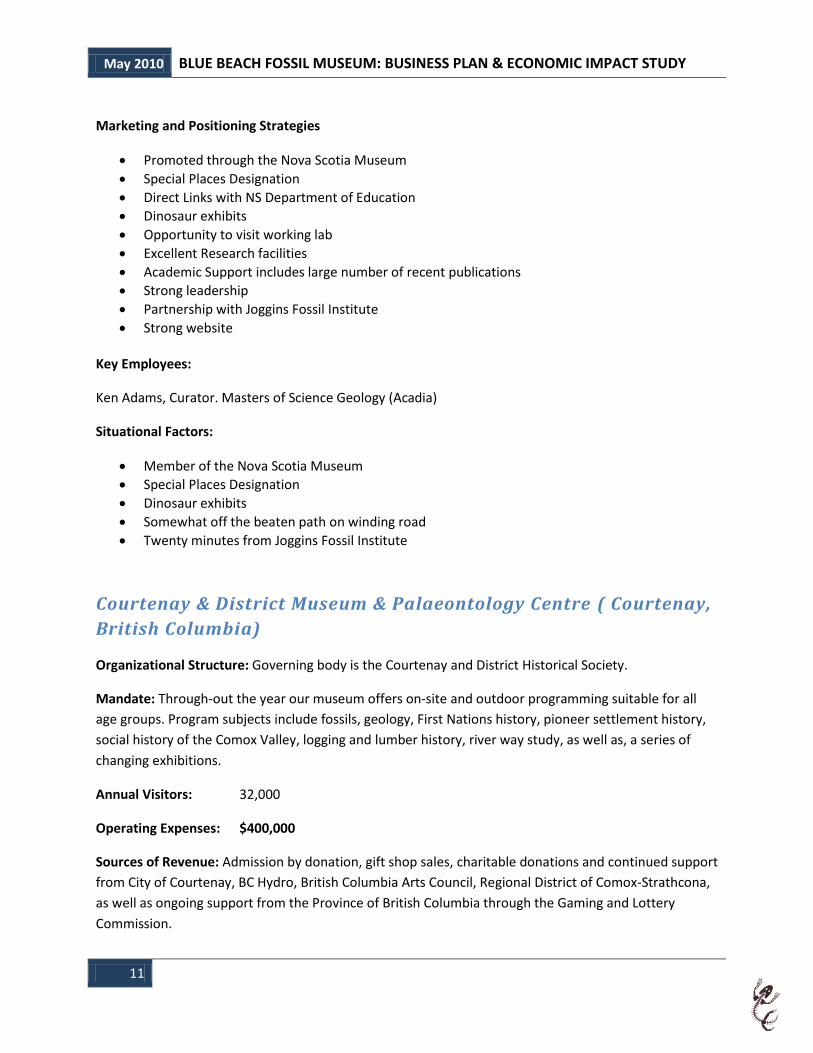
Courtenay & District Museum & Palaeontology Centre ( Courtenay,
British Columbia)
Organizational Structure: Governing body is the Courtenay and District Historical Society.
Mandate: Through-out the year our museum offers on-site and outdoor programming suitable for all
age groups. Program subjects include fossils, geology, First Nations history, pioneer settlement history,
social history of the Comox Valley, logging and lumber history, river way study, as well as, a series of
changing exhibitions.
Annual Visitors: 32,000
Operating Expenses: $400,000
Sources of Revenue: Admission by donation, gift shop sales, charitable donations and continued support
from City of Courtenay, BC Hydro, British Columbia Arts Council, Regional District of Comox-Strathcona,
as well as ongoing support from the Province of British Columbia through the Gaming and Lottery
Commission.
May 2010 BLUE BEACH FOSSIL MUSEUM: BUSINESS PLAN & ECONOMIC IMPACT STUDY
12
Sponsors of the construction of the new museum project were Communities Futures Development
Corporation, Vancouver Foundation, City of Courtenay, Community Economic Adjustment Initiative,
Soroptomist International of Courtenay, Human Resources Development Canada, BC 2000 Community
Spirit, Courtenay Rotary, Comox Valley Community Foundation.
Programming:
District Museum and Palaeontology Centre with services including:
Public and school tours
Archival services
Field tours to excavation site
Fossil hunts
Special exhibits
Home School Program
Spring Break day programs
Facility rental
Marketing and Positioning Strategies
Combines museum of local history with paleontology exhibit
Admission by donation to encourage visits
Partnerships with local school districts
Successful capital campaign $2,500,000 to renovate old Post Office
Core funding from local and provincial funding agencies
Key Employees
Employee profiles not available
Situational Factors
Combined with a District Museum
Located in a renovated Post Office
Actual fossil dig sites not on site
Operated by the Historical Society with core funding agreements in place

May 2010 BLUE BEACH FOSSIL MUSEUM: BUSINESS PLAN & ECONOMIC IMPACT STUDY
13
Royal Tyrrell Museum, Drumheller, Alberta
Organizational Structure: The Museum is operated by the Government of Alberta under the Ministry of
Culture and Community Spirit. A non-profit, charitable organization, The Royal Tyrell Cooperating
Society has supported scientific, educational, exhibit and local community initiatives since 1993.
Mandate: The Royal Tyrrell Museum's mandate is to be an internationally recognized public and
scientific museum dedicated to the collection, preservation, protection, presentation, and interpretation
of palaeontological history, with a particular emphasis on Alberta's rich fossil heritage.
Annual Visitors: 375,000
Operating Expenses: N/A
Sources of Revenue: Government of Alberta Ministry of Parks, Tourism and Culture, corporate
donations, private donations, memberships in the Royal Tyrell Society, Admissions, Gift Shop, Facility
Rentals, Cafeteria
Programming:
Paleontology Museum and research centre with services including:
Educational Programming:
Guided and self-guided hikes (10 choices)
With more than 375,000 visitors annually, Alberta’s Royal Tyrell Museum is considered one of the most successful
paleontological museums and research centres in Canada.
May 2010 BLUE BEACH FOSSIL MUSEUM: BUSINESS PLAN & ECONOMIC IMPACT STUDY
14
Fossil Casting
Dig experience
School Visits
School Outreach (bringing displays to the school)
Distance Learning
Science Camps
Camp-ins
Credited Courses
Research Facilities:
Collection of 125,000 Fossil Vertebrates
Specimen Loans
On site Scientists
Laboratory
Marketing and Positioning Strategies:
Operated by the Government of Alberta
Dinosaur exhibits
Focus on active experiential learning
Opportunity to visit working lab
Excellent Research facilities
Academic Support includes large number of recent publications
Strong leadership- 10 PhD Level scientists on staff
Partnership with Joggins Fossil Institute
Community outreach programs
Interdepartmental working relationships with the education sector
Strong media relations
Strong website
Key Employees:
Executive Director and 9 PhD Museum Curators: Profiles can be found at
www.tyrrellmuseum.com/research/our_scientists.htm
Situational Factors:
Operated by Alberta Government
One hour drive from Calgary
Largest Museum in the Province of Alberta (375,000 visitors annually)
Inter-departmental working relationships with education and tourism partners
Dinosaur Exhibits
Substantial levels of Corporate Sponsorships
Exceptional Research facilities and Scientific staff
May 2010 BLUE BEACH FOSSIL MUSEUM: BUSINESS PLAN & ECONOMIC IMPACT STUDY
15
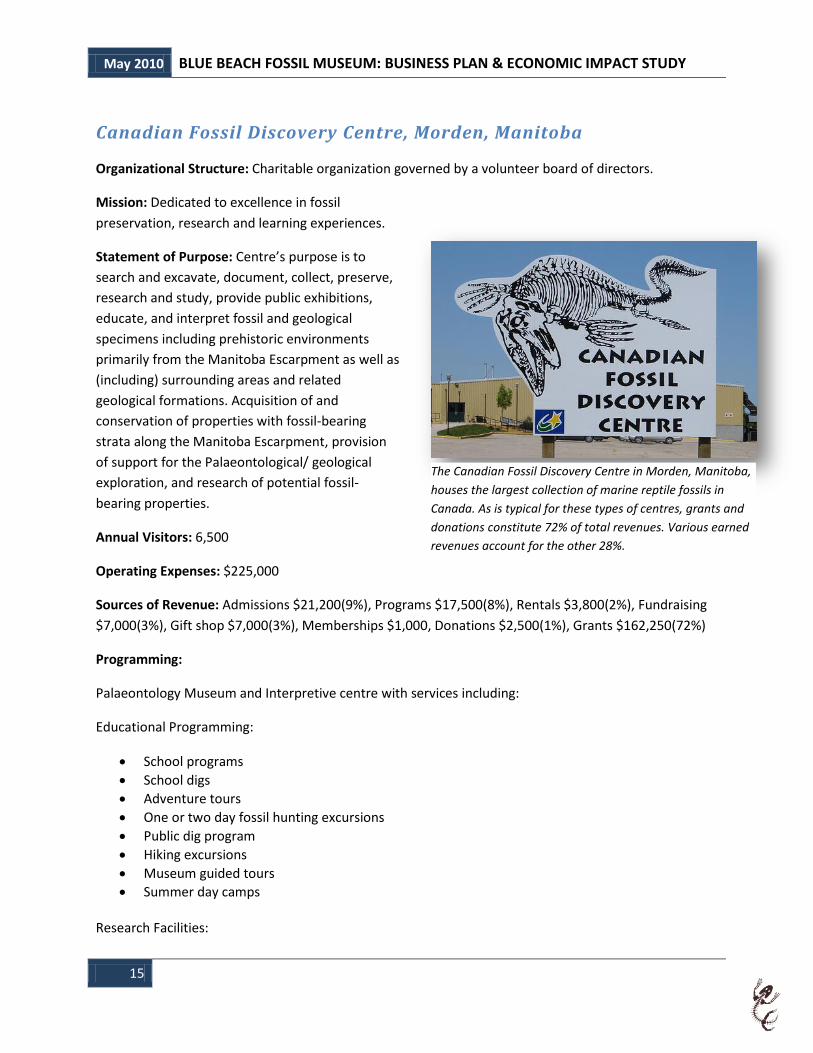
Canadian Fossil Discovery Centre, Morden, Manitoba
Organizational Structure: Charitable organization governed by a volunteer board of directors.
Mission: Dedicated to excellence in fossil
preservation, research and learning experiences.
Statement of Purpose: Centre’s purpose is to
search and excavate, document, collect, preserve,
research and study, provide public exhibitions,
educate, and interpret fossil and geological
specimens including prehistoric environments
primarily from the Manitoba Escarpment as well as
(including) surrounding areas and related
geological formations. Acquisition of and
conservation of properties with fossil-bearing
strata along the Manitoba Escarpment, provision
of support for the Palaeontological/ geological
exploration, and research of potential fossil-
bearing properties.
Annual Visitors: 6,500
Operating Expenses: $225,000
Sources of Revenue: Admissions $21,200(9%), Programs $17,500(8%), Rentals $3,800(2%), Fundraising
$7,000(3%), Gift shop $7,000(3%), Memberships $1,000, Donations $2,500(1%), Grants $162,250(72%)
Programming:
Palaeontology Museum and Interpretive centre with services including:
Educational Programming:
School programs
School digs
Adventure tours
One or two day fossil hunting excursions
Public dig program
Hiking excursions
Museum guided tours
Summer day camps
Research Facilities:
The Canadian Fossil Discovery Centre in Morden, Manitoba,
houses the largest collection of marine reptile fossils in
Canada. As is typical for these types of centres, grants and
donations constitute 72% of total revenues. Various earned
revenues account for the other 28%.

May 2010 BLUE BEACH FOSSIL MUSEUM: BUSINESS PLAN & ECONOMIC IMPACT STUDY
16
Laboratory and collections room
Field research
Digitized fossil collection
Marketing and Positioning Strategies:
Town of Morden funding partnership
Canadian Fossil Discovery Centre extensive collection of marine reptile fossils is the largest in Canada.
Main exhibit of Bruce, the 43 foot long mosasaur and Plesi the 12 foot long plesiosaur, with dramatic sound effects and Karen Carr backdrops on large banners.
Partnerships with local school districts
International outreach joint venture with PaleoWorld in Montana, United States and ran a student exchange program in 2007.
Volunteer outreach programs that utilizes volunteers in field research
Strong website
Recently funded a feasibility study hoping to build a new $25 million facility
Key Employees:
Tyler Schroeder- General Manager (Bachelor of Arts Honours degree). Prior to assuming this position
with the CFDC, Schroeder was the Executive Director of the Morden Area Foundation and volunteer
Board Chairperson of the Morden & District United Way.
Anita-Maria Janzic – Curator: Bachelor of Science Honours degree in Paleobiology, Anita is currently a
candidate for a Master of Science degree in Bioscience, Technology and Public Policy at the University of
Winnipeg.
Situational Factors:
Located in the lower level of the Morden Recreational Complex (includes 2 ice surfaces)
Funding agreement with Town or Morden
In operation for 40 years
Strongly developed partnerships
Captive market for many regional schools for science related museums
630,000 annual visits from Winnipeg to Pembina Valley regions
Other visitors to the Pembina Valley region of 570,00 annually

May 2010 BLUE BEACH FOSSIL MUSEUM: BUSINESS PLAN & ECONOMIC IMPACT STUDY
17
Market
Geotourism
The National Geographic Society defines geotourism as tourism that sustains or enhances the
geographical character of a place – its environment, culture, aesthetics, heritage, and the well-being of
its residents. Geotourism incorporates sustainability principles, but in addition to the do-no-harm ethic,
geotourism focuses on the place as a whole. The idea of
enhancement allows for development based on character of
place, rather than standardized international branding, and
generic architecture, food, and so on.
Fossils have captured the imagination of people for centuries.
Palaeo tourism is an established but still emerging niche
market within the broader Geotourism sector. Geotourism,
especially in environments as unique as Blue Beach, have
broad appeal across many sectors of the overall tourism
market. Tourism markets world-wide are undergoing
significant change, driven by a consumer that is looking for
destinations that provide active and unique experiences. Nova
Scotia is well positioned to capitalize on these emerging
tourism markets, and has already established an international
reputation as a Geotourism and a Palaeo tourism destination.
In Parrsboro the Fundy Geological Museum displays a
collection that reveals an ancient Nova Scotia of 200 million
years ago and some of the oldest dinosaur bones in Canada.
As the name implies, the museum also provides a unique
opportunity to explore mineral treasures of Nova Scotia
exposed when the great Fundy tides washed away the sea cliffs
including a collection of amethyst and agate gem stones.
The recently opened Joggins Fossil Institute has attracted
worldwide attention, and was recently recognized as one of the
two UNESCO World Heritage sites in Nova Scotia, and one of 15
UNESCO World Heritage sites in Canada. The Joggins Fossil Cliffs
reveal the world’s most complete fossil record of life in the
“Coal Age” when lush forests covered Joggins and much of the world's tropics, 300 million years ago.
The swamp forests produced massive quantities of organic matter that, over millions of years, created
the coal deposits for which this period of history is named. Embedded in 15 kilometres of accessible
coastal cliffs, rare fossils reveal details of life in the “Coal Age”.
One of the fastest growing tourism sub-segments
is geotourism - which sustains or enhances the
geographical character of a place (such as its
culture, environment, or heritage). Blue Beach
Fossil Museum is well positioned to help grow
Nova Scotia's reputation as a geotourism
destination

May 2010 BLUE BEACH FOSSIL MUSEUM: BUSINESS PLAN & ECONOMIC IMPACT STUDY
18
The Blue Beach Fossil Museum takes us even further back in time where newly discovered 350 million
year old fossils are seen for the first time. The Blue Beach Fossil Museum collection contains stunning
evidence about a controversial evolutionary moment - the origins of the first 'terrestrialized' tetrapods.
Blue Beach is the oldest site in the world where these early amphibian-like vertebrates are known to
have come onto the land. Visitors to the Blue Beach Fossil Museum can experience the ecosystems of an
old growth forest, a ravine, a salt water marsh, a tidal river, observe migratory birds, the highest tides in
the world, and explore what is now regarded as possibly the best and most significant fossil site in Nova
Scotia. In short, for the Geo-tourist, Blue Beach has a lot to offer
Tourism Trends in Nova Scotia
Please note that tourism and museum attendance data was collected from a number of sources. Unless
otherwise noted, this data was collected from Nova Scotia Department of Tourism, Culture and Heritage
publications including the 2010 Tourism Plan and online Research and Statistics reports.
Nova Scotia welcomed 2,102,000 visitors in 2009, an increase of one per cent over the previous year.
Amherst was the entry point for 1,206,400 (57%) visitors, with 607,600 arriving at Halifax Stanfield
International Airport. Fifty-five percent of all visitors to Nova Scotia in 2009 came from other parts of
Atlantic Canada, with 21 per cent coming from Ontario. It is notable that the number of tourists from
Ontario increased 4 per cent in 2009.
The number of visitors from other parts of Canada increased slightly, by 23,600 or one per cent. There
was a six percent decrease or 4,300 fewer overseas visitors. The downward trend of American visitors to
Nova Scotia continued in 2009, with 6,500 or three per cent fewer visitors from the United States.
Several factors have contributed to the decline in American visitors, including new passport regulations,
lower value of the U.S. currency, as well as ongoing economic conditions and the accompanying higher
than traditional levels of unemployment.
Overall in 2009, the majority of visitors to Nova Scotia, 88 per cent, came from other parts of Canada,
with nine per cent from the United States, and three per cent from overseas. The number of room
nights sold decreased by five per cent across the province. Although Nova Scotia gained visitors from
Atlantic Canada and Ontario, trip lengths from these markets tend to be shorter than those from farther
away, leading to fewer nights stayed. As well, visitors may have spent less while on vacation due to
weak economic conditions, which is typical in periods of recession.
The tourism activity in the Fundy Shore and Annapolis Valley has not kept pace with the provincial
averages. Room nights sold in the region have seen a decline of 8 per cent 370,600 in 2004 to 339,400 in
2008.
Efforts by the National Historic Site of Grand Pré to be recognized as a UNESCO World Heritage site and
news that The Bay of Fundy became one of the 28 finalists – and the only Canadian entry – in the new 7
Natural Wonders of the World contest represent potential positive impacts on tourism in the Fundy
Shore/Annapolis region.
May 2010 BLUE BEACH FOSSIL MUSEUM: BUSINESS PLAN & ECONOMIC IMPACT STUDY
19
Nova Scotia Visitor Profiles
Nova Scotia visitor profiles as identified in the provinces 2010 Tourism Plan.
The Canadian market
The Canadian market comprises primarily visitors from Ontario and east of Ontario. The single largest
market is Atlantic Canada, followed by Ontario, Western Canada and Quebec.
Atlantic Canada
Percentage of visitation: 53 Total number of visitors: 1,161,900
Average age of visitor: 35-44 Average length of stay: 4 nights
The Atlantic Canadian market has high awareness of Nova Scotia and most have visited previously. They
are interested in getaways, family vacations, local festivals and events, and general “things to do”.
Ontario
Percentage of visitation: 22 Total number of visitors: 437,800
Average age of visitor: 45-54 Average length of stay: 7.5 nights
The Ontario market is made up of couples over the age of 40 and families. They are primarily interested
in exploring our local culture, history, cuisine, and outdoor experiences.
Quebec
Percentage of visitation: 5 Total number of visitors: 91,600
Average age of visitor: 45-54 Average length of stay: 7.5 nights
While their interests are generally consistent with the Ontario market, Quebec visitors tend to have a
slightly higher interest in outdoor activities.
Western Canada
Percentage of visitation: 7 Total number of visitors: 151,500
Average age of visitor: 45-54 Average length of stay: 7.5 nights
These visitors also desire experiences ranging from immersion in our culture to outdoor activities and
local cuisine.
The United States market
Percentage of visitation: 9 Total number of visitors: 186,600
Average age of visitor: 55-64 Average length of stay: 6.5-8.5 nights

May 2010 BLUE BEACH FOSSIL MUSEUM: BUSINESS PLAN & ECONOMIC IMPACT STUDY
20
Visitors from the United States tend to be older couples. They are seeking cultural experiences, beautiful
scenery, and the ability to relax and escape routine. Most U.S. residents vacation within their own
country.
The Overseas market
Percentage of visitation: 3-4 Total number of visitors: 68,500
Average age of visitor: 35-64 Average length of stay: 10.8 nights
Summary of Nova Scotia Visitor Profiles
Atlantic
Canada
Ontario Quebec Western
Canada
Unite d
States
Overseas
Percentage of total visitation
to Nova Scotia
53% 22% 5% 7% 9% 4%
Total number of visitors 1,161,900 437,800 91,600 151,500 186,600 68,500
Average age of visitor 35-44 45-54 45-54 45-54 55-64 35-64
Average length of stay (in
nights)
4 7.5 7.5 7.5 6.5-8.5 10.8
Museum Attendance in Nova Scotia
The Nova Scotia department of Culture, Heritage, and Tourism publishes statistics for all Nova Scotia
Museum sites and most of the community based museums.
Data was collected from the online statistics, from reports
from the Community Museum Assistance Program (CMAP),
and through direct contact with departmental and
individual museum staff. The Nova Scotia Museum oversees
the operation of the 27 provincial museums. Local boards
operate 17 locally managed museums on behalf of the
Board of Governors, and 10 museums are directly managed.
In addition there are 71 community based museums of
various sizes, including the Joggins Fossil Institute. It should
be noted that of the 71 community based museums,
Joggins Fossil Institute is by far the largest, with the vast
majority of community based museums being smaller
historical or heritage sites. Major Nova Scotia
Palaeontology Museums include The Fundy Geological
Museum, The Nova Scotia Museum of Natural History, and
the Joggins Fossil Institute. Data specific to and inclusive of the Joggins Fossil Institute has not been
published.
Although many of Nova Scotia’s museums (such as the
Nova Scotia Firefighters’ Museum) have witnessed
attendance declines in recent years, they remain an
important part of the province’s tourism strategy
May 2010 BLUE BEACH FOSSIL MUSEUM: BUSINESS PLAN & ECONOMIC IMPACT STUDY
21
Last year 716,470 people visited a Museum in Nova Scotia (12 month period ending March 31, 2009).
Attendance at the 27 provincially operated Nova Scotia Museum sites declined 7% in the 6 year period
ending March 31, 2009, to a total of 527,480 visits. It should be noted that the Nova Scotia Museum
recorded a 12% drop in attendance in 2006. Over the last three years attendance has increased a total
of 5% and is trending upwards.
Attendance at Nova Scotia Museum sites in Fundy Shore and Annapolis Valley increased 13% over the
same 6 year period to a total of 55,400.
Attendance at the 71 community museums (excluding Joggins Fossil Institute and therefore mostly
smaller arts and culture museums) declined 57% in the same 5 year period, to a total of 188,990 visits.
The National Historic Site of Grand Pré has seen attendance drop sharply. In 1998, 65,115 visited the
Site, but by 2008, visitation had fallen to 28,516. This represents a 56% decrease over a ten year period.
Some of this decline can be attributed to the introduction of an entrance fee. Prior to 2003, visitors
could come and go free of charge. Grand Pré staff reported a significant drop off in bus tour business in
2009, a situation that will certainly be complicated by the cancellation of the ferry service from Maine to
Yarmouth. Attendance levels in 2009 were encouraging, as for the first time in the last decade
attendance levels held firm with no year over year decline. (Société Promotion Grand-Pré)
Visitors experience an array of nature tourism activities when visiting Nova Scotia: 70% of visitors do
leisure walking/hiking; 39% visit national and provincial historic sites; 44% observe nature; 33% visit
beaches exploring and beachcombing. (Department of Tourism, Culture and Heritage, Visitor Exit
Survey, 2004)
Four in ten Nova Scotians (39%) 15 years of age or older, or 300,000 people, visited a museum in 2005.
(Hill Strategies: Cultural Activities Provinces 2005)
About four in ten Nova Scotians visited an historic site in 2005 (42%, or 330,000 people), while fewer
Nova Scotia residents visited a zoo, aquarium, botanical garden, planetarium or observatory (28%, or
220,000 people). Forty‐eight percent of Nova Scotians visited a conservation area or nature park in
2005 (370,000 people). The percentage of Nova Scotia residents visiting an historic site is higher than
the Canadian rate (33%). The percentage of Nova Scotians visiting a zoo, aquarium, botanical garden,
planetarium or observatory is lower than the Canadian rate (34%). The attendance rate at conservation
areas or nature parks is similar to the Canadian rate (i.e., within the margin of error of the Nova Scotia
data. (Hill Strategies: Cultural Activities Provinces 2005)
Ages of individual visitors to all museums Nova Scotia in 2008-2009:
21% were age 17 and under
64% were between the ages of 18-64
15% were age 65 and over

May 2010 BLUE BEACH FOSSIL MUSEUM: BUSINESS PLAN & ECONOMIC IMPACT STUDY
22
Overall in the 12 month period ending March 31, 2009, 39% of all visitors to museums in Nova Scotia
were from in province. Twenty-two per cent were international visitors, 18% came from the United
States and 17% from other parts of Canada (4% unknown).
Fundy Geological Museum Attendance
The Fundy Geological Museum had 26,226 visits in 2008-2009, up 28% over the same six year period.
Paid attendance in 2008-2009 was 11,750 (14,476 of those visits attended special events such as
Mineral and Gem shows and did not pay regular admission).
In the 12 month period ending March 31, 2009 28% of all visitors were from in county, 28% were from
other parts of the province, 9% were from Atlantic Canada (NB, PEI, NL), 17% other Canada, 11% were
from the United States and 7% were international visitors.
Ages of individual visitors to the Fundy Geological Museum in 2008-2009:
32% were age 17 and under
54% were between the ages of 18-64
14% were age 65 and over
Profile of Potential Customers
Potential markets can be categorized as:
Palaeo-enthusiasts
Local residents
Tourists – General Public
School groups
Bus tours
Visitors to local museums, universities, wineries and festivals
Palaeontology Researchers and University Students
Seniors
1. Palaeo-enthusiasts
Amateur palaeontologists demand quality interpretive programs and active participatory experiences.
This group has the potential to become dedicated volunteers, financial supporters and dedicated
customers. The integrity of the site and accuracy of presentation are important considerations for
palaeo-enthusiasts.
2. Local Residents

May 2010 BLUE BEACH FOSSIL MUSEUM: BUSINESS PLAN & ECONOMIC IMPACT STUDY
23
This group is important to the overall success of any museum, particularly those located in more rural
settings. For example, 28% of all visitors to the Fundy Geological Museum in 2009 were from within
Cumberland County. In addition visits by local residents frequently include visiting guests from away.
3. Tourists – General Public
This group generally arrives independent of any organized tour. Many will arrive with little or no prior
knowledge of the site. Interest levels will vary, and they may stay for a short time or for hours. Exhibits
and activities must appeal to a broad base of ages and interests. Adult visitors will tend to be more
focused on curiosity and life experience. For families the primary goal is often to use the visit as an
educational experience for their children. Hands-on experiential learning and multi-media exhibits have
broad appeal to this group. Signage and partnerships with local tourist information centres and related
businesses will be a key to the exploitation of this market.
Increasingly, people of all ages are seeking tourism experiences that are engaging, interactive, and participatory.
Paleontology attractions like Blue Beach Fossil Museum are well positioned to capitalize on this trend.
4. School Groups
School visits are an important element of any successful museum. Programming must appeal to a wide
range of ages, vary in length and be flexible enough to be linked to specific curriculum needs at different
levels. It is important to provide a variety of hands on activities and experiences. Relationships with local
education partners must be developed and nurtured.

May 2010 BLUE BEACH FOSSIL MUSEUM: BUSINESS PLAN & ECONOMIC IMPACT STUDY
24
5. Bus Tours
Bus tours represent another significant market opportunity for BBFM. Program interests are similar to
other adult visitors, but the needs can be different given their mode of arrival. For example, an entire
bus load of people may wish to use washroom facilities before beginning organized activities.
6. Visitors to local museums, universities, wineries and festivals
Visitors that are in the region for other events such as to visit the National Historic site of Grand Pré,
local wineries, to attend the Apple Blossom Festival or for meetings/conferences at Acadia University
often look to attend museums or galleries in the area. The primary reason for visiting may have nothing
to do with an interest in palaeontology.
7. Palaeontology Researchers and university students
Even with minimal publicity, Blue Beach Fossil Museum has achieved considerable academic acclaim and
interest from around the world. Scientists from McGill University (Montreal), Mount Allison University
(Sackville, New Brunswick), Dalhousie and Acadia Universities (Nova Scotia), and as far away as Australia
and Sweden have visited the site in recent years. Researchers will visit the new museum to study major
Just minutes from Blue Beach is Acadia University, where the Museum Society envisions important strategic
partnerships with students and researchers alike. Several of Acadia’s (and the world’s) most respected professors
have visited Blue Beach and have expressed a keen interest in such alliances. A few of these endorsements can be
seen in the appendices of this report.

May 2010 BLUE BEACH FOSSIL MUSEUM: BUSINESS PLAN & ECONOMIC IMPACT STUDY
25
fossil finds, but are unlikely to join in the hunt for new fossils on the beach. Universities often send
student groups for field experience to centres such as the Blue Beach Fossil Museum.
8. Seniors
Recently retired seniors are increasingly looking for active, educational vacation experiences. Older
seniors with reduced mobility are still looking for opportunities to change up the vacation experience.
Seniors also visit with family members (often grandchildren).
* Customer Profiles modified from Canadian Fossil Discovery Centre, Feasibility Study, June 26, 2008
Public Programming
The BBFMS vision for public programming is driven by a desire to “push the boundaries and to set a new
standard for museums.” The Society seeks to offer an experience which is playful, artistic, interactive,
diverse, and educational. The Society understands that the design and development of public
programming is a process and not a single event. The Society’s initial vision for public programming at
the BBFM includes:
Interpretive Programming
Self Guided Tours: Many visitors to the BBFM will prefer to explore the exhibits and other public areas
on their own. Signage, brochures and museum/site maps will enrich the experience for these visitors.
Guided Tours: Trained guides will lead group tours through the museum. Custom tours will be available
for bus tours and other special interest groups.
School Programs and Tours: Guided tours customized to meet the curriculum needs for students from all
grade levels.
Day Camps for Children: Supervised day camps for children in the summer months.
Multi-Media Theatre
Video Presentations: A 20 minute loop video telling the main story at Blue Beach in a graphic manner-
the how’s and why’s of geology and evolution as illustrated by the Blue Beach fossils. This video will
explain where this story fits in the grand scheme of life’s history on earth.
Palaeo-Seminars for Adults: Lectures from museum staff and visiting speakers including special
showings or traveling shows hosted by the museum.
Special Events: Science shows, art, theatrical performances, storytelling, craft demonstrations, and
workshops that help bring science to life.

May 2010 BLUE BEACH FOSSIL MUSEUM: BUSINESS PLAN & ECONOMIC IMPACT STUDY
26
Outdoor Activities
Walking Corridor to Museum: The functional plan calls for solar panels leading from the parking lot to
the museum. Aside from their intended use as a source of renewable energy, these panels will form a
covered walkway. Info panels will line this corridor providing visitors with educational information and a
snapshot of the experience that lies ahead. These panels will emphasize the diversity of the site.
Nature Trails: Three nature trails with interactive signage will allow visitors to experience on old growth
forest, a salt marsh and the Fundy shoreline.
Bird watching: The site offers bird watching opportunities for individual visitors as well as the potential
for organized bird watching events.
Geocaching: Geocaching is already available at Blue Beach. The society will support and promote
geocaching at the site.
Rock Gardens: Gardens on the grounds will appropriate info panels.
Interactive Displays
3D Artwork: Large floor murals in the middle of the exhibit rooms will form a brilliant interactive
diorama showing Blue Beach as it was 350 million years ago.
Jaws of Death: A life size 16 foot replica of the giant predatory fish that is a highlight of the BBFM
collection.
Sculptured “Tetrapod” Replica Models: polyurethane and airbrushed models will help bring the
Tetrapods to “life” for museum visitors.
Other fish families, invertebrates, plants: Numerous displays to show the full flora/fauna of the site.
Footprint Room: A separate room designed to showcase the footprint collection at Blue Beach, including
“Lazy-Susan” style displays of rock slabs that the visitor operates to view panels full of tracks and related
information.
Pop-up Bubble: A small tunnel allowing visitors to crawl underneath the Tetrapod and Rhizodont
diorama and “pop up” into this world.
Background Soundtrack: In public areas visitors will hear sounds that simulate a primeval world
Outreach
Rock and Mineral Club: The museum will host and offer memberships in a new Rock & Mineral club for
the region.
Facilitate Incoming Researchers and field teams.
May 2010 BLUE BEACH FOSSIL MUSEUM: BUSINESS PLAN & ECONOMIC IMPACT STUDY
27
Traveling exhibits and lectures: Museum staff will take the show on the road to trade shows,
symposiums, as well as regional and national schools and post secondary institutions.
Rockhound Roundup: Annual event at Blue Beach to coincide with a similar event at Parrsboro.
Accessibility
The museum will be fully accessible for persons with disabilities. As well the site features an easily
accessible shoreline, a short walk down a gently sloping path directly behind the proposed museum site.
Gift Shop
This will be a retail gift shop for guests to shop for souvenirs and fossil memorabilia. It will also strive to
serve the niche market of geology enthusiasts in Nova Scotia with science kits, equipment and
miscellaneous items. It will be located close to the main entrance and at the end of the exhibit space,
such that it is the final stop on the interpretive trail. It should have an associated stock room
approximately 100 sq. ft. Anticipated list of items being sold in the gift shop includes:
Books and computer CDs, Crystal Making Kits, Science Kits, Dinosaur Models
Rock Polishing Kits and Supplies
Lapidary Equipment and Supplies
Rock Hammers, Chisels and Geological Hunting Accessories
Gems, Minerals, Fossils and Sea Shells
Geological Maps and Other Varieties
Posters, Bumper Stickers, Stick Pins
Varity of Toys i.e. Tetrapod-on-a-Wire, Sand Bucket Kits, Plastic Dinosaurs, etc
Loupes, Magnifiers, Cheap Binoculars and Hiking Sticks
Kites, Kite Kits, Puzzles and Games
T-Shirts, Sweatshirts, Hats with BBFM Logo (and related genre images)
Postcards, Playing Cards, Souvenirs
Jewellery and Arts and Crafts
Operational Planning
Human Resources
For the past 9 years the BBFM has been staffed by the volunteer efforts of Chris Mansky and Sonja
Wood. Planning for the new facility has placed a significant burden on these volunteer efforts which is
above and beyond the operation of the current facility. The role of the Board will be particularly
important as it guides the organization through the various stages of this project’s development. The
incorporation of the Blue Beach Fossil Museum Society resulted in the creation of a new Board. The
May 2010 BLUE BEACH FOSSIL MUSEUM: BUSINESS PLAN & ECONOMIC IMPACT STUDY
28
Board has also been successful in recruiting a number of highly experienced advisors. It is recommended
that the Society work towards the establishment of 2 main Board Committees to oversee the
implementation of the business plan:
Capital Project Committee
Management Committee
The Capital Committee will deal with all of the issues related to the development of the new site,
including securing capital and operating funds and the purchase of the assets of the existing Blue Beach
Fossil Museum. The Capital Committee of the Board will dissolve upon completion of the new facility.
The Management Committee will have responsibility for the implementation of the operational plan
(including recruitment and hiring of the Executive Director) and oversee the transition of the Board from
its current structure to a Policy Governance structure (to be in place when the new facility opens).
It is important to remember that membership on Board committees is not restricted to actual Board
members. It is common practice for advisors to sit on board committees.
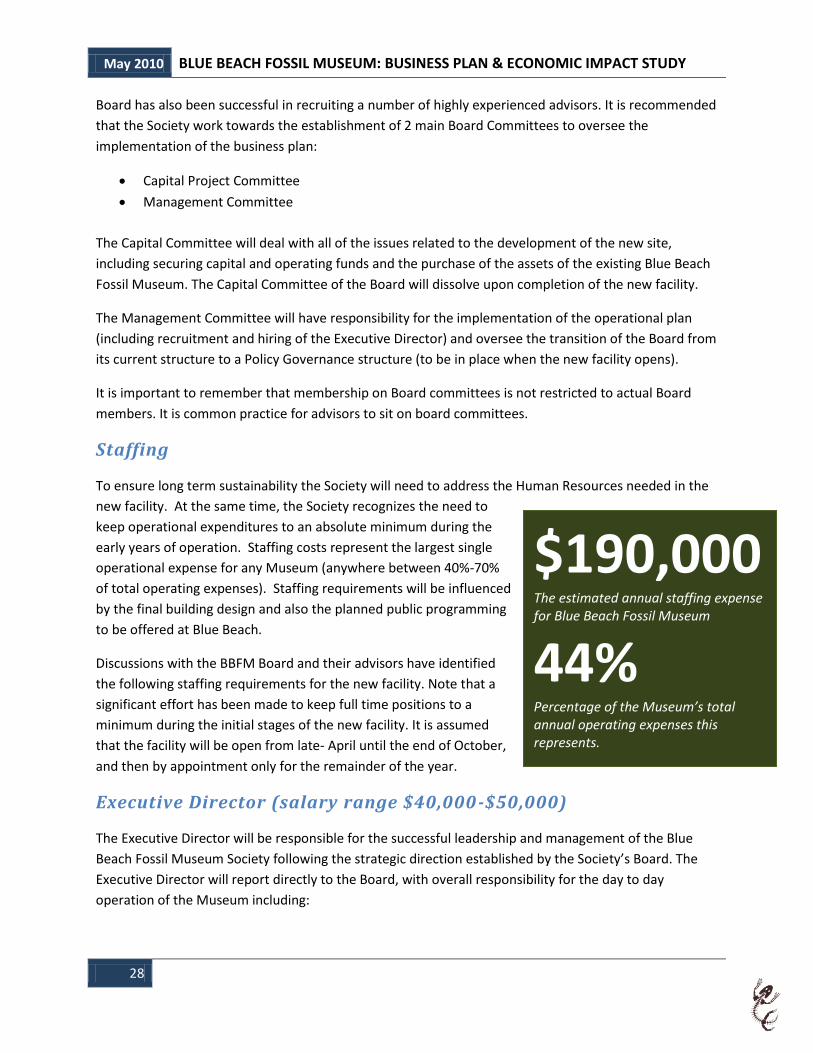
Staffing
To ensure long term sustainability the Society will need to address the Human Resources needed in the
new facility. At the same time, the Society recognizes the need to
keep operational expenditures to an absolute minimum during the
early years of operation. Staffing costs represent the largest single
operational expense for any Museum (anywhere between 40%-70%
of total operating expenses). Staffing requirements will be influenced
by the final building design and also the planned public programming
to be offered at Blue Beach.
Discussions with the BBFM Board and their advisors have identified
the following staffing requirements for the new facility. Note that a
significant effort has been made to keep full time positions to a
minimum during the initial stages of the new facility. It is assumed
that the facility will be open from late- April until the end of October,
and then by appointment only for the remainder of the year.
Executive Director (salary range $40,000-$50,000)
The Executive Director will be responsible for the successful leadership and management of the Blue
Beach Fossil Museum Society following the strategic direction established by the Society’s Board. The
Executive Director will report directly to the Board, with overall responsibility for the day to day
operation of the Museum including:
$190,000 The estimated annual staffing expense for Blue Beach Fossil Museum
44%
Percentage of the Museum’s total annual operating expenses this represents.

May 2010 BLUE BEACH FOSSIL MUSEUM: BUSINESS PLAN & ECONOMIC IMPACT STUDY
29
Leadership and Team development
Operational Planning and Management
All aspects of Financial Management
Personnel Management
Marketing and Public Relations
Fundraising
Curator of Palaeontology (salary range $35,000-$45,000)
The Curator will have broad responsibility for the documentation and care of the fossil collection at Blue
Beach. The Curator will also play a key role in developing plans for permanent and temporary exhibits,
and the development of education and outreach programs such as tours, interactive displays, and
workshops. The Curator will train interpretive guides and will be involved in guided tours and program
delivery. The Curator’s active participation in the delivery of programs is a key element to the short term
plan to minimize labour expenses.
Administrative Assistant/Receptionist (salary range $20,000 -
$30,000)
The Executive Director and Curator will require the support of an Administrative Assistant.
Responsibilities will include bookkeeping, assist in the preparation of grant applications and reporting,
gift shop management including purchasing and inventory of product, manage the reception area and
answer general enquiries. Depending upon workload, this position may be full time during months of
operation, and part-time from November through March.
Custodian ($25,000)
The Custodian will work full time April through October, and then on a part-time basis during the
months when only the administrative offices are in use.
Staffing (Seasonal $30,000-$40,000)
Seasonal staff (Visitor Service Attendants) will be required, primarily in the May to September time
period, to staff the admission counter and gift shop, serve as interpretive guides, as well as to perform
light custodial services and ground maintenance. These employees will be cross trained to provide
support as needed and shifts will be scheduled to ensure adequate staffing of the front end operation
and to accommodate lunch and coffee breaks for staff. A detailed estimate of estimate seasonal staff
requirements is found in Appendix B (prepared by Martha Grantham, Advisor to the BBFMS). The
society will seek wage subsidies from applicable Federal and Provincial Government departments, and
will also work to develop a volunteer base to assist when needed (especially during the first 1-2 years of
operation).
May 2010 BLUE BEACH FOSSIL MUSEUM: BUSINESS PLAN & ECONOMIC IMPACT STUDY
30
Potential for Strategic Alliances
The importance of strategic alliances for BBFMS cannot be overstated. Ken Adams, Curator of the Fundy
Geological Museum offers this advice:
“Over the years we have had the opportunity to share our own experience with other sites embarking on
the road to fame and fortune as a rock/fossil/mineral museum/attraction or tourist site. Lessons learned
through practical experience are hard earned and worth sharing as the way is fraught with interesting
experiences. The best advice I can give is to identify your partners and your role in your community's
future. Everyone benefits from your success. When you examine you business plan you should also be
examining your role within the regional tourism association, regional development agency, Bay of Fundy
Recommended experience, and on you go. How do you fit into their plans and how much time are you
willing to invest in developing linkages and partnerships? At the end of the day your greatest strengths
are the other attractions and services in your area”.
The plan to establish a world class Museum at Blue Beach leaves the Society well positioned to seek out
and develop strategic alliances. Such alliances will be critical to the success of the BBFM.
Kings Regional Development Authority
The partnership between the Joggins Fossil Institute and the Cumberland Regional Economic
Development Authority (“CREDA”) was a critical factor in the overall success of the museum
development process at Joggins. The Kings Regional Development Authority (“RDA”) assisted ACSBE in
the facilitation of the strategic planning process for the BBFM Society, and the potential clearly exists for
both organizations to work closely together during the upcoming phases of the project at Blue Beach.
The RDA can provide much needed business acumen and advice, as well as credibility and assistance in
discussions with various potential funding partners in both the public and private sector. It is also
important to note that Blue Beach is very close to Hants County. The development of a world class
museum at Blue Beach would clearly have an economic impact on the entire region, including
businesses in Hants County. Given this reality another potential partner is the Hants Regional
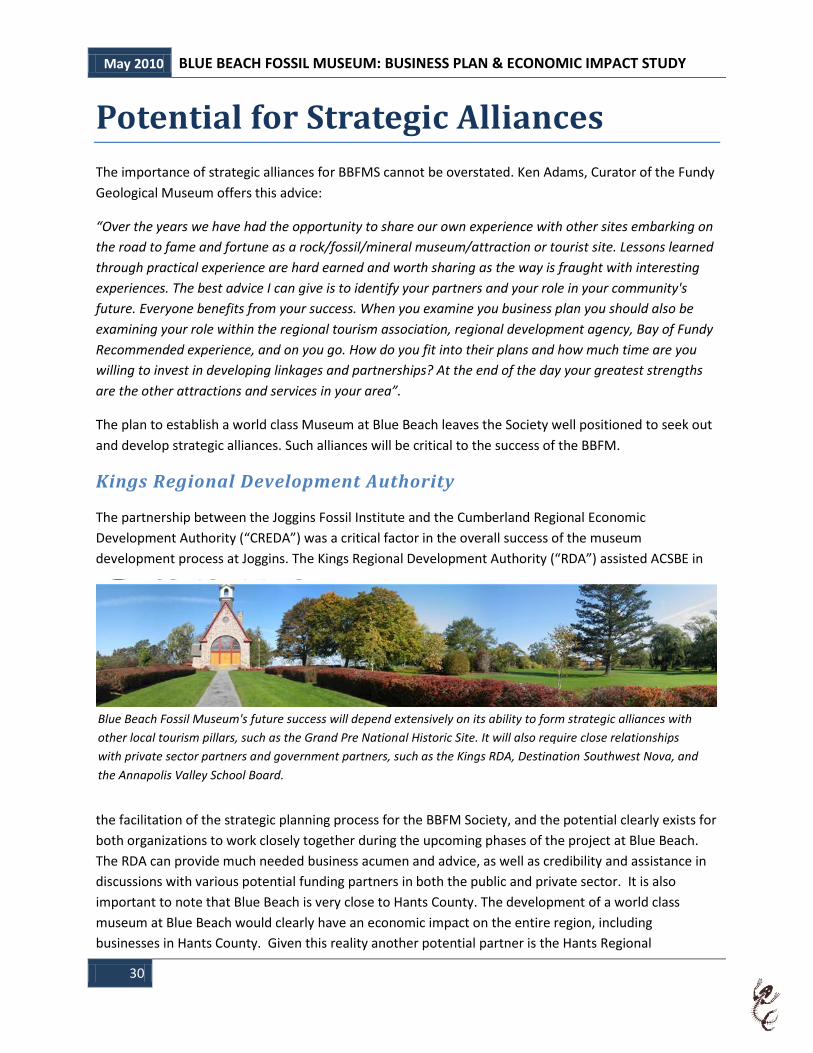
Blue Beach Fossil Museum's future success will depend extensively on its ability to form strategic alliances with
other local tourism pillars, such as the Grand Pre National Historic Site. It will also require close relationships
with private sector partners and government partners, such as the Kings RDA, Destination Southwest Nova, and
the Annapolis Valley School Board.

May 2010 BLUE BEACH FOSSIL MUSEUM: BUSINESS PLAN & ECONOMIC IMPACT STUDY
31
Development Authority.
Kings County Tourism
Kings County is home to the world’s highest tides, vineyards, orchards, Grand Pré Historical Site,
festivals, Provincial Parks, hiking trails, and a wide range of accommodation, including award winning
bed & breakfasts and numerous hotels with meeting facilities. All this a short drive from Halifax
Stanfield International Airport, as well as the Saint John to Digby ferry to the Southwest. The new
facility at Blue Beach would significantly enhance the area’s profile as a geotourism destination. The
Society will seek to build upon its existing relationship with Kings RDA to promote the regions
geotourism potential. In addition, the Society would be uniquely positioned to seek linkages and
partnerships with tour operators as well as tourist destination organizations in Kings County.
For example the Société Promotion Grand-Pré expressed a strong level of support for the proposed
facility at Blue Beach and has already extended an offer to explore partnership opportunities.
Collaboration may be as simple as cross promotion, or could include joint marketing and even packaging
vacation experiences to include a number of the regions sites and activities. Other community partners
could include Chamber of Commerce, Wineries, church groups, naturalist groups, tour bus companies,
and other corporate entities in the Annapolis Valley.
Post-Secondary Institutions
Over the past nine years the home-based museum has achieved significant academic acclaim, and in
doing so has established relationships with senior academics from Universities near and far. The Society
is uniquely positioned to explore strategic partnerships that would work to the benefit of the academic
institution and also to the Society. Board directors include respected academics from both Acadia and
Dalhousie Universities. A logical next step is the establishment of a Board working group that could
explore the potential for more formalized links with academic partners, again remembering that
members of this working group can be recruited from outside of the existing board to assist in the
development of these relationships.
School Districts
The BBFM has had increasing success attracting school groups, with more than 1,200 students visiting
the museum in 2009. An expanded facility will create additional opportunities to expand and formalize
working relationships with Nova Scotia School Districts. With a larger facility opportunities would exist
for formalized relationships with the Department of Education.
Sector Partners
As was highlighted in the “Market Profile” section of this report, a facility at Blue Beach would clearly
serve to strengthen Nova Scotia’s position as a world class destination for Geotourism. The Society
should seek opportunities to cross promote and to collaborate with organizations such as Joggins Fossil

May 2010 BLUE BEACH FOSSIL MUSEUM: BUSINESS PLAN & ECONOMIC IMPACT STUDY
32
Cliffs, the Fundy Geological Museum, Sydney Fossil Centre, Brule Fossil Museum (Tatamagouche),
Miner’s Museum (Springhill), Nova Scotia Museum of Natural History (Halifax) and the Atlantic
Geosciences Society. Given the size and proximity of the Halifax market, the Society could seek a partner
in Halifax that might sell tickets to the BBFM (as an example the Museum of Natural History). Other
potential joint initiatives include areas such as marketing, research projects, conferences, and media
relations.
Provincial Government
The Society’s plans for the establishment of a world class museum at Blue Beach align well with the
strategic objectives of the Nova Scotia Department of Tourism, Culture and Heritage. As an example,
key phrases from the 2010 Tourism Plan include:
Increased competition, changing consumers, and the need to standout
Value and experience are the key
Recent research conducted with the travel trade in the United States indicates that Nova Scotia
needs more experiential and hands-on learning opportunities for visitors.
Working with industry to developing authentic, sustainable, consumer-driven experiences
Target Visitor: The Cultural Enthusiast
The proposed facility a Blue Beach aligns with each of these
points. Changing consumers are looking for unique, hands-on
experiential learning opportunities. Industry and government
are looking to develop authentic, sustainable, consumer driven
experiences. This is what the facility at Blue Beach is all about;
a world class fossil museum, combining interactive displays with
beach walks to view fossil footprints, a stroll through an old
world forest, and a chance to see the highest tides in the world.
Key phrases for the Provinces Heritage Strategy (2008-2013)
include:
Our Goal: Acting for the public good, the Government
of Nova Scotia preserves, protects, promotes, and
presents the province’s natural and cultural heritage resources.
Value partnerships as an essential and effective means of achieving results
Heritage contributes to opportunities for lifelong learning
Is essential to the preservation, development, and sustainability of Nova Scotia’s communities
The Society (and primarily Sonja Wood and Chris Mansky) has to date assumed the full burden of
protecting one of the world’s oldest and most significant fossil finds. The Society’s plan for a new facility
at Blue Beach protects, promotes, and presents the provinces natural heritage, while contributing to
lifelong learning. The new facility would also serve as an anchor for an expanded focus on geo-tourism
“Recent research conducted with the travel trade in the United States indicates that Nova Scotia needs more experiential and hands-on learning opportunities for visitors.”
~ Nova Scotia Tourism Plan, 2010
May 2010 BLUE BEACH FOSSIL MUSEUM: BUSINESS PLAN & ECONOMIC IMPACT STUDY
33
both in Kings County and as part of a trio of world class sites in Nova Scotia. It is a truly collaborative
partnership that has the potential to make a significant contribution to the sustainability of the region.
Financial Analysis
Operating Projections
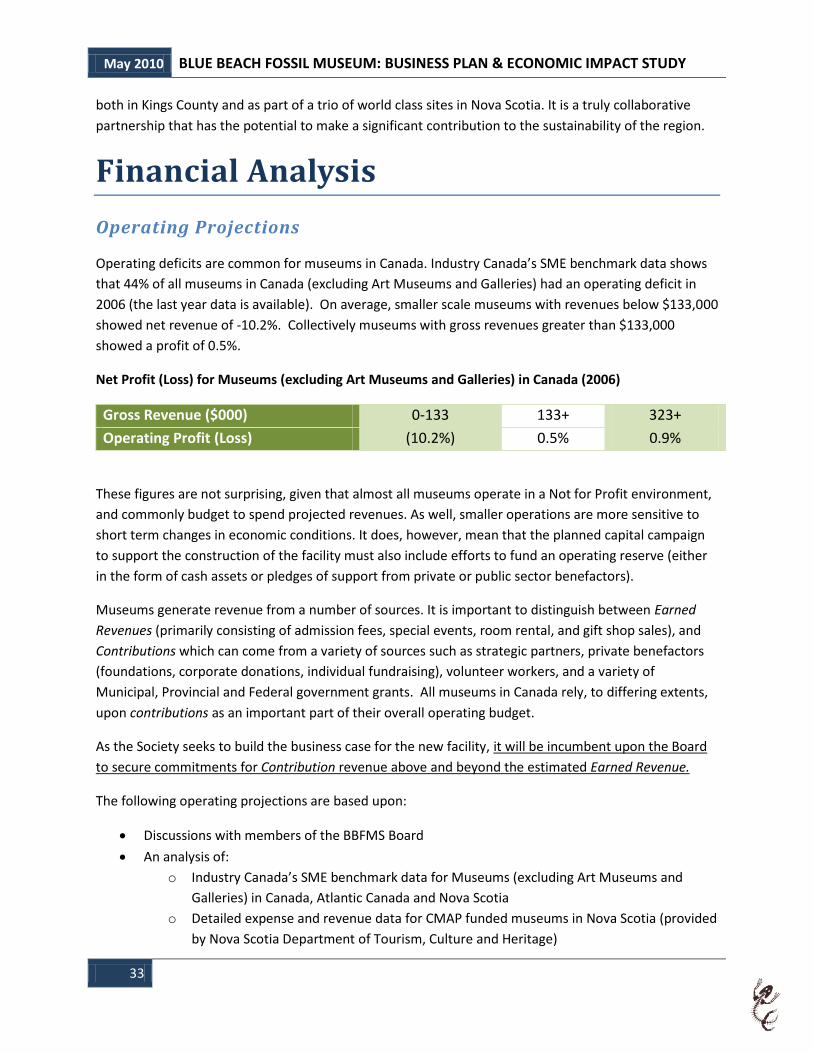
Operating deficits are common for museums in Canada. Industry Canada’s SME benchmark data shows
that 44% of all museums in Canada (excluding Art Museums and Galleries) had an operating deficit in
2006 (the last year data is available). On average, smaller scale museums with revenues below $133,000
showed net revenue of -10.2%. Collectively museums with gross revenues greater than $133,000
showed a profit of 0.5%.
Net Profit (Loss) for Museums (excluding Art Museums and Galleries) in Canada (2006)
Gross Revenue ($000) 0-133 133+ 323+
Operating Profit (Loss) (10.2%) 0.5% 0.9%
These figures are not surprising, given that almost all museums operate in a Not for Profit environment,
and commonly budget to spend projected revenues. As well, smaller operations are more sensitive to
short term changes in economic conditions. It does, however, mean that the planned capital campaign
to support the construction of the facility must also include efforts to fund an operating reserve (either
in the form of cash assets or pledges of support from private or public sector benefactors).
Museums generate revenue from a number of sources. It is important to distinguish between Earned
Revenues (primarily consisting of admission fees, special events, room rental, and gift shop sales), and
Contributions which can come from a variety of sources such as strategic partners, private benefactors
(foundations, corporate donations, individual fundraising), volunteer workers, and a variety of
Municipal, Provincial and Federal government grants. All museums in Canada rely, to differing extents,
upon contributions as an important part of their overall operating budget.
As the Society seeks to build the business case for the new facility, it will be incumbent upon the Board
to secure commitments for Contribution revenue above and beyond the estimated Earned Revenue.
The following operating projections are based upon:
Discussions with members of the BBFMS Board
An analysis of:
o Industry Canada’s SME benchmark data for Museums (excluding Art Museums and
Galleries) in Canada, Atlantic Canada and Nova Scotia
o Detailed expense and revenue data for CMAP funded museums in Nova Scotia (provided
by Nova Scotia Department of Tourism, Culture and Heritage)

May 2010 BLUE BEACH FOSSIL MUSEUM: BUSINESS PLAN & ECONOMIC IMPACT STUDY
34
o Historical museum attendance statistics in Nova Scotia (2002-2009)
Interviews and correspondence with current and past Museum Curators in Nova Scotia
Financial projections provided in a recent feasibility study for a proposed expansion to the
Canadian Fossil Discovery Centre in Modern, Manitoba
Five Year Earned Revenue Projection
The following table shows the projected Earned Revenue for BBFMS with first year admissions of 20,000
growing to 30,000 by year three of operation.
Five Year Earned Revenue Projection
Year 1 Year 2 Year 3 Year 4 Year 5
Admissions (# of visitors) 20,000 25,000 30,000 30,000 30,000
Earned Revenues ($)
Admission revenue 140,000 175,000 210,000 210,000 210,000
Gift shop gross revenue 60,000 75,000 90,000 90,000 90,000
Other Revenue 30,000 30,000 45,000 45,000 45,000
Total Earned Revenue 230,000 280,000 345,000 345,000 345,000
Earned revenue projections are based upon a number of assumptions noted here:
1. It is always challenging to estimate visitor levels for new facilities of this size and magnitude. The
admission numbers are based upon the market research presented earlier in this report. Final
projections were heavily influenced by a number of factors, including attendance levels at the
Joggins Fossil Institute, Fundy Geological Museum and also at the Grand Pré Historic site. Another
major consideration is the ease of access to Blue Beach for visitors from Halifax (local and tourists),
and the ease of accessibility of the beach itself. This projection assumes that by year 3 the BBFM
attendance will be similar to overall attendance levels at Grand Pré. The projected rise in attendance
will result from increased consumer awareness resulting from aggressive marketing, media coverage
and increased programming. These projections do not include any potential price increases over the
five year period, a possible source of additional revenues if needed.
2. Average admission fee of $7. This is based upon a range of admission fees ($5 for child and $9 for
adults). It should be noted that these figures do not include HST, and are slightly higher than the
Joggins Fossil Cliffs admission fees which range from $5-$8 including HST. The proposed price range
is consistent with museums of a similar size and nature in other parts of Canada.

May 2010 BLUE BEACH FOSSIL MUSEUM: BUSINESS PLAN & ECONOMIC IMPACT STUDY
35
3. Average gift shop revenue of $3 (before HST) per visitor. We believe an average of $3 per admission
is reasonable, taking into account our conversations with other museums in Nova Scotia (Fundy
Geological Museum averages $3 per admission). When we take into account the plans BBFMS have
for the gift shop, this is a relatively conservative estimate. As an example, in 2009 the Gift Shop at
Grand Pré Historical Site averaged $5.61 per admission in gift shop sales. This number is well above
industry standards and includes discounted liquidation of old stock that had been purchased in large
quantities for the Congrès Mondial Acadien in 2004.
4. Other revenue will result from guided tours, day camps, special events such as the Rock Hounders
Roundup, Theatrical performances, Travelling exhibits and seminars, sale of memberships in the
planned Rock and Mineral Club, as well as income from the on-site Café and sales of rock and
mineral equipment through the BBFM website. Other revenue is projected to increase as the facility
becomes better known and more programming is implemented.
Five Year Expense Projections
In projecting the annual operating expenses for the planned Museum at Blue Beach, it is important to
acknowledge the stage that the Society is at in the planning process. Future decisions by the Society,
particularly as they relate to the final building design, can and will have a significant impact on the actual
operating expenses of the museum. As an example, if the Society is successful in achieving LEED
certification for the new building, heating costs would be significantly impacted. In our discussions with
the BBFMS, the Board has expressed a willingness to adjust the Functional Plan (and related final
building design) to allow for operation of the facility within the projected operating budget.
The following table shows the projected five year revenue expense plan (excluding contributions from
public and private sector sources).
Five Year Revenue Expense Projection
Year 1 Year 2 Year 3 Year 4 Year 5
Earned Revenue 230,000 280,000 345,000 345,000 345,000
Expenses
Wages and Benefits 190,000 190,000 220,000 220,000 220,000
Building Occupancy 80,000 80,000 90,000 90,000 90,000
Repairs & Maintenance 15,000 15,000 15,000 15,000 15,000
Marketing/Promotion 25,000 25,000 25,000 25,000 25,000
Purchases for resale 40,000 47,500 55,000 55,000 55,000
Other Expenses 80,000 85,000 95,000 95,000 95,000
Interest Long term Debt 0 0 0 0 0
Total Expenses 430,000 442,500 500,000 500,000 500,000
Net Income before Contributions (200,000) (162,500) (155,000) (155,000) (155,000)

May 2010 BLUE BEACH FOSSIL MUSEUM: BUSINESS PLAN & ECONOMIC IMPACT STUDY
36
Expense projections are based upon the following assumptions:
1. Wage costs reflect the staffing estimates outlined earlier in this document. They include 8%
mandatory employment related costs plus an additional 4% (vacation pay) for part-time and
seasonal staff. Wage costs allow for modest increases in staffing and salaries as attendance
increases. It should be noted that personnel costs can potentially be reduced through the
recruitment of an active volunteer base (a clear trend in museums across Canada).
2. Purchases for resale equal to 50% of projected gift shop sales.
3. Building occupancy reflects all facility related costs including heat and utilities, and also is
projected to increase as a result of higher attendance numbers. This assumes the Society owns
the building and land free and clear with no long term debt.
4. Other Expenses include costs such as exhibit maintenance, research collections, administrative
overheads, telephone/telecommunications, professional and business fees, Insurance, as well as
fundraising expenses.
5. The Marketing and Promotion budget remains constant, with early year investments in web
design and electronic media being supplemented by other forms of promotion in future years.
The five year revenue expense projections for BBFMS show an operating loss (before contributions) of
$200,000 in year one and dropping to $155,000 by year three. On a percentage basis this means that
earned revenues are projected to represent between 53%-69% of the Society’s total revenue. This
compares favourably with other community based museums in Canada. For example:
Earned revenues for The Canadian Fossil Discovery Centre in Morden, Manitoba represented
only 22% of the 2007-2008 operating budget. Grants alone accounted for 72% of the Centre’s
revenue, with the Town of Morden providing $126,000 annually. This municipal support
represents 56% of total revenues.
The Courtney & District Museum and Palaeontology Centre operates with an admission by
donation policy. The vast majority of their $400,000 a year annual budget comes from charitable
donations and continued support from City of Courtenay, BC Hydro, British Columbia Arts
Council, Regional District of Comox-Strathcona, as well as ongoing support from the Province of
British Columbia through the Gaming and Lottery Commission.
Here in Nova Scotia data from the Community Museum Assistance Program- Summary of Annual
Reports shows that community based museums are also heavily dependent upon contributions to cover
operating expenses. As a function of total revenues, earned revenues represented 32%, government
contributions 50%, private sector contributions 10%, and 8% of revenues were transfers from operating
reserves. For these mostly smaller museums, support from the Community Museum Assistance
Program (CMAP) represented 23% of total revenues.

May 2010 BLUE BEACH FOSSIL MUSEUM: BUSINESS PLAN & ECONOMIC IMPACT STUDY
37
CMAP Summary of Annual Reports 2006-07
Sources of Revenue $ % of Total Revenue Earned Revenue 1,224,227 32% Gov’t Contributions
CMAP 876,310 Federal 373,550 Provincial 249,861 Municipal 450,400
Total Government 1,950,121 50% Private Sector 385,056 10% Transfers from Reserves 309,420 8%
Totals 3,868,824 100%
Comparison with Industry SME Benchmark Data
The following table contains data made available through Industry Canada’s SME Benchmarking Tool.
Based upon 2006 reporting, this tool provides us with accurate information on the financial
performance of museums in Canada. For comparison purposes we have looked at the aggregate data for
the top quartile Museums in all of Canada, Atlantic Canada and Nova Scotia. The top quartile
comparison is appropriate as the planned museum would fall into this category. Note that the total
aggregate expenditures for museums in Atlantic Canada and Nova Scotia is greater than 100% of
revenues, reflecting an overall net loss for these museums in 2006. Nationally, we see a tiny surplus
(essentially breakeven).
SME Benchmarks: Expenses as a percentage of Revenue (2006)
Canada Atlantic NS
Wages and Benefits 44.20% 43.60% 50%
Building Occupancy 17.30% 19.00% 23%
Repairs & Maintenance 2.70% 3.90% 6%
Marketing/Promotion 5.10% 5.80% 8%
Purchases for resale 7.50% 12.20% 5%
Other Expenses 23% 18% 15%
Totals 99.80% 102.30% 106%
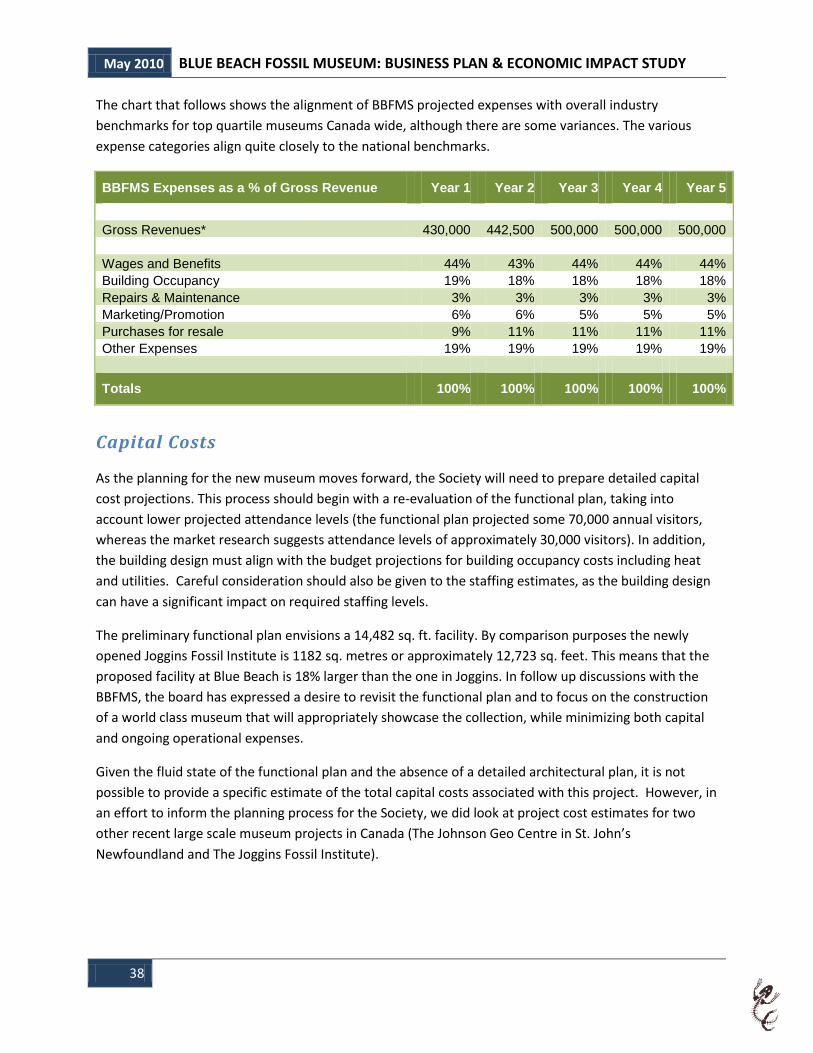
May 2010 BLUE BEACH FOSSIL MUSEUM: BUSINESS PLAN & ECONOMIC IMPACT STUDY
38
The chart that follows shows the alignment of BBFMS projected expenses with overall industry
benchmarks for top quartile museums Canada wide, although there are some variances. The various
expense categories align quite closely to the national benchmarks.
BBFMS Expenses as a % of Gross Revenue Year 1 Year 2 Year 3 Year 4 Year 5
Gross Revenues* 430,000 442,500 500,000 500,000 500,000
Wages and Benefits 44% 43% 44% 44% 44%
Building Occupancy 19% 18% 18% 18% 18%
Repairs & Maintenance 3% 3% 3% 3% 3%
Marketing/Promotion 6% 6% 5% 5% 5%
Purchases for resale 9% 11% 11% 11% 11%
Other Expenses 19% 19% 19% 19% 19%
Totals 100% 100% 100% 100% 100%
Capital Costs
As the planning for the new museum moves forward, the Society will need to prepare detailed capital
cost projections. This process should begin with a re-evaluation of the functional plan, taking into
account lower projected attendance levels (the functional plan projected some 70,000 annual visitors,
whereas the market research suggests attendance levels of approximately 30,000 visitors). In addition,
the building design must align with the budget projections for building occupancy costs including heat
and utilities. Careful consideration should also be given to the staffing estimates, as the building design
can have a significant impact on required staffing levels.
The preliminary functional plan envisions a 14,482 sq. ft. facility. By comparison purposes the newly
opened Joggins Fossil Institute is 1182 sq. metres or approximately 12,723 sq. feet. This means that the
proposed facility at Blue Beach is 18% larger than the one in Joggins. In follow up discussions with the
BBFMS, the board has expressed a desire to revisit the functional plan and to focus on the construction
of a world class museum that will appropriately showcase the collection, while minimizing both capital
and ongoing operational expenses.
Given the fluid state of the functional plan and the absence of a detailed architectural plan, it is not
possible to provide a specific estimate of the total capital costs associated with this project. However, in
an effort to inform the planning process for the Society, we did look at project cost estimates for two
other recent large scale museum projects in Canada (The Johnson Geo Centre in St. John’s
Newfoundland and The Joggins Fossil Institute).

May 2010 BLUE BEACH FOSSIL MUSEUM: BUSINESS PLAN & ECONOMIC IMPACT STUDY
39
Facility Square Feet Total Project Costs
Johnson Geo Centre 33,000 $14,000,000
Joggins Fossil Institute 12,723 $6,500,000
It is important to note that these costs include site development expenses which are always project
specific. It is anticipated that the overall capital costs for the development of the Museum at Blue Beach
will be between $4,000,000 and $6,000,000.
Valuing Assets of the Current Blue Beach Fossil Museum
The Society intends to purchase the land and other assets of the current Blue Beach Fossil Museum from
Sonja Wood and Chris Mansky. Ownership of the fossils found at Blue Beach is vested with the Province
of Nova Scotia (by legislation). The primary assets that the Society plans to purchase from the Sonja
Wood and Chris Mansky are land and intellectual property related to the curation, care, cataloguing and
documenting of the fossil collection at Blue Beach. The building lot includes +/-20,000 square feet of
waterfront property with direct and easy access to Blue Beach (development agreement with the
Municipality is in progress).
The value of the intellectual property is substantial, and results from the dedicated efforts of Chris
Mansky and Sonja Wood over the past fifteen years. To date the BBFM has catalogued:
o 1,700+ fossil tracks
o 300 miscellany
o 2,700+ bones
In addition there are a further 1,000 miscellany and 4,000 bones that have been examined and not
catalogued as they were not deemed of sufficient importance. The data collected is stored in three
specific searchable databases that can be queried biologically, numerically, or lithologically. These
databases are linked to a digital photo collection of 3,000+ pictures.
As well the current BBFM Library fills 70+ volumes with over 1000 research papers and texts. The library
is a comprehensive resource of nearly all the important or 'seminal' researches pertaining to the
Devonian-Carboniferous Ecosystems. Most of the papers and articles were obtained through inter-
library loans and many are quite rare. As a result, this library is seen as being one of a kind, and could
not be easily replicated. Analysis of this collection also provides BBFMS with valuable information that
can be used in future partnership development. For example, by perusing the Researchers list it is
possible to identify patterns of certain Institutions that consistently produce researchers that are within the
related 'field' of study.
As the purchase of the existing assets of the BBFM will be a non-arms length transaction it will be
necessary for the Society obtain independent fair market value appraisals of those assets.

May 2010 BLUE BEACH FOSSIL MUSEUM: BUSINESS PLAN & ECONOMIC IMPACT STUDY
40
It should also be noted that the entire fossil collection is currently being cared for and stored by Sonja
Wood and Chris Mansky. With floor to ceiling storage facilities in their family homestead and also on the
top floor of the museum, there is a total of 15,000 square feet of storage. As it will be necessary to
continue this storage during the project development and construction phase, and in keeping with the
Society’s strategic goal of protecting and preserving the collection, it would be reasonable for the
society to make a financial contribution towards the costs of storage and preservation.
Potential Funding Sources
The Municipality of Kings County currently provides the BBFMS with an annual operating grant of
$33,500 (3 year commitment). Federal/Provincial government contributions are possible through a
variety of agencies including, but not limited to:
ACOA: Potential source of infrastructure funds, support for marketing and professional
development activities, project based funding.
Nova Scotia Department of Economic Development: Numerous programs including wage
subsidies for student employees.
Community Museum Assistance Program: Provides operating grants to approved museums.
Municipality of the County of Kings: Currently provides annual grant to BBFMS.
Kings Regional Development Authority: Assistance may come in the form of in-kind
contributions in the form of assistance with promotion, outreach, bookkeeping, advice on
business strategies and partner relations.
Service Canada: Numerous wage subsidy programs
Museum Assistance Program (Federal): Project based- will fund exhibit development programs.
NS Museum Research Grants: A research project concerning significant Nova Scotia fossil
occurrences, specimens, species, Palaeoecology, or stratigraphic Palaeontology.
Natural Resources Canada (Federal): Funding for energy-efficient and sustainable development
related projects
Canada Council grants for research
It should not be assumed that contributions will be secured from all of these agencies, as many of these
programs are project based, dependent upon an annual application process, and subject to changes in
public policy. Gaining operational support from the Community Museum Assistance Program (CMAP)
may be particularly challenging given the current fiscal environment. Smaller community based
museums face sharply declining attendance and related drops in revenue, making them even more
dependent upon CMAP funding. While a case can be made for channelling provincial dollars to support
the larger and more sustainable operations, reduced support for smaller museums in Nova Scotia would
clearly result in closures.
May 2010 BLUE BEACH FOSSIL MUSEUM: BUSINESS PLAN & ECONOMIC IMPACT STUDY
41
In addition to public sector support, many Museums rely on private foundations for major contributions
to Capital Campaigns and also to offset annual operating deficits. Private sector contributions for
museums come from foundations, corporate and individual donations, fundraising, and volunteer work
at the museum. This is one area where significant potential exists for contributions as the Blue Beach
story becomes better understood by potential donors.
Economic Impact Analysis
Introduction
The economic impacts associated with the Blue Beach Fossil Museum will come from two basic sources.
The first source relates to the construction phase of the museum. By its nature this phase is short term
and is estimated to last one year. The second source of economic impacts emanating from the Blue
Beach Fossil Museum comes from spending from visitors who are attracted to the area to visit the
museum. These impacts are on-going and are expressed on an annual basis. The impacts are discussed
in turn in what follows. The study area for the economic impact investigation is considered to be area of
eastern Kings County and western Hants County. For the purposes of this study the local area is defined
as a 30 minute drive by car form the museum site.
What is an Economic Impact Study?
An Economic Impact Study (EIS) involves estimation of incremental economic activity that results from a
specific economic stimulus. Economic impact studies can be applied to various types of economic
stimuli, however, the remainder of the discussion will focus on the application of the analysis to tourism
related activities.
The focus of a tourism related EIS is typically on expenditures made by non-resident visitors to a
particular event or facility. In order to fully assess the economic impact of an activity or facility, all
expenditures related to the activity or facility, such as accommodations, travel related expenses or
shopping purchases which occur within the study area need to be considered. In addition, secondary or
multiplied effects should be examined when possible.
Direct economic impacts occur when non-resident visitors purchase goods or services within the study
area while visiting the specific facility or event. These expenditures are received directly by local
businesses. Indirect impacts occur when a portion of the tourist revenue received by local businesses is
spent on local inputs of goods and services. Induced impacts occur when the incomes created through
the direct and indirect impacts are recycled throughout the local economy, generating additional
activity. Although a clear distinction can be made between induced and indirect economic impacts, they
are often considered to be a singular effect, referred to simply as spin-off or multiplied impacts. The

May 2010 BLUE BEACH FOSSIL MUSEUM: BUSINESS PLAN & ECONOMIC IMPACT STUDY
42
Figure 1 illustrates the basic sequence of events resulting from an injection of funds into a local
economy.
Figure 1: The impact of Non-resident Expenditures on Local Economic Activity
Construction Impacts
Total construction expenditures for the Blue Beach Fossil Museum are estimated at $5 million and
would take place over a one year period. The following economic impact assumes that all construction
funding is incremental (new money) to the area; that construction will be done by a local company; and
that expenditures for components fixtures etc. are made through local suppliers. To the extent that
construction finds are not incremental and non-local companies are involved, the impacts would be
accordingly diminished.
Construction expenditures less federal and provincial sales taxes circulate through the local economy
creating income and more re-spending. The input-put model captures such re-spending, as well as
additional leakages. The details of the input-output model used in this study are contained in Appendix I.
The total (direct/indirect/induced) impacts on the Annapolis Valley economy generated from the
construction of the Blue Beach Fossil Museum appear in Table 1. Total spending generated from the
museum construction is $5.6 million. Not surprisingly, the biggest impact is in the Construction sector
with total multiplied spending of $4.3 million, followed by Finance Insurance and Real Estate ($331,000),
Retail and Wholesale Industries ($205,000) and Business Services ($120,000). Total income
Money is injected into a local economy
due to expenditures by non-residents
stimulating the local economy.
Multiplier effect stimulates further
spending and employment (indirect and
induced impacts)
Local economic activity is increased.

May 2010 BLUE BEACH FOSSIL MUSEUM: BUSINESS PLAN & ECONOMIC IMPACT STUDY
43
(wages/salaries/profits) generated in the local economy are estimated at approximately $2.2 million.
Dividing the resulting income by the Nova Scotia average (full time) wage of $36,500 (Statistics Canada,
2009) yields approximately 60 full time job equivalents.
Table 1: Construction Impacts Blue Beach Fossil Museum
Construction Total Incremental Impacts $2,010
Division A - Agricultural and related service industries $44,358
Division B - Fishing and trapping industries $502
Division C - Logging and forestry industries $38,274
Division D - Mining (including milling), quarrying and oil wells $17,409
Division E- Aggregate Manufacturing $39,740
Division F – Construction industries $4,274,103
Division G - Transportation and storage industries $58,125
Division H - Communication and other utility industries $89,040
Division I - Wholesale trade industries $204,706
Division J - Retail trade industries $210,782
Division K/L - Finance, Insurance, Real Estate $330,666
Division M - Business service industries $119,708
Division O - Educational service industries $743
Division P - Health and social service industries $32,698
Division Q - Accommodation, food/beverage service industries $66,009
Division R - Other Services $83,499
Industry Sum $5,610,365
Household Income $2,169,889

May 2010 BLUE BEACH FOSSIL MUSEUM: BUSINESS PLAN & ECONOMIC IMPACT STUDY
44
Estimating Operating Impacts
Operating impacts will come from two sources. The first is combined annual contributions of $150,000 per year from Federal/Provincial Government programs as well as private foundations. It is assumed that this grant will be apportioned as 50 percent wages/salaries, and equal (16.67%) to each of the Communication and Utilities Industry, Business Services Industry and the Fire, Insurance and Real Estate Industries. The multiplied impacts of the annual operating expenses will be added to the annual impact of visitor spending. An estimate of visitor spending is discussed in what follows.
Projected Visitor Numbers
The projected number of admissions to the Blue Beach Fossil Museum is 20,000 per year. This estimate
is discussed in the Operating Projections section of this document. Nearby Grand Pré National Park
visitor statistics indicate that approximately five percent of the admissions are people who live within a
30 minute drive of the attraction. Such persons are excluded from the economic impact analysis
predicated on the notion that their spending is not incremental and does not represent “new money”
injected into the local economy. Subtracting five percent for the estimated admissions of 20,000 gives
an estimate on 19,000 non-local visitors as a base case scenario. Creating a range by adding and
subtracting 25% for the base case scenario (and rounding to the nearest thousand) provides a high case
scenario of 24,000 visitors and a low case scenario of 14,000 visitors. Estimates of projected spending
from these visitors makes use of a 2008 survey conducted of visitors to Grand Pré National Park. The
survey and the spending estimates are discussed in what follows.
Visitor Spending Patterns
Anticipated visitor origins and visitor expenditures related to the Blue Beach Fossil Museum are based
on the recent survey at Grand Pré National Park. The survey was conducted in the summer of 2008 and
284 surveys were completed. The respondent’s geographical distribution of the survey respondents is
illustrated in the right had side of Figure 2. The left hand side of Figure 2 shows the actual distribution
of visitors to Grand Pré National Park in the year prior to the survey (2007).

May 2010 BLUE BEACH FOSSIL MUSEUM: BUSINESS PLAN & ECONOMIC IMPACT STUDY
45
Figure . Geographical distribution of survey respondents, 2008 and Visitors 2007
Actual distribution of visitors, 2007 Distribution of survey respondents, 2008
Of the survey respondents, 75% were from outside of Nova Scotia, with the largest portion being from
the United States (34%), followed closely by Non-Atlantic Province Canadians (29%), Non- Nova Scotia
Atlantic (7%) and Non-USA International (3%) The geographical distribution of survey respondents is
reflective of the actual geographical distribution of visitors to the park (collected by Parks Canada), as
shown by comparing the geographical distribution of survey respondents to the geographical
distribution of park visitors in the figure above. Based on the similar distribution, it can be concluded
that the survey sample is an reasonable estimate of the population of those who visit Grand Pré. The
geographical distribution of visitors for the Blue Beach Fossil Museum is projected to mirror the actual
distribution of Grand Pré Park in 2007. This distribution was chosen over the 2008 survey distribution
based on the relative number of observations (approximately 30,000 visitors) compared to the survey
(approximately 300 observations). Furthermore 2007 was the last year in which Grand Pré National Park
collected data with geographic distribution categories that were the same as those used in the 2008
survey. This is important because the surveys data will be used to estimate visitor spending.. The
projected numbers of visitors, delineated by type, are shown in Table 2.

May 2010 BLUE BEACH FOSSIL MUSEUM: BUSINESS PLAN & ECONOMIC IMPACT STUDY
46
Table 2: Projected Visitor Numbers for the Blue Beach Fossil Museum
Number of Visitors Non-Local
Nova Scotia
Non-NS
Atlantic
Provinces
Non-Atlantic
Canada
Non-
Canadian
Total
30% 4% 35% 31% 100%
High Case 7,200 960 8,400 7,440 24,000
Base Case 5,700 760 6,650 5,890 19,000
Low Case 4,200 560 4,900 4,340 14,000
The figures in Table 2 relate to the number of persons, whereas the spending figures in the survey relate
to expenditures per party (groups travelling/staying together). Projected visitor numbers are converted
visitor parties based on the survey data which generated an average party size of 2.2 person. This figure
did not vary significantly across visitor type and was computed across all visitor groups to minimize the
sampling error. The number of visiting parties delineated by visitor type appears in Table 3.
Table 3: Projected Visitor Parties for the Blue Beach Fossil Museum
Number of Visiting
Parties
Non-Local
Nova Scotia
Non-NS
Atlantic
Non-NS
Atlantic
Non-
Canadian
Total
30% 4% 35% 31% 100%
High Case 3,273 436 3,818 3,382 10,909
Base Case 2,591 345 3,023 2,677 8,636
Low Case 1,909 255 2,227 1,973 6,364
Average visitor spending per party from Grand Pré will be used as a proxy for projected spending by
visitors to the Blue Beach Fossil Museum. In order to establish the average incremental (attributable to
the attraction) only surveys denoting the following characteristics were considered: (1) Surveys which
reported their primary reason for visiting the area was for the historic site. (2) Surveys which reported
the site’s importance in their trip to the area as being equal to or greater than four on a scale of 1 to 10.
Spending by expenditure category and delineated by visitor type is shown in the Table 4.

May 2010 BLUE BEACH FOSSIL MUSEUM: BUSINESS PLAN & ECONOMIC IMPACT STUDY
47
Table 4: Projected Average Per Party Expenditures by Visitor Type
Expenditure Categories Non-Local
Nova Scotia
Non-NS
Atlantic
Non-Atlantic
Canada
Non-
Canadian
Accommodations $33.06 $42.67 $38.19 $43.77
Inclusive travel package $0.79 $0.75 $0.44 $0.13
Meals and beverages in
restaurants
$35.02 $27.13 $27.09 $36.71
Groceries/liquor at stores $9.84 $8.10 $9.36 $4.47
Vehicle rental $1.06 $0.00 $1.10 $10.03
Other shopping purchases $11.23 $25.95 $13.53 $18.66
Operation of private vehicle $14.04 $14.43 $11.41 $6.30
Recreation and entertainment $11.51 $9.66 $11.95 $10.12
Other $0.47 $0.00 $1.17 $0.23
Total $117.01 $128.68 $114.24 $130.43
Combining the visitor projections (Table 3) and the estimated expenditures (Table 4) gives the total
estimated visitor spending. These figures are presented separately for the high/base/low case scenarios
respectively in Table 5 thorough 7. Total direct visitor expenditures range from $1.3 million (high case)
to $768,000 (low case), with a base case value of $1.0 million. As would be expected, direct
expenditures are concentrated in the accommodations (base case = $330,000), food and beverage
services (base case 280,000) and retail trade industries (base case = $130,000).
Table 5: High Case – Projected Direct Expenditures by Visitor Type
Visitor Group Non-Local
Nova Scotia
Non Nova
Scotia – Atlantic
Non-Atlantic
Canada
Non-
Canadian
Total
Accommodations $108,191 $18,620 $145,835 $148,030 $420,676
Inclusive travel package $2,581 $327 $1,689 $438 $5,036
Meals and beverages in
restaurants
$114,607 $11,836 $103,419 $124,157 $354,019
Groceries/liquor at stores $32,202 $3,535 $35,734 $15,124 $86,595
Vehicle rental $3,469 $0 $4,210 $33,928 $41,607
Other shopping purchases $36,741 $11,324 $51,668 $63,096 $162,828
Operation of private
vehicle
$45,936 $6,295 $43,562 $21,309 $117,100
Recreation and
entertainment
$37,655 $4,215 $45,632 $34,222 $121,724
Other $1,544 $0 $4,455 $783 $6,781
Total $382,926 $56,151 $436,203 $441,086 $1,316,367
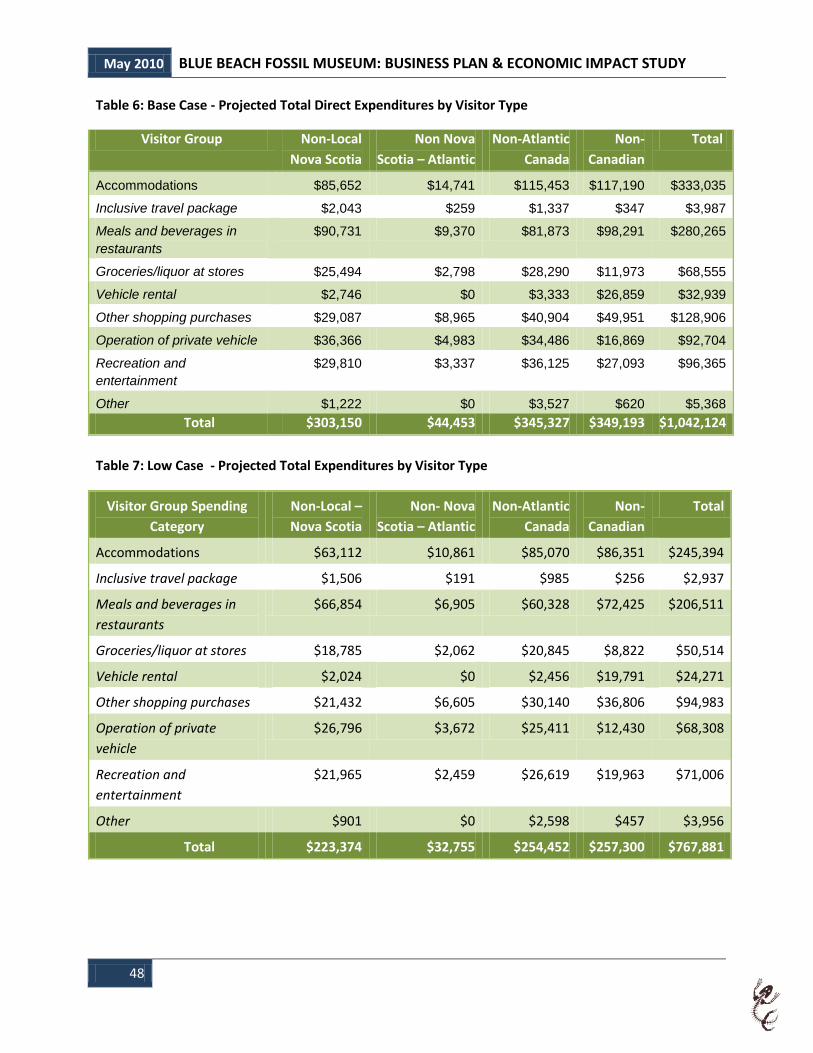
May 2010 BLUE BEACH FOSSIL MUSEUM: BUSINESS PLAN & ECONOMIC IMPACT STUDY
48
Table 6: Base Case - Projected Total Direct Expenditures by Visitor Type
Visitor Group Non-Local
Nova Scotia
Non Nova
Scotia – Atlantic
Non-Atlantic
Canada
Non-
Canadian
Total
Accommodations $85,652 $14,741 $115,453 $117,190 $333,035
Inclusive travel package $2,043 $259 $1,337 $347 $3,987
Meals and beverages in
restaurants
$90,731 $9,370 $81,873 $98,291 $280,265
Groceries/liquor at stores $25,494 $2,798 $28,290 $11,973 $68,555
Vehicle rental $2,746 $0 $3,333 $26,859 $32,939
Other shopping purchases $29,087 $8,965 $40,904 $49,951 $128,906
Operation of private vehicle $36,366 $4,983 $34,486 $16,869 $92,704
Recreation and
entertainment
$29,810 $3,337 $36,125 $27,093 $96,365
Other $1,222 $0 $3,527 $620 $5,368
Total $303,150 $44,453 $345,327 $349,193 $1,042,124
Table 7: Low Case - Projected Total Expenditures by Visitor Type
Visitor Group Spending
Category
Non-Local –
Nova Scotia
Non- Nova
Scotia – Atlantic
Non-Atlantic
Canada
Non-
Canadian
Total
Accommodations $63,112 $10,861 $85,070 $86,351 $245,394
Inclusive travel package $1,506 $191 $985 $256 $2,937
Meals and beverages in
restaurants
$66,854 $6,905 $60,328 $72,425 $206,511
Groceries/liquor at stores $18,785 $2,062 $20,845 $8,822 $50,514
Vehicle rental $2,024 $0 $2,456 $19,791 $24,271
Other shopping purchases $21,432 $6,605 $30,140 $36,806 $94,983
Operation of private
vehicle
$26,796 $3,672 $25,411 $12,430 $68,308
Recreation and
entertainment
$21,965 $2,459 $26,619 $19,963 $71,006
Other $901 $0 $2,598 $457 $3,956
Total $223,374 $32,755 $254,452 $257,300 $767,881

May 2010 BLUE BEACH FOSSIL MUSEUM: BUSINESS PLAN & ECONOMIC IMPACT STUDY
49
Estimating Total Multiplied (Direct/Indirect/Induced) Impacts
Converting Expenditures to Final Demand Changes
Before the multiplied impacts of visitor expenditures can be estimated, direct visitor expenditures need
to be converted to final demand changes by accounting for wholesale, retail and transportation margins,
as well as identifying direct leakages related to non-local production and taxes. Details of the
conversions of visitor expenditures to final demand changes follow.
Sales Tax Adjustments
Most goods and services in Nova Scotia are subject to the Harmonized Sales HST tax of 15 percent
collected at the point of sale and remitted to the federal and provincial governments. The HST is a value
added tax. Retailers add it to the price of goods sold. Businesses pay the HST on goods received, charge
HST on their sales and remit the difference to the government. Some products, such as food items
purchased at grocery stores are exempt from the HST. There is no HST charged on gasoline retailed to
consumers. For gasoline, all taxes are levied at the producer level and included in the cost of gas sold to
retailers. To account for HST leakages outside the local economy, tourist expenditures for all categories are
reduced by the applicable HST rate when converting sales figures to local final demand.
Trade Margin Adjustments
Visitor expenditures are equal to output attributable to visitors for all tourism expenditures except that
associated with retail trade. Output generated by tourist retail spending is limited to the trade margins
(the difference between the price charged for the good and the cost of acquiring that good). The
margining process involves multiplying the value of retail sales by the wholesale and retail margins
wholesale and retail trade industries respectively. The aggregate retail trade industry margin (adjusted
for direct leakages via location quotients) is 25.7 percent (of the purchaser price) and the aggregate
wholesale trade margin is 14.6 percent. Retail sales expenditures, less wholesale and retail trade
margins, are usually adjusted for transportation margins with the remainder (the producer price) being
apportioned to the producing industry (usually manufacturing). In this model, since all goods sold are
assumed to be imported into the region, leakages associated with transportation margins and non-local
production are accounted for by treating the cost of the goods sold as imports.
After making the final demand adjustments previously discussed, the high, base and low case direct
visitor expenditures of $1.3 million, $1.0 million and $768,000 produce final demand changes of
$908,000 (high case), $775,000 (base case) and $338,000 (low case). The final demand figures,
delineated by expenditure type are then injected into the input output model. Tables 8 through 10
display the total (multiplied) impacts (delineated by industry) for the high/base/low case scenarios
respectively combining visitor expenditures and the $150, 000 Province of Nova Scotia Operating Grant.
The high/base/low case scenarios project total annual expenditures in the local economy of $1.5
million/$1.2million/$936,000 respectively and income in the range of $700,000/$580,000/$460,000.
Predictably the Accommodation/Food & Beverage Service sector is the primary beneficiary, producing

May 2010 BLUE BEACH FOSSIL MUSEUM: BUSINESS PLAN & ECONOMIC IMPACT STUDY
50
(base case) annual sales of $560,000, followed by Other Services (Recreation/Entertainment admissions)
of $137,000 and Retail Sales of $134,000.
Table 8: High Case: Projected Total Direct/Indirect/Induced Expenditures
Industry
Total
Expenditures
Division A - Agricultural and related service industries $12,989
Division B - Fishing and trapping industries $491
Division C - Logging and forestry industries $3,288
Division D - Mining (including milling), quarrying and oil well industries $1,207
Division E- Agg Manu $42,970
Division F - Construction industries $11,647
Division G - Transportation and storage industries $24,444
Division H - Communication and other utility industries $67,239
Division I - Wholesale trade industries $90,065
Division J - Retail trade industries $166,294
Finance, Insurance, Real Estate $151,237
Division M - Business service industries $45,783
Division O - Educational service industries $242
Division P - Health and social service industries $10,652
Division Q - Accommodation, food and beverage service industries $711,075
Division R - Other Services $173,084
Total: $1,512,706
HH Income: $705,105

May 2010 BLUE BEACH FOSSIL MUSEUM: BUSINESS PLAN & ECONOMIC IMPACT STUDY
51
Table 9: Base Case: Projected Total Direct/Indirect/Induced Expenditures
Final demand change 775,000
Industry
Total
Expenditures
Division A - Agricultural and related service industries $10,434
Division B - Fishing and trapping industries $394
Division C - Logging and forestry industries $2,657
Division D - Mining (including milling), quarrying and oil well industries $1,030
Division E- Agg Manu $34,277
Division F - Construction industries $9,657
Division G - Transportation and storage industries $19,793
Division H - Communication and other utility industries $59,436
Division I - Wholesale trade industries $72,080
Division J - Retail trade industries $133,718
Finance, Insurance, Real Estate $128,749
Division M - Business service industries $42,039
Division O - Educational service industries $200
Division P - Health and social service industries $8,829
Division Q - Accommodation, food and beverage service industries $563,691
Division R - Other Services $137,696
Total: $1,224,680
HH Income: $584,400

May 2010 BLUE BEACH FOSSIL MUSEUM: BUSINESS PLAN & ECONOMIC IMPACT STUDY
52
Table 10: Low Case: Projected Total Direct/Indirect/Induced Expenditures
Industry
Total
Expenditures
Division A - Agricultural and related service industries $7,878
Division B - Fishing and trapping industries $298
Division C - Logging and forestry industries $2,027
Division D - Mining (including milling), quarrying and oil well industries $853
Division E- Agg Manu $25,585
Division F - Construction industries $7,667
Division G - Transportation and storage industries $15,141
Division H - Communication and other utility industries $51,633
Division I - Wholesale trade industries $54,094
Division J - Retail trade industries $101,141
Finance, Insurance, Real Estate $106,261
Division M - Business service industries $38,295
Division O - Educational service industries $159
Division P - Health and social service industries $7,006
Division Q - Accommodation, food and beverage service industries $416,306
Division R - Other Services $102,309
Total: $936,653
HH Income: $463,694
Summary
The Blue Beach Fossil Museum will generate economic impacts for the local economy, initially through
the construction of the museum and on an annual basis by attracting visitors. The museum is estimated
to cost $5 million. These expenditures generate incremental economic activity in the eastern
Kings/western Hants county economy to the degree that funds to construct the museum are
incremental (that is to say that in absence of the facility, these funds would not be attracted to this
area). If all of the $5 million construction expenditures is indeed “new money,” (assuming HST leakages)
direct/indirect/induced spending would total $5.6 million and generate $2.2 million in income
(wages/profits), the equivalent of approximately 60 person years of employment.
May 2010 BLUE BEACH FOSSIL MUSEUM: BUSINESS PLAN & ECONOMIC IMPACT STUDY
53
The museum is expected to receive annual contributions from Federal/Provincial Government programs
and private foundations of $150,000 per year, and is projected to attract approximately 20,000 visitors
per year, 19,000 of which will come from beyond a 30 minute drive from the museum (and are
therefore classified as visitors). The total annual (direct/indirect/induced) spending generated by the
operating grant and visitors attracted to the area to visit the museum is estimated to be between $1.5
million and $900,000, with a base case value of just over $1.2 million. Total income generated in the
local economy from visitor expenditures is expected to be in the range of $700,000 annually.
Economic Impact Addendum: The Annapolis Valley Input-Output Model
An Input Output Model
Input-output (I/O) analysis attempts to quantify, at a point in time, the economic
interdependencies of an economy. I/O accounting is a framework that explicitly recognizes
interdependencies among productive industries of the economy and the elements of final demand.
Final demand is the demand for goods and services consumed directly by ultimate consumers.
Final goods and services are referred to as final because they are not put back into the production
process to make some other good. The interdependencies are characterized by the inter -industry
structure, which shows the inputs that are combined to produce output. The I/O analysis
framework is similar to a financial accounting framework that tracks purchases of and
expenditures on goods and services in dollars. The I/O framework traces the dollar flows between
businesses and between businesses and consumers in an economy.
The input-output model is summarized below in matrix form. Details of the model are discussed in
Appendix I
X* = (1-A*)-1 F*
Where:
X* = the vector of total output
(1-A*)-1 = the closed model total requirements matrix (Leontief inverse)
F* = vector of final demand changes associated with the Blue Beach Fossil Museum
The Annapolis Valley Input-Output Model description
The Nova Scotia input output (I/O) model forms the basis of the Annapolis Valley I/O model. The
provincial I/0 model for Nova Scotia is based on Statistics Canada data and produced by CANMAC
Economic Consulting Ltd. The provincial I/0 direct requirements matrix was obtained from the NS
Department of Finance and adjusted via employment based location quotients (LQ) to approximate the

May 2010 BLUE BEACH FOSSIL MUSEUM: BUSINESS PLAN & ECONOMIC IMPACT STUDY
54
Annapolis Valley economy. The location quotient in this case is a measure comparing the concentration
of an industry in the Annapolis Valley and its concentration in the province of Nova Scotia as a whole.
Location quotients were calculated for each industry (excluding households). The rows of the direct
requirements matrix are adjusted based on the LQ values. It is assumed that all wage payments are
made to county residents, profits are treated as leakages and no adjustment is made for commuters.
After adjusting the direct coefficients via the location quotients, the model is transformed into the total
requirement matrix via the Leontief inversion technique described earlier. Given changes in final
demand generated by the games, the model can be solved to estimate indirect and induced impacts on
the local economy.
The model is closed with respect to households. In the standard or open model, household consumption
is a column vector located in final demand and household income (comprised of wages/salaries/profits
and other income) is a row vector contained in value added. When the model is closed with respect to
households, the household row and column vector are incorporated into the endogenous (inter-
industry) matrix. The processing sector is therefore expanded to include households as an industry and
the inter-industry matrix reveals the relationships between the household industry and all other
industries. As a result, the household sector is no longer exogenous but is now part of the internally
determined portion of the model and therefore endogenous. The inclusion of households in the
processing sector assumes part of the analysis is to assess not only the impacts of inter-industry
purchases but also the effects of household spending on the economy.
The closed model allows the direct, indirect and induced effects of an exogenous change to be captured.
The inclusion of households in the inter-industry portion of the table results in multipliers that reflect
not only the direct and indirect purchases from the household industry (labour inputs) by other
industries but incorporates the effects of household income being re-spent in the economy. The
economic activity resulting from the re-spending of income generated by the direct and indirect effects
is known as the induced effect. The induced impacts are additional expenditures resulting from
increased income brought about by increases in final demand.
One assumption inherent in the induced effects is that household income flows to residents and these
residents spend their new income following the pattern of expenditures identified in the household
expenditure column of the inter-industry matrix. Given the assumed leakages from the local economy
(related to production of goods and industry profits), the closed model is most applicable due to its
ability to capture the induced effects associated with the re-spending of income created via the direct
and indirect effects.

May 2010 BLUE BEACH FOSSIL MUSEUM: BUSINESS PLAN & ECONOMIC IMPACT STUDY
55
Other Recommendations
1. Strengthen Board Governance: The Society is encouraged to make a concentrated effort to
expand the current Board, and especially to recruit Board members with prior Board
Governance and Capital Campaign experience. In this process, even a “no” can be informative,
as it presents an opportunity to gain a better understanding of potential barriers to Board
participation. One obvious barrier to board participation is the absence of director liability
insurance. The Society is strongly encouraged to put director insurance in place. The Society is
also encouraged to seek volunteers with specific skill sets to sit on Board sub-committees (many
people are reluctant to assume the legal obligations that come with full Board membership but
are willing to donate their time to good causes). The current Board would benefit from Board
Governance education, through the form of a facilitated workshop.
2. Seek potential private sector benefactors. The Blue Beach story is compelling. The Society,
through its Board, should develop a well thought out plan to approach potential private
benefactors (individual donors or foundations in Canada or around the world) that have the
financial capacity to significantly reduce the risks associated with this project and to shorten the
timelines that are typically associated with projects of this size and nature.
3. Align with partners in short term: The Society’s plans for the establishment of a world class
museum at Blue Beach align well with the strategic objectives of the Nova Scotia Department of
Tourism, Culture and Heritage. Recognizing the current fiscal environment, it is important to
involve community stakeholders in the Society’s dialogue with the Department. These dialogues
need to begin, not with a request for money, but with a request to explore the potential
strategic alignment of the plans for the development of the Museum at Blue Beach with the
respective provincial government department or agency. This is also an opportunity to discuss
any Departmental concerns with the proposed initiative.
4. Prepare Capital Cost Estimates:
a. Building: Review and revise the functional plan to reflect the projected staffing and
facility operational costs. Obtain detailed cost estimates for the construction effort.
b. As part of this process the Society may wish to begin preliminary conversations with one
or more potential Project Management firms that specialize in the management of large
scale construction projects.
c. Obtain independent fair market value appraisals of the existing BBFM assets, including
land and intellectual property, that the Society intends to purchase from the current
operators of the Museum.
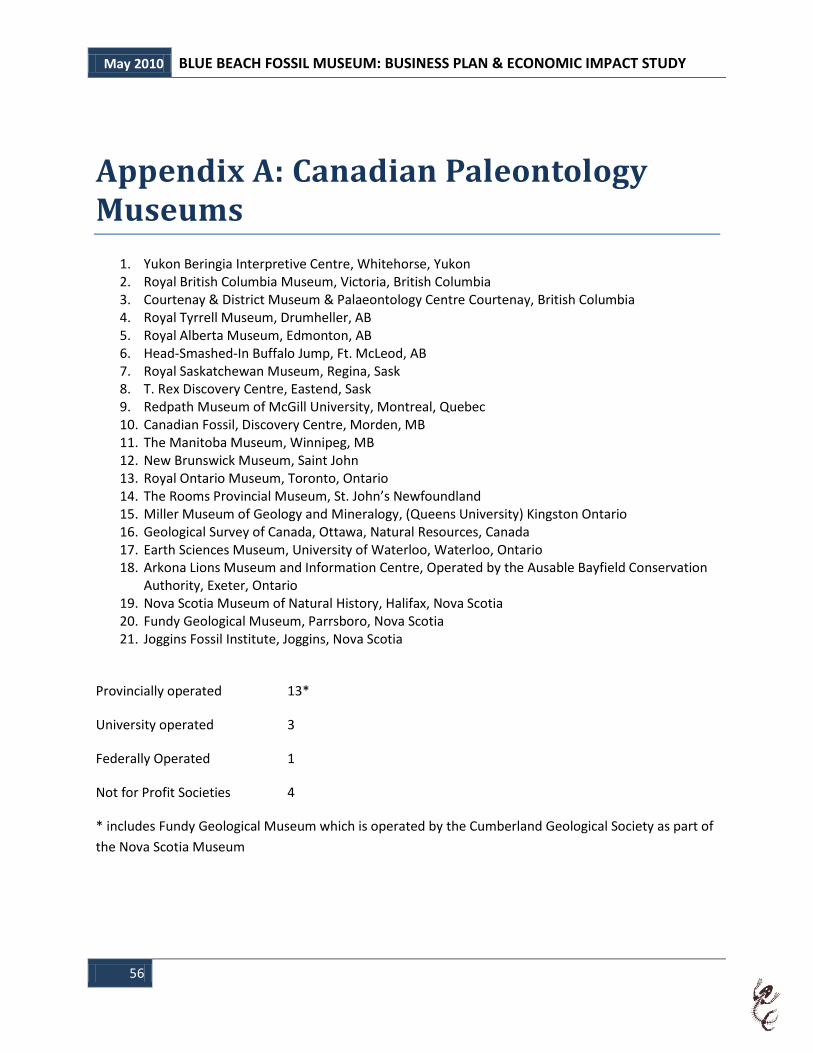
May 2010 BLUE BEACH FOSSIL MUSEUM: BUSINESS PLAN & ECONOMIC IMPACT STUDY
56
Appendix A: Canadian Paleontology Museums
1. Yukon Beringia Interpretive Centre, Whitehorse, Yukon 2. Royal British Columbia Museum, Victoria, British Columbia 3. Courtenay & District Museum & Palaeontology Centre Courtenay, British Columbia 4. Royal Tyrrell Museum, Drumheller, AB 5. Royal Alberta Museum, Edmonton, AB 6. Head-Smashed-In Buffalo Jump, Ft. McLeod, AB 7. Royal Saskatchewan Museum, Regina, Sask 8. T. Rex Discovery Centre, Eastend, Sask 9. Redpath Museum of McGill University, Montreal, Quebec 10. Canadian Fossil, Discovery Centre, Morden, MB 11. The Manitoba Museum, Winnipeg, MB 12. New Brunswick Museum, Saint John 13. Royal Ontario Museum, Toronto, Ontario 14. The Rooms Provincial Museum, St. John’s Newfoundland 15. Miller Museum of Geology and Mineralogy, (Queens University) Kingston Ontario 16. Geological Survey of Canada, Ottawa, Natural Resources, Canada 17. Earth Sciences Museum, University of Waterloo, Waterloo, Ontario 18. Arkona Lions Museum and Information Centre, Operated by the Ausable Bayfield Conservation
Authority, Exeter, Ontario 19. Nova Scotia Museum of Natural History, Halifax, Nova Scotia 20. Fundy Geological Museum, Parrsboro, Nova Scotia 21. Joggins Fossil Institute, Joggins, Nova Scotia
Provincially operated 13*
University operated 3
Federally Operated 1
Not for Profit Societies 4
* includes Fundy Geological Museum which is operated by the Cumberland Geological Society as part of
the Nova Scotia Museum
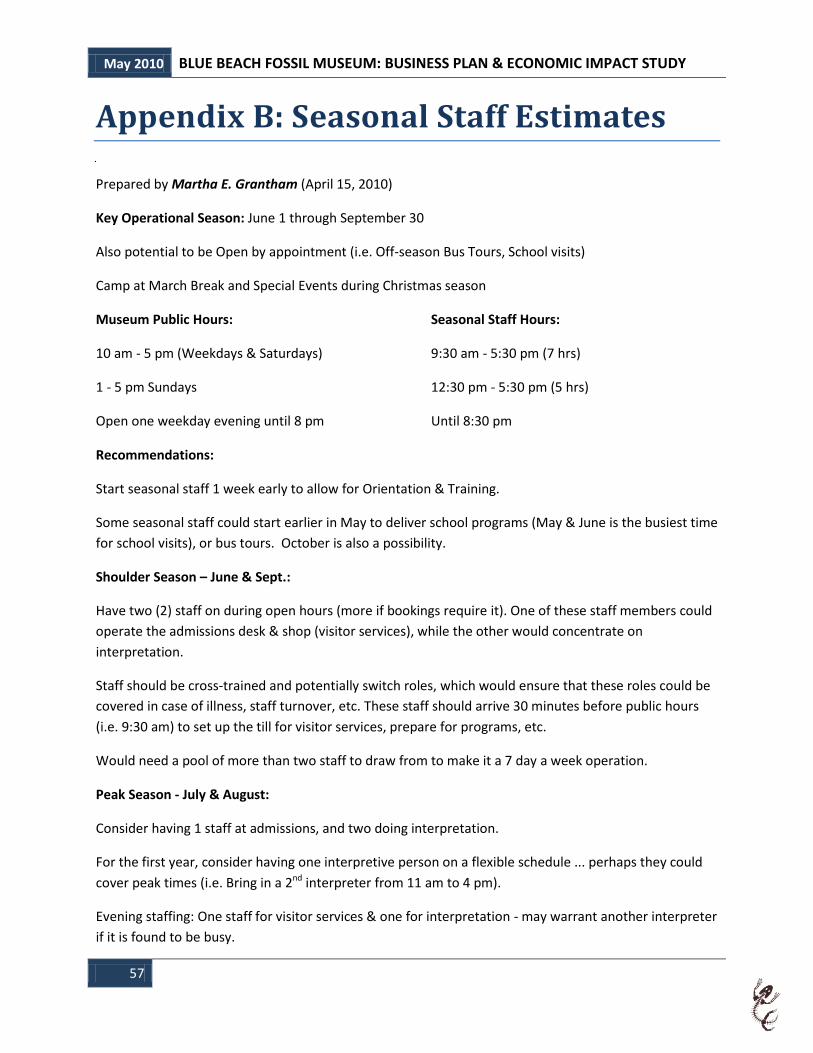
May 2010 BLUE BEACH FOSSIL MUSEUM: BUSINESS PLAN & ECONOMIC IMPACT STUDY
57
Appendix B: Seasonal Staff Estimates
Prepared by Martha E. Grantham (April 15, 2010)
Key Operational Season: June 1 through September 30
Also potential to be Open by appointment (i.e. Off-season Bus Tours, School visits)
Camp at March Break and Special Events during Christmas season
Museum Public Hours: Seasonal Staff Hours:
10 am - 5 pm (Weekdays & Saturdays) 9:30 am - 5:30 pm (7 hrs)
1 - 5 pm Sundays 12:30 pm - 5:30 pm (5 hrs)
Open one weekday evening until 8 pm Until 8:30 pm
Recommendations:
Start seasonal staff 1 week early to allow for Orientation & Training.
Some seasonal staff could start earlier in May to deliver school programs (May & June is the busiest time
for school visits), or bus tours. October is also a possibility.
Shoulder Season – June & Sept.:
Have two (2) staff on during open hours (more if bookings require it). One of these staff members could
operate the admissions desk & shop (visitor services), while the other would concentrate on
interpretation.
Staff should be cross-trained and potentially switch roles, which would ensure that these roles could be
covered in case of illness, staff turnover, etc. These staff should arrive 30 minutes before public hours
(i.e. 9:30 am) to set up the till for visitor services, prepare for programs, etc.
Would need a pool of more than two staff to draw from to make it a 7 day a week operation.
Peak Season - July & August:
Consider having 1 staff at admissions, and two doing interpretation.
For the first year, consider having one interpretive person on a flexible schedule ... perhaps they could
cover peak times (i.e. Bring in a 2nd interpreter from 11 am to 4 pm).
Evening staffing: One staff for visitor services & one for interpretation - may warrant another interpreter
if it is found to be busy.
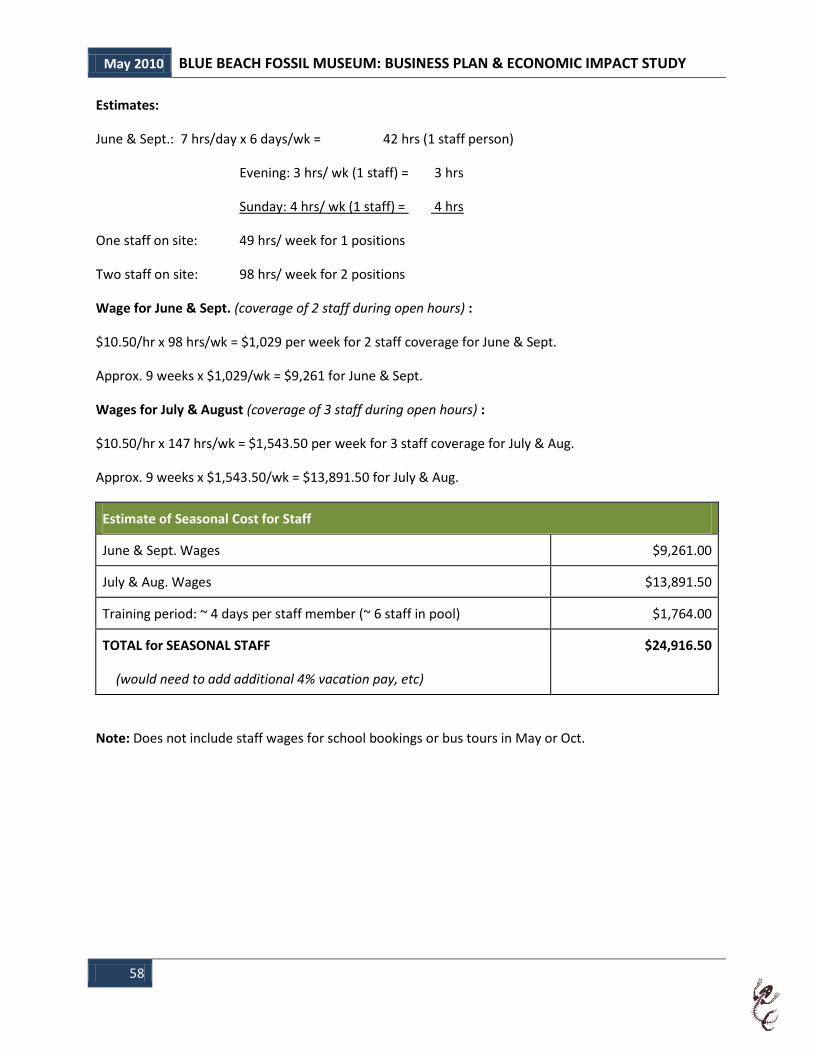
May 2010 BLUE BEACH FOSSIL MUSEUM: BUSINESS PLAN & ECONOMIC IMPACT STUDY
58
Estimates:
June & Sept.: 7 hrs/day x 6 days/wk = 42 hrs (1 staff person)
Evening: 3 hrs/ wk (1 staff) = 3 hrs
Sunday: 4 hrs/ wk (1 staff) = 4 hrs
One staff on site: 49 hrs/ week for 1 positions
Two staff on site: 98 hrs/ week for 2 positions
Wage for June & Sept. (coverage of 2 staff during open hours) :
$10.50/hr x 98 hrs/wk = $1,029 per week for 2 staff coverage for June & Sept.
Approx. 9 weeks x $1,029/wk = $9,261 for June & Sept.
Wages for July & August (coverage of 3 staff during open hours) :
$10.50/hr x 147 hrs/wk = $1,543.50 per week for 3 staff coverage for July & Aug.
Approx. 9 weeks x $1,543.50/wk = $13,891.50 for July & Aug.
Estimate of Seasonal Cost for Staff
June & Sept. Wages $9,261.00
July & Aug. Wages $13,891.50
Training period: ~ 4 days per staff member (~ 6 staff in pool) $1,764.00
TOTAL for SEASONAL STAFF
(would need to add additional 4% vacation pay, etc)
$24,916.50
Note: Does not include staff wages for school bookings or bus tours in May or Oct.
May 2010 BLUE BEACH FOSSIL MUSEUM: BUSINESS PLAN & ECONOMIC IMPACT STUDY
59
Appendix C: International Acclaim
Robert L. Carroll, FRSC, FLS, former Chairman, Department of Biology and
Curator Redpath Museum, McGill University, Montreal
From these few miles of sea cliff and beach have come a host of fossils providing the only evidence,
anywhere in the world, that provides a link between the very archaic amphibians of the Upper Devonian
and the subsequent radiation of all later land vertebrates. I have been consulted by the group that have
submitted the proposal for Joggins to be accepted as a World Heritage Site, and specifically argued that
Blue Beach should be considered as an equally important locality for our understanding of the early
history of land vertebrates. Together with the Parrsboro locality, these sites provide a spectrum across
the geological time scale that has no equal anywhere else in the world.
Dr. David Scott, President of Earth Sciences, Dalhousie University, Halifax
The province has already invested very heavily in both Joggins and Wasson’s Bluff (Parrsboro), which are
also extremely important sites. However, the Blue Beach site pre-dates those sites by several 10’s of
millions of years and is actually more important from a scientific and historic point of view…
Leo Elshof, PhD., Science and Technology Education, Acadia University
School of Education, Wolfville, Nova Scotia
In a time when ‘junk’ science in the form of so-called ‘intelligent design’ is on the ascendant in some
regions, the early Carboniferous fossils of Blue Beach provide one of the most outstanding opportunities
for contributing to evolutionary science education in Canada. I believe that in supporting this initiative
we will help build a lasting and significant educational and cultural resource for all Canadians.
Dr. David J. Mossman, Professor of Geosciences, Emeritus, Mount Allison
University, Sackville, New Brunswick
…given the success of famous fossil localities elsewhere in the Maritimes (e.g., Joggins and Parrsboro)
[and for that matter, elsewhere in Canada], the Blue Beach fossil locality richly deserves similar respect
and recognition, and officially sponsored moral and financial support.
Erwin L. Zodrow, PhD MSc BSc Emeritus Professor and Curator of Fossil
Plants, Cape Breton University
The request of support is based on the Museum potential to evolve into a world-class museum to
complement the recently opened Joggins Fossil Center, i.e., Joggins with plants and air-breathers - Blue
Beach equally with its famous terrestrial tetrapods. The tourist potential is enormous, if combined.

May 2010 BLUE BEACH FOSSIL MUSEUM: BUSINESS PLAN & ECONOMIC IMPACT STUDY
60
Dr. Jason S. Anderson, Assistant Professor, College of Veterinary Medicine,
University of Calgary, Alberta
The intensive collecting efforts undertaken over the past decade by the Blue Beach Fossil Museum
(BBFM), has been instrumental in our new understanding of the importance of this locality… (and has
been) …a vital part of my ongoing research in Nova Scotia. At the BBFM folks learn about the diversity of
archaic fishes that ultimately resulted in you and me, for my money one of the most exciting stories
evolution has to tell. I strongly encourage any efforts that can be made to support the expansion of the
role the BBFM plays in its community along the Avon River, and to the international scientific
community.
Spencer G. Lucas, PhD., Curator of Paleontology, New Mexico Museum of
Natural History and Science, Albuquerque, New Mexico
Blue Beach preserves the oldest extensive assemblage of fossil footprints of early tetrapods on the
planet. It thus provides a unique window into understanding the early colonization of land, a window
that no other site provides. Clearly, Blue Beach is a world class (and it is a world famous) fossil site. It is
a national treasure that Canada and Nova Scotia are lucky to call their own. Indeed, its scientific import
ranks it with the other great Canadian fossil sites, such as Joggins, Miguasha, Dinosaur Park and the
Burgess Shale.
Dr. Anne Warren, Associate professor, Department of Zoology, La Trobe
University, Melbourne, Australia
This new museum at Blue Beach should complement the recently established museum associated with
the Joggins locality, and others such as the museums at Miguasha and the Nova Scotia Museum in
Halifax, forming a chain of fossil centres across Canada. It would be enhanced by the recognition of Blue
Beach as a Geosite and its designation as a Special Place, both potentially boosting international and
local tourism. I would also strongly support its designation as a World Heritage Site.
Katherine Parker, PhD Student, in Paleontology, La Trobe University,
Melbourne, Australia
I fully support the Blue Beach fossil site being recognized as one of global significance, and that
promotional and educational facilities and infrastructure would be of enormous value to the local
community, Canadians, and to the global scientific community.

May 2010 BLUE BEACH FOSSIL MUSEUM: BUSINESS PLAN & ECONOMIC IMPACT STUDY
61
Martin D. Brazeau, Ph. D. Student, Evolutionary Biology Centre, Uppsala
Universitet, Uppsala, Sweden
Blue Beach represents one of the most important fossil localities in Canada, and arguably in North
America. The need to protect, interpret and promote the scientific value of such a locality cannot be
underestimated. It is also a ”classic” section, in that it was instrumental in the early history of scientific
research in Canada as well as in natural resource exploration.A museum facility would provide an
extremely welcome resource for scientists, their students, and the interested public and tourists.
Dr. Howard J. Falcon-Lang Lecturer in Palaeontology, Department of Earth
Sciences, University of Bristol
As the scientist who compiled the ‘comparative study’ central to the Joggins nomination, I am an expert
on the Carboniferous ecosystems of the world. If Joggins is the finest example of a fossil site from the
latter part of the Carboniferous Period, then Blue Beach is certainly one of the most globally important
early Carboniferous localities. I urge you to support the development of Blue Beach Museum proposal.