Bloomberg cheatsheet. Main menu NRG – Bloomberg Energy service FXIP – Foreign Exchange platform...
32
Bloomberg cheatsh
-
Upload
makena-curl -
Category
Documents
-
view
249 -
download
9
Transcript of Bloomberg cheatsheet. Main menu NRG – Bloomberg Energy service FXIP – Foreign Exchange platform...

Bloomberg cheatsheet
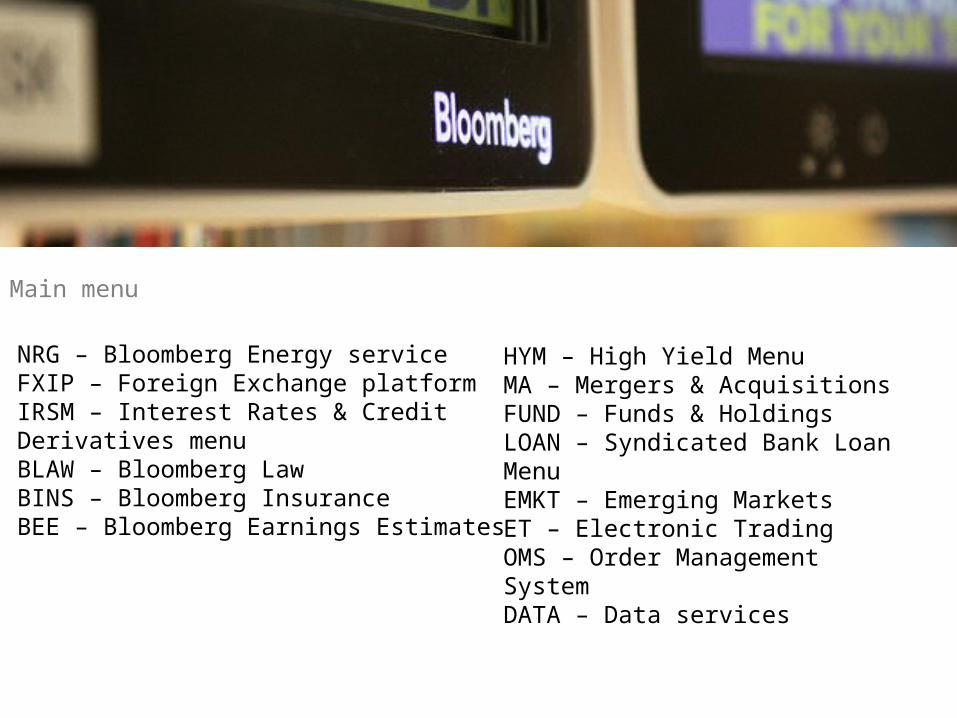
Main menu
NRG – Bloomberg Energy serviceFXIP – Foreign Exchange platformIRSM – Interest Rates & Credit Derivatives menuBLAW – Bloomberg LawBINS – Bloomberg InsuranceBEE – Bloomberg Earnings Estimates
HYM – High Yield MenuMA – Mergers & AcquisitionsFUND – Funds & HoldingsLOAN – Syndicated Bank Loan MenuEMKT – Emerging MarketsET – Electronic TradingOMS – Order Management SystemDATA – Data services

News
N – Main Bloomberg News MenuNSE – News Search EngineREAD – Most read NewsNRR – News Readership RankingsTOP – Today’s TOP HeadlinesCPNY – Display the company news main menuRSE – Research search engineECO – Economic releases by countryECFC – Display economic forecasts/indicatorsECST – Find world economic statisticsSTAT – Bloomberg Global ViewOUTL – Economic surveys
WWEB – Top web newsECOW – Display an economic data watchLEAD – Display economic activity trendsLIVE – Live broadcasts & InterviewsNRC – Search for other news wires by name or languageCN – Company news and researchNLRT – Display and create news searches/alertsBBSE – Menu of worldwide economic newsFOMC – Access FOMC announcements

News Function
NI EII – Review economic instant insightNI FED – Find news on the Federal Research BoardNI CBW – Worldwide Central Bank Watch newsNI HOT – Find hot global newsNI STK – Find global stock market newsNT FRX – Foreign exchange newsNI DAYAHEAD – View day ahead summariesNI WRAP – Market & industry wraps headlinesNI BONTOP – View scrolling TOP Bond newsNI CMDTOP – View top commodities storiesNI RELS – Press releases

Economic Statistics
ECST – Find world economic statisticsECOR – Access a menu of US economic statisticsECMX – Compare global economic indicatorsSTAT – Bloomberg Global ViewWECO – Economic releases by countryECO – Economic releases by countryECOW – Display an economic data watchCTRB – Search for Bloomberg contributorsEIU – Economist Intelligence Unit overviewsIMF – International Monetary Fund statisticsOECD – Access a menu of OECD indicatorsRSE – Research search engine

Economic Forecast
OUTL – Economic surveysECOS – Access economists’ indicator estimatesECOC – Calendar of indicator release datesECRP – Economic impactECFC – Display economic forecasts/indicatorsBPGC – Display Global Confidence survey resultsESVY – Global Confidence surveyBYFC – Interest rates yield forecasts

Broad Market Perspective
IM – Bond monitors by countryMMR – find global money market rate monitorWEI – Monitor world equity indicesWB – Display/Analyse/compare bond dataYCRV – Perform yield curve analysisFWCV – Analyse projected forward ratesMA – Display global M&A transactionsNRG – Access a menu of energy functionsCRR – Display commodity ranked returns
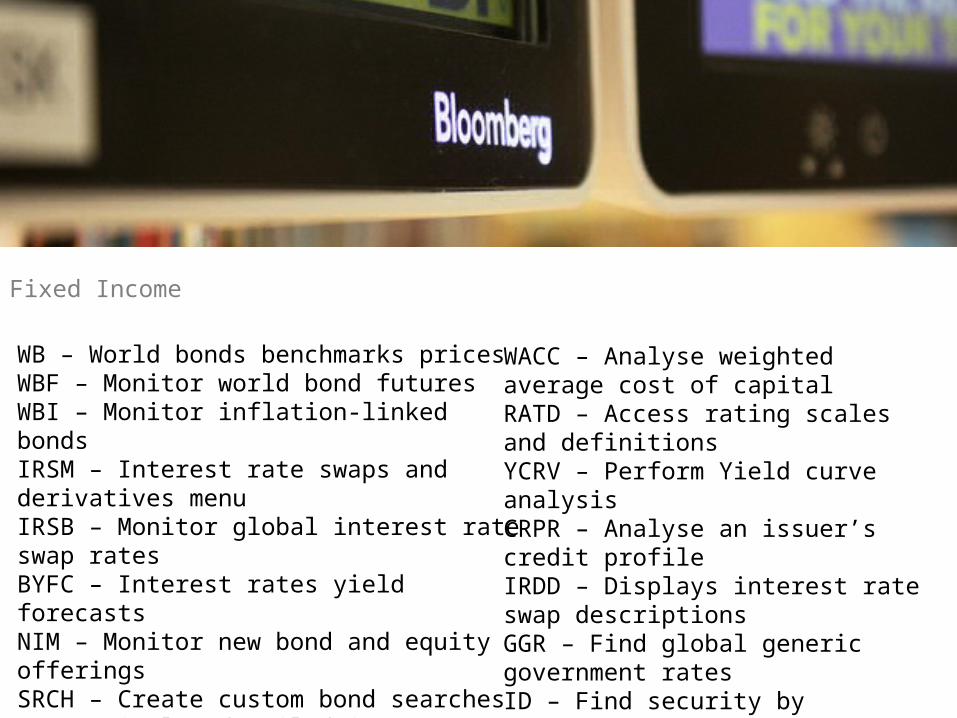
Fixed Income
WB – World bonds benchmarks pricesWBF – Monitor world bond futuresWBI – Monitor inflation-linked bondsIRSM – Interest rate swaps and derivatives menuIRSB – Monitor global interest rate swap ratesBYFC – Interest rates yield forecastsNIM – Monitor new bond and equity offeringsSRCH – Create custom bond searchesDES – Display detailed issuer informationBQ – Bond quote screenRATT – Display trends for credit ratingsCOMB – Comparable Bonds search
WACC – Analyse weighted average cost of capitalRATD – Access rating scales and definitionsYCRV – Perform Yield curve analysisCRPR – Analyse an issuer’s credit profileIRDD – Displays interest rate swap descriptionsGGR – Find global generic government ratesID – Find security by identification numbersFMCI – Menu of world fair market indicesMOSG – Display most active bondsDDIS – Display outstanding debt and loans

Equities - Index Sectors/Peer Analysis
WEI – Monitor world equity indicesEMEQ – Monitor emerging markets indicesWEIF – Monitor world equity index futuresMOST – Display most active securitiesMOV – Display index moversMA – Research global M&A activityMMAP – Market Map by sector/regions of the worldMEMB – Monitor equity index members/subgroupsEQS – Equity search based on a variety of criteria
GRR – Analyse/rank index industry group returnsESCO – Create stock scoring and ranking modelsHILO – Display 52-week high/low informationLVI – Monitor equities with abnormal volumesEA – Display current earnings season resultsINSD – Insiders monitorSEI – Sustainability and environmental indicesIMAP – Analyse price movements across industries

Equities - Earnings/dividend recommendations
EE – View the earning estimates menuEVTS – Access transcripts of corporate eventsSURP – Earnings surprise analysisANR – Analysts recommendationsBDVD – Bloomberg dividend forecastBBSA – Analyse positive and negativeperspectivesDVD – Access dividend/split information
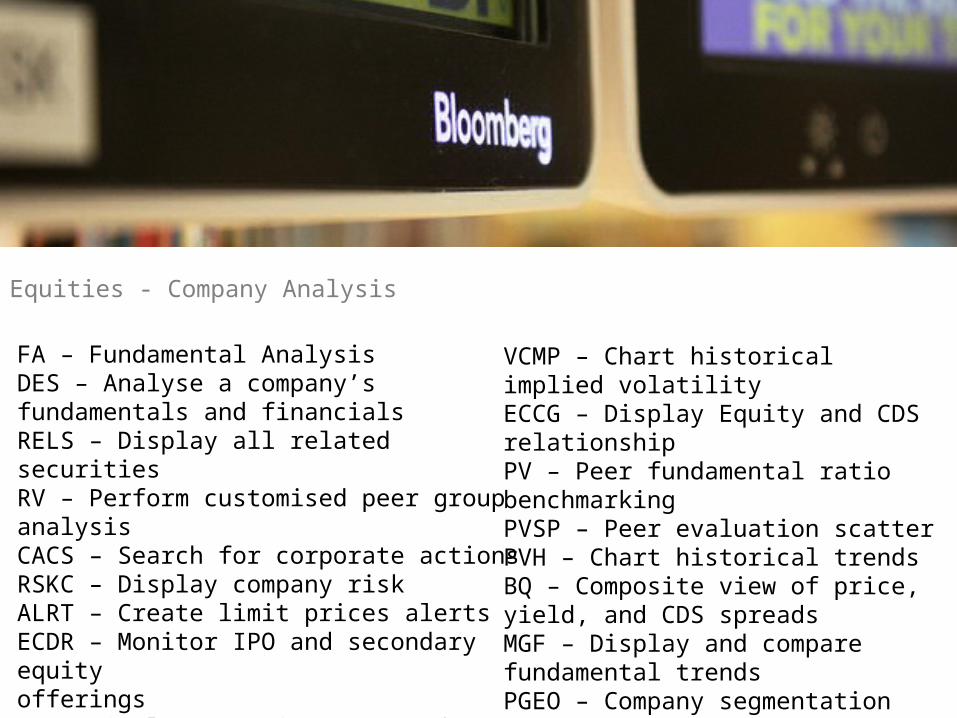
Equities - Company Analysis
FA – Fundamental AnalysisDES – Analyse a company’s fundamentals and financialsRELS – Display all related securitiesRV – Perform customised peer group analysisCACS – Search for corporate actionsRSKC – Display company riskALRT – Create limit prices alertsECDR – Monitor IPO and secondary equity offeringsCN – Display security news and researchCH – Display financial historyMCN – Company-specific most-read news stories
VCMP – Chart historical implied volatilityECCG – Display Equity and CDS relationshipPV – Peer fundamental ratio benchmarkingPVSP – Peer evaluation scatterPVH – Chart historical trendsBQ – Composite view of price, yield, and CDS spreadsMGF – Display and compare fundamental trendsPGEO – Company segmentationPHDC – Customisable equity search on holdings

Derivative
OMON – Monitor real-time option pricesOSA – Option scenario analysisVCMP – Chart implied and historical volatilityOVME – Multi-leg option valuationOSCH – Search for company stock optionsMOSO – Analyse the day’s most active optionsOVI – Display increase in trade volumeWSRC – Search for warrants based on your criteria
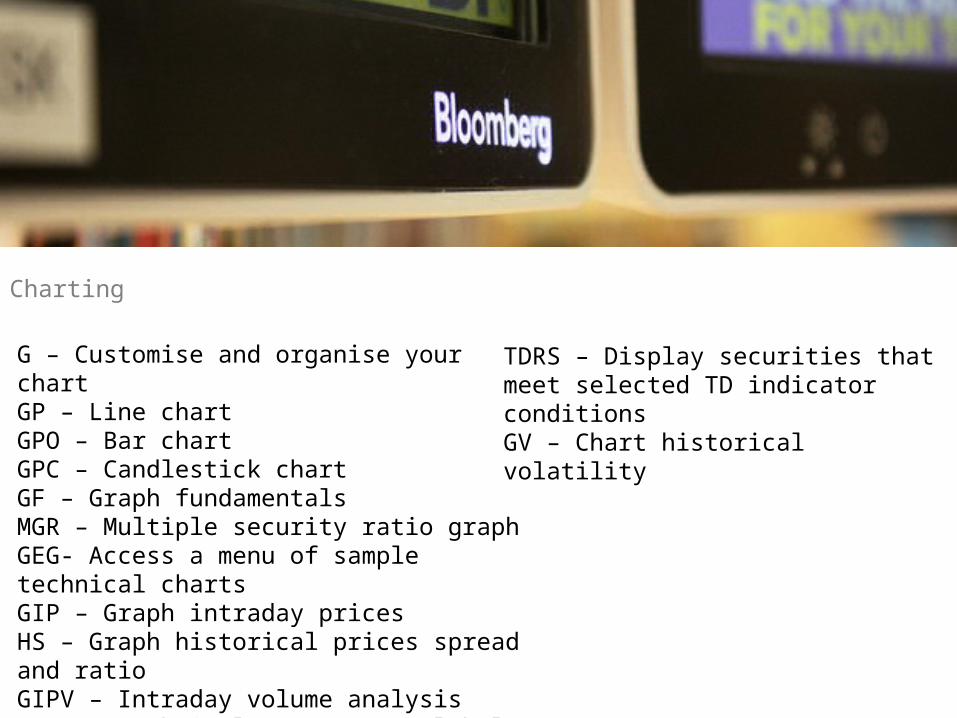
Charting
G – Customise and organise your chartGP – Line chartGPO – Bar chartGPC – Candlestick chartGF – Graph fundamentalsMGR – Multiple security ratio graphGEG- Access a menu of sample technical chartsGIP – Graph intraday pricesHS – Graph historical prices spread and ratioGIPV – Intraday volume analysisATEC – Technical patterns – global
TDRS – Display securities that meet selected TD indicator conditionsGV – Chart historical volatility

Foreign Exchange
FXIP – Bloomberg FX homepageFXFC – FX rate forecastsFXGN – Monitor major currency markets real timeFRD – Calculate Forward exchange ratesFXTF – Search for currency data and tickersOVML – Price FX optionsXOPT – Access the FX Options MenuFXFR – Monitor Spot/forward exchange ratesWCRS – Rank best and worst performing currencies
FE11 – Currency conversion calculatorVOLC – Implied vs realised volatilities and FX ratesBFIX – Display fixing ratesWVOL - Customisable list of implied volatilities

Money Markets Real Estate
MMR – Find global money market rate monitorsBTMM – Worldwide interest rates benchmarksWIR – Monitor interest rate futuresCCRV – Interest rates futures curveFFIP – Display implied FED funds rate probabilityCBRT – Global central bank monetary policy ratesWIRP – World interest rate implied probabilityTAYL – Taylor Rule model
RE – Real Estate MenuTOP R – Top real estate news

Commodities
IPCM – View the commodities main menuGLCO – global commodity prices & dataNRG – Access a menu of energy functionsCMDS – Monitor all major commoditiesCCRV – Analyse futures and OTC forward curvesCPF – Price forecasts for commodity productsENST – Search international energy statisticsSHIP – Bloomberg Shipping main menu
CIX – Create customised indicesCRR – Display commodity ranked returnsGCIN – Display/track global commodity indicesCFTC – Display Commitment of Traders ReportsILBA – Inflation Indicator
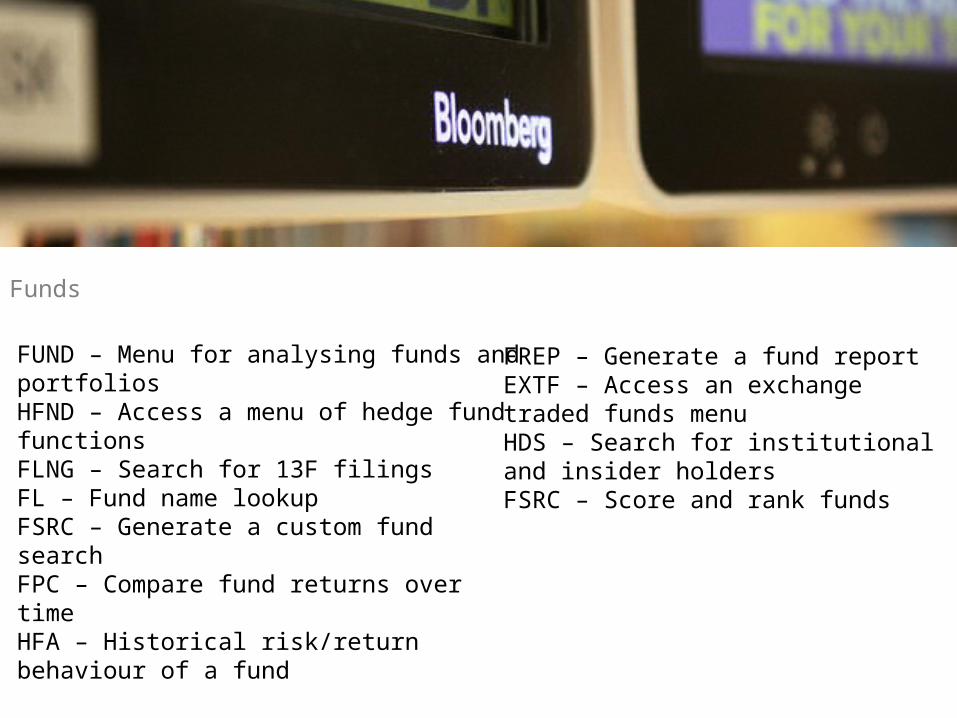
Funds
FUND – Menu for analysing funds and portfoliosHFND – Access a menu of hedge fund functionsFLNG – Search for 13F filingsFL – Fund name lookupFSRC – Generate a custom fund searchFPC – Compare fund returns over timeHFA – Historical risk/return behaviour of a fund
FREP – Generate a fund reportEXTF – Access an exchange traded funds menuHDS – Search for institutional and insider holdersFSRC – Score and rank funds

Portfolios
BPOR – Portfolio functions main menuBBU – Upload your portfoliosPRTU – Manage portfoliosPBEN – Set up and maintain benchmarksPREP – Obtain a distribution/breakdown of your portfolioPRT – Equity portfolio real time monitorBBAT – Bloomberg performance attributionTRK – Stress testsNPH – News & research headlinesMRR – 10 best and worst equities in a portfolio
HFA P – Historical portfolio performance analysisALRT – Create portfolio alertsCACT – Corporate action calendarEVTS – Event calendar for a portfolioHPA – Historical portfolio analysisBRSK – Display portfolio risk viewsLRSK – Determine portfolio liquidity riskPSD – Portfolio slice & dice
Municipals
YA – Calculate yield analysisYTC – Calculate yield to callSF – Sinking fund analysisHZ2 – Analyse municipal total returns horizonsFTAX – Federal taxation calculatorQTAX – Municipals prices used to calculate taxesPICK – Post/monitor primary/secondary municipal bond offerings/tradesNIRM – Compare municipal new issue yields

Structured Products
STNT – Structured products main menuSND – Structured products definitionsOVSN – Price Equity structured notesSWPM – Interest rates structured products pricerOVML – Multileg option valuationSRCH – Structured products search engine

Technical Analysis 1
Charts – OverviewGRAPH – Charts main menuGEDU – Charts educationCHART – Chart stories
Charts – HistoricalGP – Graph historical pricesGPO – Historical price chartGPC – Candle ChartGPL – Logarithmic chartPFP – Graph a point and figure chart
Technical Analysis 1
Charts – IntradayGIP – Tick chartGIPS – Scrunch chartGIPT – Scrolling tick chart with B/A and volumeGIPW – Sliding window chartIGPC – Intraday candle chartIGPO – Intraday bar chartISGP – Graph 30 days of intraday spreads or ratiosMGIP – Graph intraday ticks for multiple securities
Chart News and SeminarsNI TA – All technical analysis newsNI BLPTECSTRT – Bloomberg technical strategyNI BLPHRTUPD – Chart updatesTDEF – Set default parameters

Technical Analysis 2
Technical Indicators – HistoricalIRSI – Intraday Relative Strength IndexMACD – Moving Average Convergence/DivergenceTAS – StochasticsDMI – Directional Movement IndexROC – Rate of ChangeCMCI – Commodity Channel IndexWLPR – Williams %R GraphBOLL – Bollinger BandsGO – Ichimoku CloudGPF – Fibonacci lines
PTPS – Stop-and-reversal (SAR) trading pointsMAE – Moving average envelopsGM – Graph prices and money flowCHKO – Display the Chaikin OscillatorGPCA – Graph historical corporate actionsCNDL – Candle patternsKAOS – Hurst ExponentMCCL – McClellan OscillatorOBV – On-balance volumePIVG – Pivot points graph

Technical Analysis 3
Technical Indicators – IntradayIRSI – Intraday Relative Strength IndexIMAC – Intraday MACDITAS – Intraday StochasticIDMI – Intraday Directional Movement IndexIROC – Intraday Rate of ChangeICCI – Intraday Commodity Channel IndexIWLP – Intraday Williams %R
IBOL – Intraday Bollinger BandsIGOC – Intraday graphIGPF – Intraday prices and Fibonacci linesIPTS – Intraday parabolic system chartIMAE – Intraday moving average envelopesGIM – Intraday money flow chart
Technical Analysis 4
Advanced ChartsG – Create and maintain customised chartsGEG – Access a menu of sample technical chartsVAT – Analyse volume patternsIGPV – Graph intraday price and VWAPVBAR – Trade volume graphVAP – Graph volume at price bar chartVWAP – Snapshot of VWAP analysis
MKTP – Market picture chartECCG – Graph equity and credit default swap volatilityGP E – Events ChartGPMR – View most read news storiesSI – Monthly CEF short interest informationSEAG – Seasonality price graph
Technical Analysis 4
Spread/Ratio ChartsHS – Graph historical price spread and ratioHSN – Normalised spreadHSE – Graph spread of two securitiesHSP – Graph the spreadSGP – Graph price spread/ratio for two securitiesSGIP – Intraday spread graphISGP – Intraday spread graph (30 days)GR – Graph price, P/E, or yield ratiosGRET – Graph historical P/E ratiosMGR – Security ratios to a base index

Technical Analysis 5
VolatilityGV – CDS vs equity volatility graphHVG – Graph historical price/yield volatilityVCMP – Chart historical implied volatilityHIVG – Graph historical/implied volatility on commoditiesSKEW – Graph volatility skews

Technical Analysis 5
Quantitative AnalysisCORR – Create up to 20 correlation matricesPC – find equity correlation with peersRVG – Chart a company’s key financial metricsRVC – Display/analyse scatter dataRVH – Display/analyse distribution dataHRA – Determine linear regression sensitivityMRA – Create up to 20 regression matricesBETA – Analyse historical betaTRA – Calculate total return for a stock
COMP – Compare multiple security returnsMRR – 10 best and worst performing stocks of an indexIRR – Historical index ranked returns reportsMMAP – Market map by sector/regions of the worldCIX – Create/graph custom index expressionPIV – Pivot calculatorBTST – Calculate profit and loss (P&L)
Technical Analysis 6
Fundamental ChartsGFV – Graph/compare fundamentals, estimates, and ratiosGF – Graph fundamentalsMGF – Compare fundamental trendsEEG – chart equity price movementsGE – Graph historical price and market ratiosRG – Graph/compare historical equity returnsPEBD – P/E bands/valuationSURP – Earnings surprise
Screening ToolsIMAP – Analyse price movements across industriesALRT – Price and technical alertsEQS – Search for equity securitiesATEC – Technical patterns – globalCTEC – Technical patterns – single nameLTEC – Technical patterns – custom list
Excel
DAPI – Bloomberg desktop API for excelFLDS – Identify which calcrt fields to useMBBG – Bloomberg’s Excel spreadsheets libraryLAB – View the Quantitative main menu

Multiple Security Analytics
G – Create customer chart templatesMRA – Create multiple regression matricesCORR – Create correlation matricesCIX – Create a custom index expressionMGF – Display and compare fundamental trendsMGIP – Graph intraday ticks for multiple securities

Prepared by Information & Library Services, Judge Business School 2012Content courtesy of FSRC http://fsrc2010.blogspot.co.uk/Images Rachel Marsh