
Blastomere derivation and domains of gene expression in...
14
INTRODUCTION The essential role of the Organizer in vertebrate development has been realized since 1924 when Spemann and Mangold transplanted a region of the dorsal marginal zone of an amphibian gastrula embryo to the ventral marginal zone of a host embryo and found that it induced a secondary set of dorsal axial structures organized around the notochord differentiated by the graft tissue. The Organizer was defined in terms of this experimental effect. The reverse experiment, the removal of the Organizer from the embryo shortly before gastrulation, results in the development of a ventralized form lacking all chordate-characteristic dorsal structures (Stewart and Gerhart, 1990). Because this region is both necessary and sufficient for formation of the body axis, it has been the subject of much investigation to this day. There are at least two inductive activities of the Organizer during gastrulation: (1) to dorsalize and organize the mesoderm of the lateroventral marginal zone to form somites, kidney and heart, and (2) to neuralize and pattern the ectoderm to form neural tissue (Gerhart et al., 1991; Harland, 1994). This activity defines the early gastrula Organizer in functional terms. These inductions occur coincidentally with morphogenetic movements which are also activities of the Organizer, in par- ticular the spreading migratory movements of early involuted Organizer cells, and the convergent extension movements of later involuted cells as they lengthen the embryonic axis beneath the neural tube. After gastrulation, and well into neu- rulation, the Organizer continues to induce and pattern neural tissue in the dorsoventral dimension of the neural tube, and to induce somite differentiation into myotome, scleratome and dermatome. This activity defines the late gastrula Organizer in functional terms. Xenopus Organizer cells ultimately con- tribute primarily to three differentiated cell types, pharyngeal endoderm, head mesoderm and notochord (Keller, 1975, 1976). Some Organizer cells may contribute to somites and heart but this is less certain. From classical surgical functional studies, it seems the Organizer contains at least two parts as gastrulation begins: a vegetal anterior leading part, the cells of which engage in spreading migration, induce anterior neural 3505 Development 121, 3505-3518 (1995) Printed in Great Britain © The Company of Biologists Limited 1995 DEV3248 Spemann’s Organizer, located in the dorsal marginal zone of the amphibian gastrula, induces and differentiates dorsal axial structures characteristic of this and other ver- tebrates. To trace the cellular origins of the Xenopus Organizer, we labelled dorsal blastomeres of three of the four tiers (A, B and C) of the 32-cell embryo with green, red and blue fluorescent lineage tracers. A strong vegetal- ward displacement of labelled clones occurs between the late blastula and early gastrula stages but clones mix only slightly at their borders. The typical early gastrula Organizer is composed of approximately 10% A1 progeny in its animalmost region, 70% B1 progeny in the central region, and 20% C1 progeny in vegetal and deep regions. Variability in the composition of the early gastrula Organizer results from variability in the position of early cleavage planes and in pregastrulation movements. As the Organizer involutes during gastrulation, forming dorsal axial mesoderm, clonal boundaries are greatly dispersed by cell intermixing. Within a clone, deep cells are displaced and intermixed more than superficial cells. Variability in the distribution of progeny in the dorsal axial mesoderm of the late gastrula results mostly from variable intermixing of cells during gastrulation. Experiments to perturb later developmental events by molecular or embryonic manipu- lations at an early stage must take this variability into account along with the majority distributions of the fate map. Within the early gastrula Organizer, the genes Xbra, goosecoid, noggin and xNR3 are expressed differently in the animal-vegetal and superficial-deep dimensions. In situ hybridization and lineage labelling define distinct regions of the dorsal marginal zone. By the end of gastrulation, dorsal axial mesoderm cells derived from the Organizer have altered their expression of the genes Xbra, goosecoid, noggin and xNR3. At a given stage, a cell’s position in the embryo rather than its lineage may be more important in determining which genes it will express. Key words: fate map, gastrula, dorsal mesoderm, cell lineage, in situ hybridization, Xenopus laevis SUMMARY Blastomere derivation and domains of gene expression in the Spemann Organizer of Xenopus laevis Marie A. Vodicka* and John C. Gerhart Molecular and Cell Biology, University of California, Berkeley, CA 94720, USA *Author for correspondence at present address: Fred Hutchinson Cancer Research Center, Program in Molecular Medicine, C2-023, 1124 Columbia St., Seattle, WA 98104, USA (e-mail: [email protected])
Transcript of Blastomere derivation and domains of gene expression in...

3505Development 121, 3505-3518 (1995)Printed in Great Britain © The Company of Biologists Limited 1995DEV3248
Blastomere derivation and domains of gene expression in the Spemann
Organizer of Xenopus laevis
Marie A. Vodicka* and John C. Gerhart
Molecular and Cell Biology, University of California, Berkeley, CA 94720, USA
*Author for correspondence at present address: Fred Hutchinson Cancer Research Center, Program in Molecular Medicine, C2-023, 1124 Columbia St., Seattle, WA98104, USA (e-mail: [email protected])
Spemann’s Organizer, located in the dorsal marginal zoneof the amphibian gastrula, induces and differentiatesdorsal axial structures characteristic of this and other ver-tebrates. To trace the cellular origins of the XenopusOrganizer, we labelled dorsal blastomeres of three of thefour tiers (A, B and C) of the 32-cell embryo with green,red and blue fluorescent lineage tracers. A strong vegetal-ward displacement of labelled clones occurs between thelate blastula and early gastrula stages but clones mix onlyslightly at their borders. The typical early gastrulaOrganizer is composed of approximately 10% A1 progenyin its animalmost region, 70% B1 progeny in the centralregion, and 20% C1 progeny in vegetal and deep regions.Variability in the composition of the early gastrulaOrganizer results from variability in the position of earlycleavage planes and in pregastrulation movements. As theOrganizer involutes during gastrulation, forming dorsalaxial mesoderm, clonal boundaries are greatly dispersed bycell intermixing. Within a clone, deep cells are displacedand intermixed more than superficial cells. Variability in
the distribution of progeny in the dorsal axial mesoderm ofthe late gastrula results mostly from variable intermixingof cells during gastrulation. Experiments to perturb laterdevelopmental events by molecular or embryonic manipu-lations at an early stage must take this variability intoaccount along with the majority distributions of the fatemap. Within the early gastrula Organizer, the genes Xbra,goosecoid, noggin and xNR3 are expressed differently in theanimal-vegetal and superficial-deep dimensions. In situhybridization and lineage labelling define distinct regionsof the dorsal marginal zone. By the end of gastrulation,dorsal axial mesoderm cells derived from the Organizerhave altered their expression of the genes Xbra, goosecoid,noggin and xNR3. At a given stage, a cell’s position in theembryo rather than its lineage may be more important indetermining which genes it will express.
Key words: fate map, gastrula, dorsal mesoderm, cell lineage, in situhybridization, Xenopus laevis
SUMMARY
INTRODUCTION
The essential role of the Organizer in vertebrate developmenthas been realized since 1924 when Spemann and Mangoldtransplanted a region of the dorsal marginal zone of anamphibian gastrula embryo to the ventral marginal zone of ahost embryo and found that it induced a secondary set of dorsalaxial structures organized around the notochord differentiatedby the graft tissue. The Organizer was defined in terms of thisexperimental effect. The reverse experiment, the removal ofthe Organizer from the embryo shortly before gastrulation,results in the development of a ventralized form lacking allchordate-characteristic dorsal structures (Stewart and Gerhart,1990). Because this region is both necessary and sufficient forformation of the body axis, it has been the subject of muchinvestigation to this day.
There are at least two inductive activities of the Organizerduring gastrulation: (1) to dorsalize and organize the mesodermof the lateroventral marginal zone to form somites, kidney andheart, and (2) to neuralize and pattern the ectoderm to form
neural tissue (Gerhart et al., 1991; Harland, 1994). This activitydefines the early gastrula Organizer in functional terms. Theseinductions occur coincidentally with morphogeneticmovements which are also activities of the Organizer, in par-ticular the spreading migratory movements of early involutedOrganizer cells, and the convergent extension movements oflater involuted cells as they lengthen the embryonic axisbeneath the neural tube. After gastrulation, and well into neu-rulation, the Organizer continues to induce and pattern neuraltissue in the dorsoventral dimension of the neural tube, and toinduce somite differentiation into myotome, scleratome anddermatome. This activity defines the late gastrula Organizer infunctional terms. Xenopus Organizer cells ultimately con-tribute primarily to three differentiated cell types, pharyngealendoderm, head mesoderm and notochord (Keller, 1975,1976). Some Organizer cells may contribute to somites andheart but this is less certain. From classical surgical functionalstudies, it seems the Organizer contains at least two parts asgastrulation begins: a vegetal anterior leading part, the cells ofwhich engage in spreading migration, induce anterior neural

3506 M. A. Vodicka and J. C. Gerhart
plate and differentiate as head mesoderm; and an animalposterior trailing part that engages in convergent extension,induces trunk-tail parts of the neural plate and perhaps dorsal-izes mesoderm, and eventually differentiates as notochord(Spemann, 1938; Hama et al., 1985). The boundaries of thesesubregions are not known and the inductive activity of the partsof the Organizer may change during gastrulation (Saha andGrainger, 1992), especially anterior parts may gain and thenlose head-inducing properties. The superficial layer of cells ofthe stage 10 Organizer, which is destined for pharyngealendoderm and archenteron roof, has axis-inducing propertiesas do the deep cell layers (Shih and Keller, 1992).
It has become possible in the past four years to addressXenopus embryonic organization in terms of regional geneexpression, and to correlate this with regional function. Anumber of Organizer-specific genes have been identified: Xbra(Smith et al., 1991), goosecoid (Cho et al., 1991), noggin(Smith and Harland, 1992), X-lim1 (Taira et al., 1992), XFD-1 (Knochel et al., 1992), Forkhead1 (Dirksen and Jamrich,1992), chordin (Sasai et al., 1994), xNR3 (Smith et al., 1995)Xnot1 (von Dassow, 1993) and the closely related Xnot2 (Gontet al., 1993). Three of these, goosecoid (gsc), noggin (nog) andchordin (Sasai et al., 1994) have axis-inducing activity inexperimental situations. We report the regional expression ofsome of these genes within the Organizer, identifying subre-gions that may be correlated later with inductive and morpho-genetic functions.
At the same time, we want to know the origins of differentparts of the Organizer from different and interacting parts ofthe cleaving egg, and to this end we have determined theprogeny contributions of cleavage stage blastomeres to early(stage 10) and late (stage 12) gastrula Organizers. Previouswork provided fate maps of blastomere progeny contributionsto various differentiated tissues and parts of the tadpole fromthe 16- (Moody, 1987b) and 32-cell embryo (Nakamura andKishiyama, 1971; Cooke and Webber, 1985; Dale and Slack,1987; Moody, 1987a). Other previous work has provided fatemaps for progeny contributions of gastrula cells to neurula andtail bud stages (Keller, 1975, 1976). However, there has beenlittle attention to intermediate stages, namely, progeny contri-butions of early blastomeres to gastrula and neurula stages,especially to the Organizer. Interpolation from previous mapsis unreliable. Thus, we constructed an intermediate, or predif-ferentiation, fate map from the 32-cell stage to the early andlate gastrula Organizers. Accurate fate maps are needed as thebackground for interpreting the consequences of removing,perturbing or injecting blastomeres.
Recently, Bauer et al. (1994) reported a survey of interme-diate fates, but with no attention to Organizer subregions, andwithout correlating lineage data with region-specific geneexpression. In order to reduce ambiguity introduced byembryo-to-embryo variability of cleavage planes, we havelabelled dorsal blastomeres of individual 32-cell embryos withthree different lineage tracers and examined the positions ofprogeny at early and late gastrula stages, analyzing serialsections of numerous embryos. Also, since cells move exten-sively at the start of gastrulation, we have taken care to identifyembryos uniformly at stage 10−/10 (Keller, 1991), before thesurface layer involutes. We quantify the variability found inblastomere contributions to the Organizer even after carefulscrutiny of embryos. Using a combination of lineage and in
situ hybridization data, we describe the Organizer in terms ofsubregions of gene expression and lineage origin.
MATERIALS AND METHODS
Embryo culture and stagingAdult female X. laevis were injected with 800 i.u. of human chorionicgonadotropin 12-18 hours before spawning. Eggs were squeezed fromfemales and fertilized with sperm released from macerated testis in aminimum volume of one-third strength Ringer’s (R/3), pH 7.8 (33mM NaCl, 0.6 mM KCl, 0.67 mM CaCl2, 0.33 mM MgCl2, 1.16 mMHepes, pH adjusted with NaOH). After cortical contraction, approxi-mately 10 minutes postfertilization at 22°C, the dishes of eggs wereflooded with R/3, pH 7.8. Embryos were left undisturbed until theonset of first cleavage. At first cleavage, embryos were dejellied in2% cysteine-HCl, pH adjusted to 8.0 with NaOH. Regular cleavingembryos were transferred to a Nile Blue labelling buffer (5% Ficollin equal volumes R/3, pH 7.8 and 100 mM sodium phosphate buffer,pH 7.8) Equal volume drops of 1% Nile Blue and 100 mM sodiumcarbonate were mixed in a Petri dish; crystals were picked up with afire polished glass pipette and held against the dorsal midline surfaceof an embryo for a few seconds, marking the dorsal side of the embryowith Nile Blue at the 2-cell stage (Kirschner and Hara, 1980). AfterNile Blue labelling, embryos were cultured in R/3, pH 7.8, 5% Ficollat either 22°C or 15°C. After microinjection at the 32-cell stage,embryos were cultured in R/3, pH 7.8, containing 50 µg/ml gen-tamycin, with or without 5% Ficoll.
Embryos were staged according to Nieuwkoop and Faber (1967)with further finer distinctions during gastrula stages (Keller, 1991).
Selection of regular cleaving embryosWe selected embryos in which the first cleavage bisected the light-dark pigmentation of the animal hemisphere. The paler side of theanimal hemisphere predicts the dorsal side of the embryo (Vincentand Gerhart, 1987; Vincent et al., 1986) and, when the animal hemi-sphere pigment is bisected, the first cleavage plane predicts the futuremidline of the embryo (Masho, 1990). Regularly cleaving embryoswith clear pigmentation asymmetry were labelled with Nile Blue(above). 90-98% of Nile Blue label marks were within 15° on eitherside of the dorsal lip at stage 10. At the 8-cell stage, we eliminatedembryos that did not have a clean horizontal equatorial cleavage.Further selection was made at the 16- and 32-cell stages so that onlyembryos with regular cleavage patterns were used, typically 2-10%of a given spawning.
The nomenclature for blastomere designations at the 32-cell stageis that of Nakamura and Kishiyama (1971; Fig. 1).
Microinjection of lineage labelDorsal Nile Blue marks enabled us to rapidly orient 32-cell embryosin agarose injection wells (Kroll and Gerhart, 1994). Injections wereperformed in R/3, pH 6.5, 5% Ficoll on a cooled stage (15°C). Suttermicrocapillary pipettes were pulled on a Sutter needle puller. Tipswere broken off to a diameter of less than 5 µm. Injections wereexecuted with a Narishige micromanipulator and a Tritech microin-jection controller.
For dorsal injections, embryos were injected with three lineagelabels at stage 6. The A1 blastomere to the left or right of the dorsalmidline was injected with 1-2 nl of fluorescein dextran amine, Mr10×103 (FDA) at a concentration of 50 mg/ml; the B1 blastomere onthe same side was injected with 1-2 nl of Texas Red dextran amine,Mr 10×103 (TxRDA) at 35-50 mg/ml; and the C1 blastomere on thesame side was injected with 2-3 nl of Cascade Blue dextran amine,Mr 10×103 (CBDA) at 100 mg/ml. All lineage tracers were fromMolecular Probes, dissolved in dH2O and filtered through a 0.22 µmfilter before use. These volumes and concentrations balanced bright-ness of label and minimized cell damage. Three needles were used,

3507Composition of the Organizer
each containing a different lineage label; 4-30 embryos were injectedwith one label before switching needles.
Ventral injections were performed in the same way into ventralblastomeres (A4, B4, C4) at stage 6.
For animal cap injections, three tier A blastomeres were injectedwith 1-2 nl of label at the above concentrations: the tier A ventral cell(A4) with FDA; the tier A ventrolateral cell (A3) with CBDA; the tierA dorsal cell (A1) with TxRDA.
All manipulations of fluorescently labelled embryos wereperformed with minimal light exposure.
Embryo fixation and sample preparationEmbryos were fixed without removal of vitelline envelopes at stage6 (immediately following injection), stage 9 (late blastula), stage 10(early gastrula) or stage 12 (late gastrula) in MEMFA (0.1 M MOPS,2 mM EGTA, 1 mM MgSO4, adjusted to pH 7.4 with NaOH and 3.7%formaldehyde; Harland, 1991) overnight at 4°C. Fixed embryos weredehydrated through an ethanol series, cleared in histosol andembedded in paraplast. Embryos were oriented in hot paraplast usinga dissecting microscope so that the plane of section would be parallelto the dorsal midline of the embryo. Thick (13 µm) serial sagittalsections were cut using an AO 820 rotary microtome. Sections weremounted on microscope slides treated with Gatenby-Cowdry adhesive(720 ml dH2O, 15 g gelatin, 1 g chromium potassium sulfate, 300 ml95% methanol, 70 ml acetic acid), dewaxed in xylenes, rehydratedthrough an ethanol series and mounted in Aqua/polymount (Poly-sciences).
Triple exposure photographs were taken on a Zeiss Axiophotmicroscope with Kodak Ektachrome Plus Professional 100 slide filmusing filters optimized for each fluorophore.
Analysis of dorsal lineage label at stages 10 and 12 Ten labelled embryos were analyzed at stage 10, and nine at stage 12,from no fewer than five females. Samples with errors in the plane ofsectioning or showing injection damage were discarded. Embryoswere serially sectioned and all sections for each embryo were counted;the median section was taken to be the midline. Three sections (Fig.2) of each embryo were analyzed: the sagittal section and twoparasagittal sections, five (65 µm) and ten (130 µm) sections awayfrom the sagittal section; we refer to these as the “section positions”.These section positions include roughly a lateral half of the dorsalmarginal zone, from the midline to one lateral edge. Progeny distrib-utions within sections were analyzed on a standardized grid becauseeach embryo and section differs slightly in size and shape. A stan-dardized section (based on the anatomy of several real sections) wasdrawn on paper and subdivided with a grid (Fig. 3). Then we projecteda color slide of each real section onto a different piece of paper andmade a tracing of the outline of the section and labelled regionswithin. The grid was then scaled to fit each tracing using the animal-vegetal axis, the dorsal lip, and the floor of the blastocoel as landmarksat stage 10, and the animal-vegetal axis, tip of the archenteron,boundary between surface and deep cells, the yolk plug, and the dorsallip as landmarks at stage 12. Equal grid spacing and numbers of gridareas were maintained between these landmarks so that all sectionsof each stage could be equated with the standardized section. Theresulting maps contain the data from 30 sections at stage 10 (threesections from each of ten embryos). For stage 12, we mapped the 18sections from the midline and the first parasagittal section (65 µmfrom the midline) directly to one standardized section, but did notinclude the third section position (135 µm from the midline) becauseit was on the edge of the archenteron and included more lateral thanmidline structures.
Controls for D1 leakage In several cases, small amounts of C1-injected lineage label leakedinto the adjacent D1 blastomere, presumably because cytokinesis wasincomplete at the time of injection despite external appearances. On
such occasions, the label in D1 and its progeny was very faint, andusually did not show up in photographs above the background auto-fluorescence. To ensure that we had not scored such descendants ofD1 as C1 descendants, we performed single lineage label injectionsinto D1 blastomeres, and observed the position of the D1 descendantsin at least 5 embryos at each stage 10 and 12. Without performing thesame extensive analysis we did for A1, B1 and C1, we confirmed thatwe had not scored D1 progeny labelled by C1 leakage as C1 progeny(data not shown).
Analysis of other lineage-labelled embryos Dorsally injected stage 9, and ventrally injected stages 10 and 12,embryos were processed and sectioned as described above, but notsubjected to the same degree of analysis. Twenty three stage 9dorsally injected, sectioned embryos from three different femaleswere examined; the three section positions (midline, 65 µm and 130µm away from the midline) were photographed in two embryos.
Sections from five ventrally injected stage 10 and seven ventrallyinjected stage 12 embryos were viewed. Two of each stage were pho-tographed at the three section positions.
Four stage 10 and five stage 12 animal-cap-injected embryos weresectioned and viewed. Two of each were photographed at the threesection positions.
In situ hybridizationEmbryos were fixed as described above except that vitelline envelopeswere removed prior to fixation. Digoxigenin-labelled antisense probesto Xbra (Smith et al., 1991), Gsc (Cho et al., 1991), Nog (Smith andHarland, 1992) and xNR3 (Smith et al., 1995) were used for in situhybridization in whole-mount albino and lineage-labelled pigmentedembryos according to Harland (1991) with the following modifica-tions for the antibody washes and incubations (from T. Doniach,personal communication). After the overnight hybridization, washeswere performed without CHAPS detergent. The embryos werewashed twice in MAB (100 mM maleic acid, 150 mM NaCl, neu-tralized with NaOH to pH 7.5) for 15 minutes, then in MAB plus 2%blocking reagent (Boehringer-Mannheim) for 1 hour. The antibodyincubations were performed in MAB plus block and 20% lamb serum,either overnight at 4°C, or 4 hours at room temperature. The embryoswere washed five times in MAB at room temperature. BM-purple(Boehringer-Mannheim) with 5 mM levamisole was the stainingsubstrate for the alkaline phosphatase reaction. Stained embryos wereembedded, serially sectioned at 20 µm and mounted as describedabove. Sections were photographed using DIC (differential interfer-ence contrast) optics to visualize the in situ staining and fluorescenceoptics to view lineage label as described above.
When in situ hybridization was performed on lineage-labelledembryos, the combined conditions were suboptimal for each signal;good fixation for tissue integrity in sections were unfavorable for goodhybridization, and the hybridization procedure and staining productoften reduced fluorescence of the lineage label.
RESULTS
Working definition of the Organizer’s locationTo describe our results, we have spatially defined theOrganizer at stage 10 and 12, based on previous (Spemann andMangold, 1924; Spemann, 1938; Stewart and Gerhart, 1990)and current (J. S. Zoltewicz, personal communication) func-tional and anatomical descriptions (Keller, 1991) of the dorsalmarginal zone: at stage 10−, the beginning of gastrulation asseen externally, the Organizer occupies a quadrangle from thelevel of the floor of the blastocoel (approximately the futurelimit of involution) to that of the pigment line of the dorsal
3508 M. A. Vodicka and J. C. Gerhart
blastopore lip, about 20 cell diameters in this animal-vegetaldimension and about 60° wide mediolaterally. It is approxi-mately five cells thick in the radial direction, from the surfaceto the depth of the blastocoel wall. This region, which has func-tional Organizer activity, corresponds to the dorsal involutingmarginal zone (IMZ) which will involute during gastrulation
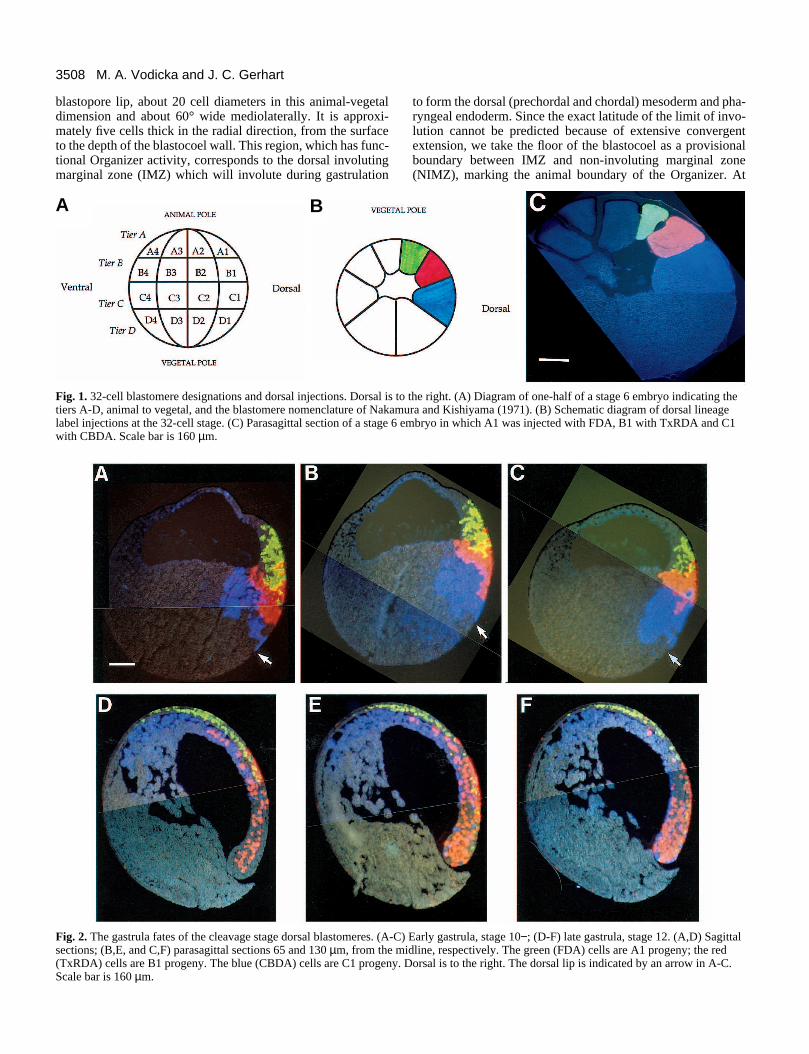
Fig. 1. 32-cell blastomere designations and dorsal injections. Dorsal is ttiers A-D, animal to vegetal, and the blastomere nomenclature of Nakamlabel injections at the 32-cell stage. (C) Parasagittal section of a stage 6 with CBDA. Scale bar is 160 µm.
A B
Fig. 2. The gastrula fates of the cleavage stage dorsal blastomeres. (A-Csections; (B,E, and C,F) parasagittal sections 65 and 130 µm, from the m(TxRDA) cells are B1 progeny. The blue (CBDA) cells are C1 progenyScale bar is 160 µm.
to form the dorsal (prechordal and chordal) mesoderm and pha-ryngeal endoderm. Since the exact latitude of the limit of invo-lution cannot be predicted because of extensive convergentextension, we take the floor of the blastocoel as a provisionalboundary between IMZ and non-involuting marginal zone(NIMZ), marking the animal boundary of the Organizer. At
o the right. (A) Diagram of one-half of a stage 6 embryo indicating theura and Kishiyama (1971). (B) Schematic diagram of dorsal lineage
embryo in which A1 was injected with FDA, B1 with TxRDA and C1
) Early gastrula, stage 10−; (D-F) late gastrula, stage 12. (A,D) Sagittalidline, respectively. The green (FDA) cells are A1 progeny; the red
. Dorsal is to the right. The dorsal lip is indicated by an arrow in A-C.

3509Composition of the Organizer
stage 12, Organizer activity is mostly confined to the pre-sumptive notochord, which lies along the dorsal midline.However, for the purposes of our analysis, we included theanterior (head) mesoderm and some of the more lateral dorsalmesoderm, extending into the presumptive somite regions.
Contributions of dorsal blastomeres to the stage 10Organizer The stage 10 embryo in Fig. 2A-C is representative of the tenanalyzed. Green-labelled cells are descendants of A1; red-labelled cells are descendants of B1 and blue-labelled cells ofC1. When compared with the 32-cell embryo, this stage 10−/10 embryo reveals the strong vegetal displacement oflabelled clones of all three dorsal tiers with respect to theiroriginal positions at the 32-cell stage (Fig. 1C). Labelled cloneshave intermixed slightly at their borders, but borders are stillapparent. In the sagittal section (Fig. 2A), descendants of theC1 blastomere are adjacent to the dorsal lip and descendantsfrom the B1 blastomere are about 4 cell diameters away. In thissection, several A1 descendants are present in the IMZ, sur-rounded by B1 progeny. Thus, descendants from all threedorsal tiers populate the dorsal marginal zone, Spemann’sOrganizer. The parasagittal section, approximately 65 µm fromthe midline (Fig. 2B), is similar. This section has more labelthan the sagittal or more lateral parasagittal sections becauseonly one member of a bilateral pair of dorsal blastomeres was
injected at the 32-cell stage. A1 and B1 descendants haveshifted vegetally into the marginal zone compared to theirstarting positions. Many C1 cells are deeper than the marginalzone and will remain part of the endodermal yolk massaccording to gastrula fate maps (Keller, 1976, 1991). The C1surface area is reduced approximately 70% from stage 6,probably due to the apical constriction of the bottle cells at thedorsal lip (Keller, 1978). The lower boundary of the Organizer,defined by the blastopore, always forms within C1 progeny,i.e., bottle cells are always C1 progeny. The third sectionanalyzed for each embryo was a parasagittal section 130 µmfrom the midline. In this embryo (Fig. 2C), at the outer lateraledges of the dorsal marginal zone seen in this section, the C1descendants populate most of the areas directly adjacent to thedorsal lip and B1 descendants make up a correspondinglysmaller amount of the Organizer. A lateral half of theOrganizer can be entirely accounted for by progeny of threelabelled dorsal blastomeres, a result not revealed whenmapping with fewer than three lineage labels simultaneously.
Of the ten stage 10 embryos analyzed, five had an Organizerlike the example in Fig. 2A-C (approximately 10% A1, 70%B1 and 20% C1). In three others, B1 descendants reach thedorsal lip and populate more of the Organizer, and the C1descendants make up correspondingly less (approximately15% A1, 80% B1, 5% C1). However, in the remaining two,the B1 descendants populate even less, and C1 progeny more,
Fig. 3. Progeny locationsof dorsal blastomeres atearly (stage 10−) and late(stage 12) gastrula.(A,B) Stage 6-10 fatemaps; (C,D) stage 6-12fate maps. (A,C) Modalmaps; (B,D) statisticalmaps. Green indicatesregions populated by A1progeny; red indicatesregions populated by B1progeny and blue indicatesregions populated by C1progeny. Location ofprogeny and their ultimatefates are described in textfor Figs 2, 3. Scatter in Bis due to variation betweenembryos; scatter in Dprimarily is due to cellmixing. Dorsal is to theright. Data include 30sections for stage 10 and18 for stage 12. See textfor details on constructionof fate maps.

3510 M. A. Vodicka and J. C. Gerhart
of the DMZ and Organizer (approximately 5% A1, 45% B1,50% C1). This variation presumably reflects variable cleavageplanes relative to cytoplasmic materials determining the levelof the blastopore and reflects variable cell movementspreceding gastrulation.
Contributions of dorsal blastomeres to the stage 12OrganizerAt this stage, the end of gastrulation, all cells that will involutehave done so (with the exception of tail structures; Gont et al.,1993). The progeny composition of the entire dorsalmesoderm, from the most anterior head mesoderm above thetip of the archenteron, to the most posterior chordal mesodermat the interior edge of the dorsal lip, can be seen (Keller, 1975,1976, 1991). Fig. 2D-F is an example of a stage 12 embryoused to construct the stage 12 fate map. Again a sagittal andtwo parasagittal sections are shown. The extensive intermixingof cells between different labelled populations is most striking.Most lineage label is in the first parasagittal section (Fig. 2E).As expected, the movements of convergent extension duringgastrulation (Keller et al., 1985) have significantly narrowedand elongated the region in which label is distributed. This hasled to intercalations of cells with different labels and no label.
The most anterior mesoderm (prospective head mesoderm;Keller, 1976) in all three sections is made up mostly of C1descendants. A few B1 progeny contribute to the headmesoderm, especially as seen in Fig. 2E. Along the length ofthe remaining dorsal mesoderm, the chordal mesoderm iscomposed of a mixture of B1 and C1 descendants. At theanterior end, C1 progeny predominate and at the posterior endB1 progeny predominate. In the most lateral section (Fig. 2F),the B1 progeny extend less anteriorly; this region of paraxialmesoderm is mostly presomitic (Keller et al., 1989). In sectionscloser to the midline (Fig. 2D,E), the chordal mesoderm thatwill form the notochord (Keller, 1976) and retain inductiveactivity at this stage is made up mostly of B1 descendants. Thenotochord will contain mostly progeny of animal hemisphereblastomeres above the first horizontal cleavage of the 8-cellembryo. In this embryo, there are not many A1 progeny in thedorsal mesoderm, but in other embryos analyzed at stage 12 (7of 9), at least 5 A1-derived cells (of over a hundred total)populate the interior lip region and the most posterior chordalmesoderm. Two of nine have A1 progeny even in the mid-region of the chordal mesoderm. This can be seen in the stage12 fate map (Fig. 3D).
Within individual embryos, the deep cells of the marginalzone shear away from the superficial cell layer and are morelikely to involute (Fig. 2D-F). Near the tip of the archenteron,blue C1 progeny in the involuted superficial layer that will linethe pharynx (Keller, 1975) are next to deep red cells derivedfrom B1 (Figs 2D-F; 4G,E). Many non-involuted B1 progenyoccupy the neurectoderm surface layer. Likewise, involutedA1 progeny are always found in deep layers (Fig. 3B; and datanot shown).
In contrast to the minimal intermingling of labelled clonesat stage 10, clonal boundaries at stage 12 are obliterated byextensive intermixing. Descendants from individual dorsalblastomeres are spread along much of the embryonic axis. B1descendants are the most extreme case; they can contribute toprospective head mesoderm, notochord and neural plate (anon-involuted tissue) in a single embryo. Approximately a
third of the B1 progeny remain uninvoluted. This intermixingand diversity of fates is consistent with what is known aboutgastrulation movements (Keller et al., 1985; Jacobs and Fraser,1994) and with previous fate maps (Keller, 1975; Dale andSlack, 1987; Moody, 1987b).
Modal and statistical fate maps: stage 6 to stages 10and 12 Because of the substantial variation among embryos, a quanti-tative analysis was done to create two kinds of composite fatemaps of dorsal blastomere progeny locations at gastrula stages.
Modal maps in Fig. 3A and C were constructed to representlocations of the majority of each labelled population at stage10 and 12, respectively, showing where progeny of each blas-tomere predominate in most embryos. To do this, each gridarea was assigned one lineage label colour when that labeloccupied the majority of the grid area in the majority of theembryos. In a few grid areas, no one label was in a clearmajority, and the box was split between two (or in one casethree) labels. For stage 10 (Fig. 3A), this “winner takes all”assignment of labels to grid areas gives the average position ofmajority progeny and of clonal boundaries; hence it is calleda Modal map. The procedure tends to sharpen boundaries.Borders between labelled areas are thus clear in vivo and inthe map. However, it is important to remember that, withineach individual embryo (Fig. 2), some mixing between labelledpopulations is not reflected in the summary. For stage 12 (Fig.3C), many grid areas had to be split despite the boundaryenhancement of the Modal map. This reflects extensive cellintermixing and dispersal of clonal boundaries.
The statistical maps in Fig. 3B and D were constructed tobetter represent variation among embryos (especially at stage10) and the variable extent of cell intermixing (especially atstage 12). These include minority contributions of labelledcells in each grid area. To do this, each grid area was assignedlineage label colors in proportion to the relative area andfrequency of each label (or no label) in that grid box in the 30sections at stage 10 and 18 sections at stage 12. Minority andmajority contributions were thus recorded. For stage 10 (Fig.3B), where clonal boundaries in individual embryos areapparent, the slight scatter of the statistical map is due tovariation in boundary positions between embryos. For stage 12(Fig. 3D), the considerable scatter, which is greater than seenin the comparable modal map, is due to some variation betweenembryos but mostly to variable cell intermixing, which isextreme in regions of convergent extension. For instance gridareas near the lip are solid red in Fig. 3C, but contain somegreen in Fig. 3D, because although the majority of cells in theseregions are red, some green cells are nearly always present.
Both kinds of maps confirm the qualitative impressionsstated before: the three tiers that started out more or less ver-tically stacked, A upon B upon C, are rearranged extensivelyby the beginning of gastrulation (stage 10−). The stackbecomes a “U” shape, with C1 cells doubled back upon theline, losing most of their surface exposure as bottle cellsundergo apical constriction. This first indication of involutionat stage 10 becomes exaggerated at stage 12 when the stackhas been completely doubled back so that C1 descendants nowunderlie A1 descendants. Pregastrulation movements makegastrula fate maps (Keller, 1975, 1976) non-superimposable on

3511Composition of the Organizer
the 32-cell embryo because the blastomere positions at stage 6do not coincide with the positions of their progeny at stage 10.
The stage 10 Organizer is clearly made up of cells from threetiers. A large number of the C1 descendants within the invo-luting marginal zone will contribute to the most anteriormesoderm (head mesoderm) at stage 12 and some to anteriorchordal mesoderm; some C1 cells will also form the endoder-mal lining of the pharynx and archenteron roof (Keller, 1975,1976). B1 descendants make up the largest fraction of the stage10 Organizer in both the modal and statistical maps. Thesecells will contribute to head mesoderm and to chordalmesoderm, forming the bulk of the notochord at stage 12. Afew A1-derived cells lie deep within the most animal part ofthe stage 10 Organizer and will contribute to posteriornotochord at stage 12, but most A1 descendants lie within thenon-involuting marginal zone and will contribute to neuralstructures and epidermis.
Pregastrula locations of dorsal blastomere progeny Because labelled cells changed locations between stages 6 and10, we examined intermediate stages to see when this dis-placement occurred. Stage 9 late blastula embryos were fixedapproximately an hour before the first appearance of the dorsallip at 22°C. We examined twenty-three sectioned embryos. Allwere similar to the one shown in Fig. 4A, a parasagittal section,65 µm from the midline. The sagittal and other parasagittalsection are not significantly different. Dorsal blastomeredescendants have been displaced vegetally slightly from theirpositions at the time of injection (Fig. 1C), but have not movedas far vegetally as by stage 10 (Fig. 4C for comparison). A fewcells have spread into neighboring clones, but the borders aremore even and closer to the original shape of the injected blas-tomeres than at stage 10. It appears that most of the cell mixingis due to cell divisions (Keller, 1978) and that pronouncedmovement of these dorsal cells toward the vegetal pole doesnot occur until gastrulation begins (Keller, 1980). The pregas-trula stage 9 dorsal marginal zone (between the level of theblastocoel floor and prospective blastopore) is still made upmostly of C1 descendants with only a small contribution fromB1 descendants. The cells whose progeny will form the bulkof the gastrula Organizer (Stewart and Gerhart, 1990) are stillhigh in the animal hemisphere. Therefore downward displace-ment of the dorsal blastomeres occurs between stages 9 and 10.
Gastrula locations of ventral blastomere progenyWe examined the progeny positions of ventral blastomeres atgastrula stages for comparison with the dorsal blastomeres.Labels were injected at the 32-cell stage as on the dorsal side:A4 with FDA (green), B4 with TxRDA (red), C4 with CBDA(blue).
Cells derived from ventral blastomeres are not displaced asfar vegetally at stage 10 (Fig. 4B) and clones intermix onlyslightly compared to dorsal counterparts (Fig. 4C). C4 progenyoccupy a large area of the embryo surface at the time when C1progeny are displaced vegetally and involuted, occupyingfewer surface positions. This is consistent with the initiation ofgastrulation movements on the dorsal side. Locations of ventrallabelled cells at stage 10 (Fig. 4B) appear more similar tolocations of dorsal blastomere progeny at stage 9 than at stage10 (Fig. 4A,C). C4 descendants make up most of the ventralmarginal zone at stage 10, with only small contributions from
A4 and B4. This anticipates the non-involuted locations ofthese cells at stage 12 (Fig. 4D,E). Involuting tissue of theventral marginal zone is derived mostly from C4, while B4 andA4 progeny make minor equal contributions. As expected(Keller and Danilchik, 1988) less tissue involutes, less cellintermixing occurs and less lengthening of the axis in a vegetaldirection occurs on the ventral side (Fig. 4D-G). Labelledclones on the ventral side are not nearly as dispersed and inter-calated with one another and with unlabelled clones by stage12. But some of the same shearing that occurs on the dorsalside is apparent on the ventral side (Fig. 4E,G). Only deeplabelled cells involute. A significant number of C4 progenyremain on the non-involuted surface in contrast to C1 progenywhich all involute. It is difficult to conclude whether the deepand most anteriorally placed A4 and B4 progeny arrive in theirstage 12 positions by involution or if they cross the boundarybetween the non-involuting surface layer and the mesodermdirectly, without going around the blastopore lip. If they arrivethere by involution, then deep cells must move significantlyfurther than surface cells. If they arrive there by crossing theboundary, it would contrast markedlly with mesodermformation on the dorsal side. In a preliminary confocal studyof whole-mount lineage-labelled embryos, the displacement ofventral clones vegetally, begins at stage 10.25-10.5, when theventral blastopore lip first appears, at least an hour after thecorresponding dorsal movements (data not shown).
In contrast to a recent report (Bauer et al., 1994), we do notsee extensive contribution of A4 and B4 ventral progeny to thedorsal animal cap at either stage 10 or 12. At stage 10 (Fig.4B), one to four scattered cells derived from A4 (out of at least100 cells) may just pass the animal pole onto the dorsal sideby a few cell diameters. Cells never moved in large blocks (Fig.4B). B4 descendants were never seen to move dorsal to theanimal pole. Of seven examined, the stage 12 embryo in Fig.4D is the most extreme example of dorsally displaced A4progeny, a few of which just reach the presumptive neuralregion. B4 progeny are not displaced dorsally. Bauer and col-leagues (1994) examined fewer embryos less completely andmay have inadvertently focused on a few anomalous cases.
Animal cap analysisTo assess further the possibility that ventral animal hemisphereblastomeres contribute to dorsal ectoderm, we injected ventraltier A (A4) with FDA, ventrolateral tier A (A3) with CBDA,and dorsal tier A (A1) with TxRDA, and examined theseembryos at stages 10 and 12. Most (three of four) looked likethe stage 10 embryo shown in Fig. 5, in which no cells derivedfrom A4 are on the dorsal side. In the fourth embryo examinedat stage 10, a few A4 progeny had passed the pole to the dorsalside. Note that ventrolateral blastomere progeny may inhabitthe pole region and intermix with both ventral and dorsal blas-tomere progeny (Fig. 5). This observation explains the absenceof dorsal (A1) progeny at the pole as labelled dorsal clones aredisplaced vegetally (Figs 2A-C; 3A; 4D). For all five embryosexamined at stage 12, no A4 progeny progressed furtherdorsally than those in Fig. 4D.
Tailbud stage fatesWe allowed several dorsally injected embryos to develop totailbud stages 35/36 to confirm that blastomere fates were con-sistent with those expected from previous 32-cell Xenopus fate

3512 M. A. Vodicka and J. C. Gerhart
maps (Dale and Slack, 1987; Moody, 1987b). Fig. 6 is a trans-verse section of the head of a stage 35/36 embryo. A1 (green)progeny contribute to the brain and eye; and B1 (red) progenyto the notochord, loose mesothelium and some neural struc-tures in the eye and brain. Clearly B1 progeny are greatlyscattered, stretching from anterior neural positions to anteriornotochord positions. C1 descendants (blue) are located in the
mesothelium of the head (head mesoderm) and in the pharynx(not shown). These fates are indeed consistent with those pre-viously described (Dale and Slack, 1987; Moody, 1987b).
Regional gene expression in the OrganizerWe compared the expression of four Organizer-specific genesXbra, xNR3, nog and gsc, between stages 10 and 12 in lineage-
Fig. 5. Animal blastomere injections. Early gastrula,stage 10−, parasagittal section, 65 µm from themidline. Green (FDA) cells are progeny of A4; blue(CBDA) cells are progeny of A3; and red (TxRDA)cells are progeny of A1. B is a close-up of the animalcap region in A. Scale bar is 220 µm in A and 97 µmin B.
Fig. 4. Comparison of the locationsof dorsal and ventral cleavage stageblastomere progeny at pregastrulaand gastrula stages. Late blastula,stage 9 dorsally injected embryo(A). Early gastrula stage 10−,ventrally injected (B) and dorsallyinjected (C). Late gastrula, stage12, ventrally injected (D-E) anddorsally injected (F-G). (E,G)Close-ups of the involuted ventraland dorsal mesoderm from D andF, respectively. Green (FDA) cellsare descendants of A1 (A,C,F,G)and A4 (B,D,E); red cells (TxRDA)are descendants from B1 (A,C,F,G)and B4 (B,D,E); blue cells (CBDA)are descendants from C1 (A,C,F,G)and C4 (B,D,E). All sections areparasagittal, approximately 65 µmfrom the midline; dorsal is to theright, except in E and G, dorsal is atthe top with anterior to the left. Thedorsal lip is indicated by an arrowin C. Scale bar for A-C,D,F is 220µm; scale bar for E, G is 97 µm.

3513Composition of the Organizer
Fig. 6. Tailbud fates of dorsal blastomeres. A transverse section ofthe right side of the head of a stage 35/36 tailbud. The brain isindicated by short arrow, the notochord by curved short arrow andthe eye by long arrow. Green (FDA) cells are descendants from A1;red cells (TxRDA) are descendants from B1; and blue cells (CBDA)are descendants from C1. Scale bar is 80 µm.
labelled, sectioned embryos and find significant differ-ences in their regional expression, summarized in Table 1and Fig. 9.
XbraThis Xenopus homologue of the mouse Brachyury or Tgene (Smith et al., 1991) encodes a DNA-binding protein(Kispert and Herrmann, 1993) expressed in the notochordand tailbud, as in zebrafish (Schulte-Merker et al., 1992).The gene product is involved in posterior mesodermformation (Herrmann, 1991; Rashbass et al., 1991). InXenopus, Xbra expression is an immediate early responseto mesoderm induction, occurring in the entire marginalzone of the early gastrula (Smith et al., 1991), not just inthe Organizer. In the late gastrula expression is foundalong the dorsal midline and in a circumblastoporal ring(Green et al., 1992).
At stage 10, Xbra is expressed strongly in deep, and lessstrongly in superficial, cells of the middle of the Organizer(Fig. 7A-C). Expression is excluded from cells at the levelof the blastocoel floor and from the four or five cell layersclosest to the blastopore. About half the cells of theOrganizer express this gene, mostly deep C1 progeny anda few B1 progeny. Xbra expression in the lateral andventral marginal zone (Fig. 7C) was also limited to sub-regions of these areas (Smith et al., 1991; Lemaire andGurdon, 1994).
At stage 12, Xbra is expressed in involuted dorsalmesoderm of the presumptive notochord and in involutedpresumptive pharyngeal endoderm (Fig. 8A,B) by amixture of B1 and C1 descendants mostly, and a few A1descendants in positions near the lip. Xbra expression alsooccurs in non-involuted tissue surrounding the closingblastopore (mixture of A1 and B1 progeny), tissuedestined to form posterior tail mesoderm (Fig. 7C) (Gontet al., 1993). Some of the same cells that expressed Xbraon the dorsal side at stage 10 may still express it at stage12, but it is clear that more dorsal cells express at stage 12than at stage 10. Therefore many cells have transcribednew Xbra message during gastrulation (Table 1).
xNR3The gene encoding this TGF-β family member isexpressed in the dorsal marginal zone of the Xenopus
Fig. 7. Stage 10 Xbra, xNR3, noggin and goosecoid expression.(A) Xbra in situ hybridization; (B) corresponding lineage label;(C) another Xbra in situ hybridization showing staining in thesuperficial layers and in the ventral marginal zone; (D) xNR3 insitu hybridization; (E) corresponding lineage label; (F) anotherxNR3 in situ hybridization demonstrating that intense stainingremains restricted to the superficial layer; (G) nog in situhybridization; (H) corresponding lineage label; (I) anothersection from same embryo where lineage label does not interferewith in situ hybridization signal and the full extent of nogexpression is visible; (J) gsc in situ hybridization;(K) corresponding lineage label. All photographs are of dorsalmarginal zone of 20 µm parasagittal sections from stage 10embryos. Green (FDA) cells are descendants of A1; red(TxRDA) cells are descendants of B1; and blue (CBDA) cellsare descendants of C1. Dorsal is to the right and the dorsal lip isindicated by an arrow or arrowhead in each frame. Scale bar is220 µm.

3514 M. A. Vodicka and J. C. Gerhart
Table 1. Summary of gene expression by lineageA1 B1 C1 D1 Deep Superficial
Stage 10Xbra − + ++ + +noggin − ++ ++ (+) + +xNR3 − ++ + (+) − +goosecoid − ++ + + −
Stage 12Xbra + ++ ++ (−) + +noggin + ++ + (−) + −xNR3 + + − (−) − +goosecoid − + ++ (−) + −
A “+” indicates gene expression in cells of the indicated lineage or positionat that stage; “++” indicates heavy expression or expression in many cells. A“−” indicates absence of gene expression. Parentheses “()” indicate lineage isinferred.
embryo from stage 9 to stage 12 (Smith et al., 1995). At stage10, xNR3 is expressed in superficial cells of the dorsal marginalzone (Fig. 7D-F; Smith et al., 1995), with expression highestin cells just above the lip, but with significant expression incells below the lip. B1 progeny express the highest amount ofxNR3, but some C1 and D1 progeny also express xNR3. Atstage 12 (Fig. 8C,D; Smith et al., 1995) xNR3 message hasnearly disappeared, but remains readily detectable in a fewisolated cells on the exterior surface of the lip. No involutedtissue at either stage 10 or 12 expresses xNR3.
NogginThis gene, expressed in deep and superficial cells throughoutthe Organizer (Fig. 7G,H,I), encodes a secreted protein thatdorsalizes lateral-ventral mesoderm and induces neural tissuefrom ectoderm (Smith and Harland, 1992; Smith et al., 1993;Lamb et al., 1993). Expression is strongest near the dorsal lip(Fig. 7G,I). Like xNR3, nog is also expressed in sub-blasto-poral cells. Near the level of the blastocoel floor, expression isrestricted to, or stronger in, deep cells than in superficial ones(Fig. 7F). nog expression is mostly confined to B1 and C1progeny, with sub-blastoporal expression in D1 progeny.
At stage 12, (Fig. 8E-G) nog is expressed only in the deepinvoluted mesoderm (presumptive notochord), whereas Xbrais also expresed in the involuted superficial layer (prospectivegut endoderm). The majority of expressing cells are B1progeny; some C1 and A1 progeny may also express nog atthe anterior and posterior ends of the axis respectively. At theend of gastrulation, nog is not limited to mesodermal cell types;it is also expressed in the anterior neural plate (Fig. 8G). Asubset of the cells expressing nog at stage 10 probably continueexpressing at stage 12, while some cells switch it off (e.g. sub-blastoporal cells), and others begin to express nog during gas-trulation (Table 1).
goosecoidThis homeobox gene, which is expressed in the Organizer, maybe involved in Organizer activity (Cho et al., 1991) and in thespreading migration of anterior (head) mesoderm of theOrganizer (Niehrs et al., 1993). At stage 10, its expression isconfined to deep cells of the middle to vegetal (anterior) regionof the Organizer, extending to, but not below, the blastopore(Fig. 7J,K). Cells expressing gsc are mostly C1 progeny, asexpected from their positions (Fig. 7K). Detection of stage 12gsc expression in lineage-labelled embryos was difficult.However, Fig. 8H,I reveals expression in the anterior involutedmesoderm, head mesoderm and maybe some anterior chordalmesoderm. These would be mostly C1 progeny.
Thus the four genes are expressed in different regions of thestage 10 Organizer with respect to superficial and deep layersof cells and with respect to animal-vegetal levels (Fig. 9). TheOrganizer may have a more complex organization than thatrevealed by surgical functional experiments thus far.
DISCUSSION
Formation of the dorsal marginal zone andSpemann’s OrganizerPregastrulaWe labelled three blastomeres on the dorsal side of the 32-cell
embryo and examined progeny locations at several times untilthe completion of gastrulation. A1 and B1 blastomeres at thetime of injection are within the animal hemisphere, above thefirst horizontal cleavage; the C1 blastomere is below the firsthorizontal cleavage, straddling the equator (Fig. 1). From latecleavage through blastula stages, cells containing animal hemi-sphere cytoplasm are displaced peripherally and slightlyvegetally as the blastocoel volume increases and cells divide.The animal cap becomes thinner; the bulk of the cellularizedanimal hemisphere cytoplasm moves into the marginal zone(Fig. 1C versus Fig. 4A; see also Keller, 1978, 1980; Tuft,1965). This displacement probably reflects local radial inter-calations because labelled clones remain coherent andminimally intermixed (Fig. 4A). Cell division and radial inter-calation characterize this pregastrula morphogenesis (Keller,1978, 1980). By stage 9 the labelled clones have beendisplaced vegetally and are still coherent, and progeny in thesurface and deep layers remain superimposed (Fig. 4A). Thedisplacement of the animal hemisphere cells into the marginalzone prior to gastrulation occurs to about the same extent onthe dorsal and ventral sides of the embryo (Fig. 4A,B) (Keller,1980).
Beginning of gastrulationGastrulation is marked by active cell movements beginning onthe dorsal side. By the time that the dorsal pigment line of theblastopore lip is visible (stage 10−), the animal cap cells anddorsal marginal zone cells have been strongly displaced tomore vegetal positions, partially due to the reduction of surfacearea by the apical constrictions of bottle cells (Keller, 1980),causing C1 progeny to involute around an “internal blastoporelip” and taking B1 descendants within a few cell diameters ofthe bottle cells (Figs 2A-C; 3A). Labelled clones begin inter-mixing, indicating active cell movement in addition to overalltissue displacement. At stage 10−, the Organizer, defined as thedorsal marginal zone from the blastocoel floor to the blasto-pore lip, 4 or 5 cell layers deep and 60° wide, is composed ofC1 progeny just above the dorsal lip, B1 progeny through mostof its volume and A1 progeny at its most animal boundary(Figs 2A-C; 3A). The cellular composition of this geometri-cally defined zone is greatly different at stage 10 compared tostages 6 and 9 (Figs 1C,B; 4A).
The Organizer is formed by cells containing cytoplasm orig-inating mostly above the first horizontal cleavage (B1), but it

3515Composition of the Organizer
is uncertain what is required by these blastomeres to form theOrganizer. Our results do not allow us to distinguish between(1) dorsal animal blastomere autonomy as a result of corticalrotation and (2) vegetal induction by the Nieuwkoop Center.
In contrast to a recent report (Bauer et al., 1994) that thestage 10 Organizer is made up almost exclusively of B1-derived cells, we find that C1 descendants make up as muchas 45% of the Organizer in some embryos, and typically makeup 20% of the Organizer at the beginning of gastrulation,mostly occupying the vegetal, leading part, prospective forhead mesoderm. This is consistent with the location of C1progeny in head mesoderm in our stage 12 embryos and withgastrula fate maps (Keller, 1975, 1976). Paradoxically, Baueret al. (1994) report C1 descendants in head mesoderm at stage13 though not in their stage 10 marginal zone. There are severalpossibilities to explain the discrepancy between our stage 10data and theirs. Their summary diagram depicts a later gastrula,stage 10+ (Keller, 1991), when prospective anterior Organizerhas already involuted significantly and they may have over-looked the significant contribution of C1 progeny to theOrganizer. Their study involved fewer embryos and lessextensive analysis of variation, and so their examples may havefortuitously contained only embryos with few C1 progeny inthe Organizer, as happens in a minority of our cases. Or inemphasizing the consensus that B1 progeny populate themajority of the stage 10 Organizer, they may have under-rep-resented the variation and the contributions from the A1 andC1 blastomeres.
The dorsal displacement of ventral animal blastomereprogeny as described by Bauer et al. (1994) was undetectableamong our twelve ventrally injected and nine animal capinjected embryos, even though we specifically looked for suchcell behavior. However, lateral or off-angle (oblique to themidline) sections produce the illusion of a dorsal position forsome ventral (A4) progeny (data not shown). We see progenycontributions from the lateral blastomere to the dorsal animalcap (Fig. 5). Unlike embryos described by Bauer et al. (1994)animal cap expansion appears uniform in our embryos, at leastin a dorsal-ventral direction (also observed by Keller; 1978).We see no evidence for epiboly significantly altering the cyto-plasmic composition of the animal cap in a ventrodorsaldirection and thus no rationale for this contributing to changesin animal cap competence.
End of gastrulationAt the end of gastrulation, stage 12, when involution iscomplete (except for perhaps fewer than 5 cell diameters; Gontet al., 1993), extensive intermixing of labelled clones with oneanother and with unlabelled lateral clones has occurred (Figs2D-F; 3C,D; 4F,G). This reflects the migratory cell behaviorof head mesoderm cells, and the radial and mediolateral con-vergence and extension of the chordal mesoderm cells duringgastrulation (Keller et al., 1989). Positions of labelled progenyin stage 12 relative to positions in stage 10 are consistent withprevious predictions of cell locations between these two stages(Keller, 1975, 1976). Significant shear between deep andsuperficial cells leads to the more anterior cells of a labelledclone being in deep positions compared to the superficialpositions of the more posterior cells of the clone. This meansthe limit of involution is not the same for superficial and deepcells of the marginal zone. The limit is higher, more animal,
for deep than for superficial cells. The stage 12 Organizer atits anterior end is made up of C1 and B1 descendants; whereasthe middle and posterior are mostly B1 descendants. A1descendants may occupy the most posterior regions. At thisstage neighboring cells are just as likely to be from twodifferent clones as from the same one; boundaries betweendifferent clones are indistinct. This is in contrast to the morecontiguous relationship of labelled cells at stage 10.
Ventral marginal zoneFrom the 32-cell stage through cleavage and early blastulastages, the movements and positions of ventral labelled clonesappear equivalent to those on the dorsal side, with gradual dis-placement of cells vegetally as the blastocoel expands (Fig. 4B,data not shown). Because gastrulation begins on the dorsalside, the cellular composition of the ventral and dorsalmarginal zones differ at stage 10. The C4 progeny still occupymost of the ventral marginal zone (Fig. 4B), while the B1progeny occupy most of the dorsal marginal zone (Fig. 4C).Only at stage 10.5 when the ventral lip appears are ventrallabelled clones displaced vegetally towards the lip (data notshown). The ultimate extent of involution and vegetallydirected elongation on the ventral side is much less than on thedorsal side. C4 cells make up most of the involuted mesoderm,with only a few contributions from A4 and B4 progeny (Fig.4D,E). We infer from the position of labelled cells at stage 12,that ventral mesoderm may be formed not merely by involu-tion, but by some cells ingressing directly from the ectodermallayer to the mesodermal without going around the blastoporelip. This would mean that the morphogenesis of mesodermformation is different on the dorsal and ventral sides. Morethorough investigation of ventral tissue morphogenesis isrequired to demonstrate this ingression.
Gene expression domains subdivide the OrganizerThe Organizer – defined by its inductive activity and ability toorganize the body axis during the morphogenesis of gastrula-tion – is a set of cells with changing members and geneexpression repertoire. The geometric region of the dorsalmarginal zone from stage 6 to 10 also changes its cellular com-position. C1 progeny populate the greater part of the stage 9dorsal marginal zone when Organizer-specific gene expressionbegins. Not much is known about the changes in regional geneexpression between the late blastula and early gastrula, but wehave shown that the cellular composition of the dorsal marginalzone changes between these two stages. By stage 10, B1progeny make up the majority of the Organizer and mosthighly express the Organizer genes examined (Table 1),whereas C1 progeny have mostly been displaced inward.
The expression patterns of four genes Xbra, gsc, xNR3 andnog delineate Organizer subregions (Figs 7, 9). The region ofoverlap between xNR3 and nog expression defines a vegetal(anterior), superficial domain of the stage 10 Organizer,extending below the dorsal lip. It is rarely considered thatOrganizer inductive functions extend below the blastopore. Amore animal (posterior) superficial domain is defined by theregion of overlapping expression of Xbra, nog and, possibly,xNR3. Furthermore, within the deep cells of the stage 10Organizer, two gene expression domains exist, a vegetal(anterior) domain defined by nog and gsc overlap and ananimal (posterior) domain defined by nog and Xbra. These

3516 M. A. Vodicka and J. C. Gerhart
Stage 12 Xbra, xNR3, noggin and goosecoid expression. (A) Xbra inbridization; (B) corresponding lineage label; (C) xNR3 in situization with arrow indicating single positive staining cell; (D)ponding lineage label; (E) nog in situ hybridization; (F) lineage label of-lateral section (because we sometimes encountered incompatibilitiesn lineage label and hybridization signal, we used one section forng nog expression on the unlabelled half of the embryo and a contra- section for lineage analysis); (G) nog in situ hybridization, albinoo: neural plate and chordal mesoderm staining both visible; (H) gsc inbridization; (I) corresponding lineage label: only TxRDA labeled procedure. All 20 µm parasagittal sections. Green (FDA) cells aredants of A1; red (TxRDA) cells are descendants of B1; and blue) cells are descendants of C1. Dorsal is at the top with anterior to the
ale bar is 220 µm in A,B,E,F,H,I; 187 µm in C and D; 172 µm in G.
Organizer subregions do not coincide with lineage boundariesof the 32-cell stage blastomeres.
At stage 12, cell configurations and gene expression withinthe Organizer are significantly altered from stage 10 (Figs 8,9). nog, Xbra, gsc and xNR3 expression domains are morediscreet and less overlapping. Roughly two domains aredefined within the deep cells of the stage 12 Organizer. gscexpression corresponds with the most anterior mesoderm(mostly C1 progeny), the prechordal plate head mesoderm; atstage 10, this tissue had also expressed nog. The overlap of nogand Xbra expression defines a domain of involuted tissue cor-responding to deep chordal mesoderm posterior to the pre-chordal plate (mostly B1 progeny with some C1 and A1progeny). Xbra expression alone defines the superficialinvoluted tissue fated to become endoderm. Theremaining stage 12 expression domains of the“Organizer” genes, Xbra, xNR3 and nog are no longerwithin the Organizer. A second domain of nogginexpression appears in the anterior neural plate. Xbraexpression extends to deep and superficial layers ofnon-involuting tissue on the exterior of the blastopore;Xbra continues expression in the tailbud, potentially alater site of Organizer function. xNR3 is only expressedin a few superficial non-involuted cells.
Finer mapping by in situ hybridization with multipleprobes simultaneously in a single embryo (Jowett andLettice, 1994; Knecht et al, 1995) will better resolvethe gene expression boundaries. For instance, at stage10, gsc and Xbra expression appear to be mutuallyexclusive; and we have drawn the gsc and nog domainsas non-overlapping at stage 12 (Fig. 9), even thoughthey may overlap at their edges (Fig. 8E,G,H).However, our data cannot resolve these boundaries andpotential overlaps conclusively.
At stage 12, C1 and B1 descendants compose mostof the dorsal mesoderm, but some cells that belongedto the Organizer at stage 10 may not be present in thedorsal mesoderm, and the remaining cells are exten-sively rearranged with respect to nearest neighbors andto their anterior-posterior position in the embryo.Likewise, molecular expression patterns within thesecells have altered. For instance, between stages 10 and12, noggin expression is reduced from the entireOrganizer to a subset of the dorsal mesoderm formedby cells of the Organizer. Therefore any anterior-posterior positional information present at stages 9 and10 must be plastic enough at the cellular level to allowreassignment between early and late stages, during andafter morphogenesis has altered cell neighbor relation-ships. The combination of our lineage and in situhybridization results demonstrates that a cell’s positionor location within the embryo at a given stage is morelikely than its lineage relationships to determine whichgenes are expressed.
Consequences for experimentalmanipulationsFate mapping of the Xenopus embryo by lineage-labelling blastomeres is inherently imprecise becausecleavage planes vary between embryos without effecton development. Embryos with irregular cleavage
Fig. 8.situ hyhybridcorrescontrabetweedetectilateralembrysitu hysurvivdescen(CBDAleft. Sc
planes, or those in which cleavage planes are intentionally re-oriented (Black and Vincent, 1988), develop normally,implying that normal development does not depend upon seg-regation of the early cytoplasm into particular blastomeres orupon lineage relationships. Fate maps from early embryoswould ideally map cytoplasmic localities, not lineages. Cellsare marked because there is no way to mark and follow cyto-plasmic localities. Thus, it is important to recognize that it isthe region of the embryo, the cytoplasm enclosed by a givenblastomere, that is really mapped. For intermediate and finalfate maps to be valuable to the researcher (e.g. for targeting ofconstructs or manipulations), regular cleaving embryos mustbe used if the position of early blastomeres is to have any pre-dictive value of their progeny locations at later stages.

3517Composition of the Organizer
XbranoggingoosecoidxNR3
A
B
Fig. 9. Gene expression summary. Schematic section diagrams ofstage 10 dorsal marginal zone (A) and stage 12 dorsal half of anembryo (B). Xbra expression is represented by dark blue-purpletriangles; nog expression by magenta circles; gsc expression by goldrectangles and xNR3 expression by cyan squares. The dotted line inthe uninvoluted marginal zone is to indicate the approximateboundary between anterior and posterior organizing influences (J. S.Zoltewicz and J. C. Gerhart, personal communication).
Because classical genetics cannot be used to study Xenopusdevelopment, injection of overexpression (Vize et al., 1991) ordominant negative (Hemmati-Brivanlou and Melton, 1992;Amaya et al., 1991; MacNicol et al., 1993) constructs has beenused for molecular perturbation. To perturb developmentalevents by injection or manipulation, it is important to know theblastomere fates of the cleavage stage embryo at the stage ofinterest. For instance to affect the majority of the Organizer atstage 10, the B1 blastomere is the best target. Progeny of B1are most likely to occupy the stage 10 Organizer and to expressthe Organizer-specific genes, nog, gsc and xNR3. This is notobvious as one might assume from 32-cell blastomerepositions that the C1 progeny would occupy most of theOrganizer at stage 10. However, to hit the head mesodermposition of the Organizer, C1 is the better target.
Organizer boundariesOur cell lineage and regional gene expression data require are-evaluation of stage 10 Organizer boundaries. Our pro-visional boundary of the early gastrula Organizer in the radialdimension was about 5 cells deep, and Organizer geneexpression (Xbra and gsc) falls within this boundary. Thelineage data compared between stages 10 and 12 also confirm
that these cells will involute to form the dorsal mesoderm. Thefailure of all B1 progeny to involute, even though they werevegetal to our initial placement of the animal boundary at thefloor of the blastocoel, indicate this placement was too high.Likewise, the boundaries of the most animal expressing genesexamined in the marginal zone, Xbra and nog, are two to threecells below the floor of the blastocoel. If the functionalOrganizer is bounded by the limit of involution, and thesegenes represent Organizer function, then the animal boundaryof the Organizer must be 2 to 4 cells below the floor of theblastocoel. The dorsal lip is the canonical vegetal boundary tothe Organizer, but at least two “Organizer” genes, nog andxNR3, are expressed below the lip, in non-involuting D1progeny. The expression patterns of Xbra, nog, gsc and xNR3may represent the true Organizer boundaries, but a moreprecise examination of stage-specific Organizer function andanatomy is necessary to be conclusive.
The organization of the OrganizerWe have examined only four genes, and a rapidly increasingnumber are known to be expressed in and sometimes restrictedto the Organizer. The cellular and molecular organization ofthe Organizer is already complex at stage 10, reviving the pos-sibility of separate (head versus trunk/tail) Organizers(reviewed in Gerhart et al., 1991) supported by recent resultsin the mouse (Shawlot and Behringer, 1995). Nevertheless, thisstage 10 organization must allow for the variability betweenembryos and rearrangement of cells during the morphogenesisof gastrulation. Further mapping of gene expression domains,how they overlap or are excluded from one another, and howthe domains change from the late blastula and continuingthrough the end of gastrulation can be combined with func-tional tests of gene and tissue activity to further clarify theorganization of the Organizer.
The authors thank David Weisblat for the use of his microscope;Jeremy B. A. Green, Ray E. Keller, Kristen L. Kroll and Michael D.Sheets, for helpful discussions and comments on the manuscript;Richard M. Harland and William C. Smith for discussion and sharingof unpublished data and reagents; J. Susie Zoltewicz and TabithaDoniach for discussion and sharing of unpublished data; and AnnPoznanski for help with in situ hybridization. This research wassupported by NIH grant GM 19363 to J. G.; M. A. V. was a predoc-toral fellow of NIH training grant HD 07375.
REFERENCES
Amaya, E., Musci, T. J. and Kirschner, M. W. (1991). Expression of adominant negative mutant of the FGF receptor disrupts mesoderm formationin Xenopus embryos. Cell 66, 257-70.
Bauer, D. V., Huang, S. and Moody, S. A. (1994). The cleavage stage originsof Spemann’s Organizer: analysis of the movements of blastomere clonesbefore and during gastrulation in Xenopus. Development 120, 1179-1189.
Black, S. D. and Vincent, J. P. O. (1988). The first cleavage plane and theembryonic axis are determined by separate mechanisms in Xenopus laevis. II.Experimental dissociation by lateral compression of the egg. Dev. Biol. 128,65-71.
Cho, K. W., Blumberg, B., Steinbeisser, H. and De Robertis, E. M. (1991).Molecular nature of Spemann’s Organizer: the role of the Xenopushomeobox gene goosecoid. Cell 67, 1111-20.
Cooke, J. and Webber, J. A. (1985). Dynamics of control of body pattern inthe development of Xenopus laevis. I. Timing and pattern in the developmentof dorsoanterior and posterior blastomere pairs, isolated at the 4-cell stage. J.Embryol. Exp. Morphol. 88, 113-33.
Dale, L. and Slack, J. M. (1987). Fate map for the 32-cell stage of Xenopuslaevis. Development 99, 527-51.

3518 M. A. Vodicka and J. C. Gerhart
Dirksen, M. L. and Jamrich, M. (1992). A novel, activin-inducible,blastopore lip-specific gene of Xenopus laevis contains a fork head DNA-binding domain. Genes Dev. 6, 599-608.
Gerhart, J., Doniach, T. and Stewart, R. (1991). Organizing the XenopusOrganizer. In Gastrulation. (ed. R. E. Keller), pp. 57-77. New York: PlenumPress.
Gont, L. K., Steinbeisser, H., Blumberg, B. and de Robertis, E. M. (1993).Tail formation as a continuation of gastrulation: the multiple cell populationsof the Xenopus tailbud derive from the late blastopore lip. Development 119,991-1004.
Green, J. B. A., New, H. and Smith, J. C. (1992). Responses of embryonicXenopus cells to activin and FGF are separated by multiple dose thresholdsand correspond to distinct axes of the mesoderm. Cell 71, 731-739.
Hama, T., Hidenobu, T., Kaneda, R., Takata, K., and Ohara, A. (1985).Inductive capacities for the dorsal mesoderm of the dorsal marginal zone andpharyngeal endoderm in the very early gastrula of the newt, and presumptivepharyngeal endoderm as an initiator of the organization center. Develop.Growth and Differ. 27, 419-433.
Harland, R. M. (1994). Neural induction in Xenopus. Curr. Op. Gen. Dev. 4,543-549.
Harland, R. M. (1991). In situ hybridization: an improved whole-mountmethod for Xenopus embryos. Meth. Cell Biol. 36, 685-95.
Hemmati-Brivanlou, A. and Melton, D. A. (1992). A truncated activinreceptor inhibits mesoderm induction and formation of axial structures inXenopus embryos. Nature 359, 609-14.
Herrmann, B. G. (1991). Expression pattern of the Brachyury gene in whole-mount Twis/Twis mutant embryos. Development 113, 913-917.
Jacobs, R. E. and Fraser, S. E. (1994). Magnetic resonance microscopy ofembryonic cell lineages and movements. Science 263, 681-684.
Jowett, T. and Lettice, L. (1994). Whole-mount in situ hybridizations onzebrafish embryos using a mixture of digoxigenin- and fluorescein-labelledprobes. TIGS 10, 73-74.
Keller, R. E. (1975). Vital dye mapping of the gastrula and neurula of Xenopuslaevis I. Prospective areas and morphogenetic movements of the superficiallayer. Dev. Biol. 42, 222-241
Keller, R. E. (1976). Vital dye mapping of the gastrula and neurula of Xenopuslaevis II. Prospective areas and morphogenetic movements of the deep layer.Dev. Biol. 51, 118-137.
Keller, R. E. (1978). Time-lapse cinemicrographic analysis of superficial cellbehavior during and prior to gastrulation in Xenopus laevis. J. Morph. 157,223-247.
Keller, R. E. (1980). The cellular basis of epiboly: an SEM study of deep-cellrearrangement during gastrulation in Xenopus laevis. J. Embryol. Exp.Morph. 60, 201-34.
Keller, R. (1991). Early embryonic development of Xenopus laevis. Meth. CellBiol. 36, 61-113.
Keller, R. and Danilchik, M. (1988). Regional expression, pattern and timingof convergence and extension during gastrulation of Xenopus laevis.Development 103, 193-209.
Keller, R. E., Danilchik, M., Gimlich, R. and Shih, J. (1985). The functionand mechanism of convergent extension during gastrulation of Xenopuslaevis. J. Embryol. Exp. Morph. 89, 185-209.
Keller, R., Cooper, M. S., Danilchik, M., Tibbetts, P. and Wilson, P. A.(1989). Cell intercalation during notochord development in Xenopus laevis.J. Exp. Zool. 251, 134-54.
Kirschner, M. W. and Hara, K. (1980). A new method of local vital stainingof amphibian embryos using ficoll and “crystals” of Nile Red. Mikroskopie36, 12-15.
Kispert, A. and Herrmann, B. G. (1993). The Brachyury gene encodes anovel DNA binding protein. Embo J. 12, 3211-3220.
Knecht, A. K., Good, P. J., Dawid, I. B. and Harland, R. M. (1995). Dorsal-ventral patterning and differentiation of noggin-induced neural tissue in theabsence of mesoderm. Development 121, 1927-1936.
Knochel, S., Lef, J., Clement, J., Klocke, B., Hille, S., Koster, M. andKnochel, W. (1992). Activin A induced expression of a fork head relatedgene in posterior chordamesoderm (notochord) of Xenopus laevis embryos.Mech. Dev. 38, 157-65.
Kroll, K. L. and Gerhart, J. C. (1994). Transgenic X. laevis embryos fromeggs transplanted with nuclei of transfected cultured cells. Science 266, 650-653.
Lamb, T. M., Knecht, A. K., Smith, W. C., Stachel, S. E., Economides, A.N., Stahl, N., Yancoplous, G. D. and Harland, R. M. (1993). Neuralinduction by the secreted polypeptide noggin. Science 262, 713-718.
Lemaire, P. and Gurdon, J. B. (1994). A role for cytoplasmic determinants inmesoderm patterning: cell-autonomous activation of the goosecoid and
Xwnt-8 genes along the dorsoventral axis of early Xenopus embryos.Development 120, 1191-1199.
MacNicol, A. M., Muslin, A. J. and Williams, L. T. (1993). Raf-1 kinase isessential for early Xenopus development and mediates the induction ofmesoderm by FGF. Cell 73, 571-83.
Masho, R. (1990). Close correlation between the first cleavage plane and thebody axis in early Xenopus embryos. Develop. Growth & Differ. 32, 57-64.
Moody, S. A. (1987a). Fates of the blastomeres of the 16-cell stage Xenopusembryo. Dev. Biol. 119, 560-78.
Moody, S. A. (1987b). Fates of the blastomeres of the 32-cell-stage Xenopusembryo. Dev. Biol. 122, 300-19.
Nakamura, O. and Kishiyama, J. (1971). Prospective fates of blastomeres atthe 32 cell stage of Xenopus laevis embryos. Proc. J. Acad. 47, 407-412.
Niehrs, C., Keller, R., Cho, K. W. and De Robertis, E. M. (1993). Thehomeobox gene goosecoid controls cell migration in Xenopus embryos. Cell72, 491-503.
Nieuwkoop, P. D. and Faber, J. (1967). Normal Table of Xenopus laevis.Amsterdam, North-Holland Publishing Company.
Rashbass, P., Cooke, L. A., Herrmann, B. G. and Beddington, R. S. (1991).A cell autonomous function of Brachyury in T/T embryonic stem cellchimaeras. Nature 353, 348-351.
Saha, M. S. and Grainger, R. M. (1992). A labile period in the determinationof the anterior-posterior axis during early neural development in Xenopus.Neuron 8, 1003-14.
Sasai, Y., Lu, B., Steinbeisser, H., Geissert, d., Gont, L. K. and DeRobertis,E. M. (1994). Xenopus chordin: a novel dorsalizing factor activated byOrganizer-specific homeobox genes. Cell 79, 779-790.
Schulte-Merker, S., Ho, R. H., Herrmann, B. G. and Nusslein-Volhard, C.(1992). The protein product of the zebrafish homologue of the mouse T geneis expressed in nuclei of the germ ring and the notochord of the early embryo.Development 116, 1021-1032.
Shawlot, W. and Behringer, R. R. (1995). Requirement for Lim1 in head-Organizer function. Nature 374, 425-430.
Shih, J. and Keller, R. (1992). The epithelium of the dorsal marginal zone ofXenopus has Organizer properties. Development 116, 887-899.
Smith, J. C., Price, B. M. J., Green, J. B. A., Weigel, D. and Herrmann, B.(1991). Expression of the Xenopus homolog of Brachyury (T) is animmediate-early response to mesoderm induction. Cell 67, 79-87.
Smith, W. C. and Harland, R. M. (1992). Expression cloning of noggin, a newdorsalizing factor localized to the Spemann Organizer in Xenopus embryos.Cell 70, 829-40.
Smith, W. C., Knecht, A. K., Wu, M. and Harland, R. M. (1993). Secretednoggin protein mimics the Spemann Organizer in dorsalizing Xenopusmesoderm. Nature 361, 547-549.
Smith, W. C., McKendry, R. M. and Harland, R. M. (1995). A nodal-relatedgene defines a physical and functional domain within the SpemannOrganizer. Cell 82, 37-46.
Spemann, H. (1938). Embryonic Development and Induction. New Haven:Yale University Press.
Spemann, H. and Mangold, H. (1924). Uber Induction von Embryoanlagendurch Implantation artfremder Organisatoren. Arch. Mikr. Anat. EntwMech.100, 599-638.
Stewart, R. M. and Gerhart, J. C. (1990). The anterior extent of dorsaldevelopment of the Xenopus embryonic axis depends on the quantity ofOrganizer in the late blastula. Development 109, 363-72.
Taira, M., Jamrich, M., Good, P. J. and Dawid, I. B. (1992). The LIMdomain-containing homeo box gene Xlim-1 is expressed specifically in theOrganizer region of Xenopus gastrula embryos. Genes Dev. 6, 356-66.
Tuft, P. (1965). The uptake and distribution of water in the developingamphibian embryo. Soc. Exp. Biol. Symp. 19, 385-402.
Vincent, J. P. and Gerhart, J. C. (1987). Subcortical rotation in Xenopus eggs:an early step in embryonic axis specification. Dev. Biol. 123, 526-39.
Vincent, J. P., Oster, G. F. and Gerhart, J. C. (1986). Kinematics of graycrescent formation in Xenopus eggs: the displacement of subcorticalcytoplasm relative to the egg surface. Dev. Biol. 113, 484-500.
Vize, P. D., Melton, D. A., Hemmati-Brivanlou, A. and Harland, R. M.(1991). Assays for gene function in developing Xenopus embryos. InMethods in Cell Biology 36 (ed. B. K. Kay and H. B. Peng), pp. 361-381. SanDiego: Academic Press, Inc.
von Dassow, G., Schmidt, J. E. and Kimelman, D. (1993). Induction of theXenopus Organizer: expression and regulation of Xnot, a novel FGF andactivin-regulated homeo box gene. Genes Dev. 7, 355-66.
(Accepted 11 July 1995)


