Blackstone Property Partners Europe Holdings S.a r.l.
18
Blackstone Property Partners Europe Holdings S.a r.l. Primary Credit Analyst: Manish Kejriwal, Dublin + 353 (0)1 568 0609; [email protected] Secondary Contact: Marie-Aude Vialle, Paris (33) 6-1566-9056; [email protected] Table Of Contents Credit Highlights Outlook Our Base-Case Scenario Company Description Peer Comparison Business Risk Financial Risk Liquidity Covenant Analysis Issue Ratings - Subordination Risk Analysis Ratings Score Snapshot Related Criteria WWW.STANDARDANDPOORS.COM/RATINGSDIRECT NOVEMBER 12, 2020 1
Transcript of Blackstone Property Partners Europe Holdings S.a r.l.

Blackstone Property Partners EuropeHoldings S.a r.l.
Primary Credit Analyst:
Manish Kejriwal, Dublin + 353 (0)1 568 0609; [email protected]
Secondary Contact:
Marie-Aude Vialle, Paris (33) 6-1566-9056; [email protected]
Table Of Contents
Credit Highlights
Outlook
Our Base-Case Scenario
Company Description
Peer Comparison
Business Risk
Financial Risk
Liquidity
Covenant Analysis
Issue Ratings - Subordination Risk Analysis
Ratings Score Snapshot
Related Criteria
WWW.STANDARDANDPOORS.COM/RATINGSDIRECT NOVEMBER 12, 2020 1
Blackstone Property Partners Europe Holdings S.ar.l.
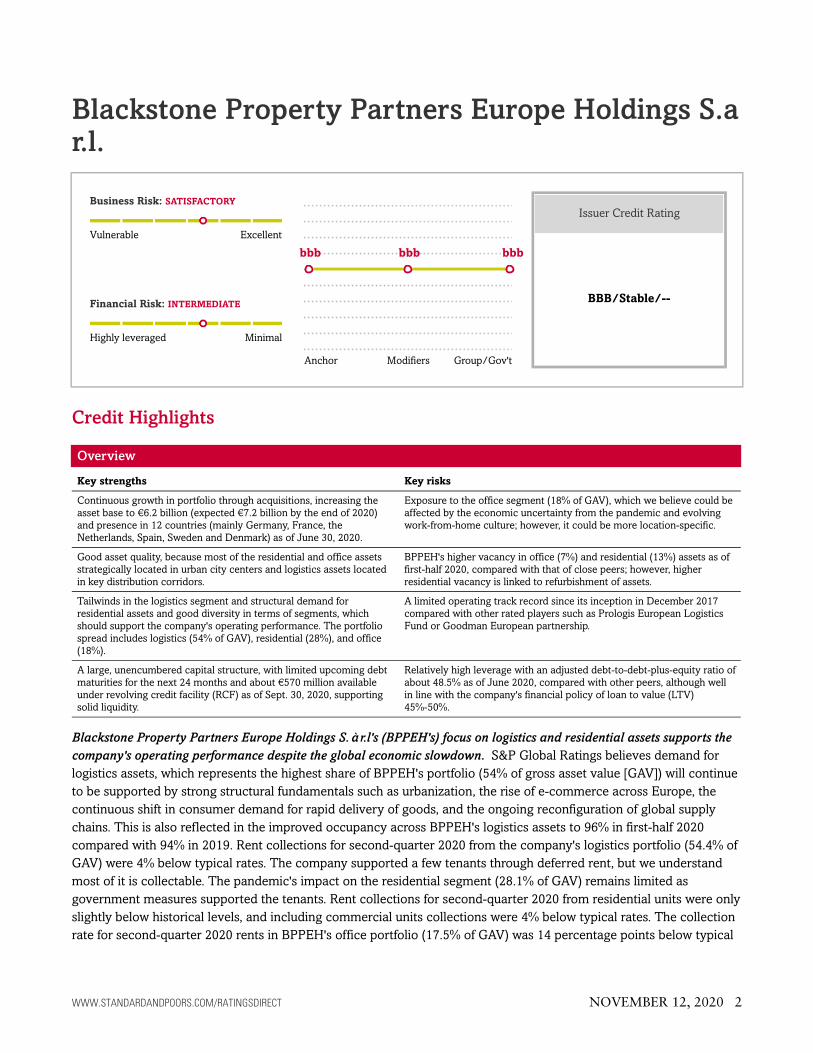
Business Risk: SATISFACTORY
Vulnerable Excellent
Financial Risk: INTERMEDIATE
Highly leveraged Minimal
bbb bbb bbb
Anchor Modifiers Group/Gov't
Issuer Credit Rating
BBB/Stable/--
Credit Highlights
Overview
Key strengths Key risks
Continuous growth in portfolio through acquisitions, increasing the
asset base to €6.2 billion (expected €7.2 billion by the end of 2020)
and presence in 12 countries (mainly Germany, France, the
Netherlands, Spain, Sweden and Denmark) as of June 30, 2020.
Exposure to the office segment (18% of GAV), which we believe could be
affected by the economic uncertainty from the pandemic and evolving
work-from-home culture; however, it could be more location-specific.
Good asset quality, because most of the residential and office assets
strategically located in urban city centers and logistics assets located
in key distribution corridors.
BPPEH's higher vacancy in office (7%) and residential (13%) assets as of
first-half 2020, compared with that of close peers; however, higher
residential vacancy is linked to refurbishment of assets.
Tailwinds in the logistics segment and structural demand for
residential assets and good diversity in terms of segments, which
should support the company's operating performance. The portfolio
spread includes logistics (54% of GAV), residential (28%), and office
(18%).
A limited operating track record since its inception in December 2017
compared with other rated players such as Prologis European Logistics
Fund or Goodman European partnership.
A large, unencumbered capital structure, with limited upcoming debt
maturities for the next 24 months and about €570 million available
under revolving credit facility (RCF) as of Sept. 30, 2020, supporting
solid liquidity.
Relatively high leverage with an adjusted debt-to-debt-plus-equity ratio of
about 48.5% as of June 2020, compared with other peers, although well
in line with the company's financial policy of loan to value (LTV)
45%-50%.
Blackstone Property Partners Europe Holdings S.à r.l's (BPPEH's) focus on logistics and residential assets supports the
company's operating performance despite the global economic slowdown. S&P Global Ratings believes demand for
logistics assets, which represents the highest share of BPPEH's portfolio (54% of gross asset value [GAV]) will continue
to be supported by strong structural fundamentals such as urbanization, the rise of e-commerce across Europe, the
continuous shift in consumer demand for rapid delivery of goods, and the ongoing reconfiguration of global supply
chains. This is also reflected in the improved occupancy across BPPEH's logistics assets to 96% in first-half 2020
compared with 94% in 2019. Rent collections for second-quarter 2020 from the company's logistics portfolio (54.4% of
GAV) were 4% below typical rates. The company supported a few tenants through deferred rent, but we understand
most of it is collectable. The pandemic's impact on the residential segment (28.1% of GAV) remains limited as
government measures supported the tenants. Rent collections for second-quarter 2020 from residential units were only
slightly below historical levels, and including commercial units collections were 4% below typical rates. The collection
rate for second-quarter 2020 rents in BPPEH's office portfolio (17.5% of GAV) was 14 percentage points below typical
WWW.STANDARDANDPOORS.COM/RATINGSDIRECT NOVEMBER 12, 2020 2

rates. This was primarily because of two tenants that represented only 2% of BPPEH's overall passing rent as of June
30, 2020. We understand a significant portion of the unpaid rent has sincebeen collected. The office assets occupancy
declined to 93% in June 2020 from 95% in December 2019 due to several lease expires and slower leasing activity.
However, we understand that this is expected to be temporary because a large portion of the space was vacated just
before first-half 2020 results were announced, and the company is already in negotiation to lease these spaces. Overall,
in our view, the global economic slowdown should not materially affect BPPEH's in the near term, given that the
fundamentals across logistics and residential segments (83% of GAV) should remain healthy, to offset the expected flat
performance of office assets.
BPPEH's continuous portfolio growth broadens rental income base while maintaining the focus on the logistics and
residential segments. Since its inception in 2017, BPPEH has continued to expand its portfolio in line with its strategy
of investing in high-quality assets in major European markets and gateway cities. The company has grown to €6.2
billion in June 2020 from €2.4 billion in August 2018. In the first nine months of 2020, BPPEH acquired €1.0 billion in
assets (44 logistics assets primarily in Germany, France, and the Nordics for €842 million; and €189 million in
residential assets in Amsterdam, Utrecht, and Rotterdam). The company further acquired about €700 million of assets
in October 2020 (it acquired logistics assets in Sweden for SEK2.1 billion, [about €200 million]and acquired 22 logistics
properties in the U.K. for a gross purchase price of £473 million [€527 million]). Overall, we expect the portfolio to
grow to €7.2 billion by the end of 2020 and the share of logistics and residential segment to rise to about 85%,
compared with 80% at the end of 2019, further improving the overall resilience of the portfolio.
We believe BPPEH will maintain its credit metrics within our rating thresholds while continuing to expand its portfolio.
Despite the continuous external growth strategy, we expect debt to debt plus equity to remain below 50% (see chart 1)
because we anticipate that the company will fund its acquisitions with balanced equity and debt for acquisitions, in line
with its financial policy to maintain LTV at 45%-50%. Headroom has decreased to our downside threshold of debt to
debt plus equity of 50% (48.5% as of June 30, 2020), however, we expect the ratio to improve to 46.0%-47.5% by the
end of 2020, supported by recent capital raising. In addition, sustained acquisitions should keep BPPEH's
debt-to-EBITDA ratio above 15x and EBIDTA interest coverage above 3x for the next 24 months.
WWW.STANDARDANDPOORS.COM/RATINGSDIRECT NOVEMBER 12, 2020 3
Blackstone Property Partners Europe Holdings S.a r.l.

Chart 1
WWW.STANDARDANDPOORS.COM/RATINGSDIRECT NOVEMBER 12, 2020 4
Blackstone Property Partners Europe Holdings S.a r.l.
Outlook: Stable
The stable outlook reflects our view that BPPEH will likely continue to generate stable and predictable income
from its assets in prime locations, with limited impact from the pandemic. We also expect it to benefit from the
high occupancy rates and from the wide-ranging diversity within the portfolio. Our base-case scenario also factors
in BPPEH continuing to expand and diversify its portfolio while maintaining its financial ratios and high-quality
asset profile.
We forecast that BPPEH's:
• Debt-to-debt-plus-equity ratio will remain below 50%; and
• EBITDA interest coverage will remain near 3x.
Downside scenario
We could lower the rating if we saw evidence of deteriorating rental activities, such as falling occupancy and
negative like-for-like growth. We would also take a negative view of acquisitions of properties with weaker
characteristics, such as those located in less prime locations.
In addition, we could lower the rating if BPPEH's financial ratios weaken such that:
• Interest coverage falls below 2.4x; and
• Debt to debt plus equity rises above 50% over a sustained period.
Upside scenario
We could take a positive rating action if the company adopted a significantly more conservative financial policy
such that:
• EBITDA interest coverage stays comfortably above 3.8x; and
• Debt to debt plus equity falls below 35% over a sustained period.
We could also raise the rating if BPPEH were to significantly expand its portfolio and increase its diversity while
maintaining its financial ratios and high-quality asset profile. An upgrade would also require the portfolio expansion
to focus on prime assets in markets across Europe that benefit from sustained demand. We would also expect the
debt-to-EBITDA ratio to stabilize so that it becomes more aligned with that of peers.
WWW.STANDARDANDPOORS.COM/RATINGSDIRECT NOVEMBER 12, 2020 5
Blackstone Property Partners Europe Holdings S.a r.l.
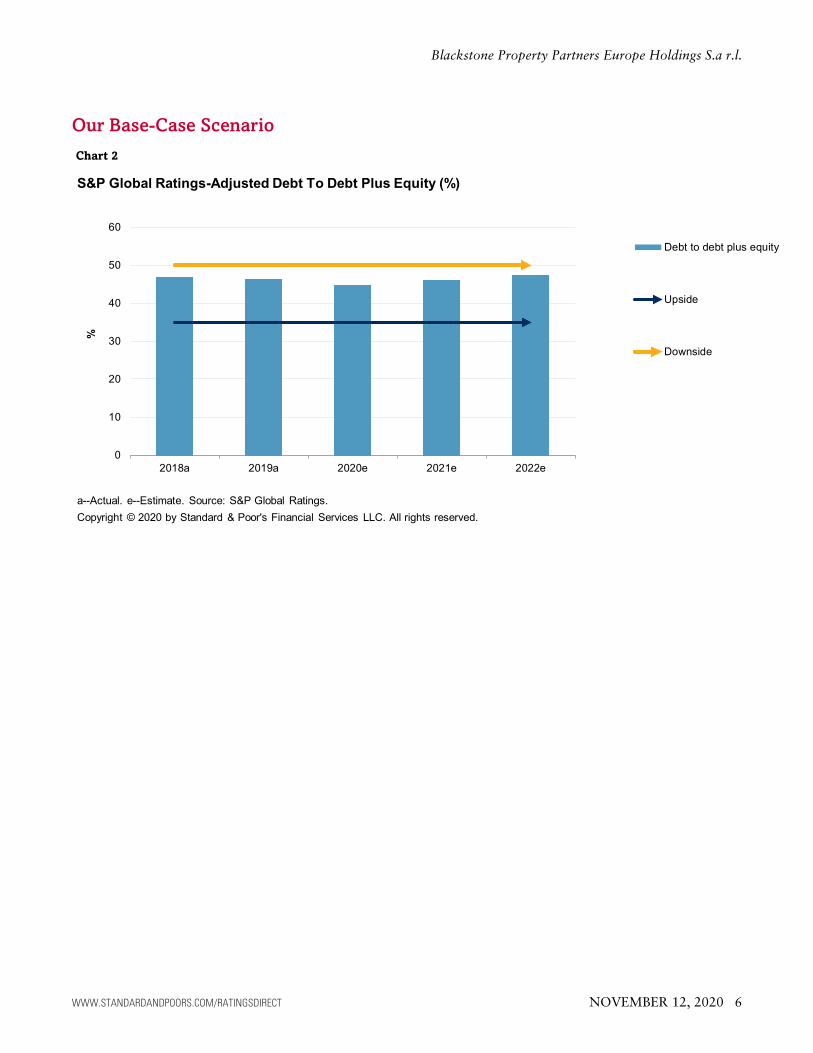
Our Base-Case Scenario
Chart 2
WWW.STANDARDANDPOORS.COM/RATINGSDIRECT NOVEMBER 12, 2020 6
Blackstone Property Partners Europe Holdings S.a r.l.
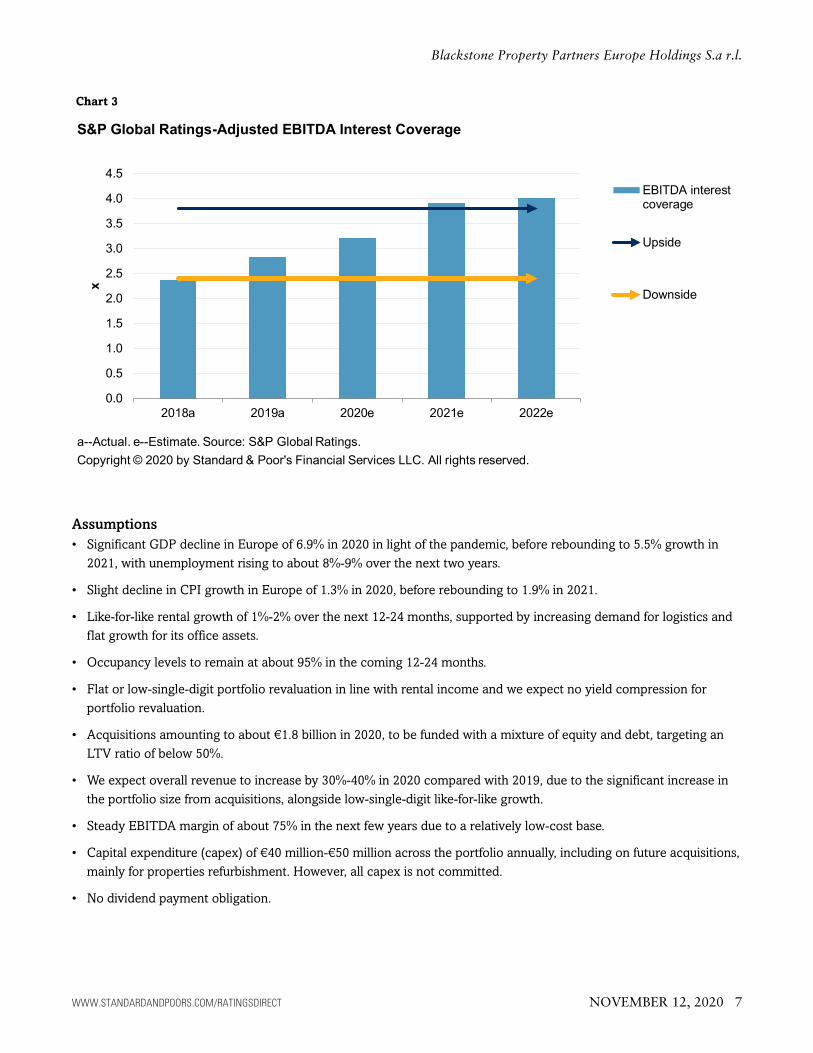
Chart 3
Assumptions
• Significant GDP decline in Europe of 6.9% in 2020 in light of the pandemic, before rebounding to 5.5% growth in
2021, with unemployment rising to about 8%-9% over the next two years.
• Slight decline in CPI growth in Europe of 1.3% in 2020, before rebounding to 1.9% in 2021.
• Like-for-like rental growth of 1%-2% over the next 12-24 months, supported by increasing demand for logistics and
flat growth for its office assets.
• Occupancy levels to remain at about 95% in the coming 12-24 months.
• Flat or low-single-digit portfolio revaluation in line with rental income and we expect no yield compression for
portfolio revaluation.
• Acquisitions amounting to about €1.8 billion in 2020, to be funded with a mixture of equity and debt, targeting an
LTV ratio of below 50%.
• We expect overall revenue to increase by 30%-40% in 2020 compared with 2019, due to the significant increase in
the portfolio size from acquisitions, alongside low-single-digit like-for-like growth.
• Steady EBITDA margin of about 75% in the next few years due to a relatively low-cost base.
• Capital expenditure (capex) of €40 million-€50 million across the portfolio annually, including on future acquisitions,
mainly for properties refurbishment. However, all capex is not committed.
• No dividend payment obligation.
WWW.STANDARDANDPOORS.COM/RATINGSDIRECT NOVEMBER 12, 2020 7
Blackstone Property Partners Europe Holdings S.a r.l.
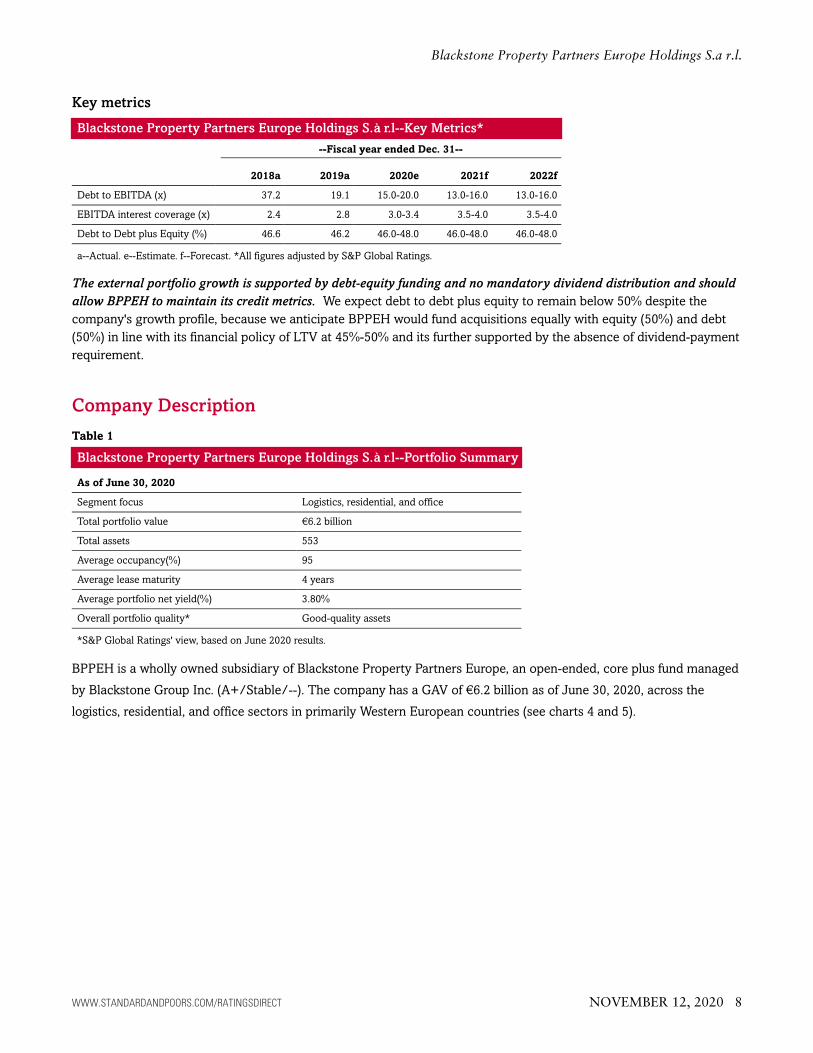
Key metrics
Blackstone Property Partners Europe Holdings S.à r.l--Key Metrics*
--Fiscal year ended Dec. 31--
2018a 2019a 2020e 2021f 2022f
Debt to EBITDA (x) 37.2 19.1 15.0-20.0 13.0-16.0 13.0-16.0
EBITDA interest coverage (x) 2.4 2.8 3.0-3.4 3.5-4.0 3.5-4.0
Debt to Debt plus Equity (%) 46.6 46.2 46.0-48.0 46.0-48.0 46.0-48.0
a--Actual. e--Estimate. f--Forecast. *All figures adjusted by S&P Global Ratings.
The external portfolio growth is supported by debt-equity funding and no mandatory dividend distribution and should
allow BPPEH to maintain its credit metrics. We expect debt to debt plus equity to remain below 50% despite the
company's growth profile, because we anticipate BPPEH would fund acquisitions equally with equity (50%) and debt
(50%) in line with its financial policy of LTV at 45%-50% and its further supported by the absence of dividend-payment
requirement.
Company Description
Table 1
Blackstone Property Partners Europe Holdings S.à r.l--Portfolio Summary
As of June 30, 2020
Segment focus Logistics, residential, and office
Total portfolio value €6.2 billion
Total assets 553
Average occupancy(%) 95
Average lease maturity 4 years
Average portfolio net yield(%) 3.80%
Overall portfolio quality* Good-quality assets
*S&P Global Ratings' view, based on June 2020 results.
BPPEH is a wholly owned subsidiary of Blackstone Property Partners Europe, an open-ended, core plus fund managed
by Blackstone Group Inc. (A+/Stable/--). The company has a GAV of €6.2 billion as of June 30, 2020, across the
logistics, residential, and office sectors in primarily Western European countries (see charts 4 and 5).
WWW.STANDARDANDPOORS.COM/RATINGSDIRECT NOVEMBER 12, 2020 8
Blackstone Property Partners Europe Holdings S.a r.l.
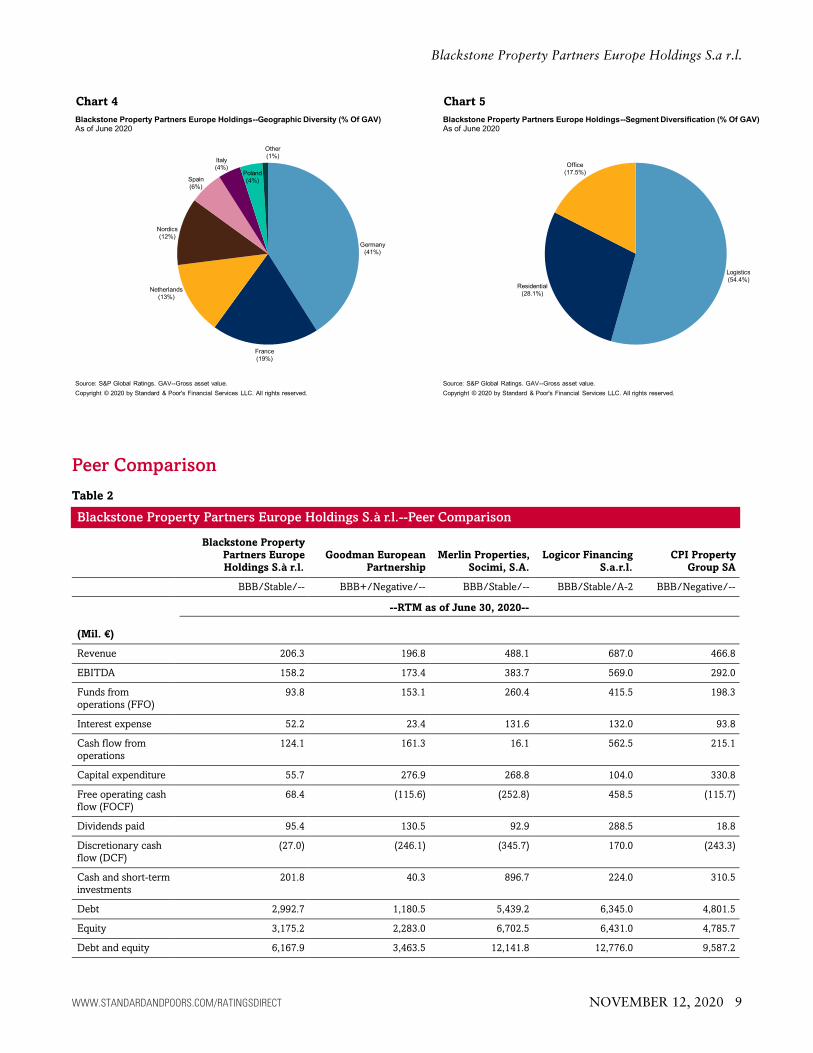
Chart 4 Chart 5
Peer Comparison
Table 2
Blackstone Property Partners Europe Holdings S.à r.l.--Peer Comparison
Blackstone Property
Partners Europe
Holdings S.à r.l.
Goodman European
Partnership
Merlin Properties,
Socimi, S.A.
Logicor Financing
S.a.r.l.
CPI Property
Group SA
BBB/Stable/-- BBB+/Negative/-- BBB/Stable/-- BBB/Stable/A-2 BBB/Negative/--
--RTM as of June 30, 2020--
(Mil. €)
Revenue 206.3 196.8 488.1 687.0 466.8
EBITDA 158.2 173.4 383.7 569.0 292.0
Funds from
operations (FFO)
93.8 153.1 260.4 415.5 198.3
Interest expense 52.2 23.4 131.6 132.0 93.8
Cash flow from
operations
124.1 161.3 16.1 562.5 215.1
Capital expenditure 55.7 276.9 268.8 104.0 330.8
Free operating cash
flow (FOCF)
68.4 (115.6) (252.8) 458.5 (115.7)
Dividends paid 95.4 130.5 92.9 288.5 18.8
Discretionary cash
flow (DCF)
(27.0) (246.1) (345.7) 170.0 (243.3)
Cash and short-term
investments
201.8 40.3 896.7 224.0 310.5
Debt 2,992.7 1,180.5 5,439.2 6,345.0 4,801.5
Equity 3,175.2 2,283.0 6,702.5 6,431.0 4,785.7
Debt and equity 6,167.9 3,463.5 12,141.8 12,776.0 9,587.2
WWW.STANDARDANDPOORS.COM/RATINGSDIRECT NOVEMBER 12, 2020 9
Blackstone Property Partners Europe Holdings S.a r.l.
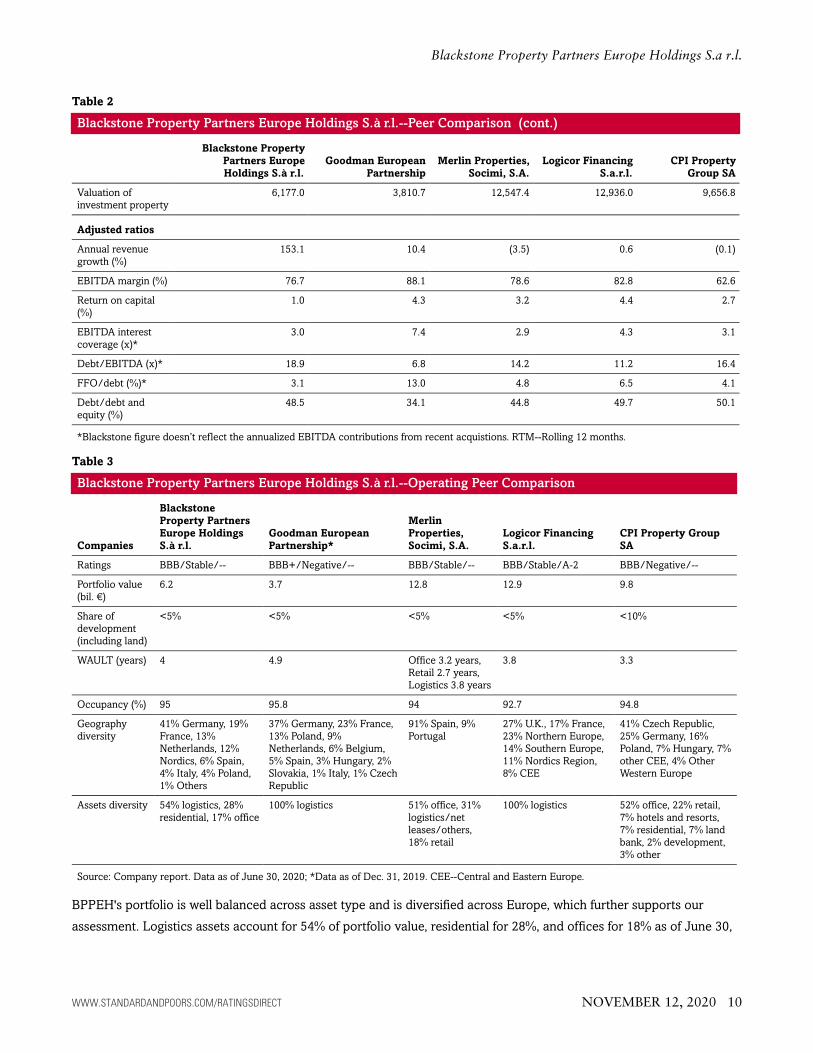
Table 2
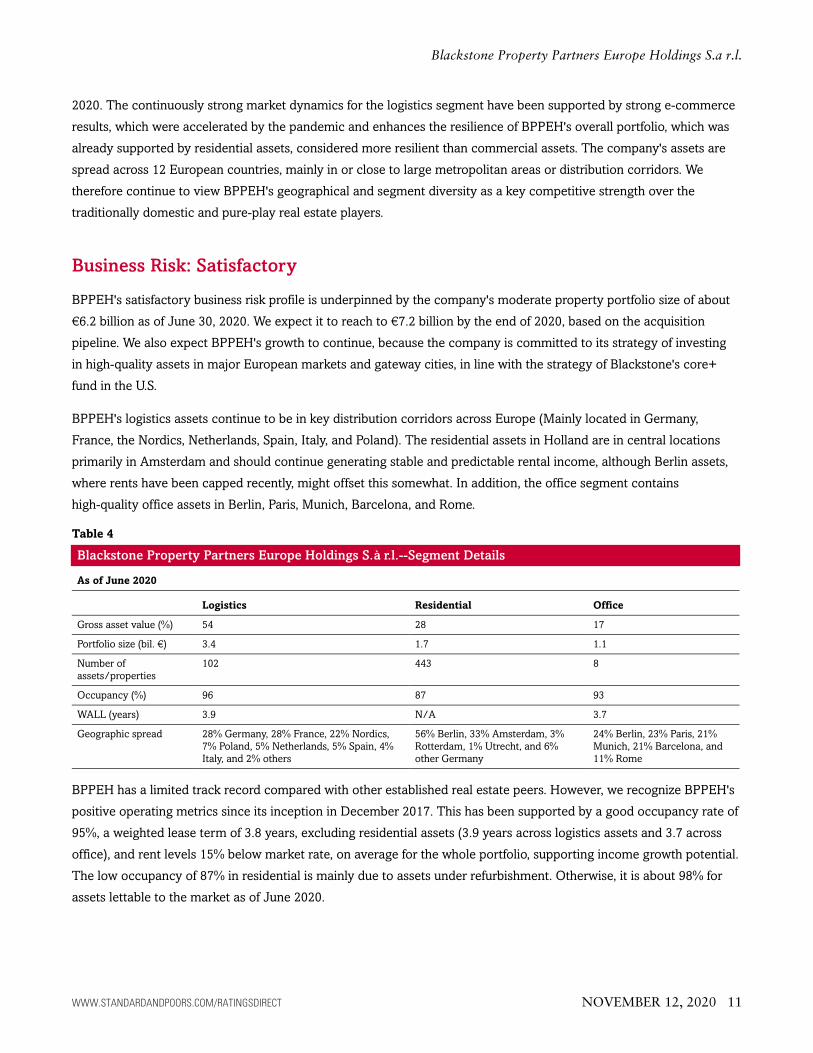
Blackstone Property Partners Europe Holdings S.à r.l.--Peer Comparison (cont.)
Blackstone Property
Partners Europe
Holdings S.à r.l.
Goodman European
Partnership
Merlin Properties,
Socimi, S.A.
Logicor Financing
S.a.r.l.
CPI Property
Group SA
Valuation of
investment property
6,177.0 3,810.7 12,547.4 12,936.0 9,656.8
Adjusted ratios
Annual revenue
growth (%)
153.1 10.4 (3.5) 0.6 (0.1)
EBITDA margin (%) 76.7 88.1 78.6 82.8 62.6
Return on capital
(%)
1.0 4.3 3.2 4.4 2.7
EBITDA interest
coverage (x)*
3.0 7.4 2.9 4.3 3.1
Debt/EBITDA (x)* 18.9 6.8 14.2 11.2 16.4
FFO/debt (%)* 3.1 13.0 4.8 6.5 4.1
Debt/debt and
equity (%)
48.5 34.1 44.8 49.7 50.1
*Blackstone figure doesn’t reflect the annualized EBITDA contributions from recent acquistions. RTM--Rolling 12 months.
Table 3
Blackstone Property Partners Europe Holdings S.à r.l.--Operating Peer Comparison
Companies
Blackstone
Property Partners
Europe Holdings
S.à r.l.
Goodman European
Partnership*
Merlin
Properties,
Socimi, S.A.
Logicor Financing
S.a.r.l.
CPI Property Group
SA
Ratings BBB/Stable/-- BBB+/Negative/-- BBB/Stable/-- BBB/Stable/A-2 BBB/Negative/--
Portfolio value
(bil. €)
6.2 3.7 12.8 12.9 9.8
Share of
development
(including land)
<5% <5% <5% <5% <10%
WAULT (years) 4 4.9 Office 3.2 years,
Retail 2.7 years,
Logistics 3.8 years
3.8 3.3
Occupancy (%) 95 95.8 94 92.7 94.8
Geography
diversity
41% Germany, 19%
France, 13%
Netherlands, 12%
Nordics, 6% Spain,
4% Italy, 4% Poland,
1% Others
37% Germany, 23% France,
13% Poland, 9%
Netherlands, 6% Belgium,
5% Spain, 3% Hungary, 2%
Slovakia, 1% Italy, 1% Czech
Republic
91% Spain, 9%
Portugal
27% U.K., 17% France,
23% Northern Europe,
14% Southern Europe,
11% Nordics Region,
8% CEE
41% Czech Republic,
25% Germany, 16%
Poland, 7% Hungary, 7%
other CEE, 4% Other
Western Europe
Assets diversity 54% logistics, 28%
residential, 17% office
100% logistics 51% office, 31%
logistics/net
leases/others,
18% retail
100% logistics 52% office, 22% retail,
7% hotels and resorts,
7% residential, 7% land
bank, 2% development,
3% other
Source: Company report. Data as of June 30, 2020; *Data as of Dec. 31, 2019. CEE--Central and Eastern Europe.
BPPEH's portfolio is well balanced across asset type and is diversified across Europe, which further supports our
assessment. Logistics assets account for 54% of portfolio value, residential for 28%, and offices for 18% as of June 30,
WWW.STANDARDANDPOORS.COM/RATINGSDIRECT NOVEMBER 12, 2020 10
Blackstone Property Partners Europe Holdings S.a r.l.
2020. The continuously strong market dynamics for the logistics segment have been supported by strong e-commerce
results, which were accelerated by the pandemic and enhances the resilience of BPPEH's overall portfolio, which was
already supported by residential assets, considered more resilient than commercial assets. The company's assets are
spread across 12 European countries, mainly in or close to large metropolitan areas or distribution corridors. We
therefore continue to view BPPEH's geographical and segment diversity as a key competitive strength over the
traditionally domestic and pure-play real estate players.
Business Risk: Satisfactory
BPPEH's satisfactory business risk profile is underpinned by the company's moderate property portfolio size of about
€6.2 billion as of June 30, 2020. We expect it to reach to €7.2 billion by the end of 2020, based on the acquisition
pipeline. We also expect BPPEH's growth to continue, because the company is committed to its strategy of investing
in high-quality assets in major European markets and gateway cities, in line with the strategy of Blackstone's core+
fund in the U.S.
BPPEH's logistics assets continue to be in key distribution corridors across Europe (Mainly located in Germany,
France, the Nordics, Netherlands, Spain, Italy, and Poland). The residential assets in Holland are in central locations
primarily in Amsterdam and should continue generating stable and predictable rental income, although Berlin assets,
where rents have been capped recently, might offset this somewhat. In addition, the office segment contains
high-quality office assets in Berlin, Paris, Munich, Barcelona, and Rome.
Table 4
Blackstone Property Partners Europe Holdings S.à r.l.--Segment Details
As of June 2020
Logistics Residential Office
Gross asset value (%) 54 28 17
Portfolio size (bil. €) 3.4 1.7 1.1
Number of
assets/properties
102 443 8
Occupancy (%) 96 87 93
WALL (years) 3.9 N/A 3.7
Geographic spread 28% Germany, 28% France, 22% Nordics,
7% Poland, 5% Netherlands, 5% Spain, 4%
Italy, and 2% others
56% Berlin, 33% Amsterdam, 3%
Rotterdam, 1% Utrecht, and 6%
other Germany
24% Berlin, 23% Paris, 21%
Munich, 21% Barcelona, and
11% Rome
BPPEH has a limited track record compared with other established real estate peers. However, we recognize BPPEH's
positive operating metrics since its inception in December 2017. This has been supported by a good occupancy rate of
95%, a weighted lease term of 3.8 years, excluding residential assets (3.9 years across logistics assets and 3.7 across
office), and rent levels 15% below market rate, on average for the whole portfolio, supporting income growth potential.
The low occupancy of 87% in residential is mainly due to assets under refurbishment. Otherwise, it is about 98% for
assets lettable to the market as of June 2020.
WWW.STANDARDANDPOORS.COM/RATINGSDIRECT NOVEMBER 12, 2020 11
Blackstone Property Partners Europe Holdings S.a r.l.
Financial Risk: Intermediate
BPPEH's intermediate financial risk profile reflects our expectation that the company will maintain a
debt-to-debt-plus-equity ratio below 50% (it was 48.5% as of June 30, 2020). Our assessment is also underpinned by
BPPEH's prudent financial policy and its LTV target of 45%-50%, corresponding to a debt-to-debt-plus-equity ratio
below 50%. We expect this ratio to remain below 50% despite the company's growth profile, because we anticipate
that BPPEH will fund acquisitions with 50% equity and 50% debt, in line with its financial policy. In addition, we note
that Blackstone Property Partners Europe, the open-ended, real estate fund that wholly owns BPPEH, has a leverage
limit of 50%.
We also expect the EBITDA interest coverage ratio to remain above 3.0x (it was 3.0x at June 30, 2020) benefiting from
a low and stable average cost of debt of 1.6%. However, the sustained pace of acquisitions and low yielding residential
assets should keep BPPEH's debt-to-EBITDA ratio above 15x, which is materially higher than that of many rated real
estate peers in the 'BBB' range. The company recently raised €600 million of 6.5 year unsecured notes with a coupon
of 1.25%, which will further improve its average cost of debt and maturity profile. We continue to view favorably the
absence of a dividend requirement from BPPEH and the lack of material upcoming debt maturities. In addition, the
limited proportion of secured debt (2%) further enhances the company's capital management.
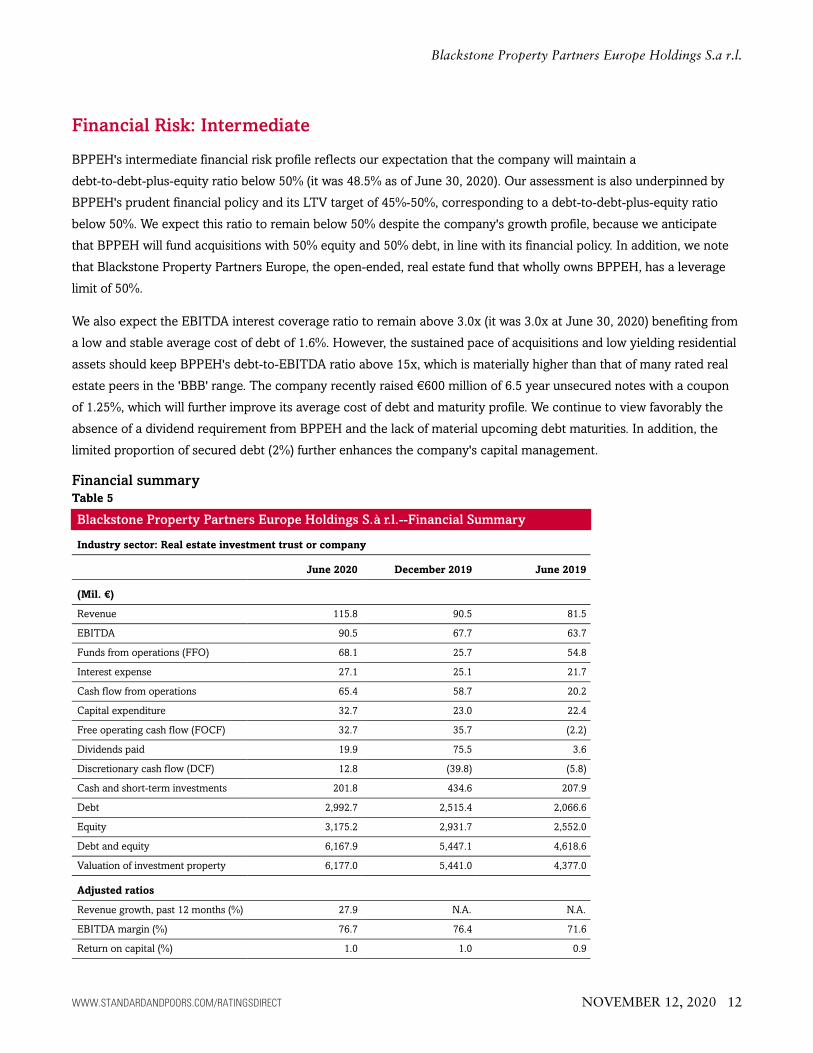
Financial summaryTable 5
Blackstone Property Partners Europe Holdings S.à r.l.--Financial Summary
Industry sector: Real estate investment trust or company
June 2020 December 2019 June 2019
(Mil. €)
Revenue 115.8 90.5 81.5
EBITDA 90.5 67.7 63.7
Funds from operations (FFO) 68.1 25.7 54.8
Interest expense 27.1 25.1 21.7
Cash flow from operations 65.4 58.7 20.2
Capital expenditure 32.7 23.0 22.4
Free operating cash flow (FOCF) 32.7 35.7 (2.2)
Dividends paid 19.9 75.5 3.6
Discretionary cash flow (DCF) 12.8 (39.8) (5.8)
Cash and short-term investments 201.8 434.6 207.9
Debt 2,992.7 2,515.4 2,066.6
Equity 3,175.2 2,931.7 2,552.0
Debt and equity 6,167.9 5,447.1 4,618.6
Valuation of investment property 6,177.0 5,441.0 4,377.0
Adjusted ratios
Revenue growth, past 12 months (%) 27.9 N.A. N.A.
EBITDA margin (%) 76.7 76.4 71.6
Return on capital (%) 1.0 1.0 0.9
WWW.STANDARDANDPOORS.COM/RATINGSDIRECT NOVEMBER 12, 2020 12
Blackstone Property Partners Europe Holdings S.a r.l.
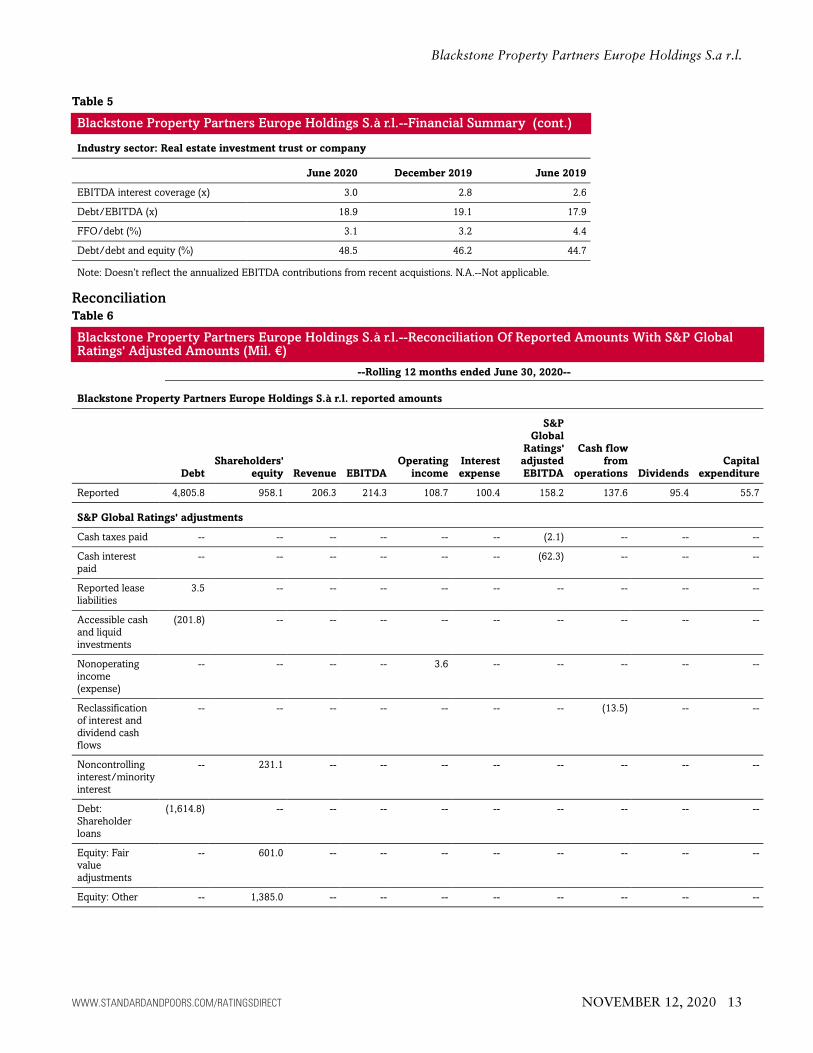
Table 5
Blackstone Property Partners Europe Holdings S.à r.l.--Financial Summary (cont.)
Industry sector: Real estate investment trust or company
June 2020 December 2019 June 2019
EBITDA interest coverage (x) 3.0 2.8 2.6
Debt/EBITDA (x) 18.9 19.1 17.9
FFO/debt (%) 3.1 3.2 4.4
Debt/debt and equity (%) 48.5 46.2 44.7
Note: Doesn’t reflect the annualized EBITDA contributions from recent acquistions. N.A.--Not applicable.
ReconciliationTable 6
Blackstone Property Partners Europe Holdings S.à r.l.--Reconciliation Of Reported Amounts With S&P GlobalRatings' Adjusted Amounts (Mil. €)
--Rolling 12 months ended June 30, 2020--
Blackstone Property Partners Europe Holdings S.à r.l. reported amounts
Debt
Shareholders'
equity Revenue EBITDA
Operating
income
Interest
expense
S&P
Global
Ratings'
adjusted
EBITDA
Cash flow
from
operations Dividends
Capital
expenditure
Reported 4,805.8 958.1 206.3 214.3 108.7 100.4 158.2 137.6 95.4 55.7
S&P Global Ratings' adjustments
Cash taxes paid -- -- -- -- -- -- (2.1) -- -- --
Cash interest
paid
-- -- -- -- -- -- (62.3) -- -- --
Reported lease
liabilities
3.5 -- -- -- -- -- -- -- -- --
Accessible cash
and liquid
investments
(201.8) -- -- -- -- -- -- -- -- --
Nonoperating
income
(expense)
-- -- -- -- 3.6 -- -- -- -- --
Reclassification
of interest and
dividend cash
flows
-- -- -- -- -- -- -- (13.5) -- --
Noncontrolling
interest/minority
interest
-- 231.1 -- -- -- -- -- -- -- --
Debt:
Shareholder
loans
(1,614.8) -- -- -- -- -- -- -- -- --
Equity: Fair
value
adjustments
-- 601.0 -- -- -- -- -- -- -- --
Equity: Other -- 1,385.0 -- -- -- -- -- -- -- --
WWW.STANDARDANDPOORS.COM/RATINGSDIRECT NOVEMBER 12, 2020 13
Blackstone Property Partners Europe Holdings S.a r.l.
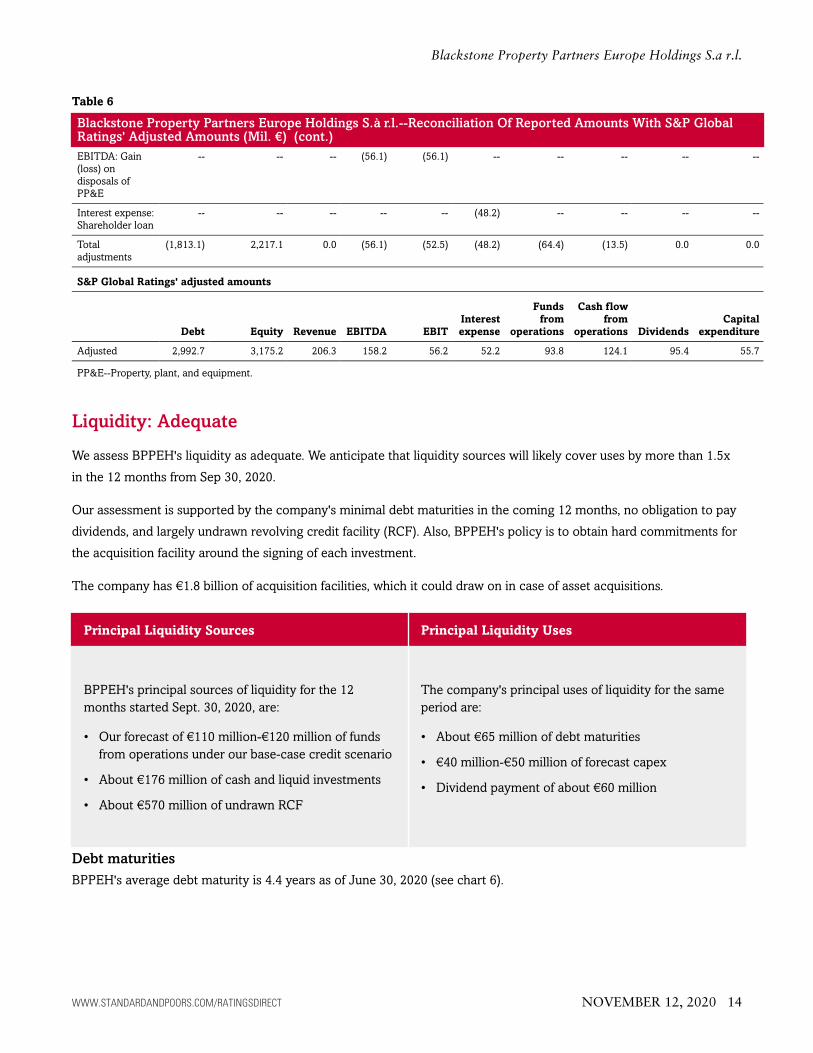
Table 6
Blackstone Property Partners Europe Holdings S.à r.l.--Reconciliation Of Reported Amounts With S&P GlobalRatings' Adjusted Amounts (Mil. €) (cont.)
EBITDA: Gain
(loss) on
disposals of
PP&E
-- -- -- (56.1) (56.1) -- -- -- -- --
Interest expense:
Shareholder loan
-- -- -- -- -- (48.2) -- -- -- --
Total
adjustments
(1,813.1) 2,217.1 0.0 (56.1) (52.5) (48.2) (64.4) (13.5) 0.0 0.0
S&P Global Ratings' adjusted amounts
Debt Equity Revenue EBITDA EBIT
Interest
expense
Funds
from
operations
Cash flow
from
operations Dividends
Capital
expenditure
Adjusted 2,992.7 3,175.2 206.3 158.2 56.2 52.2 93.8 124.1 95.4 55.7
PP&E--Property, plant, and equipment.
Liquidity: Adequate
We assess BPPEH's liquidity as adequate. We anticipate that liquidity sources will likely cover uses by more than 1.5x
in the 12 months from Sep 30, 2020.
Our assessment is supported by the company's minimal debt maturities in the coming 12 months, no obligation to pay
dividends, and largely undrawn revolving credit facility (RCF). Also, BPPEH's policy is to obtain hard commitments for
the acquisition facility around the signing of each investment.
The company has €1.8 billion of acquisition facilities, which it could draw on in case of asset acquisitions.
Principal Liquidity Sources Principal Liquidity Uses
BPPEH's principal sources of liquidity for the 12
months started Sept. 30, 2020, are:
• Our forecast of €110 million-€120 million of funds
from operations under our base-case credit scenario
• About €176 million of cash and liquid investments
• About €570 million of undrawn RCF
The company's principal uses of liquidity for the same
period are:
• About €65 million of debt maturities
• €40 million-€50 million of forecast capex
• Dividend payment of about €60 million
Debt maturities
BPPEH's average debt maturity is 4.4 years as of June 30, 2020 (see chart 6).
WWW.STANDARDANDPOORS.COM/RATINGSDIRECT NOVEMBER 12, 2020 14
Blackstone Property Partners Europe Holdings S.a r.l.
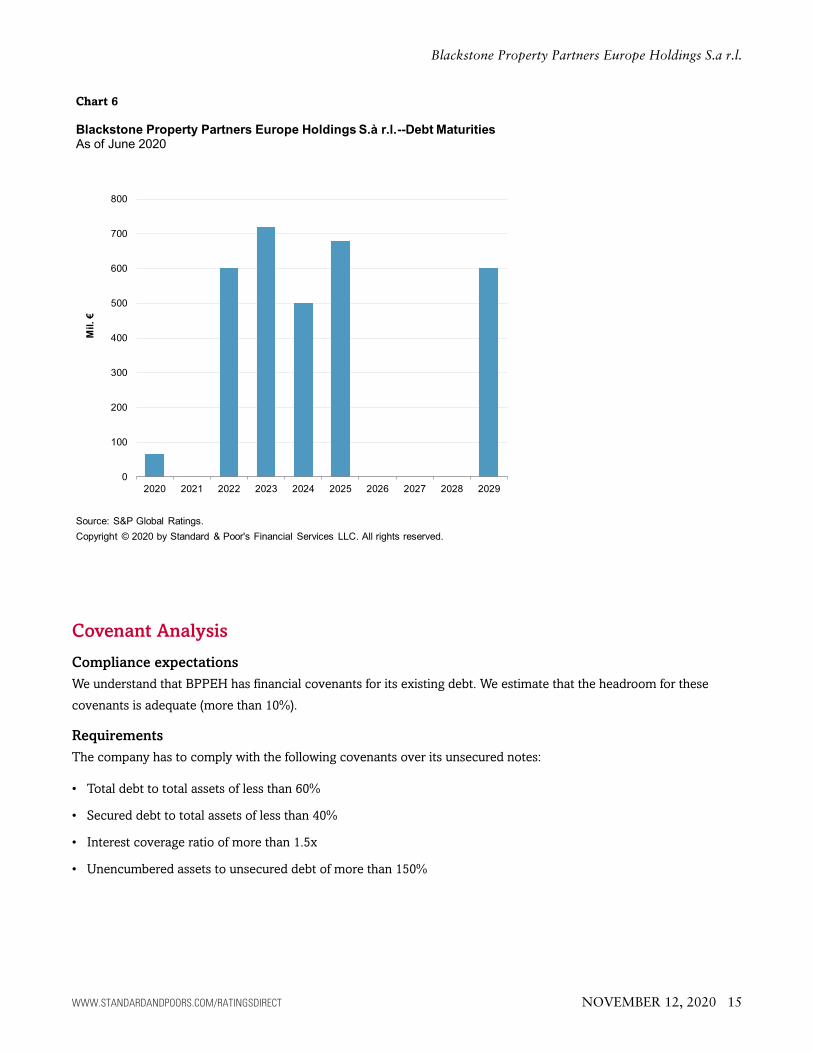
Chart 6
Covenant Analysis
Compliance expectations
We understand that BPPEH has financial covenants for its existing debt. We estimate that the headroom for these
covenants is adequate (more than 10%).
Requirements
The company has to comply with the following covenants over its unsecured notes:
• Total debt to total assets of less than 60%
• Secured debt to total assets of less than 40%
• Interest coverage ratio of more than 1.5x
• Unencumbered assets to unsecured debt of more than 150%
WWW.STANDARDANDPOORS.COM/RATINGSDIRECT NOVEMBER 12, 2020 15
Blackstone Property Partners Europe Holdings S.a r.l.
Issue Ratings - Subordination Risk Analysis
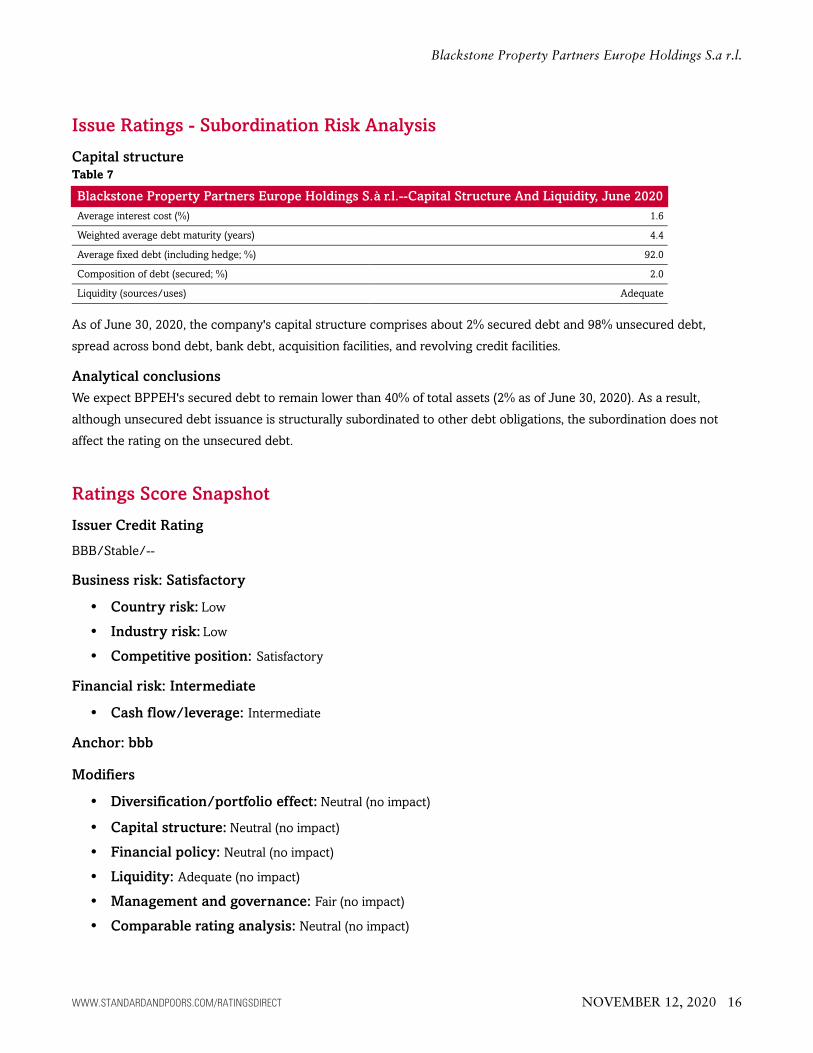
Capital structureTable 7
Blackstone Property Partners Europe Holdings S.à r.l.--Capital Structure And Liquidity, June 2020
Average interest cost (%) 1.6
Weighted average debt maturity (years) 4.4
Average fixed debt (including hedge; %) 92.0
Composition of debt (secured; %) 2.0
Liquidity (sources/uses) Adequate
As of June 30, 2020, the company's capital structure comprises about 2% secured debt and 98% unsecured debt,
spread across bond debt, bank debt, acquisition facilities, and revolving credit facilities.
Analytical conclusions
We expect BPPEH's secured debt to remain lower than 40% of total assets (2% as of June 30, 2020). As a result,
although unsecured debt issuance is structurally subordinated to other debt obligations, the subordination does not
affect the rating on the unsecured debt.
Ratings Score Snapshot
Issuer Credit Rating
BBB/Stable/--
Business risk: Satisfactory
• Country risk: Low
• Industry risk: Low
• Competitive position: Satisfactory
Financial risk: Intermediate
• Cash flow/leverage: Intermediate
Anchor: bbb
Modifiers
• Diversification/portfolio effect: Neutral (no impact)
• Capital structure: Neutral (no impact)
• Financial policy: Neutral (no impact)
• Liquidity: Adequate (no impact)
• Management and governance: Fair (no impact)
• Comparable rating analysis: Neutral (no impact)
WWW.STANDARDANDPOORS.COM/RATINGSDIRECT NOVEMBER 12, 2020 16
Blackstone Property Partners Europe Holdings S.a r.l.
Related Criteria
• General Criteria: Group Rating Methodology, July 1, 2019
• Criteria | Corporates | General: Corporate Methodology: Ratios And Adjustments, April 1, 2019
• Criteria | Corporates | General: Methodology And Assumptions: Liquidity Descriptors For Global Corporate
Issuers, Dec. 16, 2014
• General Criteria: Methodology: Industry Risk, Nov. 19, 2013
• Criteria | Corporates | General: Corporate Methodology, Nov. 19, 2013
• General Criteria: Country Risk Assessment Methodology And Assumptions, Nov. 19, 2013
• General Criteria: Methodology: Management And Governance Credit Factors For Corporate Entities, Nov. 13, 2012
• General Criteria: Use Of CreditWatch And Outlooks, Sept. 14, 2009
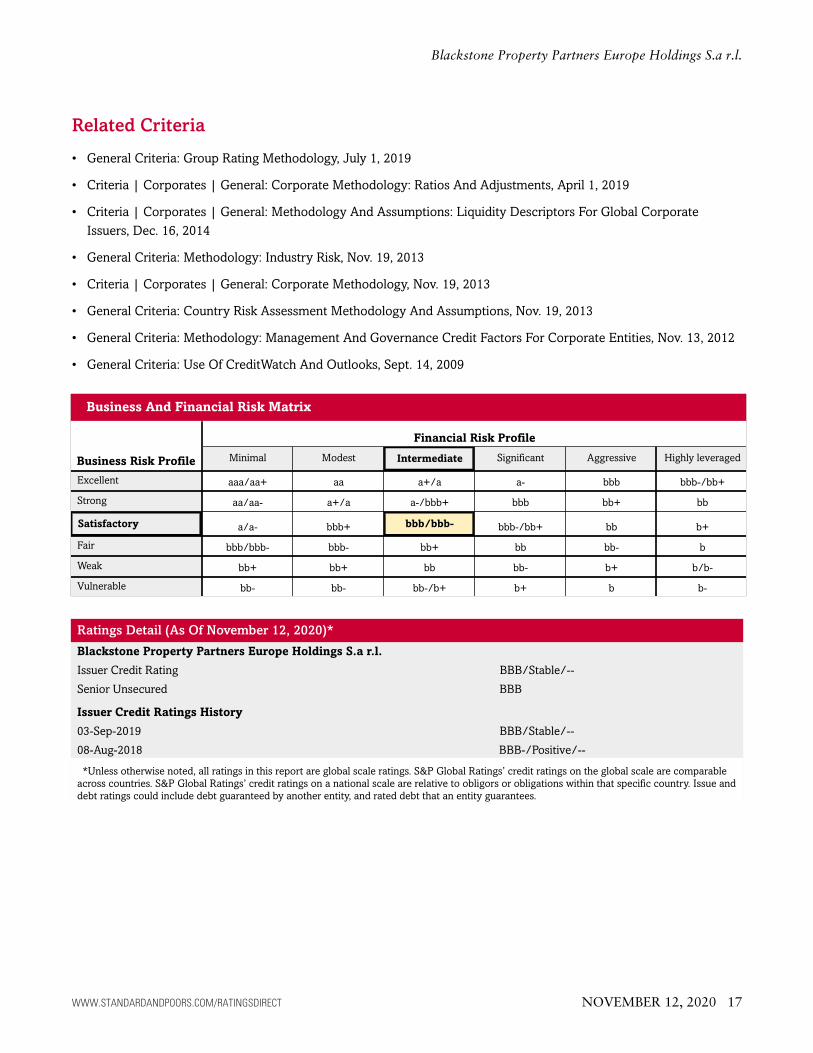
Business And Financial Risk Matrix
Business Risk Profile
Financial Risk Profile
Minimal Modest Intermediate Significant Aggressive Highly leveraged
Excellent aaa/aa+ aa a+/a a- bbb bbb-/bb+
Strong aa/aa- a+/a a-/bbb+ bbb bb+ bb
Satisfactory a/a- bbb+ bbb/bbb- bbb-/bb+ bb b+
Fair bbb/bbb- bbb- bb+ bb bb- b
Weak bb+ bb+ bb bb- b+ b/b-
Vulnerable bb- bb- bb-/b+ b+ b b-
Ratings Detail (As Of November 12, 2020)*
Blackstone Property Partners Europe Holdings S.a r.l.
Issuer Credit Rating BBB/Stable/--
Senior Unsecured BBB
Issuer Credit Ratings History
03-Sep-2019 BBB/Stable/--
08-Aug-2018 BBB-/Positive/--
*Unless otherwise noted, all ratings in this report are global scale ratings. S&P Global Ratings’ credit ratings on the global scale are comparable
across countries. S&P Global Ratings’ credit ratings on a national scale are relative to obligors or obligations within that specific country. Issue and
debt ratings could include debt guaranteed by another entity, and rated debt that an entity guarantees.
WWW.STANDARDANDPOORS.COM/RATINGSDIRECT NOVEMBER 12, 2020 17
Blackstone Property Partners Europe Holdings S.a r.l.

WWW.STANDARDANDPOORS.COM/RATINGSDIRECT NOVEMBER 12, 2020 18
STANDARD & POOR’S, S&P and RATINGSDIRECT are registered trademarks of Standard & Poor’s Financial Services LLC.
S&P may receive compensation for its ratings and certain analyses, normally from issuers or underwriters of securities or from obligors. S&P reserves the right to disseminateits opinions and analyses. S&P's public ratings and analyses are made available on its Web sites, www.standardandpoors.com (free of charge), and www.ratingsdirect.com(subscription), and may be distributed through other means, including via S&P publications and third-party redistributors. Additional information about our ratings fees isavailable at www.standardandpoors.com/usratingsfees.
S&P keeps certain activities of its business units separate from each other in order to preserve the independence and objectivity of their respective activities. As a result,certain business units of S&P may have information that is not available to other S&P business units. S&P has established policies and procedures to maintain theconfidentiality of certain non-public information received in connection with each analytical process.
To the extent that regulatory authorities allow a rating agency to acknowledge in one jurisdiction a rating issued in another jurisdiction for certain regulatory purposes, S&Preserves the right to assign, withdraw or suspend such acknowledgment at any time and in its sole discretion. S&P Parties disclaim any duty whatsoever arising out of theassignment, withdrawal or suspension of an acknowledgment as well as any liability for any damage alleged to have been suffered on account thereof.
Credit-related and other analyses, including ratings, and statements in the Content are statements of opinion as of the date they are expressed and not statements of fact.S&P’s opinions, analyses and rating acknowledgment decisions (described below) are not recommendations to purchase, hold, or sell any securities or to make anyinvestment decisions, and do not address the suitability of any security. S&P assumes no obligation to update the Content following publication in any form or format. TheContent should not be relied on and is not a substitute for the skill, judgment and experience of the user, its management, employees, advisors and/or clients when makinginvestment and other business decisions. S&P does not act as a fiduciary or an investment advisor except where registered as such. While S&P has obtained information fromsources it believes to be reliable, S&P does not perform an audit and undertakes no duty of due diligence or independent verification of any information it receives. Rating-related publications may be published for a variety of reasons that are not necessarily dependent on action by rating committees, including, but not limited to, the publicationof a periodic update on a credit rating and related analyses.
No content (including ratings, credit-related analyses and data, valuations, model, software or other application or output therefrom) or any part thereof (Content) may bemodified, reverse engineered, reproduced or distributed in any form by any means, or stored in a database or retrieval system, without the prior written permission ofStandard & Poor’s Financial Services LLC or its affiliates (collectively, S&P). The Content shall not be used for any unlawful or unauthorized purposes. S&P and any third-partyproviders, as well as their directors, officers, shareholders, employees or agents (collectively S&P Parties) do not guarantee the accuracy, completeness, timeliness oravailability of the Content. S&P Parties are not responsible for any errors or omissions (negligent or otherwise), regardless of the cause, for the results obtained from the useof the Content, or for the security or maintenance of any data input by the user. The Content is provided on an “as is” basis. S&P PARTIES DISCLAIM ANY AND ALL EXPRESSOR IMPLIED WARRANTIES, INCLUDING, BUT NOT LIMITED TO, ANY WARRANTIES OF MERCHANTABILITY OR FITNESS FOR A PARTICULAR PURPOSE OR USE, FREEDOMFROM BUGS, SOFTWARE ERRORS OR DEFECTS, THAT THE CONTENT’S FUNCTIONING WILL BE UNINTERRUPTED OR THAT THE CONTENT WILL OPERATE WITH ANYSOFTWARE OR HARDWARE CONFIGURATION. In no event shall S&P Parties be liable to any party for any direct, indirect, incidental, exemplary, compensatory, punitive,special or consequential damages, costs, expenses, legal fees, or losses (including, without limitation, lost income or lost profits and opportunity costs or losses caused bynegligence) in connection with any use of the Content even if advised of the possibility of such damages.
Copyright © 2020 by Standard & Poor’s Financial Services LLC. All rights reserved.