Bispectrum speckle interferometry of IRC+10216 ... · of IRC +10 216 speckle interferograms and...
12
arXiv:astro-ph/0206309v1 18 Jun 2002 Astronomy & Astrophysics manuscript no. June 16, 2018 (DOI: will be inserted by hand later) Bispectrum speckle interferometry of IRC +10 216: the dynamic evolution of the innermost circumstellar environment from 1995 to 2001 G. Weigelt 1 , Y.Y. Balega 2 ,T.Bl¨ocker 1 , K.-H. Hofmann 1 , A.B. Men’shchikov 1 , and J.M. Winters 1 1 Max-Planck-Institut f¨ ur Radioastronomie, Auf dem H¨ ugel 69, D–53121 Bonn, Germany (email: [email protected], [email protected], [email protected], [email protected]) 2 Special Astrophysical Observatory, Nizhnij Arkhyz, Zelenchuk region, Karachai–Cherkesia, 35147, Russia (email: [email protected]) Received date / accepted date Abstract. We present new near-infrared (JHK) bispectrum speckle-interferometry monitoring of the carbon star IRC+10216 obtained between 1999 and 2001 with the SAO 6 m telescope. The J -, H-, and K-band resolutions are 50 mas, 56 mas, and 73 mas, respectively. The total sequence of K-band observations covers now 8 epochs from 1995 to 2001 and shows the dynamic evolution of the inner dust shell. The present observations show that the appearance of the dust shell has considerably changed compared to the epochs of 1995 to 1998. Four main components within a 0. ′′ 2 radius can be identified in the K-band images. The apparent separation of the two initially brightest components A and B increased from ∼ 191 mas in 1995 to ∼ 351 mas in 2001. Simultaneously, component B has been fading and almost disappeared in 2000 whereas the initially faint components C and D became brighter (relative to peak intensity). The changes of the images can be related to changes of the optical depth caused, for instance, by mass-loss variations or new dust condensation in the wind. Our recent two- dimensional radiative transfer model of IRC +10 216 suggests that the observed relative motion of components A and B is not consistent with the outflow of gas and dust at the well-known terminal wind velocity of 15 km s −1 . The apparent motion with a deprojected velocity of 19 km s −1 on average and of recently 27 km s −1 appears to be caused by a displacement of the dust density peak due to dust evaporation in the optically thicker and hotter environment. The present monitoring, covering more than 3 pulsation periods, shows that the structural variations are not related to the stellar pulsation cycle in a simple way. This is consistent with the predictions of hydrodynamical models that enhanced dust formation takes place on a timescale of several pulsation periods. The timescale of the fading of component B can well be explained by the formation of new dust in the circumstellar envelope. Key words. techniques: image processing — circumstellar matter — stars: individual: IRC +10 216 — stars: mass–loss — stars: AGB and post-AGB — infrared: stars 1. Introduction The carbon star IRC +10216 is a long-period variable star evolving along the Asymptotic Giant Branch (AGB). It is the nearest carbon star known (distance ∼ 110 − 150 pc; Crosas & Menten 1997, Groenewegen et al. 1998) and the brightest 12 µm object outside the solar system (IRAS 1986). A strong stellar wind has led to an almost complete obscuration of the star by dust. The mass-loss rate as mea- sured in CO rotational lines amounts to 2−5×10 −5 M ⊙ /yr (Loup et al. 1993). Detailed two-dimensional (2D) radia- tive transfer modeling shows that IRC +10216 had re- Send offprint requests to : G. Weigelt, email: [email protected] cently suffered from an even higher mass-loss rate of ∼ 10 −4 M ⊙ /yr (Men’shchikov et al. 2001). Based on the high mass-loss rate, long period of P = 649 d (Le Bertre 1992), and carbon-rich chemistry of the dust-shell, IRC +10 216 is obviously in a very advanced stage of its AGB evolution (see, e.g., Bl¨ ocker 1999). Interferometric near-infrared imaging of IRC+10216 with angular resolutions of better than 100 mas has re- vealed that its dust shell is clumpy and bipolar, and is changing on a time scale of only ∼1yr (Weigelt et al. 1997, Weigelt et al. 1998 [hereafter Paper I], Haniff & Buscher 1998, Osterbart et al. 2000 [hereafter Paper II], Tuthill et al. 2000). In 1996, four components were identi- fied in the inner dust shell of IRC +10 216 within a radius
-
Upload
truongcong -
Category
Documents
-
view
225 -
download
0
Transcript of Bispectrum speckle interferometry of IRC+10216 ... · of IRC +10 216 speckle interferograms and...
arX
iv:a
stro
-ph/
0206
309v
1 1
8 Ju
n 20
02Astronomy & Astrophysics manuscript no. June 16, 2018(DOI: will be inserted by hand later)
Bispectrum speckle interferometry of IRC+10 216:
the dynamic evolution of the innermost circumstellar
environment from 1995 to 2001
G. Weigelt1 , Y.Y. Balega2, T. Blocker1, K.-H. Hofmann1, A.B. Men’shchikov1, and J.M. Winters1
1 Max-Planck-Institut fur Radioastronomie, Auf dem Hugel 69, D–53121 Bonn, Germany(email: [email protected], [email protected], [email protected],
[email protected])2 Special Astrophysical Observatory, Nizhnij Arkhyz, Zelenchuk region, Karachai–Cherkesia, 35147, Russia(email: [email protected])
Received date / accepted date
Abstract. We present new near-infrared (JHK) bispectrum speckle-interferometry monitoring of the carbon starIRC+10216 obtained between 1999 and 2001 with the SAO 6m telescope. The J-, H-, and K-band resolutionsare 50mas, 56mas, and 73mas, respectively. The total sequence of K-band observations covers now 8 epochsfrom 1995 to 2001 and shows the dynamic evolution of the inner dust shell. The present observations show thatthe appearance of the dust shell has considerably changed compared to the epochs of 1995 to 1998. Four maincomponents within a 0.′′2 radius can be identified in the K-band images. The apparent separation of the twoinitially brightest components A and B increased from ∼ 191 mas in 1995 to ∼ 351 mas in 2001. Simultaneously,component B has been fading and almost disappeared in 2000 whereas the initially faint components C andD became brighter (relative to peak intensity). The changes of the images can be related to changes of theoptical depth caused, for instance, by mass-loss variations or new dust condensation in the wind. Our recent two-dimensional radiative transfer model of IRC+10 216 suggests that the observed relative motion of components Aand B is not consistent with the outflow of gas and dust at the well-known terminal wind velocity of 15 kms−1.The apparent motion with a deprojected velocity of 19 kms−1 on average and of recently 27 km s−1 appearsto be caused by a displacement of the dust density peak due to dust evaporation in the optically thicker andhotter environment. The present monitoring, covering more than 3 pulsation periods, shows that the structuralvariations are not related to the stellar pulsation cycle in a simple way. This is consistent with the predictions ofhydrodynamical models that enhanced dust formation takes place on a timescale of several pulsation periods. Thetimescale of the fading of component B can well be explained by the formation of new dust in the circumstellarenvelope.
Key words. techniques: image processing — circumstellar matter — stars: individual: IRC+10 216 — stars:mass–loss — stars: AGB and post-AGB — infrared: stars
1. Introduction
The carbon star IRC+10216 is a long-period variable starevolving along the Asymptotic Giant Branch (AGB). It isthe nearest carbon star known (distance ∼ 110 − 150pc;Crosas & Menten 1997, Groenewegen et al. 1998) and thebrightest 12µm object outside the solar system (IRAS1986). A strong stellar wind has led to an almost completeobscuration of the star by dust. The mass-loss rate as mea-sured in CO rotational lines amounts to 2−5×10⁻⁵M⊙/yr(Loup et al. 1993). Detailed two-dimensional (2D) radia-tive transfer modeling shows that IRC+10216 had re-
Send offprint requests to: G. Weigelt,email: [email protected]
cently suffered from an even higher mass-loss rate of ∼10−4M⊙/yr (Men’shchikov et al. 2001). Based on the highmass-loss rate, long period of P = 649d (Le Bertre 1992),and carbon-rich chemistry of the dust-shell, IRC+10216is obviously in a very advanced stage of its AGB evolution(see, e.g., Blocker 1999).
Interferometric near-infrared imaging of IRC+10216with angular resolutions of better than 100 mas has re-vealed that its dust shell is clumpy and bipolar, and ischanging on a time scale of only ∼1 yr (Weigelt et al.1997, Weigelt et al. 1998 [hereafter Paper I], Haniff &Buscher 1998, Osterbart et al. 2000 [hereafter Paper II],Tuthill et al. 2000). In 1996, four components were identi-fied in the inner dust shell of IRC+10 216 within a radius
2 G. Weigelt et al.: Bispectrum speckle interferometry of IRC+10 216
Table 1. Observational parameters. JD refers to the Julian date and Φ to the photometric phase. Phase 0 (maximumlight) corresponds to JD=2449430 (Mar 18, 1994) as extrapolated from the light curve of Le Bertre (1992) withP = 649d. λc is the central wavelength and ∆λ the FWHM bandwidth of the filters. NT and NR are the numbersof IRC +10 216 speckle interferograms and reference-star speckle interferograms, respectively. T is the exposure timeper frame, S is the seeing (FWHM), p is the pixel size, and R is the resolution. In the last column, the reference starsare given. The observations of 1995–1998 were already presented in Paper II and are given here for completeness.
Date JD Φ λc ∆λ NT NR T S p R Ref. star[µm] [µm] [ms] [′′] [mas] [mas]
J 2 Apr 1996 2450176 1.15 1.24 0.28 1196 981 200 1.2 14.6 149 HIP 5113310 Mar 2001 2451979 3.93 1.24 0.14 1042 783 160 1.0 13.3 50 HD 83871
H 23 Jan 1997 2450472 1.61 1.64 0.31 1665 2110 100 1.5 19.8 70 HIP 5268910 Mar 2001 2451979 3.93 1.65 0.32 607 915 30 1.0 20.1 56 HD 83871
K 8 Oct 1995 2449999 0.88 2.12 0.02 251 266 100 1.5 31.5 92 SAO 1165693 Apr 1996 2450177 1.15 2.17 0.33 1403 1363 70 2.5 14.6 82 HIP 5113323 Jan 1997 2450472 1.61 2.19 0.41 2165 1539 50 0.9 30.6 87 HIP 5268914 Jun 1998 2450979 2.39 2.17 0.33 800 571 50 1.6 30.6 87 HIP 507923 Nov 1998 2451121 2.61 2.20 0.20 1087 842 40 1.3 27.2 75 HIP 4958324 Sep 1999 2451446 3.11 2.12 0.21 2702 1383 80 0.9 26.4 73 HIP 4963715 Oct 2000 2451833 3.70 2.09 0.02 1740 2091 30 1.3 26.8 73 HIP 496379 Mar 2001 2451978 3.93 2.09 0.02 390 777 20 1.0 27.0 73 31 Leo
of 200mas (Weigelt et al. 1997, Paper I, Haniff & Buscher1998) and were denoted as A, B, C, and D in order of de-creasing brightness (see Fig. 1). On larger scales the enve-lope of IRC+10216 appears to be spherically symmetric(Mauron & Huggins 1999, 2000). Since most dust shellsaround AGB stars are known to be spherically symmet-ric on larger scales, whereas most proto-planetary neb-ulae (PPN) appear in axisymmetric geometry (Olofsson1996), it is likely that IRC+10216 has already enteredthe transition phase to PPN. This suggests that the breakof symmetry already takes place at the end of the AGBevolution. So far, only a few AGB objects are known toshow prominent asphericities of their dust shells in thenear-infrared, and are therefore believed to have enteredthis transition phase at the end of their AGB life. Thisincludes, for instance, the carbon star CIT6 (Monnier etal. 2000), and the oxygen-rich stars AFGL2290 (Gaugeret al. 1999) and CIT3 (Hofmann et al. 2001).
Recently, we have developed a 2D radiative transfermodel of IRC+10 216 (Men’shchikov et al. 2001; here-after Paper III) which can explain many aspects of thenebula. In this model, the star is located at component Band is surrounded by an optically thick shell with bipolarcavities. The brightest southern component A is identifiedwith radiation emitted and scattered in the optically thin-ner southern cavity of the dense shell. However, Weigeltet al. (1998), Haniff & Buscher (1998), and Tuthill et al.(2000) argued that the star is located at the position ofcomponent A and that components B, C, and D are dustclouds. In the present paper, we attempt to explain therecent changes in the nebula in light of the 2D model ofPaper III, and will comment on the alternative interpre-tations only in passing.
High-resolution near-infrared monitoring of the com-ponents A, B, C, and D has already revealed that thedust shell of IRC+10 216 is rapidly evolving. The 6m tele-scope speckle observations presented in Paper II cover fiveepochs between 1995 and 1998 and show that the sep-arations between the different components had steadilybeen increasing. For example, the distance between theinitially brightest components A and B increased by 36%during 1995-1998. These results are in very good agree-ment with Keck telescope K-band observations obtainedwith the highest resolution to date at 7 epochs between1997 and 1999 by Tuthill et al. (2000). Such direct observa-tions of the dust-shell evolution offer an ideal opportunityto study the mass-loss process in the late stages of AGBevolution, revealing details of the dust formation processas well as the geometry and clumpiness of the stellar wind.
This paper presents new near-infrared bispectrumspeckle interferometry monitoring of IRC+10216 obtainedwith the SAO 6m telescope in 1999–2001, adding 3 newepochs to the already available data of dust-shell evolu-tion. The present observations show that the appearanceof the dust shell has considerably changed compared tothe epochs of 1995 to 1998. This paper is organized asfollows. In Sect. 2, K-band observations of the dust-shellevolution from 1999 to 2001, a comparison of J-, H-, andK-band images of 1996/97 and 2001, and J−H , J−K,and H−K color images are presented. In Sect. 3, theseobservations are discussed on the basis of the general mor-phology, 2D radiative transfer models, and dust-formationmodels. Conclusions are given in Sect. 4.
2. Observations
G. Weigelt et al.: Bispectrum speckle interferometry of IRC+10 216 3
200 mas K, 10/95, Φ=0.88
a
200 mas K, 04/96, Φ=1.15
b
A
D
A
B
C
200 mas K, 01/97, Φ=1.61
c
200 mas K, 06/98, Φ=2.39
d
200 mas K, 11/98, Φ=2.61
e
200 mas K, 09/99, Φ=3.11
f
200 mas K, 10/00, Φ=3.71
g
200 mas K, 03/01, Φ=3.93
h
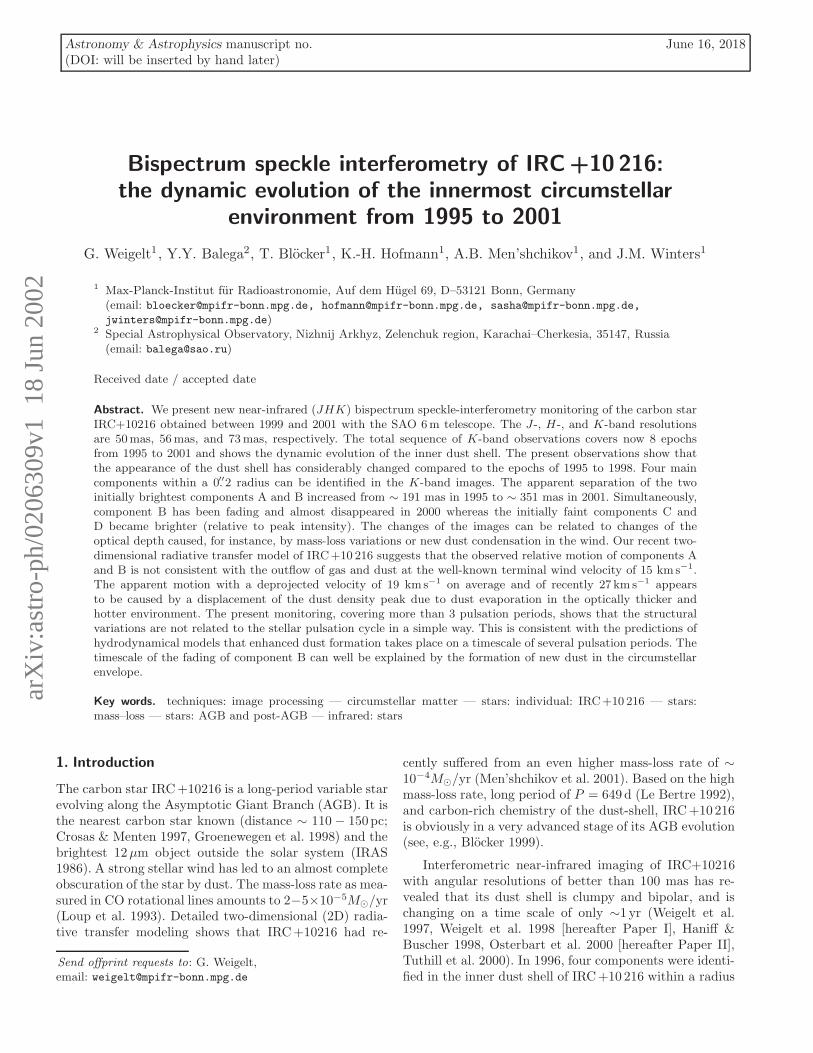
Fig. 1. K-band speckle reconstructions of IRC+10216 for 8 epochs from 1995 to 2001. The total area is 1′′×1′′. Allimages are normalized to the brightest pixel and are presented with the same color table. North is up and east is tothe left.
200 mas J, 03/01, Φ=3.93
200 mas H, 03/01, Φ=3.93
200 mas K, 03/01, Φ=3.93
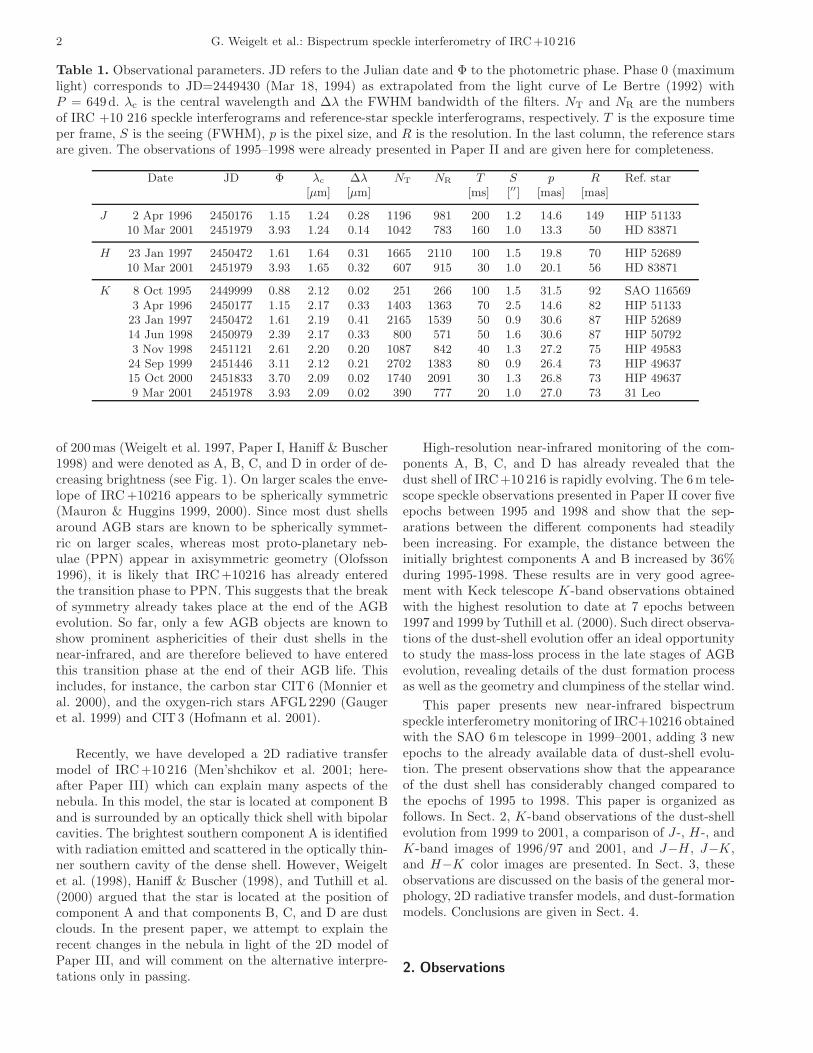
Fig. 2. J-, H- and K-band speckle reconstructions of IRC+10 216 in March 2001. The total area is 1.6′′×1.6′′. Allimages are normalized to the brightest pixel and are presented with the same color table. North is up and east is tothe left. The tick marks indicate the likely position of the central star.
2.1. Data reduction
New bispectrum speckle-interferometry observations ofIRC+10216 were carried out with the Russian 6mtelescope at the Special Astrophysical Observatory inSeptember 1999, October 2000, and March 2001. Thespeckle interferograms were recorded with our HAWAIIspeckle camera in the J , H , and K bands. The speckletransfer function was derived from speckle interferogramsof unresolved reference stars. Table 1 lists the obser-vational parameters of these measurements (1999–2001)
complemented with the data of Paper II (1995–1998).Images of IRC+10216 with resolutions of 50mas (J),56mas (H), and 73mas (K) were reconstructed fromthe speckle interferograms using the bispectrum speckle-interferometry method (Weigelt 1977, Lohmann et al.1983, Hofmann & Weigelt 1986). The modulus of the ob-ject Fourier transform (visibility function) was determinedwith the speckle interferometry method (Labeyrie 1970).The H- and K-band images are diffraction-limited, theresolution in J is only slightly (14%) below the diffractionlimit. Together with the data of Paper II, a time series of
4 G. Weigelt et al.: Bispectrum speckle interferometry of IRC+10 216
8 K-band images, taken between 1995 and 2001, is nowavailable. Additionally, two epochs are covered in J (1996,2001) and H (1997, 2001). Figures 1–3 show the recon-structed K-band images of the innermost region of IRC+10 216 for all 8 epochs between 1995 and 2001, the mostrecent J , H , and K images of March 2001, and a com-parison of the J , H , and K reconstructions from 1996/97and 2001.
2.2. Evolution in the K band from 1995 to 2001
The K–band images (Fig. 1) show several compact com-ponents within a 200 mas radius. We denote these compo-nents as A, B, C, and D in the order of decreasing bright-ness in the 1996 image (cf. Paper I). As already shownin Paper II, the dust shell is dynamically evolving andchanges its shape on a timescale of ∼ 1 yr. For instance,the apparent separation of the two initially brightest com-ponents A and B increased from ∼ 191 mas in 1995 to∼ 351 mas in 2001. At the same time, B has faded andalmost disappeared in 2000 whereas the initially faint com-ponents C and D have become brighter. In 2001, the in-tensity level of C increased to almost 40% of the peakintensity of A. The components A and C appear to havestarted merging in 2000.
During these six years, the compact and bright core ofcomponent A has been changing its shape continuously.While it was almost spherically symmetric in 1995, it isgetting more elongated in the following years. For exam-ple, the ratio of minor to major axis drops to ∼ 0.77 dur-ing the years 1998 and 1999, with the major axis beingaligned along the position angle −48◦ (measured at 35%intensity level). The elongation of the inner core of A staysroughly constant. Additionally, the morphology of the im-age in 2001 gives evidence of the potential development ofa bulge-like structure at PA=−123◦ relative to the centerof A, which may indicate the birth of a new component.
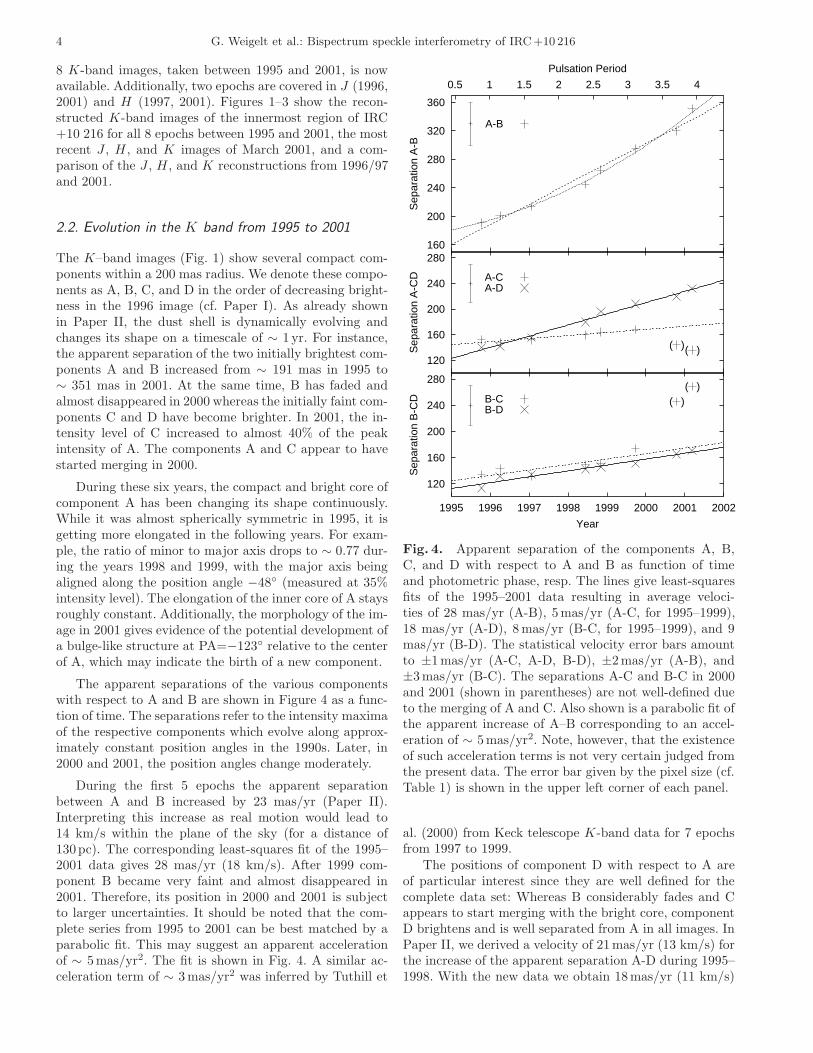
The apparent separations of the various componentswith respect to A and B are shown in Figure 4 as a func-tion of time. The separations refer to the intensity maximaof the respective components which evolve along approx-imately constant position angles in the 1990s. Later, in2000 and 2001, the position angles change moderately.
During the first 5 epochs the apparent separationbetween A and B increased by 23 mas/yr (Paper II).Interpreting this increase as real motion would lead to14 km/s within the plane of the sky (for a distance of130pc). The corresponding least-squares fit of the 1995–2001 data gives 28 mas/yr (18 km/s). After 1999 com-ponent B became very faint and almost disappeared in2001. Therefore, its position in 2000 and 2001 is subjectto larger uncertainties. It should be noted that the com-plete series from 1995 to 2001 can be best matched by aparabolic fit. This may suggest an apparent accelerationof ∼ 5mas/yr2. The fit is shown in Fig. 4. A similar ac-celeration term of ∼ 3mas/yr2 was inferred by Tuthill et
160
200
240
280
320
360
0.5 1 1.5 2 2.5 3 3.5 4
Sep
arat
ion
A-B
Pulsation Period
A-B
120
160
200
240
280
Sep
arat
ion
A-C
D
( )( )
A-CA-D
120
160
200
240
280
1995 1996 1997 1998 1999 2000 2001 2002
Sep
arat
ion
B-C
D
Year
( )( )
B-CB-D
Fig. 4. Apparent separation of the components A, B,C, and D with respect to A and B as function of timeand photometric phase, resp. The lines give least-squaresfits of the 1995–2001 data resulting in average veloci-ties of 28 mas/yr (A-B), 5mas/yr (A-C, for 1995–1999),18 mas/yr (A-D), 8mas/yr (B-C, for 1995–1999), and 9mas/yr (B-D). The statistical velocity error bars amountto ±1mas/yr (A-C, A-D, B-D), ±2mas/yr (A-B), and±3mas/yr (B-C). The separations A-C and B-C in 2000and 2001 (shown in parentheses) are not well-defined dueto the merging of A and C. Also shown is a parabolic fit ofthe apparent increase of A–B corresponding to an accel-eration of ∼ 5mas/yr2. Note, however, that the existenceof such acceleration terms is not very certain judged fromthe present data. The error bar given by the pixel size (cf.Table 1) is shown in the upper left corner of each panel.
al. (2000) from Keck telescope K-band data for 7 epochsfrom 1997 to 1999.
The positions of component D with respect to A areof particular interest since they are well defined for thecomplete data set: Whereas B considerably fades and Cappears to start merging with the bright core, componentD brightens and is well separated from A in all images. InPaper II, we derived a velocity of 21mas/yr (13 km/s) forthe increase of the apparent separation A-D during 1995–1998. With the new data we obtain 18mas/yr (11 km/s)

G. Weigelt et al.: Bispectrum speckle interferometry of IRC+10 216 5
200 mas J, 04/96, Φ=1.15
200 mas H, 01/97, Φ=1.61
200 mas K, 01/97, Φ=1.61
200 mas J, 03/01, Φ=3.93
200 mas H, 03/01, Φ=3.93
200 mas K, 03/01, Φ=3.93
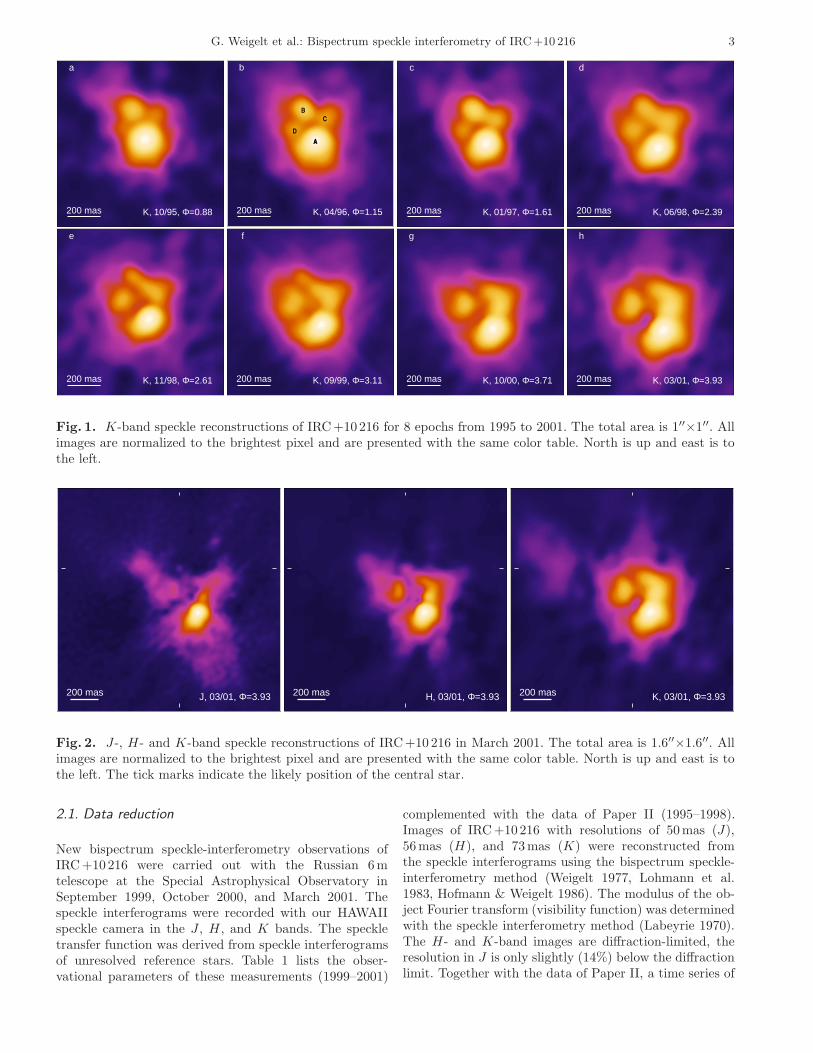
Fig. 3. Left column: J-band speckle images of IRC+10216 in April 1996 (top) and March 2001 (bottom) reconstructedwith the same resolution of 149 mas. Middle column: H-band speckle images of IRC+10216 in January 1997 (top)and March 2001 (bottom) reconstructed with the same resolution of 73 mas. Right column: K-band speckle imagesof IRC+10 216 in January 1997 (top) and March 2001 (bottom) reconstructed with the same resolution of 90 mas.Contour lines are shown from 0.3mag to 4.2mag relative to the peak brightness in steps of 0.3mag. North is upand east is to the left. The dashed lines indicate the biconical geometry of the cavities according to the 2D radiativetransfer model of Paper III; the lines intersect at the position of component B.
for 1995–2001, as shown in Fig. 4. For the evolution ofthese components, there is no evidence of acceleration.The distance A-C has only slightly changed during the 6years. A linear regression yields 5mas/yr for 1995–1999.After 1999, A and C started merging and the separationsdo not follow the above relation anymore (see Fig. 4).
In our radiative transfer modeling (Paper III), compo-nent A was identified with the southern cavity of a bipo-lar structure, whereas the location of the central star isat component B. In the lower panel of Fig. 4 we thereforepresent the apparent separations of the components C andD with respect to component B. Least-squares fits give 8mas/yr (5 km/s, for 1995–1999) for the separation increaseof B-C and 9 mas/yr (6 km/s) for that of B-D. Due to themerging of A and C, the separation B-C increases stronglyin 2000 and 2001. The position of B becomes ill-defined inthe later epochs due to its dimming.
2.3. Changes of the JHK images from1996/97 to 2001
Figure 2 shows the J , H , and K images of IRC+10216obtained in March 2001. The resolution in H and K isdiffraction-limited (56 and 73mas, respectively) whereasin J 86% of the diffraction limit is reached (50mas). Whilethe brightness of the inner dust shell components (yellowregions) increases with increasing wavelength, the bright-ness of the faint surrounding nebula (red regions) staysroughly constant. In the J image, faint nebular structureon sub-arcsecond scales can be seen. The north-easternarm (PA ∼ 51◦ with respect to component A) appearsto have a clumpy structure. Various components can beidentified in this structure at different separations fromthe center. The innermost clump is located at a separationof 256 mas from the center of A, almost coinciding withthe position of component D in the H and K images. Acloser inspection reveals that this clump, in turn, resolvesinto two sub-structures of similar size. Beyond this doubleknot, two further clumps can be identified at a separa-tion of 378 mas and 522 mas, resp. The inner bright coreA appears to show a multi-component structure in the J
6 G. Weigelt et al.: Bispectrum speckle interferometry of IRC+10 216
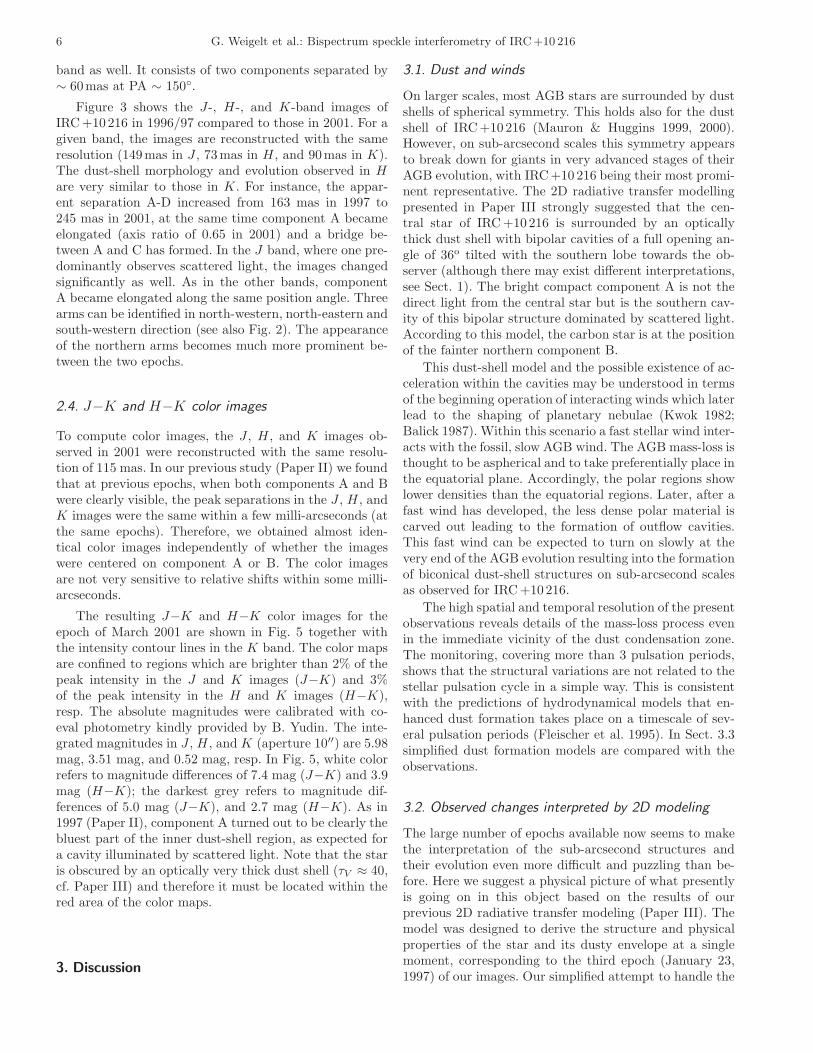
band as well. It consists of two components separated by∼ 60mas at PA ∼ 150◦.
Figure 3 shows the J-, H-, and K-band images ofIRC+10216 in 1996/97 compared to those in 2001. For agiven band, the images are reconstructed with the sameresolution (149mas in J , 73mas in H , and 90mas in K).The dust-shell morphology and evolution observed in Hare very similar to those in K. For instance, the appar-ent separation A-D increased from 163 mas in 1997 to245 mas in 2001, at the same time component A becameelongated (axis ratio of 0.65 in 2001) and a bridge be-tween A and C has formed. In the J band, where one pre-dominantly observes scattered light, the images changedsignificantly as well. As in the other bands, componentA became elongated along the same position angle. Threearms can be identified in north-western, north-eastern andsouth-western direction (see also Fig. 2). The appearanceof the northern arms becomes much more prominent be-tween the two epochs.
2.4. J−K and H−K color images
To compute color images, the J , H , and K images ob-served in 2001 were reconstructed with the same resolu-tion of 115 mas. In our previous study (Paper II) we foundthat at previous epochs, when both components A and Bwere clearly visible, the peak separations in the J , H , andK images were the same within a few milli-arcseconds (atthe same epochs). Therefore, we obtained almost iden-tical color images independently of whether the imageswere centered on component A or B. The color imagesare not very sensitive to relative shifts within some milli-arcseconds.
The resulting J−K and H−K color images for theepoch of March 2001 are shown in Fig. 5 together withthe intensity contour lines in the K band. The color mapsare confined to regions which are brighter than 2% of thepeak intensity in the J and K images (J−K) and 3%of the peak intensity in the H and K images (H−K),resp. The absolute magnitudes were calibrated with co-eval photometry kindly provided by B. Yudin. The inte-grated magnitudes in J , H , and K (aperture 10′′) are 5.98mag, 3.51 mag, and 0.52 mag, resp. In Fig. 5, white colorrefers to magnitude differences of 7.4 mag (J−K) and 3.9mag (H−K); the darkest grey refers to magnitude dif-ferences of 5.0 mag (J−K), and 2.7 mag (H−K). As in1997 (Paper II), component A turned out to be clearly thebluest part of the inner dust-shell region, as expected fora cavity illuminated by scattered light. Note that the staris obscured by an optically very thick dust shell (τV ≈ 40,cf. Paper III) and therefore it must be located within thered area of the color maps.
3. Discussion
3.1. Dust and winds
On larger scales, most AGB stars are surrounded by dustshells of spherical symmetry. This holds also for the dustshell of IRC+10216 (Mauron & Huggins 1999, 2000).However, on sub-arcsecond scales this symmetry appearsto break down for giants in very advanced stages of theirAGB evolution, with IRC+10 216 being their most promi-nent representative. The 2D radiative transfer modellingpresented in Paper III strongly suggested that the cen-tral star of IRC+10216 is surrounded by an opticallythick dust shell with bipolar cavities of a full opening an-gle of 36o tilted with the southern lobe towards the ob-server (although there may exist different interpretations,see Sect. 1). The bright compact component A is not thedirect light from the central star but is the southern cav-ity of this bipolar structure dominated by scattered light.According to this model, the carbon star is at the positionof the fainter northern component B.
This dust-shell model and the possible existence of ac-celeration within the cavities may be understood in termsof the beginning operation of interacting winds which laterlead to the shaping of planetary nebulae (Kwok 1982;Balick 1987). Within this scenario a fast stellar wind inter-acts with the fossil, slow AGB wind. The AGB mass-loss isthought to be aspherical and to take preferentially place inthe equatorial plane. Accordingly, the polar regions showlower densities than the equatorial regions. Later, after afast wind has developed, the less dense polar material iscarved out leading to the formation of outflow cavities.This fast wind can be expected to turn on slowly at thevery end of the AGB evolution resulting into the formationof biconical dust-shell structures on sub-arcsecond scalesas observed for IRC+10216.
The high spatial and temporal resolution of the presentobservations reveals details of the mass-loss process evenin the immediate vicinity of the dust condensation zone.The monitoring, covering more than 3 pulsation periods,shows that the structural variations are not related to thestellar pulsation cycle in a simple way. This is consistentwith the predictions of hydrodynamical models that en-hanced dust formation takes place on a timescale of sev-eral pulsation periods (Fleischer et al. 1995). In Sect. 3.3simplified dust formation models are compared with theobservations.
3.2. Observed changes interpreted by 2D modeling
The large number of epochs available now seems to makethe interpretation of the sub-arcsecond structures andtheir evolution even more difficult and puzzling than be-fore. Here we suggest a physical picture of what presentlyis going on in this object based on the results of ourprevious 2D radiative transfer modeling (Paper III). Themodel was designed to derive the structure and physicalproperties of the star and its dusty envelope at a singlemoment, corresponding to the third epoch (January 23,1997) of our images. Our simplified attempt to handle the
G. Weigelt et al.: Bispectrum speckle interferometry of IRC+10 216 7
200 masJ-K
200 masH-K
Fig. 5. J−K (left) and H−K (right) color images (greyscale images) of the central region of IRC+10216 in March2001, confined to regions which are brighter than 2% of the peak intensity in the J and K images (J−K color image)and 3% of the peak intensity in the H and K images (H−K color image), resp. The resolution is 115 mas. Contourlines refer to the K-band image and are shown from 0.2mag to 3mag relative to the peak brightness in steps of 0.7mag.To construct the respective color images, the J , H , and K reconstructions were centered at the positions of maximumintensity. White regions refer to magnitude differences of 7.4 mag (J−K) and 3.9 mag (H−K); the regions shown inthe darkest grey correspond to magnitude differences of 5.0 mag (J−K) and 2.7 mag (H−K). North is up and east isto the left. Dashed lines indicate the biconical geometry of the cavities according to the 2D radiative transfer modelof Paper III.
difficult problem of self-consistent time-dependent multi-dimensional radiative transfer modeling will be presentedelsewhere (Men’shchikov et al. 2002, submitted).
3.2.1. The star and its evolving environment
Key point to the understanding of the structure and evo-lution of the sub-arcsecond environment of IRC+10216is the knowledge of the position of the central star in theimages. As we have suggested in the previous modeling(Paper III), the brightest compact peak A seen in all im-ages is not the direct light from the central star. The staris most likely located at the position of the fainter peak B,whereas component A is the radiation emitted and scat-tered in the optically thinner conical cavity of the opticallythick bipolar dust shell. The even fainter components Cand D in the H andK images were identified with smaller-scale deviations of the density distribution of the circum-stellar environment from axial symmetry (Fig. 1; Fig. 2in Paper III). These inhomogeneities are less opaque thanother, more regular regions of the compact dense shell.
An alternative interpretation of the morphology of ourimages of IRC+10216 would be that components A andB are the lobes of a bipolar nebula and that the star islocated in the dark region between them. However, thisinterpretation disagrees with our radiative transfer mod-eling presented in Paper III. A reason for this is that theoptically thick dust which would form the bipolar lobescannot exist so close to the star, at half the distance be-tween the components. Thus, the star is probably locatedeither at A or B. The fan-shaped morphology of compo-nent A in the J- and H-band images, as well as other
evidence presented in Papers II and III, strongly suggestthat the star is located at the position of B.
Having defined the stellar position at component B, wecan now interpret the evolving appearance of IRC+10216in terms of an increased mass-loss rate during the last ∼30 years. One of the main features of the entire 8-epochsequence of imaging is the relative fading of the stellarcomponent B (Figs. 1, 2). Other changes seen in the im-ages are the increasing distances of components A, C, Dfrom the star (Fig. 4) and their greatly varying shapes.Our radiative transfer modeling (Paper III) has shownthat the observed components are cavities in the denseopaque shell; therefore, the observed motion requires anadditional discussion (Sect. 3.2.4).
3.2.2. The near-IR images and model cavities
In order to better visualize the relative location of thecomponents, we have shown the structure (conical cavi-ties) of our model (Paper III) in the observed images bydashed lines in Figs. 3 and 5. The lines intersecting atthe position of the central star and making an angle of46◦ between them, outline the biconical geometry of thecavities.
The April 1996 J-band image in Fig. 3 best exhibitsthe bipolar geometry of IRC+10 216. Clearly visible atthis wavelength are the fan shape of the brightest com-ponent A and even the scattered light from the opposite(northern) cavity on the far side of the dense shell. Faintdirect stellar light is visible near the origin of the conicalcavities. The star (component B) appears much brighterin the January 1997 H-band image (Fig. 3), whereas thefan shape of the cavity (component A) is less prominent

8 G. Weigelt et al.: Bispectrum speckle interferometry of IRC+10 216
but still well visible at this wavelength. The H and K im-ages in 1997 agree very well with our model presented inPaper III. The March 2001 H and K images are qualita-tively similar to the older images obtained in 1997, butdistorted by the appearance of several fainter structuresclose to component D and by merging of the bright com-ponent A with component C. The faint direct stellar lighthas become more difficult to identify in H and it has beenburied in the enhanced dust emission from all the othercomponents in the March 2001 K-band image.
The most recent J image of IRC+10216 with a 3 timeshigher resolution (50 mas, Fig. 2) shows in much greaterdetail the fine structure of the envelope. The image revealsa rather isolated, faint peak at the position of the centralstar (marked in Fig. 2). The following evidence suggeststhat this peak is indeed the direct light from the star, notjust a clump that happened to be there: (1) its positionangle relative to A (PA ≈ 20 ◦) is the same as in all theimages where the star (component B) is clearly visible, (2)theH image at the same epoch shows a (less isolated) peakat the same position, (3) the distance of approximately 347mas between the peak and the component A is consistentwith the fit of Fig. 4.
One might think that the faint stellar peak should bemuch better visible in K band (Fig. 2), where opticaldepths are significantly lower compared to J . However,the greatly enhanced hot dust emission in K band maywell make it completely invisible. In fact, from the con-tinuum of the model stellar atmosphere used in Paper III,we estimate that the stellar brightness in J and K bandsis approximately the same. The dust model of Paper IIIwould predict that the star is a factor of ∼ 1.8 × 10³
brighter in K than in J band, whereas our new model ofIRC+10216 (Men’shchikov et al., submitted), computedspecifically for the latest epoch of March 2001, predicts alarger factor of ∼ 1.3× 10⁴. On the other hand, from thecalibrated color images of Fig. 5 we know that the nebulabecomes much brighter between J and K (and thus red-der), by a factor of ∼ 1.4 × 10⁴. Therefore, it is unlikelythat in K the stellar peak is visible better than in J band.
3.2.3. Shapes of the near-IR color maps
The high-resolution J−H , J−K, and H−K color imagesin Fig. 5 observed in March 2001 confirm our interpreta-tion that the bright components A, C, and D are, respec-tively, the cavity and smaller-scale inhomogeneities in thedense shell, not dense clumps of dust as it might appearfrom the images alone (Figs. 1–3). In fact, all the brightcomponents coincide with the blue areas in the color im-ages, the cavity A corresponding to the bluest spot. This isa natural consequence of lower optical depths along thosedirections from the star, with the “hot” stellar photonsbeing scattered into the direction of the observer. Thisis illustrated in Fig. 5 by the dashed lines showing thegeometry of our model (Paper III). The bluest, opticallythinnest spot is located precisely inside the conical cavity.
The star, obscured by ∼ 40 mag of visual circumstellarextinction, is situated in the red area of the color images,as it was also in the previous epochs (Fig. 16 in Paper III).
3.2.4. Moving dense layer or dust evaporation?
The apparent motion of the components A, C, and D(Fig. 1) could be attributed either to the real radial ex-pansion of the opaque dense layer with several “holes”in the dense dust formation zone or to a displacementof the dust formation radius due to evaporation of re-cently formed dust by a hotter environment. Here, weanalyze both processes and argue that the temperature-induced displacement of the dust formation zone is actingin IRC+10216. For simplicity, we consider a single dustformation radius corresponding to the formation of carbondust (cf. Paper III).
One can explain the observed decreasing brightness ofthe star by assuming a monotonically increasing mass-lossrate and, hence, higher densities and optical depths of thewind in the dust formation zone. Higher mass loss andcontinuing condensation of new dust in the wind out ofthe gas phase increase the temperatures of the outflowinggas and dust due to backwarming. Increasing tempera-tures affect the location of the inner dust boundary of theenvelope via dust sublimation, causing its displacementwith a velocity that has nothing to do with the outflowmotion of the envelope.
Crucial to distinguishing between the real motion of adense layer and the temperature-induced shift of the dustformation zone are estimates of the apparent velocities ofthe components A, C, and D relative to the star. For theassumed distance of 130 pc, the linear fit in Fig. 4 gives forthe brightest component A a velocity vA ≈ 18 km s−1 inthe plane of sky. On the basis of our model (Paper III), onecan derive for the component a deprojected radial velocityvrA ≈ 19 kms−1.
Since the deprojected radial velocity is higher than theobserved (terminal) wind outflow speed in IRC+10216 ofv ≈ 15 km s−1, it is unlikely that the observed changes re-flect just an expansion of a dense layer in which grains areforming. In fact, the standard picture of a stationary stel-lar wind predicts an acceleration of dust and gas withindistances by a factor of ∼ 2–5 larger than the dust for-mation radius (Steffen et al. 1997). Due to the radiationpressure on dust grains, the wind velocity increases in thistransition zone, approaching asymptotically the terminalvelocity at larger distances. As our model (Paper III) as-sociates the observed components of IRC+10216 with thedust formation zone, we expect that dust and gas are notyet fully accelerated there, i.e. that the radial outflow ve-locity vr < 15 km s−1.
However, the deprojected velocity vrA ≈ 19 km s−1 issignificantly larger than the expected wind velocity in thedust formation zone. Only if we assume an unlikely lowerlimit of 100pc (Becklin et al. 1969), does the deprojectedvelocity vrA approach (from above) v ≈ 15 km s−1, which
G. Weigelt et al.: Bispectrum speckle interferometry of IRC+10 216 9
is still too high for the dust formation zone. If, however,the actual distance to IRC+10 216 is larger than 130pc,one would obtain vr >∼ 19 km s−1 and an even larger dis-crepancy.
Moreover, there are reasons to believe that the acceler-ation depicted by the parabolic fit in Fig. 4 is real and thatthe actual apparent motion of A is now as fast as vA ≈ 26km s−1. The corresponding deprojected velocity is thenvrA ≈ 28 km s−1, much higher than the expected windspeed, for any realistic distance to IRC+10216. Takenin context with increasing optical depths in the shell, thissuggests that the observed motions are caused by the rapiddust evaporation due to backwarming and higher temper-atures in the dense environment formed by the increasedmass loss.
We believe that a reasonable interpretation of the ob-served changes in IRC+10216 would be the followingpicture. During the recent period of increasing mass-losswhich started ∼ 20–30 years ago, a compact dense shellhas formed around the star. The mass-loss rate was re-cently as high as M ≈ 10−4M⊙ yr−1 (Paper III) and theinnermost regions of the dust shell are expanding outwardat a local wind velocity v <∼ 10 km s−1. Dust formationcontinues in the expanding material, thus increasing itsoptical depth and obscuring the central star. The opticaldepths in the polar regions remain significantly smallerthan in the other regions of the dense shell, making thecavity (A) and the other components relatively brighterthan at previous epochs. As the dense, increasingly op-tically thick dusty shell expands, steeply rising tempera-tures inside it (due to the backwarming from the steep-ening density front) inhibit further dust condensation andevaporate outflowing grains. In effect, these processes havebeen shifting recently the dust formation radius outwardwith an average velocity vr ≈ 19 km s−1 (or as high as∼ 30 km s−1 in 2001, if the apparent acceleration mea-sured in this work is real). One can predict that the starwill remain obscured until M starts to drop back to lowervalues. In a few years from that moment, we could prob-ably be witnessing the star (B) reappearing whereas thecavities becoming relatively fainter.
3.3. Dust formation models and the fading of B
If the star is located at the position of component B, as issuggested by the two-dimensional radiative transfer model(see Sect. 3.2 and Paper III), the fading of B might becaused by the formation of new dust along the line of sighttowards the star. To investigate, whether such a scenariowould be capable of explaining the observed time scaleof the fading of B, we constructed a very simple gas boxmodel. The idea is to follow the process of carbon grainformation in a gas element moving away from the star ata constant velocity. To characterize the changing thermo-
dynamic conditions experienced by the gas element, weassume a power-law gas temperature stratification
T g(r) = T g0
(
R0
r
)α
(1)
and evaluate the gas density structure from mass conser-vation in a stationary, spherically symmetric configuration
ρg(r) =M
4πv
1
r2= ρg0
(
R0
r
)2
. (2)
For the co-moving gas element, the time coordinate isgiven by
dt =dr
v. (3)
In this gas element, we consider heteromolecular for-mation and growth of carbon grains which we computeaccording to the moment method derived by Gail &Sedlmayr (1988). The growth process includes reactionswith the molecular species C, C2, C2H, and C2H2. In or-der to calculate the concentrations of the relevant carbon-bearing molecules, chemical equilibrium in the gas phaseis assumed. We consider a carbon-rich element mixturewith otherwise solar abundances.
In Fig. 6 the resulting temporal evolution of the gasbox is depicted for the following parameters: T0 = 3000Kat a radius R0 = 3.15 × 1013 cm (corresponding to theStefan-Boltzmann radius for T0 and a stellar luminosityof 15000L⊙), α = 0.5 (i.e. an optically thin temperaturedistribution), M = 10−4M⊙yr
−1 (reflecting a presentlyincreased mass-loss rate of IRC +10216), a constant out-flow velocity of v = 15 kms−1, and a carbon abundance(by number) of ǫC = 1.5 ǫO.
In the upper panel of Fig. 6 the prescribed time evolu-tion of gas temperature (Eq. (1)) and density (Eq. (2)) inthe gas box are shown. The second panel depicts the nucle-ation rate J∗, i.e. the number of seed particles formed persecond and hydrogen nucleus (solid line) and the numberof dust grains per hydrogen nucleus (dash-dotted line). Inthe third panel, the degree of condensation, i.e. the frac-tion of condensible material that is actually condensedis shown (solid line). The dash-dotted line indicates theoptical depth at 2.2µm (measured from the star), thatwould build up in a stationary situation. To calculate thedust extinction coefficient, we assume the small particlelimit of Mie theory. This is justified, since the mean par-ticle radius 〈a〉 reached after 15P is 5× 10⁻²µm, giving amaximum size parameter x = 2π〈a〉/λ = 0.14 at the con-sidered wavelength of λ = 2.2µm. The optical propertiesof the grains are described by the complex refractive indexof amorphous carbon tabulated in Preibisch et al. (1993).In the lower panel we plot the normalized intensity at2.2µm that would emerge along the line of sight from theincreasingly obscured radiation source (solid line). Thisintensity is calculated from the formal solution of the ra-diative transfer equation:
I
I0= e−τ2.2µm +
∫ τ2.2µm
0
B(T (t′))
I0e−(τ2.2µm−t
′) dt′ . (4)
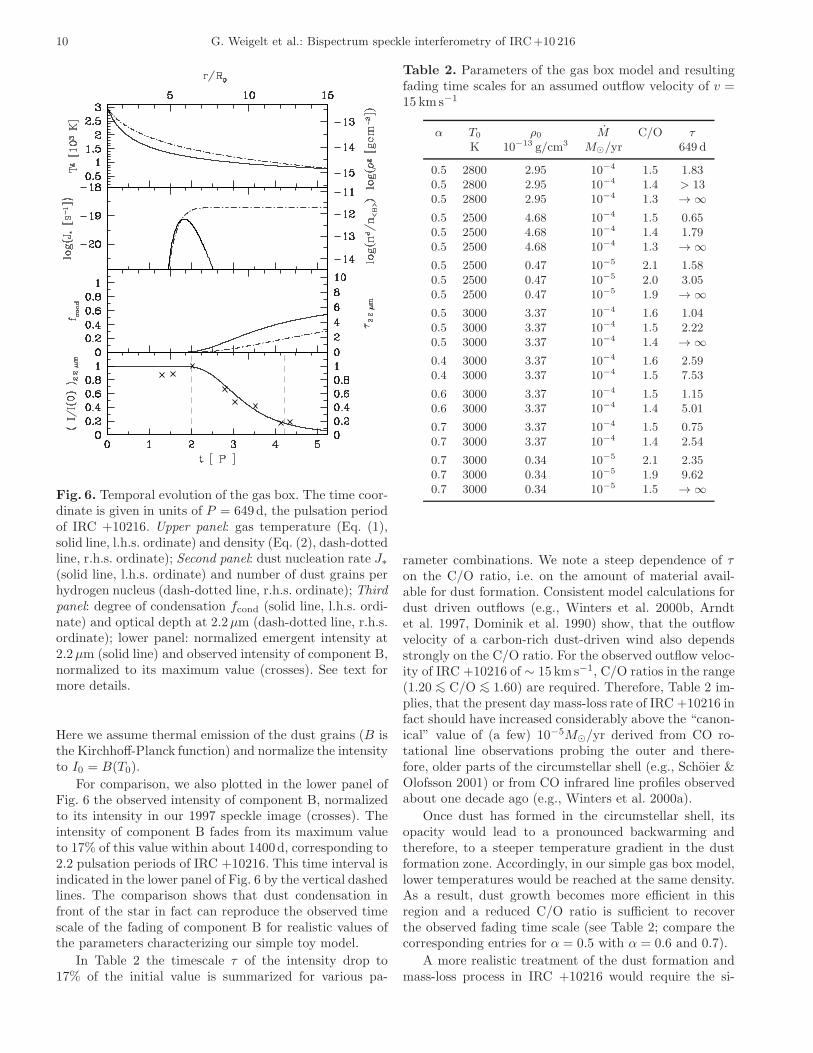
10 G. Weigelt et al.: Bispectrum speckle interferometry of IRC+10 216
Fig. 6. Temporal evolution of the gas box. The time coor-dinate is given in units of P = 649d, the pulsation periodof IRC +10216. Upper panel: gas temperature (Eq. (1),solid line, l.h.s. ordinate) and density (Eq. (2), dash-dottedline, r.h.s. ordinate); Second panel: dust nucleation rate J∗(solid line, l.h.s. ordinate) and number of dust grains perhydrogen nucleus (dash-dotted line, r.h.s. ordinate); Thirdpanel: degree of condensation fcond (solid line, l.h.s. ordi-nate) and optical depth at 2.2µm (dash-dotted line, r.h.s.ordinate); lower panel: normalized emergent intensity at2.2µm (solid line) and observed intensity of component B,normalized to its maximum value (crosses). See text formore details.
Here we assume thermal emission of the dust grains (B isthe Kirchhoff-Planck function) and normalize the intensityto I0 = B(T0).
For comparison, we also plotted in the lower panel ofFig. 6 the observed intensity of component B, normalizedto its intensity in our 1997 speckle image (crosses). Theintensity of component B fades from its maximum valueto 17% of this value within about 1400d, corresponding to2.2 pulsation periods of IRC +10216. This time interval isindicated in the lower panel of Fig. 6 by the vertical dashedlines. The comparison shows that dust condensation infront of the star in fact can reproduce the observed timescale of the fading of component B for realistic values ofthe parameters characterizing our simple toy model.
In Table 2 the timescale τ of the intensity drop to17% of the initial value is summarized for various pa-
Table 2. Parameters of the gas box model and resultingfading time scales for an assumed outflow velocity of v =15 kms−1
α T0 ρ0 M C/O τK 10−13 g/cm3 M⊙/yr 649 d
0.5 2800 2.95 10−4 1.5 1.830.5 2800 2.95 10−4 1.4 > 130.5 2800 2.95 10−4 1.3 → ∞
0.5 2500 4.68 10−4 1.5 0.650.5 2500 4.68 10−4 1.4 1.790.5 2500 4.68 10−4 1.3 → ∞
0.5 2500 0.47 10−5 2.1 1.580.5 2500 0.47 10−5 2.0 3.050.5 2500 0.47 10−5 1.9 → ∞
0.5 3000 3.37 10−4 1.6 1.040.5 3000 3.37 10−4 1.5 2.220.5 3000 3.37 10−4 1.4 → ∞
0.4 3000 3.37 10−4 1.6 2.590.4 3000 3.37 10−4 1.5 7.53
0.6 3000 3.37 10−4 1.5 1.150.6 3000 3.37 10−4 1.4 5.01
0.7 3000 3.37 10−4 1.5 0.750.7 3000 3.37 10−4 1.4 2.54
0.7 3000 0.34 10−5 2.1 2.350.7 3000 0.34 10−5 1.9 9.620.7 3000 0.34 10−5 1.5 → ∞
rameter combinations. We note a steep dependence of τon the C/O ratio, i.e. on the amount of material avail-able for dust formation. Consistent model calculations fordust driven outflows (e.g., Winters et al. 2000b, Arndtet al. 1997, Dominik et al. 1990) show, that the outflowvelocity of a carbon-rich dust-driven wind also dependsstrongly on the C/O ratio. For the observed outflow veloc-ity of IRC +10216 of ∼ 15 kms−1, C/O ratios in the range(1.20 <∼ C/O <∼ 1.60) are required. Therefore, Table 2 im-plies, that the present day mass-loss rate of IRC +10216 infact should have increased considerably above the “canon-ical” value of (a few) 10−5M⊙/yr derived from CO ro-tational line observations probing the outer and there-fore, older parts of the circumstellar shell (e.g., Schoier &Olofsson 2001) or from CO infrared line profiles observedabout one decade ago (e.g., Winters et al. 2000a).
Once dust has formed in the circumstellar shell, itsopacity would lead to a pronounced backwarming andtherefore, to a steeper temperature gradient in the dustformation zone. Accordingly, in our simple gas box model,lower temperatures would be reached at the same density.As a result, dust growth becomes more efficient in thisregion and a reduced C/O ratio is sufficient to recoverthe observed fading time scale (see Table 2; compare thecorresponding entries for α = 0.5 with α = 0.6 and 0.7).
A more realistic treatment of the dust formation andmass-loss process in IRC +10216 would require the si-

G. Weigelt et al.: Bispectrum speckle interferometry of IRC+10 216 11
multaneous solution of the time dependent hydrodynamicequations, taking into account the pulsation of the star,together with the equations describing the dust formationprocess and the radiative transfer problem. Such a con-sistent investigation will be presented in a forthcomingpaper.
An alternative interpretation of the fading of compo-nent B, together with its increasing separation from A,could be based on a scenario, where the star is locatedin the direction of component A, as argued in previousstudies by Weigelt et al. (1998), Haniff & Buscher (1998),and Tuthill et al. (2000). In this case, component B wouldindicate thermal emission from a dust cloud, ejected fromthe star in a direction almost perpendicular to the line ofsight. The temporal evolution of the brightness of B wouldthen be the result of a competition between the initiallyincreasing thermal emission due to ongoing dust forma-tion in the cloud and decreasing temperature of the cloudas it is moving away from the star. Preliminary results forthis scenario, which are based on a consistent model cal-culation, are presented in Winters et al. (2002). Althoughthe time scale of the fading of component B is reproducedquite well in this model, the calculated intensity ratio be-tween the expanding cloud and the star is smaller thanthe observed intensity ratio between components B and Aby about a factor of 3.
4. Summary
We presented new near-infrared (JHK) bispectrumspeckle-interferometry monitoring of the carbon starIRC+10216 obtained during 1999–2001 with the SAO 6mtelescope. The J-, H-, and K-band resolutions are 50mas,56mas, and 73mas, respectively. Together with the dataof Paper II, the availableK-band observations cover now 8epochs from 1995 to 2001 and show the dynamic evolutionof the inner dust shell. Our images show very good agree-ment with the images (1997–1999) reported by Tuthill etal. (2000). Four main components within a 0.′′2 radius canbe identified, which are surrounded by a fainter asymmet-ric nebula. The apparent separation of the two initiallybrightest components A and B increased from ∼ 191 masin 1995 to ∼ 351 mas in 2001. At the same time, compo-nent B has been fading and almost disappeared in 2000whereas the initially faint components C and D becamebrighter. There is weak evidence for an accelerated appar-ent motion of component B with respect to A. This mightbe related to the beginning development of a fast polarwind or, as favored by the radiative transfer calculations,to rapid dust evaporation due to backwarming effects. Thechanges of the images can be related to changes of the op-tical depth caused, for example, by mass-loss variations ornew dust condensation in the wind. The observed relativemotion of components A and B with a deprojected veloc-ity of 19 km s−1 is most likely due to dust evaporation inthe optically thicker and hotter environment.
The present monitoring covers more than 3 pulsationperiods and shows that the structural variations are not
related to the stellar pulsation cycle in a simple way.This is consistent with the predictions of hydrodynami-cal models that enhanced dust formation takes place ona timescale of several pulsation periods. We have demon-strated, that formation of new dust along the line of sighttowards the star can explain the observed fading time scaleof component B, for reasonable values of the parametersinvolved in our simple gas box model. In particular, thisdust formation calculation lends independent support tothe previous finding that the present-day mass loss rate ofIRC +10216 should be of the order of 10−4M⊙/yr. Furtherhigh-resolution observations will be most important fortesting different views and models, and for better under-standing of the evolution of this complicated nebula.
Acknowledgements. The observations were made with theSAO 6m telescope, operated by the Special AstrophysicalObservatory, Russia. We thank Boris Yudin for providing near-infrared photometric data of IRC+10 216. This research hasmade use of the SIMBAD database, operated by CDS inStrasbourg, and of NASA’s Astrophysics Data System.
References
Arndt T.U., Fleischer A.J., & Sedlmayr E. 1997, A&A 327,614
Balick B., 1987, AJ 94, 671
Becklin E.E., Frogel J.A., Hyland A.R., Kristian J., &Neugebauer G., 1969, ApJ 158, L133.
Blocker T., 1999, Asymptotic Giant Branch Stars, IAU Symp.191, T. Le Bertre, A. Lebre, and C. Waelkens (eds.),Astronomical Society of the Pacific, p. 21
Crosas M. & Menten K., 1997, ApJ 483, 913Dominik C., Gail H.-P., Sedlmayr E., & Winters J.M., 1990,
A&A 240, 365
Fleischer A.J., Gauger A., & Sedlmayr E., 1995, A&A 297, 543Gail H.-P. & Sedlmayr E. 1988, A&A 206, 153Gauger A., Balega Y., Irrgang P., Osterbart R. & Weigelt G.,
1999, A&A 346, 509Groenewegen M.A.T., van der Veen W.E.C.J., & Matthews
H.E., 1998, A&A 338, 491
Haniff C.A. & Buscher D.F., 1998, A&A 334, L5Hofmann K.-H. & Weigelt G., 1986, A&A 167, L15
Hofmann K.-H., Balega Y., Blocker T., & Weigelt G., 2001,A&A 379, 529
IRAS Catalog of Point Sources, 1986, Version 2.0, Joint IRASScience W.G.
Kwok S., 1982, ApJ 258, 280Labeyrie A., 1970, A&A 6, 85
Le Bertre T., 1992, A&AS 94, 377Lohmann A.W., Weigelt G., & Wirnitzer B., 1983, Appl. Opt.
22, 4028Loup C., Forveille T., Omont A., & Paul J.F., 1993, A&AS 99,
291.
Mauron N. & Huggins P.J., 1999, A&A 349, 203Mauron N. & Huggins P.J., 2000, A&A 359, 707Men’shchikov A.B., Balega Y.Y., Blocker T., Osterbart R., &
Weigelt G. 2001, A&A 368, 497 (Paper III)Monnier J.D., Tuthill P.G., & Danchi W.C., 2000, ApJ 545,
957
Olofsson H., 1996, ApSS 245, 169

12 G. Weigelt et al.: Bispectrum speckle interferometry of IRC+10 216
Osterbart R., Balega Y., Blocker T., Men’shchikov A.B., &Weigelt G., 2000, A&A 357, 169 (Paper II)
Preibisch T., Ossenkopf V., Yorke H.W., & Henning T. 1993,A&A 279, 577
Schoier F.L. & Olofsson H. 2001, A&A 368, 969Steffen M., Szczerba R., Men’shchikov A.B., & Schonberner
D., 1997, A&ASS 126, 39Tuthill P.G., Monnier J.D., Danchi W.C., & Lopez B., 2000,
ApJ 543, 284Weigelt G., 1977, Optics Commun. 21, 55Weigelt G., Balega, Y., Hofmann, K.-H., Langer, N., &
Osterbart, R., 1997, Science with the VLT Interferometer,ESO Astrophysics Symposia, p. 206
Weigelt G., Balega Y., Blocker T., Fleischer A.J., OsterbartR., & Winters J.M., 1998, A&A 333, L51 (Paper I)
Winters J. M., Blocker T., Hofmann K.-H., & Weigelt G. 2002,in IAU Symp. 209: Planetary Nebulae and Their Role in theUniverse, M. Dopita, S. Kwok, & R. S. Sutherland (eds.),ASP, in press
Winters J.M., Keady J.J., Gauger A., & Sada P.V. 2000a, A&A359, 651
Winters J.M., Le Bertre T., Jeong K.S., Helling C., & SedlmayrE. 2000b, A&A 361, 641