BISD Schools FIRST Report 2017
18
Brazosport Independent School District Texas 2017 Annual Financial Management Report – Schools FIRST For the Year Ending August 31, 2016 Danny Massey, Superintendent of Schools Rebecca Kelley, Chief Financial & Governmental Affairs Officer
Transcript of BISD Schools FIRST Report 2017

Brazosport Independent School District Texas
2017 Annual Financial Management Report – Schools FIRST
For the Year Ending August 31, 2016
Danny Massey, Superintendent of Schools
Rebecca Kelley,
Chief Financial & Governmental Affairs Officer

2
BRAZOSPORT INDEPENDENT SCHOOL DISTRICT SCHOOLS FIRST REPORT
Table of Contents
Page Introduction 3 Financial Accountability Ratings Worksheet 4 - 6 Overview of the Worksheet’s Criteria Critical Indicators 1-5 7 Critical Indicators 6-9 8 Critical Indicators 10-15 9 2015-2016 Status Counts and Rating Counts 10 2015-2016 All District Results by Indicator 10 - 12 2015-2016 Answers by Indicator 12 - 13
3
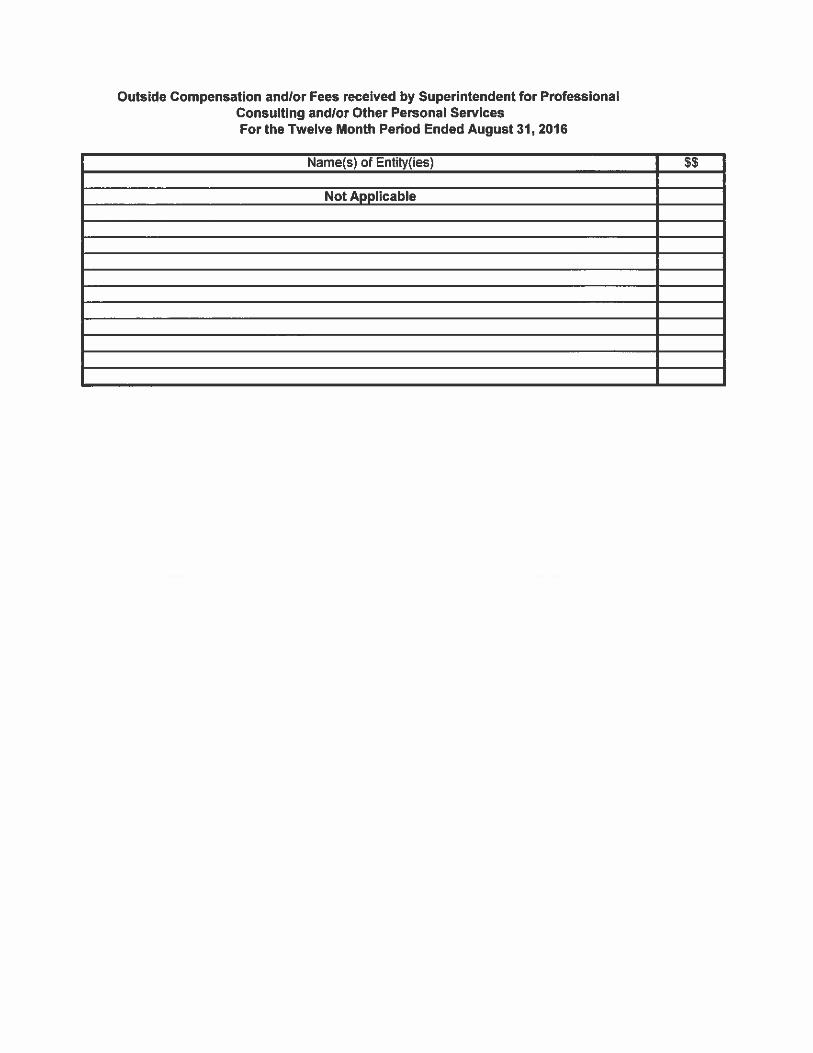
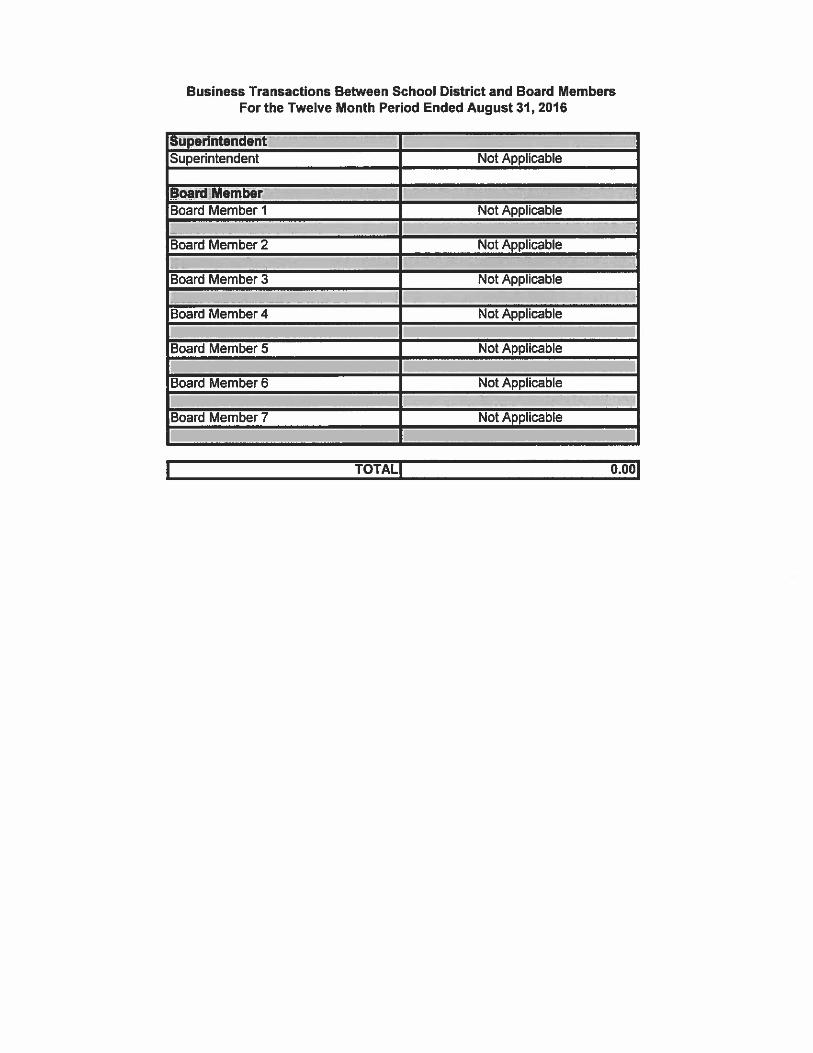
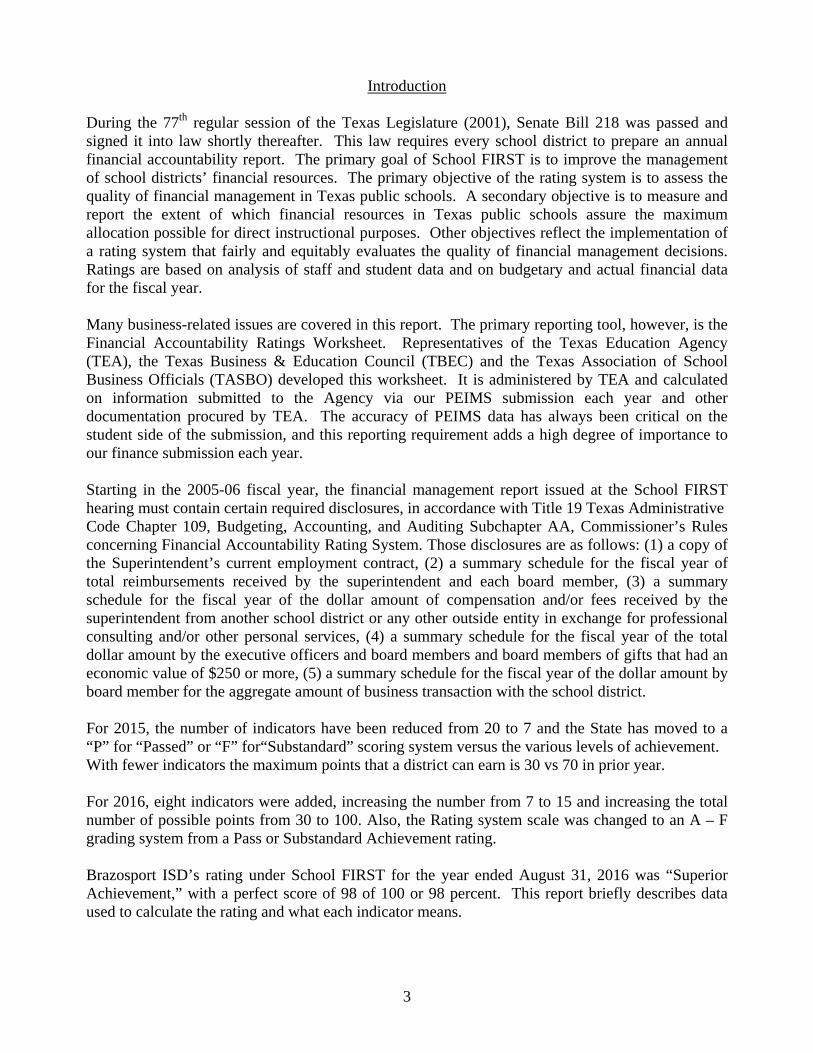
Introduction During the 77th regular session of the Texas Legislature (2001), Senate Bill 218 was passed and signed it into law shortly thereafter. This law requires every school district to prepare an annual financial accountability report. The primary goal of School FIRST is to improve the management of school districts’ financial resources. The primary objective of the rating system is to assess the quality of financial management in Texas public schools. A secondary objective is to measure and report the extent of which financial resources in Texas public schools assure the maximum allocation possible for direct instructional purposes. Other objectives reflect the implementation of a rating system that fairly and equitably evaluates the quality of financial management decisions. Ratings are based on analysis of staff and student data and on budgetary and actual financial data for the fiscal year. Many business-related issues are covered in this report. The primary reporting tool, however, is the Financial Accountability Ratings Worksheet. Representatives of the Texas Education Agency (TEA), the Texas Business & Education Council (TBEC) and the Texas Association of School Business Officials (TASBO) developed this worksheet. It is administered by TEA and calculated on information submitted to the Agency via our PEIMS submission each year and other documentation procured by TEA. The accuracy of PEIMS data has always been critical on the student side of the submission, and this reporting requirement adds a high degree of importance to our finance submission each year. Starting in the 2005-06 fiscal year, the financial management report issued at the School FIRST hearing must contain certain required disclosures, in accordance with Title 19 Texas Administrative Code Chapter 109, Budgeting, Accounting, and Auditing Subchapter AA, Commissioner’s Rules concerning Financial Accountability Rating System. Those disclosures are as follows: (1) a copy of the Superintendent’s current employment contract, (2) a summary schedule for the fiscal year of total reimbursements received by the superintendent and each board member, (3) a summary schedule for the fiscal year of the dollar amount of compensation and/or fees received by the superintendent from another school district or any other outside entity in exchange for professional consulting and/or other personal services, (4) a summary schedule for the fiscal year of the total dollar amount by the executive officers and board members and board members of gifts that had an economic value of $250 or more, (5) a summary schedule for the fiscal year of the dollar amount by board member for the aggregate amount of business transaction with the school district. For 2015, the number of indicators have been reduced from 20 to 7 and the State has moved to a “P” for “Passed” or “F” for“Substandard” scoring system versus the various levels of achievement. With fewer indicators the maximum points that a district can earn is 30 vs 70 in prior year. For 2016, eight indicators were added, increasing the number from 7 to 15 and increasing the total number of possible points from 30 to 100. Also, the Rating system scale was changed to an A – F grading system from a Pass or Substandard Achievement rating. Brazosport ISD’s rating under School FIRST for the year ended August 31, 2016 was “Superior Achievement,” with a perfect score of 98 of 100 or 98 percent. This report briefly describes data used to calculate the rating and what each indicator means.
4
Financial Integrity Rating System of Texas
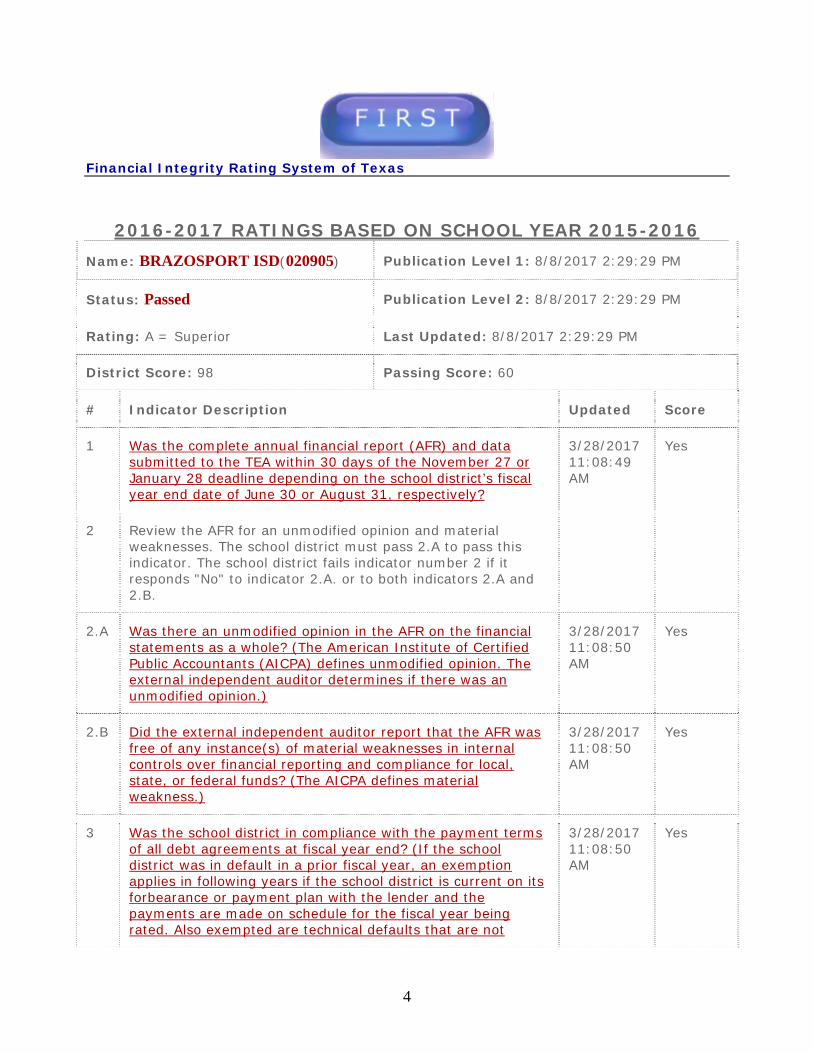
2016-2017 RATINGS BASED ON SCHOOL YEAR 2015-2016 Name: BRAZOSPORT ISD(020905) Publication Level 1: 8/8/2017 2:29:29 PM
Status: Passed Publication Level 2: 8/8/2017 2:29:29 PM
Rating: A = Superior Last Updated: 8/8/2017 2:29:29 PM
District Score: 98 Passing Score: 60
# Indicator Description Updated Score
1 Was the complete annual financial report (AFR) and data submitted to the TEA within 30 days of the November 27 or January 28 deadline depending on the school district’s fiscal year end date of June 30 or August 31, respectively?
3/28/2017 11:08:49 AM
Yes
2 Review the AFR for an unmodified opinion and material weaknesses. The school district must pass 2.A to pass this indicator. The school district fails indicator number 2 if it responds "No" to indicator 2.A. or to both indicators 2.A and 2.B.
2.A Was there an unmodified opinion in the AFR on the financial statements as a whole? (The American Institute of Certified Public Accountants (AICPA) defines unmodified opinion. The external independent auditor determines if there was an unmodified opinion.)
3/28/2017 11:08:50 AM
Yes
2.B Did the external independent auditor report that the AFR was free of any instance(s) of material weaknesses in internal controls over financial reporting and compliance for local, state, or federal funds? (The AICPA defines material weakness.)
3/28/2017 11:08:50 AM
Yes
3 Was the school district in compliance with the payment terms of all debt agreements at fiscal year end? (If the school district was in default in a prior fiscal year, an exemption applies in following years if the school district is current on its forbearance or payment plan with the lender and the payments are made on schedule for the fiscal year being rated. Also exempted are technical defaults that are not
3/28/2017 11:08:50 AM
Yes
5
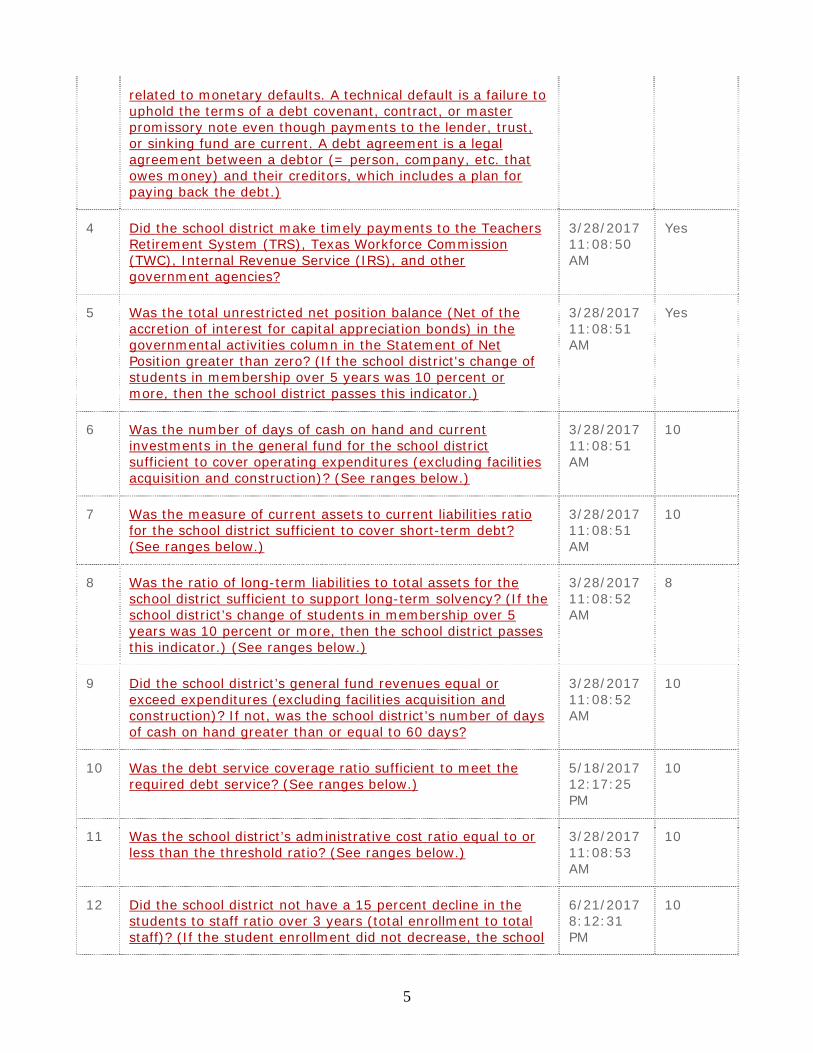
related to monetary defaults. A technical default is a failure to uphold the terms of a debt covenant, contract, or master promissory note even though payments to the lender, trust, or sinking fund are current. A debt agreement is a legal agreement between a debtor (= person, company, etc. that owes money) and their creditors, which includes a plan for paying back the debt.)
4 Did the school district make timely payments to the Teachers Retirement System (TRS), Texas Workforce Commission (TWC), Internal Revenue Service (IRS), and other government agencies?
3/28/2017 11:08:50 AM
Yes
5 Was the total unrestricted net position balance (Net of the accretion of interest for capital appreciation bonds) in the governmental activities column in the Statement of Net Position greater than zero? (If the school district's change of students in membership over 5 years was 10 percent or more, then the school district passes this indicator.)
3/28/2017 11:08:51 AM
Yes
6 Was the number of days of cash on hand and current investments in the general fund for the school district sufficient to cover operating expenditures (excluding facilities acquisition and construction)? (See ranges below.)
3/28/2017 11:08:51 AM
10
7 Was the measure of current assets to current liabilities ratio for the school district sufficient to cover short-term debt? (See ranges below.)
3/28/2017 11:08:51 AM
10
8 Was the ratio of long-term liabilities to total assets for the school district sufficient to support long-term solvency? (If the school district’s change of students in membership over 5 years was 10 percent or more, then the school district passes this indicator.) (See ranges below.)
3/28/2017 11:08:52 AM
8
9 Did the school district’s general fund revenues equal or exceed expenditures (excluding facilities acquisition and construction)? If not, was the school district’s number of days of cash on hand greater than or equal to 60 days?
3/28/2017 11:08:52 AM
10
10 Was the debt service coverage ratio sufficient to meet the required debt service? (See ranges below.)
5/18/2017 12:17:25 PM
10
11 Was the school district’s administrative cost ratio equal to or less than the threshold ratio? (See ranges below.)
3/28/2017 11:08:53 AM
10
12 Did the school district not have a 15 percent decline in the students to staff ratio over 3 years (total enrollment to total staff)? (If the student enrollment did not decrease, the school
6/21/2017 8:12:31 PM
10

6
district will automatically pass this indicator.)
13 Did the comparison of Public Education Information Management System (PEIMS) data to like information in the school district’s AFR result in a total variance of less than 3 percent of all expenditures by function?
3/28/2017 11:08:54 AM
10
14 Did the external independent auditor indicate the AFR was free of any instance(s) of material noncompliance for grants, contracts, and laws related to local, state, or federal funds? (The AICPA defines material noncompliance.)
3/28/2017 11:08:54 AM
10
15 Did the school district not receive an adjusted repayment schedule for more than one fiscal year for an over allocation of Foundation School Program (FSP) funds as a result of a financial hardship?
3/28/2017 11:08:54 AM
10
98 Score
DETERMINATION OF RATING A. Did the district answer 'No' to Indicators 1, 3, 4, 5, or 2.A? If so, the school district's
rating is F for Substandard Achievement regardless of points earned.
B. Determine the rating by the applicable number of points. (Indicators 6-15)
A = Superior 90-100
B = Above Standard 80-89
C = Meets Standard 60-79
F = Substandard Achievement <60
RATING
SUPERIOR ACHIEVEMENT

7
Overview of the Worksheet
Indicator # 1 – Was the complete annual financial report (AFR) and data submitted to the TEA within 30 days of the November 27 or January 28 deadline depending on the school district’s fiscal year end date of June 30 or August 31, respectively? Brazosport ISD’s Annual Financial Report for the fiscal year ended August 31, 2016 was filed with the Texas Education Agency before the deadline date in January 2017. Indicator # 2A – Was there an unmodified opinion in the AFR on the financial statements as a whole? (The American Institute of Certified Public Accountants (AICPA) defines unmodified opinion. The external independent auditor determines if there was an unmodified opinion.) The opinion expressed by Brazosport ISD’s independent auditor on the August 31, 2016 Annual Financial Report was unmodified which means it is a clean audit. A “modification” on our financial report would have meant that corrections were needed in reporting of financial controls. Indicator # 2B – Did the external independent auditor report that the AFR was free of any instance(s) of material weaknesses in internal controls over financial reporting and compliance for local, state, or federal funds? (The AICPA defines material weakness.) Brazosport ISD’s external auditors reported no weaknesses in internal controls. Indicator # 3 – Was the school district in compliance with the payment terms of all debt agreements at fiscal year end? (If the school district was in default in a prior fiscal year, an exemption applies in following years if the school district is current on its forbearance or payment plan with the lender and the payments are made on schedule for the fiscal year being rated. Also exempted are technical defaults that are not related to monetary defaults. A technical default is a failure to uphold the terms of a debt covenant, contract, or master promissory note even though payments to the lender, trust, or sinking fund are current. A debt agreement is a legal agreement between a debtor (= person, company, etc. that owes money) and their creditors, which includes a plan for paying back the debt.) This indicator seeks to make certain that the District has paid its bills/obligations on debt obligations issued to pay for school construction and the like. Brazosport ISD has had no instances of default on bonded indebtedness obligations. Indicator # 4 – Did the school district make timely payments to the Teachers Retirement System (TRS), Texas Workforce Commission (TWC), Internal Revenue Service (IRS), and other government agencies? This indicator simply asks, “Did the District meet the various timelines for payments to various governmental agencies?”
8
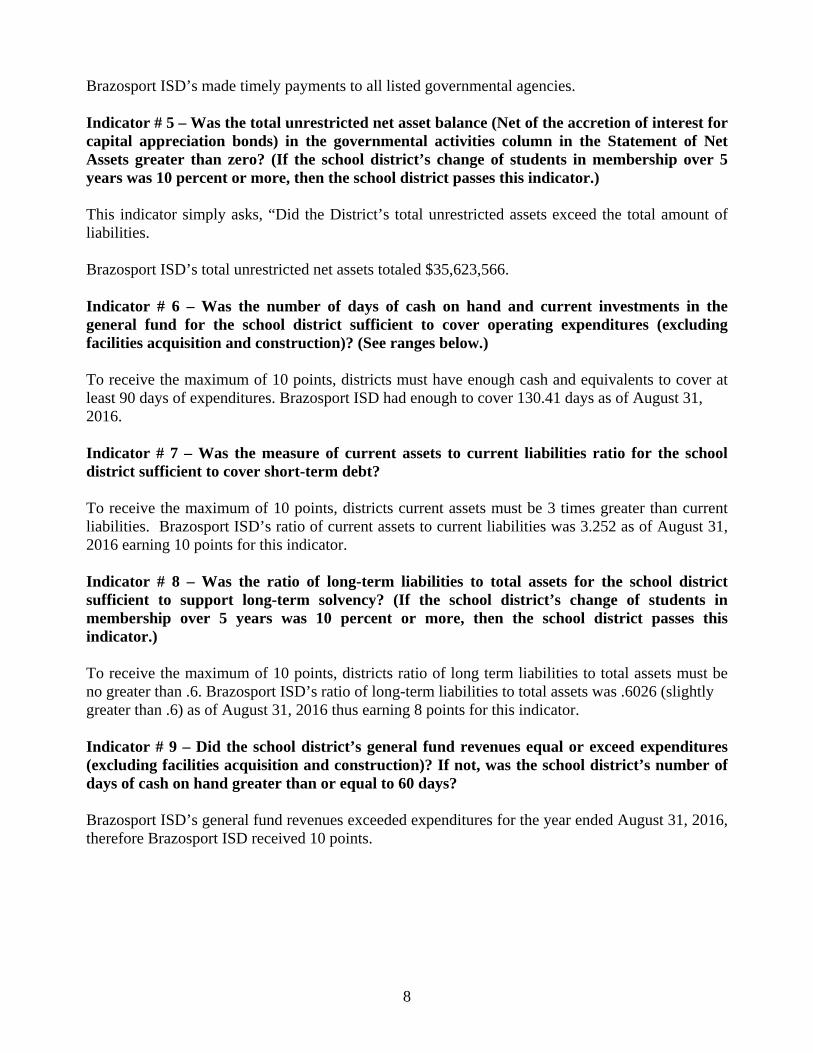
Brazosport ISD’s made timely payments to all listed governmental agencies. Indicator # 5 – Was the total unrestricted net asset balance (Net of the accretion of interest for capital appreciation bonds) in the governmental activities column in the Statement of Net Assets greater than zero? (If the school district’s change of students in membership over 5 years was 10 percent or more, then the school district passes this indicator.) This indicator simply asks, “Did the District’s total unrestricted assets exceed the total amount of liabilities. Brazosport ISD’s total unrestricted net assets totaled $35,623,566. Indicator # 6 – Was the number of days of cash on hand and current investments in the general fund for the school district sufficient to cover operating expenditures (excluding facilities acquisition and construction)? (See ranges below.) To receive the maximum of 10 points, districts must have enough cash and equivalents to cover at least 90 days of expenditures. Brazosport ISD had enough to cover 130.41 days as of August 31, 2016. Indicator # 7 – Was the measure of current assets to current liabilities ratio for the school district sufficient to cover short-term debt? To receive the maximum of 10 points, districts current assets must be 3 times greater than current liabilities. Brazosport ISD’s ratio of current assets to current liabilities was 3.252 as of August 31, 2016 earning 10 points for this indicator. Indicator # 8 – Was the ratio of long-term liabilities to total assets for the school district sufficient to support long-term solvency? (If the school district’s change of students in membership over 5 years was 10 percent or more, then the school district passes this indicator.) To receive the maximum of 10 points, districts ratio of long term liabilities to total assets must be no greater than .6. Brazosport ISD’s ratio of long-term liabilities to total assets was .6026 (slightly greater than .6) as of August 31, 2016 thus earning 8 points for this indicator. Indicator # 9 – Did the school district’s general fund revenues equal or exceed expenditures (excluding facilities acquisition and construction)? If not, was the school district’s number of days of cash on hand greater than or equal to 60 days? Brazosport ISD’s general fund revenues exceeded expenditures for the year ended August 31, 2016, therefore Brazosport ISD received 10 points.

9
Indicator # 10 – Was the debt service coverage ratio sufficient to meet the required debt service? This indicator looks at financial components to ensure the combination of revenues and fund balance is adequate to cover bond payments. The District’s debt service ratio was 2.4115 easily exceeding the 1.2 required to earn 10 points for this indicator. Indicator # 11 – Was the school district’s administrative cost ratio equal to or less than the threshold ratio? TEA and state law sets a cap on the percentage of their budget that Texas school districts can spend on administration based on district size. For districts in Brazosport ISD size category, the administrative cost ratio should fall below 8.55 percent. Brazosport’s ratio for the 2015-2016 school year was 7.45 percent, well below the state cap. Brazosport ISD earned 10 out of 10 points on this indicator. Indicator # 12 – Did the school district not have a 15 percent decline in the students to staff ratio over 3 years (total enrollment to total staff)? (If the student enrollment did not decrease, the school district will automatically pass this indicator.) Enrollment dropped from 12,389 in 2013-14 to 12,342 in 2015-16. Total number of staff grew from 1,520 to 1,604 over the same period. District received 10 points. Indicator # 13 – Did the comparison of Public Education Information Management System (PEIMS) data to like information in the school district’s AFR result in a total variance of less than 3 percent of all expenditures by function? This indicator measures the quality of data reported to TEA through the Public Education Information Management System (PEIMS) and in the Annual Financial Report to make certain that the data reported in each case “matches up”. If the difference in numbers reported in any fund type is more than 3 percent, the district “fails” this measure. Brazosport ISD’s data quality measure was only .000134891%, which fell well below the allowable 3% variation. Indicator # 14 – Did the external independent auditor report that the AFR was free of any instance(s) of material noncompliance for grants, contracts, and laws related to local, state, or federal funds? (The AICPA defines material weakness.) Brazosport ISD’s external auditors reported no material noncompliance. Indicator # 15 – Did the school district not receive an adjusted repayment schedule for more than one fiscal year for an over allocation of Foundation School Program (FSP) funds as a result of a financial hardship? Brazosport ISD did not receive an adjusted repayment schedule from TEA.
10
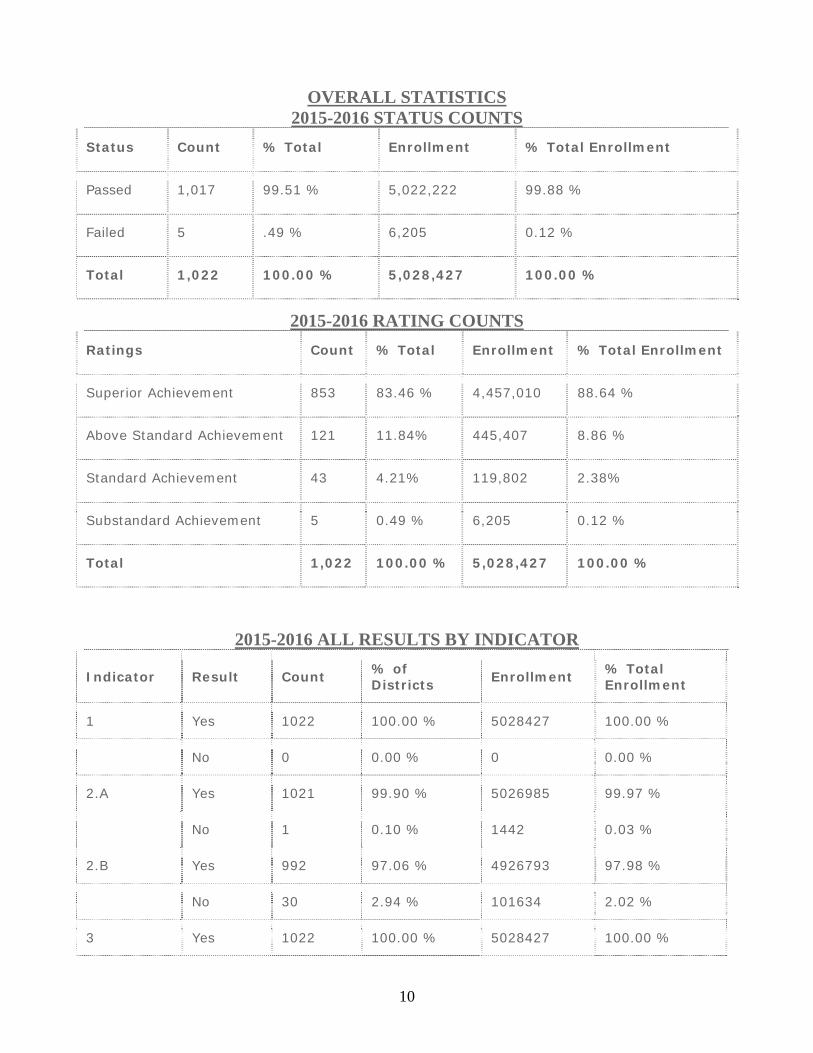
OVERALL STATISTICS 2015-2016 STATUS COUNTS
Status Count % Total Enrollment % Total Enrollment
Passed 1,017 99.51 % 5,022,222 99.88 %
Failed 5 .49 % 6,205 0.12 %
Total 1,022 100.00 % 5,028,427 100.00 %
2015-2016 RATING COUNTS Ratings Count % Total Enrollment % Total Enrollment
Superior Achievement 853 83.46 % 4,457,010 88.64 %
Above Standard Achievement 121 11.84% 445,407 8.86 %
Standard Achievement 43 4.21% 119,802 2.38%
Substandard Achievement 5 0.49 % 6,205 0.12 %
Total 1,022 100.00 % 5,028,427 100.00 %
2015-2016 ALL RESULTS BY INDICATOR
Indicator Result Count % of Districts Enrollment % Total
Enrollment
1 Yes 1022 100.00 % 5028427 100.00 %
No 0 0.00 % 0 0.00 %
2.A Yes 1021 99.90 % 5026985 99.97 %
No 1 0.10 % 1442 0.03 %
2.B Yes 992 97.06 % 4926793 97.98 %
No 30 2.94 % 101634 2.02 %
3 Yes 1022 100.00 % 5028427 100.00 %

11
No 0 0.00 % 0 0.00 %
4 Yes 1021 99.90 % 5027891 99.99 %
No 1 0.10 % 536 0.01 %
5 Yes 1021 99.90 % 5026365 99.96 %
No 1 0.10 % 2062 0.04 %
6 10 824 80.63 % 3860878 76.78 %
8 67 6.56 % 514904 10.24 %
6 52 5.09 % 274170 5.45 %
4 37 3.62 % 183137 3.64 %
2 25 2.45 % 104333 2.07 %
0 17 1.66 % 91005 1.81 %
7 10 840 82.19 % 3602756 71.65 %
8 79 7.73 % 686833 13.66 %
6 62 6.07 % 399088 7.94 %
4 32 3.13 % 333304 6.63 %
2 9 0.88 % 6446 0.13 %
8 10 887 86.79 % 3748025 74.54 %
8 78 7.63 % 502002 9.98 %
6 37 3.62 % 516875 10.28 %
4 13 1.27 % 216040 4.30 %
2 4 0.39 % 17645 0.35 %
0 3 0.29 % 27840 0.55 %
9 10 985 96.38 % 4914101 97.73 %
0 37 3.62 % 114326 2.27 %

12
10 10 808 79.06 % 4177927 83.09 %
8 25 2.45 % 80261 1.60 %
6 20 1.96 % 83975 1.67 %
4 13 1.27 % 81764 1.63 %
2 17 1.66 % 89944 1.79 %
0 139 13.60 % 514556 10.23 %
11 10 826 80.82 % 4327916 86.07 %
8 132 12.92 % 603272 12.00 %
6 31 3.03 % 76653 1.52 %
4 20 1.96 % 17346 0.34 %
2 4 0.39 % 1579 0.03 %
0 9 0.88 % 1661 0.03 %
12 10 997 97.55 % 5015235 99.74 %
0 25 2.45 % 13192 0.26 %
13 10 1017 99.51 % 5025539 99.94 %
0 5 0.49 % 2888 0.06 %
14 10 987 96.58 % 4942392 98.29 %
0 35 3.42 % 86035 1.71 %
15 10 1022 100.00 % 5028427 100.00 %
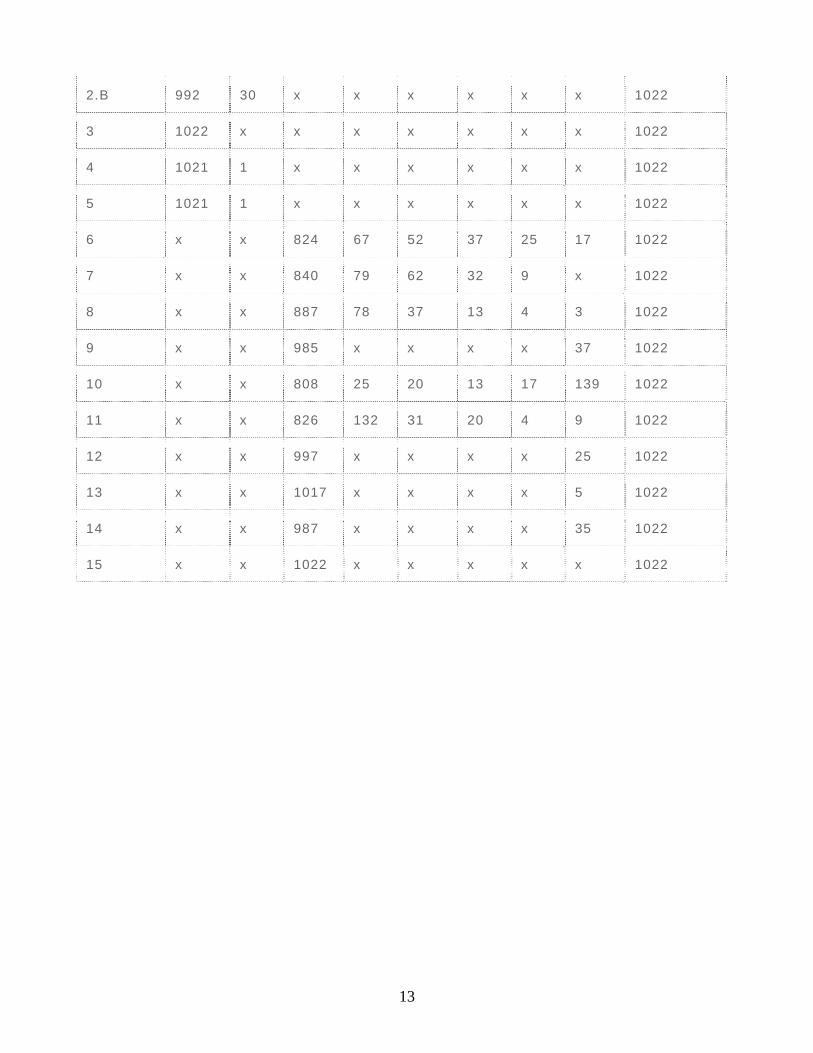
2011-2012 ANSWERS BY INDICATOR
Indicator Yes No 10 8 6 4 2 0 Total
1 1022 x x x x x x x 1022
2.A 1021 1 x x x x x x 1022
13
2.B 992 30 x x x x x x 1022
3 1022 x x x x x x x 1022
4 1021 1 x x x x x x 1022
5 1021 1 x x x x x x 1022
6 x x 824 67 52 37 25 17 1022
7 x x 840 79 62 32 9 x 10²²
8 x x 887 78 37 13 4 3 1022
9 x x 985 x x x x 37 1022
10 x x 808 25 20 13 17 139 1022
11 x x 826 132 31 20 4 9 1022
12 x x 997 x x x x 25 1022
13 x x 1017 x x x x 5 1022
14 x x 987 x x x x 35 1022
15 x x 1022 x x x x x 1022

14
Required
Reports By
TEA