Biosolids snapshot - Department of the · Web viewSEWPACBiosolids SNAPSHOT improving our...
70
BIOSOLIDS SNAPSHOT
Transcript of Biosolids snapshot - Department of the · Web viewSEWPACBiosolids SNAPSHOT improving our...

BIOSOLIDS SNAPSHOT
Department of Sustainability, Environment, Water, Population and Communities
June 2012

SEWPAC BIOSOLIDS SNAPSHOT
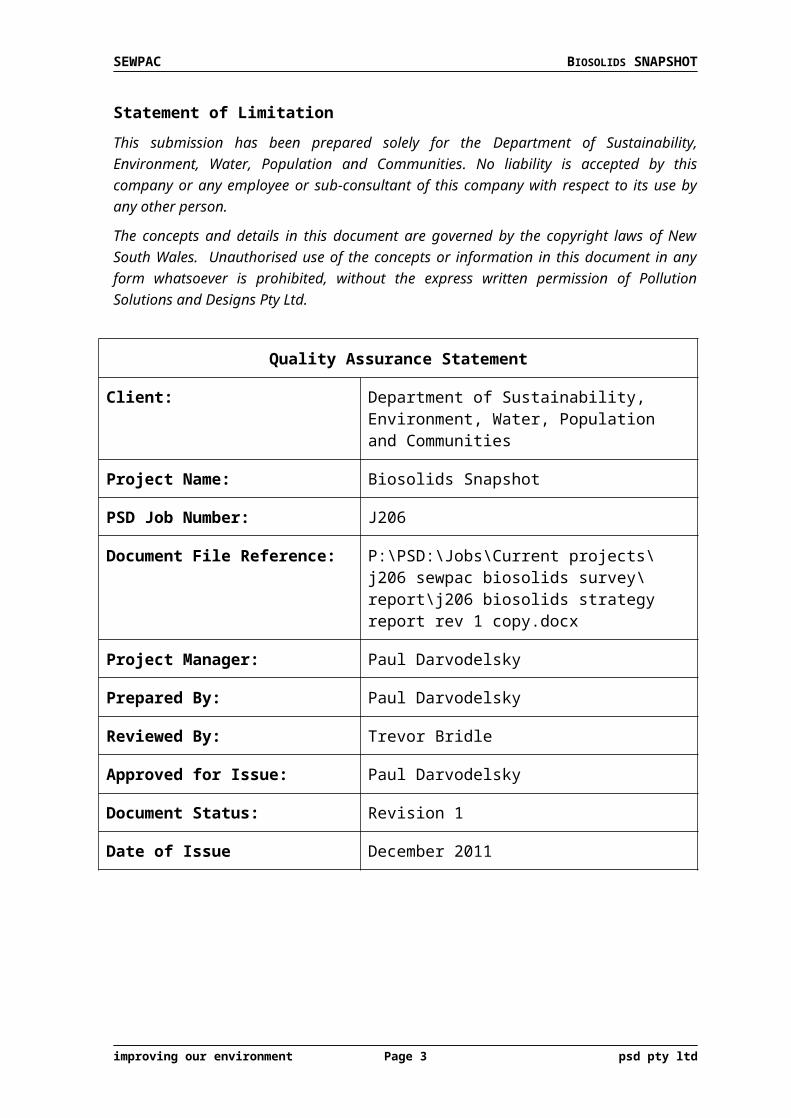
Statement of Limitation
This submission has been prepared solely for the Department of Sustainability, Environment, Water, Population and Communities. No liability is accepted by this company or any employee or sub-consultant of this company with respect to its use by any other person.
The concepts and details in this document are governed by the copyright laws of New South Wales. Unauthorised use of the concepts or information in this document in any form whatsoever is prohibited, without the express written permission of Pollution Solutions and Designs Pty Ltd.
Quality Assurance Statement
Client: Department of Sustainability, Environment, Water, Population and Communities
Project Name: Biosolids Snapshot
PSD Job Number: J206
Document File Reference: P:\PSD:\Jobs\Current projects\j206 sewpac biosolids survey\report\j206 biosolids strategy report rev 1 copy.docx
Project Manager: Paul Darvodelsky
Prepared By: Paul Darvodelsky
Reviewed By: Trevor Bridle
Approved for Issue: Paul Darvodelsky
Document Status: Revision 1
Date of Issue December 2011
Paul Darvodelsky
10 December 2011
improving our environment Page 2 psd pty ltd
SEWPAC BIOSOLIDS SNAPSHOT
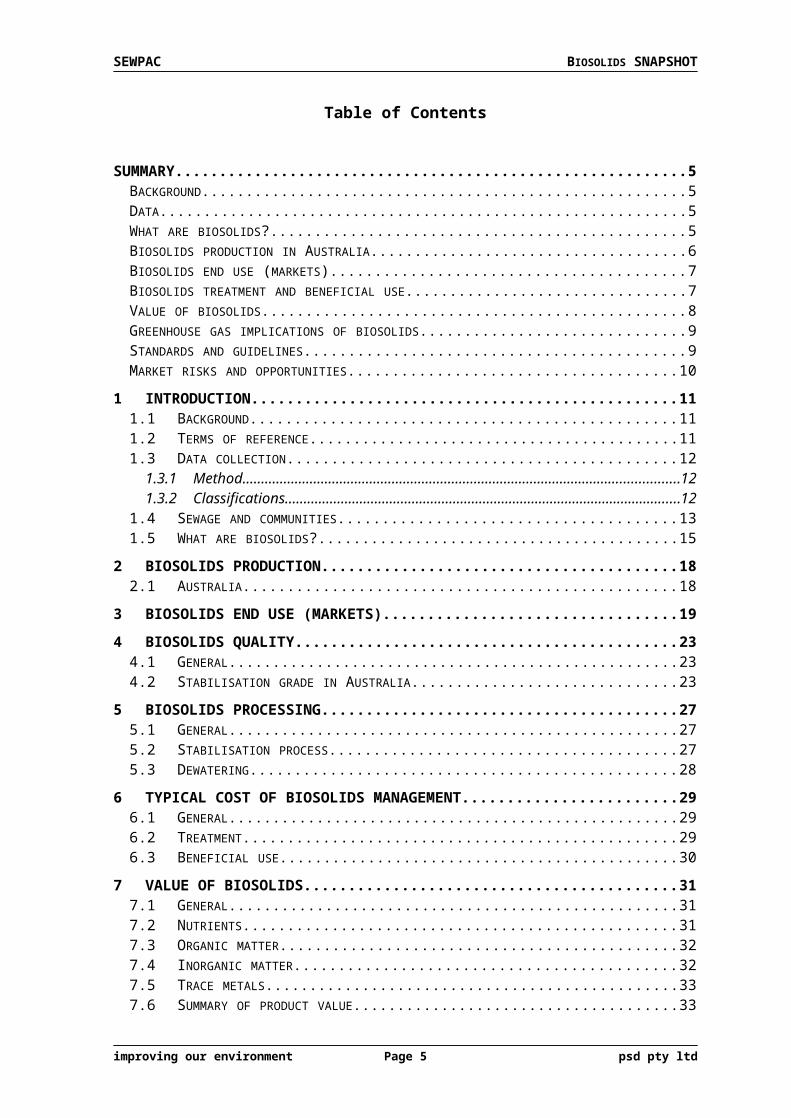
Table of Contents
SUMMARY.................................................................................................................................................... 5BACKGROUND................................................................................................................................................................. 5DATA................................................................................................................................................................................ 5WHAT ARE BIOSOLIDS?.................................................................................................................................................5BIOSOLIDS PRODUCTION IN AUSTRALIA....................................................................................................................6BIOSOLIDS END USE (MARKETS).................................................................................................................................7BIOSOLIDS TREATMENT AND BENEFICIAL USE.........................................................................................................7VALUE OF BIOSOLIDS.....................................................................................................................................................8GREENHOUSE GAS IMPLICATIONS OF BIOSOLIDS......................................................................................................9STANDARDS AND GUIDELINES......................................................................................................................................9MARKET RISKS AND OPPORTUNITIES......................................................................................................................10
1 INTRODUCTION............................................................................................................................. 111.1 BACKGROUND.............................................................................................................................................. 111.2 TERMS OF REFERENCE...............................................................................................................................111.3 DATA COLLECTION......................................................................................................................................12
1.3.1 Method....................................................................................................................................................... 121.3.2 Classifications......................................................................................................................................... 12
1.4 SEWAGE AND COMMUNITIES.....................................................................................................................131.5 WHAT ARE BIOSOLIDS?..............................................................................................................................15
2 BIOSOLIDS PRODUCTION........................................................................................................... 182.1 AUSTRALIA...................................................................................................................................................18
3 BIOSOLIDS END USE (MARKETS).............................................................................................19
4 BIOSOLIDS QUALITY.................................................................................................................... 234.1 GENERAL.......................................................................................................................................................234.2 STABILISATION GRADE IN AUSTRALIA.....................................................................................................23
5 BIOSOLIDS PROCESSING............................................................................................................. 275.1 GENERAL.......................................................................................................................................................275.2 STABILISATION PROCESS............................................................................................................................275.3 DEWATERING...............................................................................................................................................28
6 TYPICAL COST OF BIOSOLIDS MANAGEMENT.....................................................................296.1 GENERAL.......................................................................................................................................................296.2 TREATMENT.................................................................................................................................................296.3 BENEFICIAL USE..........................................................................................................................................30
7 VALUE OF BIOSOLIDS................................................................................................................... 317.1 GENERAL.......................................................................................................................................................317.2 NUTRIENTS...................................................................................................................................................317.3 ORGANIC MATTER.......................................................................................................................................327.4 INORGANIC MATTER....................................................................................................................................327.5 TRACE METALS............................................................................................................................................337.6 SUMMARY OF PRODUCT VALUE.................................................................................................................33
8 BIOSOLIDS MARKETS................................................................................................................... 358.1 GENERAL.......................................................................................................................................................358.2 AGRICULTURE, LANDSCAPING AND MINOR HORTICULTURE.................................................................358.3 SITE REHABILITATION, FORESTRY............................................................................................................368.4 CEMENT PRODUCTION, BRICK MAKING, FUEL.........................................................................................368.5 SOIL REHABILITATION, CARBON SEQUESTRATION.................................................................................37
improving our environment Page 3 psd pty ltd

SEWPAC BIOSOLIDS SNAPSHOT
9 GREENHOUSE GAS IMPLICATIONS OF BIOSOLIDS..............................................................389.1 GENERAL.......................................................................................................................................................389.2 ELECTRICITY PRODUCTION........................................................................................................................389.3 REPLACEMENT OF INORGANIC FERTILISERS...........................................................................................38
10 STANDARDS AND GUIDELINES APPLYING TO BIOSOLIDS...............................................3910.1 GENERAL.......................................................................................................................................................3910.2 BIOSOLIDS GUIDELINES..............................................................................................................................4010.3 REGULATED COMPOUNDS..........................................................................................................................4010.4 AUSTRALIAN STANDARDS, BEST PRACTICE AND SPECIFICATIONS.....................................................4110.5 REGULATORY TRENDS................................................................................................................................42
11 MARKET BARRIERS/RISKS AND OPPORTUNITIES............................................................4511.1 MARKET BARRIERS/RISKS.........................................................................................................................45
11.1.1 Biosolids health and environment risks.................................................................................4511.1.2 Odour nuisance................................................................................................................................ 4611.1.3 Public perception............................................................................................................................. 4611.1.4 Distance to markets....................................................................................................................... 4611.1.5 Regulatory framework.................................................................................................................. 4711.1.6 Policy framework............................................................................................................................ 4711.1.7 Biosolids appearance..................................................................................................................... 48
11.2 MARKET OPPORTUNITIES..........................................................................................................................4811.2.1 Environmental and economic value........................................................................................4811.2.2 Reduction in carbon emissions..................................................................................................4811.2.3 Reduced reliance on non renewable resources..................................................................48
12 REFERENCES................................................................................................................................... 49
improving our environment Page 4 psd pty ltd
SEWPAC BIOSOLIDS SNAPSHOT
SUMMARY
BACKGROUND
This report was funded by the Department of Sustainability, Environment, Water, Population and Communities and is intended to provide a snapshot of biosolids in Australia. It collates and assesses data and information on biosolid from public sources, and water utilities and information available from the Australian and New Zealand Biosolids Partnership.
Biosolids have been identified as an issue of possible interest for several National Waste Policy strategies, including strategy 5 (markets and standards), 9 (greenhouse), 10 commercial and industrial waste) and 16 (waste and recycling data and reporting) and to several Environment Protection and Heritage Council (EPHC) working groups set up to implement the strategies. This report provides a common data set and evidence base to inform this work.
DATA
The Australian and New Zealand Biosolids Partnership (ANZBP) commissioned a national survey in 2010 to identify the main features of biosolids management. This survey catalogued the following primary parameters:
Biosolids production; Biosolids end use; Biosolids stabilisation grade; Biosolids primary stabilisation process; Biosolids dewatering process.
The results of this survey are used as the basis of this report and are presented on a national and state basis. The survey report can be found at www.biosolids.com.au.
The approach used to determine the biosolids production in Australia was to survey all plants over 25,000 people or 5 ML/day. This criterion captures around about 80% of Australia’s population. In the course of the survey many water utilities provided information on plants smaller than this threshold and where they did, the data was included.
WHAT ARE BIOSOLIDS?Sewage sludge is a by-product of treating wastewater, coming from humans and industry. When treated to a standard acceptable for beneficial use sewage sludge is referred to as biosolids. Biosolids are treated in a way to reduce or eliminate health risks and improve beneficial characteristics. Biosolids are highly treated and bear little resemblance to what is flushed down the sewer.
Biosolids are mainly a mix of water and organic matter that are a by-product of the sewage treatment processes. Most wastewater comes from household, kitchens, laundries and bathrooms. Biosolids may contain:
Macronutrients, such as nitrogen, phosphorus, potassium and sulphur; and Micronutrients, such as copper, zinc, calcium, magnesium, iron, boron,
molybdenum and manganese.
improving our environment Page 5 psd pty ltd

Biosolids may also contain traces of synthetic organic compounds and metals, including arsenic, cadmium, chromium, lead, mercury, nickel and selenium. These trace compounds can limit the uses for biosolids, with all potential uses regulated by appropriate government authorities in each region. Australia has one of the strictest regulatory regimes for biosolids use in the world and the New Zealand Guidelines are similarly stringent.
Human waste may contain pathogenic micro-organisms which can cause illness. These pathogens are present in the sewage as it comes to the treatment plant. Through the treatment plant the pathogens are killed or reduced, depending on the desired end use for the recycled water or biosolids. Biosolids are always treated to reduce the pathogens to levels which are not harmful when used in accordance with the various guidelines.
BIOSOLIDS PRODUCTION IN AUSTRALIA
The total biosolids production in Australia identified in the survey is about 300,000 tonnes per year of dry solids. The average solids content of biosolids are 20-25% and this equates to around 1.2–1.5 million tonnes of biosolids in dewatered form (also called wet biosolids).
A breakdown by state of biosolids production in dry tonnes is given in the chart below.

BIOSOLIDS END USE (MARKETS)Biosolids end use nationally and for each state is presented in the charts below.
Overall, around two thirds of all biosolids produced in Australia is applied to the land as a fertiliser, soil conditioner or soil replacement product. Application to agricultural land is by far the largest end use in Australia, followed by use in composted products.
BIOSOLIDS TREATMENT AND BENEFICIAL USE
Biosolids management can be separated into two main categories, treatment and beneficial use. These categories can be further broken down into the following main steps:
1. Treatmenta. dewateringb. stabilisationc. storage (at treatment plant)
2. Beneficial usea. transportb. storage (on farm)c. land application
The cost of each step in the biosolids management process varies significantly from treatment plant to treatment plant. In general the breakdown between treatment and beneficial use for the two most common approaches to sewage treatment in Australia are shown in the table below as a proportion of the total cost of sewage treatment.
Cost of biosolids managementType of sewage treatment process Cost of biosolids management
Primary 70-90%
Secondary 30-60%
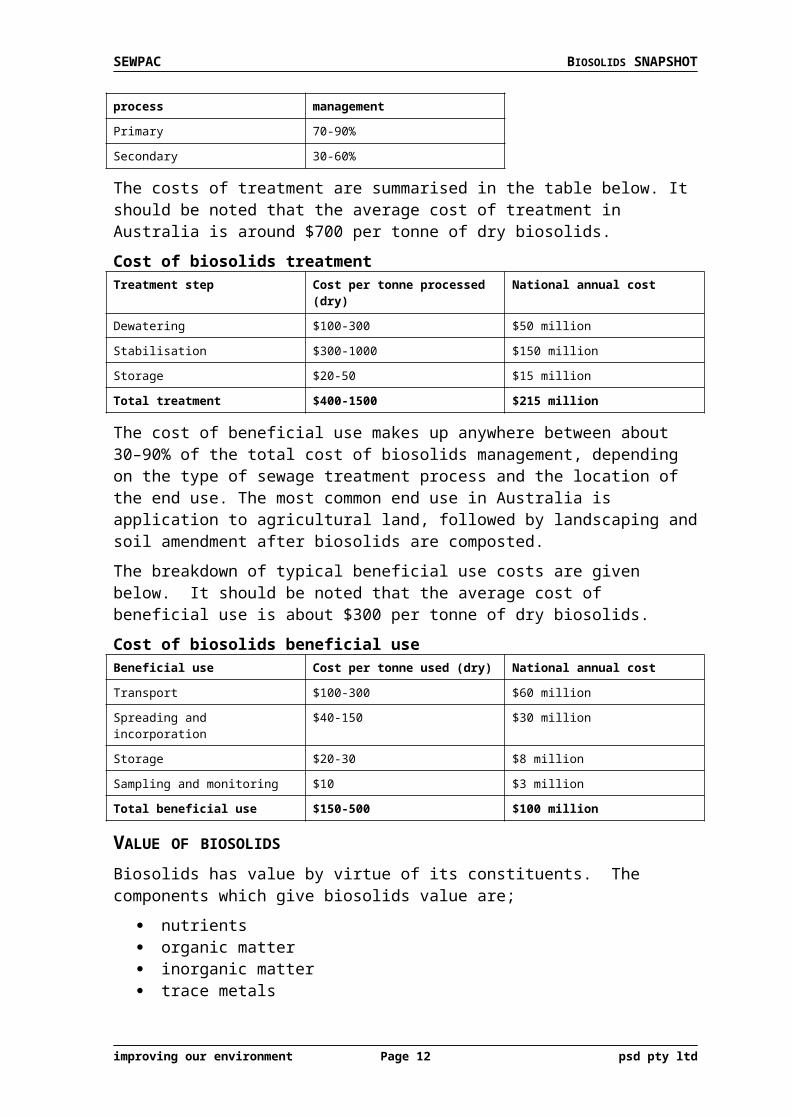
The costs of treatment are summarised in the table below. It should be noted that the average cost of treatment in Australia is around $700 per tonne of dry biosolids.

SEWPAC BIOSOLIDS SNAPSHOT
Cost of biosolids treatmentTreatment step Cost per tonne processed (dry) National annual cost
Dewatering $100-300 $50 million
Stabilisation $300-1000 $150 million
Storage $20-50 $15 million
Total treatment $400-1500 $215 million
The cost of beneficial use makes up anywhere between about 30–90% of the total cost of biosolids management, depending on the type of sewage treatment process and the location of the end use. The most common end use in Australia is application to agricultural land, followed by landscaping and soil amendment after biosolids are composted.
The breakdown of typical beneficial use costs are given below. It should be noted that the average cost of beneficial use is about $300 per tonne of dry biosolids.
Cost of biosolids beneficial useBeneficial use Cost per tonne used (dry) National annual cost
Transport $100-300 $60 million
Spreading and incorporation $40-150 $30 million
Storage $20-30 $8 million
Sampling and monitoring $10 $3 million
Total beneficial use $150-500 $100 million
VALUE OF BIOSOLIDS
Biosolids has value by virtue of its constituents. The components which give biosolids value are;
nutrients organic matter inorganic matter trace metals
The current and future value of biosolids based on the key value characteristics are summarised in below. This shows that the likely value of biosolids will likely increase significantly over the next 10–20 years if Australia produces products which meet the market needs.
It is essential however that the cost of producing higher value products is assessed as this may exceed the benefits gained. It is also critical to establish a market based approach for products which are potentially of higher value.
improving our environment Page 8 psd pty ltd

SEWPAC BIOSOLIDS SNAPSHOT
Table 10 – Summary of product value
Characteristic DescriptionCurrent value $/tonne
Future value $/tonne
Value based on
Macro-nutrients Nitrogen and phosphorus 40-1401 120-4002 Phosphorus content
Organic matter Volatile solids 100-1503 210-3004
Electricity generated relative to coal, plus the value of RECs
Inorganic matter Non volatile solids 2-45 5-106 Clay replacement
Micro-nutrients Copper and zinc 137 Not estimated Copper and zinc
GREENHOUSE GAS IMPLICATIONS OF BIOSOLIDS
Biosolids can reduce greenhouse gas emissions in two ways:
generation of green power through direct combustion or anaerobic digestion; offset of emissions associated with production of inorganic fertilisers.
Anaerobic digestions processes typically generate a net energy output of 300–700 kWhr per tonne of dry biosolids processed. This equates to around 0.3 to 0.7 tonnes of carbon dioxide equivalent (CO2e) for every tonne of biosolids processed when replacing coal fired power generation.
If biosolids are dried to 90% this will give a net energy output of about 600–900 kWhr per tonne of dry biosolids which equates to around 0.6-0.9 tonnes of CO2e for every tonne of biosolids processed when replacing coal fired power generation. It should be noted that a significant amount of energy is required to process biosolids to 90% solids content.
When biosolids are used to replace inorganic fertilisers they reduce the emissions associated with the production of the inorganic fertilisers. If the biosolids are diverted from landfill disposal further emissions are avoided.
Studies by PSD on the emissions avoided by the use of biosolids show that for every tonne of dry biosolids used around 6 tonnes of CO2e are avoided from the production of the inorganic fertilisers.
If all biosolids in Australia were used to replace inorganic fertilisers this would give a reduction of around 2 million tonnes per year of CO2e.
It is possible to both generate energy from biosolids through anaerobic digestion processes and have a final biosolids product which can be used as a fertiliser.
STANDARDS AND GUIDELINES
In Australia biosolids are regulated under a specific statutory framework in each State. Generally the key piece of legislation is the State’s head environment protection Act. These Acts require that any discharge to the environment must be managed so that they do not adversely affect the receiving environment. These Acts also generally describe the key principles of environment management and the waste hierarchy, with waste avoidance and recycling the preferred management option compared to disposal.
There are no Australian Standards applying to biosolids use, however the Australian Standard AS 4454 (2003) for Composts, Soil Conditioners and Mulches references the biosolids guidelines.
There are no best practice manuals or specifications relating to biosolids.
improving our environment Page 9 psd pty ltd

SEWPAC BIOSOLIDS SNAPSHOT
Regulation of biosolids in Australia is well established and has functioned successfully for around 15 years. In this regard there is not any major impetus from industry or the regulators to change the current guidelines, however WA and SA are in the process of updating their guidelines and NSW and Victoria have expressed the desire to do the same.
The compost industry is strongly opposed to the application of biosolids guidelines to compost. Composted products become significantly more restricted if biosolids guidelines are applied to them.
The Australian and New Zealand Biosolids Partnership recently undertook a major review of biosolids regulations in Australia and the overarching outcome was that whilst there was no perceived need to change the existing guidelines to protect human health and the environment there would be significant benefit to the industry if guidelines were consistent across Australia.
With respect to the NWQMS Guideline #13 (ARMCANZ 2004), generally referred to as the National Biosolids Guidelines, the Partnership’s review made no specific recommendations. This was largely due to the nature of biosolids regulation in Australia, i.e. biosolids are regulated on a State-basis and therefore the National Biosolids Guidelines are generally not used.
MARKET RISKS AND OPPORTUNITIES
The key risk to biosolids is odour. Odour creates the risk of adverse public impact for biosolids and the existing guidelines do not adequately cover treatment requirements in the current context. The ANZBP has identified the need for improved standards for odour reduction potential for biosolids.
The key market opportunity for biosolids is to recover the value of nutrients, energy and trace metals. Financial recovery rates are low across the industry with biosolids typically given away to farmers. The national value of phosphorus in biosolids is around $30 million per year.
improving our environment Page 10 psd pty ltd

SEWPAC BIOSOLIDS SNAPSHOT
1 INTRODUCTION
1.1 BACKGROUND
The Australian Government Department of Sustainability, Environment, Water, Population and Communities (the Department) develops and implements national policy, programs and legislation to protect and conserve Australia's environment and heritage.
The National Waste Policy: Less waste, more resources (National Waste Policy) agreed to by all Australian environment ministers in November 2009, and endorsed by the Council of Australian Governments, sets Australia's waste management and resource recovery direction to 2020. The policy aims, inter alia, to reduce the amount of waste for disposal and improve the use of waste as a resource to achieve broader environmental, social and economic benefits.
Biosolids have been identified as an issue of possible interest for several working groups under the National Waste Policy. To provide a common data set and evidence base, this report collates and assesses data and information on biosolids. This report presents existing biosolids data and information from public sources, and water utilities and additional information available from the Australian and New Zealand Biosolids Partnership (ANZBP).
This report was funded by the Department and is intended to provide a snapshot of biosolids in Australia to inform the work of several National Waste Policy strategies, including strategy 5 (markets and standards), 9 (greenhouse), 10 (commercial and industrial waste) and 16 (waste and recycling data and reporting).
1.2 TERMS OF REFERENCE
The terms of reference for the project, as set out in the request for quotation from the Department are repeated below.
The development of a short report that collates and assesses data and information on biosolids in Australia. This report will present existing biosolids data and information from public sources, and water utilities and additional information available from the Australian and New Zealand Biosolids Partnership (ANZBP).
The report should cover the following information relating to biosolids:
- volumes (production in dry tonnes per day)
- origins and pathways (including end use)
- composition (including stabilisation grade)
- risks
- current management (dewatering and stabilisation processes)
- mean price of treatment per tonne of dry biosolids
- specifications, best practice guidelines and standards employed
- current markets
- market barriers and opportunities.
improving our environment Page 11 psd pty ltd
SEWPAC BIOSOLIDS SNAPSHOT
1.3 DATA COLLECTION
The Australian and New Zealand Biosolids Partnership commissioned a national survey in 2010 to identify the main features of biosolids management. This survey catalogued the following primary parameters:
Biosolids production; Biosolids end use; Biosolids stabilisation grade; Biosolids primary stabilisation process; Biosolids dewatering process.
The results of this survey are used as the basis of this report and are presented on a national and state basis. The survey report can be found at www.biosolids.com.au.
1.3.1 MethodThe approach used to determine the biosolids production in Australia was to survey all plants over 25,000 people or 5 ML/day. This criterion captures around about 80% of Australia’s population. In the course of the survey many water utilities provided information on plants smaller than this threshold and where they did, the data was included.
All classifications are made on the basis of tonnes of production and do not include management of established stockpiles. That is, the data represents the current annual production of biosolids in Australia and each state.
1.3.2 ClassificationsTo enable relatively simple analysis and presentation of the data each area of information, such as end use, was classified into a number of broad groupings. These groupings are discussed below.
Production
Production is presented in terms of tonnes of dry biosolids.
End use
The following classifications were used for end use:
Agriculture: for biosolids which is applied to land for its fertiliser value without value added processing;
Composting: for biosolids which is processed through a composting facility and used for landscaping or other horticultural use;
Forestry: for biosolids which is applied to plantation forests to aid tree growth;
Landfill: for biosolids which is disposed to landfill;
Sea: for biosolids which is discharged to the ocean;
Stockpile: for biosolids which is stored, pending future planning, processing or use;
Unspecified: for plants which did not respond or for which the end use could not be identified.
improving our environment Page 12 psd pty ltd

SEWPAC BIOSOLIDS SNAPSHOT
Stabilisation grade
Stabilisation grade was classified on the basis of an A, B or C grading. This grading was adopted in light of the broad variation in nomenclature for stabilisation grading across Australia. The equivalent gradings are shown in Table 1 below.
Table 1 – Biosolids stabilisation classifications in AustraliaClassification NSW Vic SA Qld Tas WA NZ
A A T1, T2 A A A P1, P2 A
B B T3 B B B P3 B
C C Unstabilised Unstabilised C C P4 Unstablised
Stabilisation process
Classification of the stabilisation process was made on the basis of the primary stabilisation process following the sewage treatment process. The following stabilisation process categories were used.
Aerobic digestion Air drying Anaerobic digestion Composting (used only for biosolids with no prior stabilisation) Incineration Lagoon (used for biosolids stored in liquid form) Lime stabilisation None Other Stockpile (used for biosolids stored in dewatered form) Unspecified
Dewatering process
Classification of the dewatering process was made on the basis of the following categories:
Belt press Centrifuge Drying bed None Unspecified
1.4 SEWAGE AND COMMUNITIES
Sewage sludge is a by-product of treating wastewater, coming from humans and industry. When treated to a standard acceptable for beneficial use, sewage sludge is referred to as biosolids. In Australia, biosolids are most commonly used as a fertiliser and soil conditioner on agricultural land.
Throughout history people have lived together in groups and communities. As populations around the world increased these communities became larger and larger. All of us in these communities excrete waste; it is fundamental to a healthy life. And this waste must be managed sustainably.
improving our environment Page 13 psd pty ltd

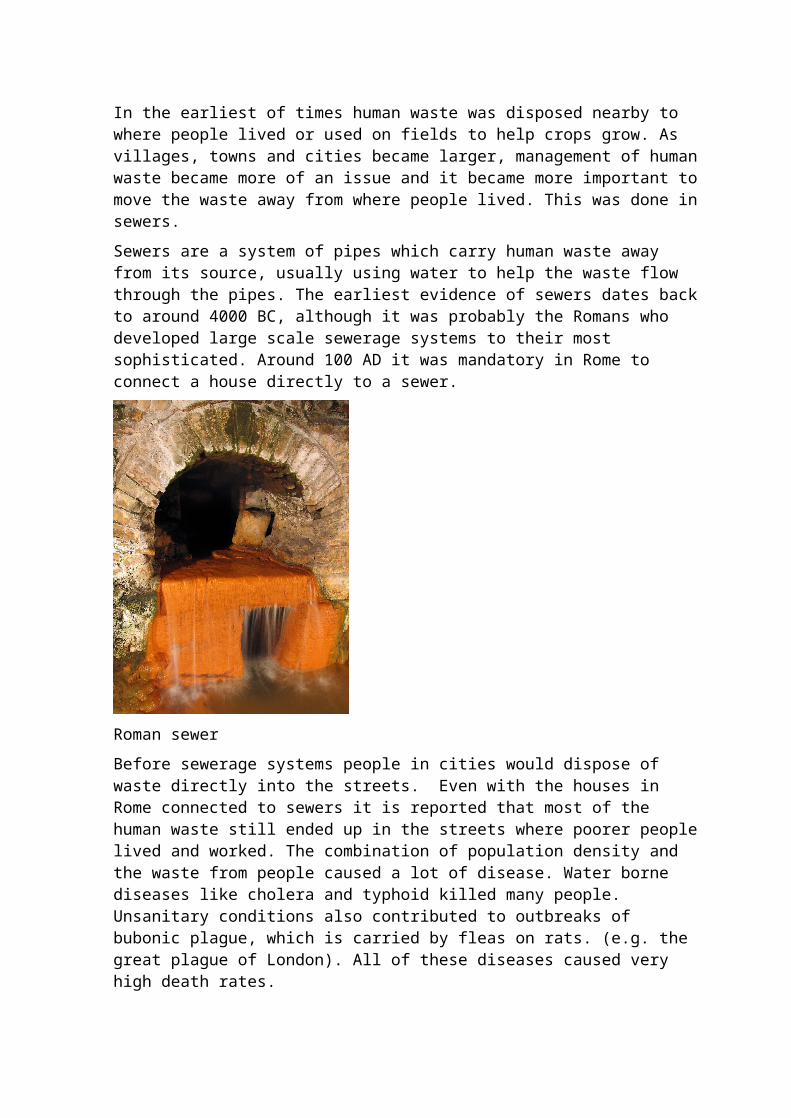
In the earliest of times human waste was disposed nearby to where people lived or used on fields to help crops grow. As villages, towns and cities became larger, management of human waste became more of an issue and it became more important to move the waste away from where people lived. This was done in sewers.
Sewers are a system of pipes which carry human waste away from its source, usually using water to help the waste flow through the pipes. The earliest evidence of sewers dates back to around 4000 BC, although it was probably the Romans who developed large scale sewerage systems to their most sophisticated. Around 100 AD it was mandatory in Rome to connect a house directly to a sewer.
Roman sewer
Before sewerage systems people in cities would dispose of waste directly into the streets. Even with the houses in Rome connected to sewers it is reported that most of the human waste still ended up in the streets where poorer people lived and worked. The combination of population density and the waste from people caused a lot of disease. Water borne diseases like cholera and typhoid killed many people. Unsanitary conditions also contributed to outbreaks of bubonic plague, which is carried by fleas on rats. (e.g. the great plague of London). All of these diseases caused very high death rates.
Sewers were built to improve sanitation and improve aesthetic conditions within houses. Sewers are one of the most important factors in protecting human health in modern communities. Sewers carry human waste away from the community in a safe manner.
Originally our waste carried in the sewers, called sewage, was discharged into rivers or the sea. As populations grew larger this caused an increasing amount of pollution. For example, after the First Fleet arrived in Sydney in 1788 the Tank Stream was used as the main source of water. By 1800, when Sydney had a population of about 5,500 people, the problems with pollution from the surrounding settlement had made the Tank Stream a focus of Governor King. By 1815 the Tank Stream was reported as little more than a sewer and was abandoned not long afterwards as a source of water. Too many people in a small area caused the Tank Stream to become too polluted to use safely.

To fix the pollution problems in the waterways the sewers discharged to, communities started to build sewage treatment plants. Sewage treatment plants use a combination of physical, chemical and biological processes to treat the human waste we send to them. Since the first treatment plants were built in the late 1800’s the standard of treatment has improved dramatically. Today’s sewage treatment plants are highly advanced, producing a recycled water product and a biosolids product.
When the sewage from the community is treated it is ultimately split into two fractions; a liquid portion and a solid portion. The cleaned liquid portion is most commonly either discharged to a river or the sea or used to irrigate parks and gardens or farmland. The solid portion in an untreated form is called sludge and when treated appropriately, is called biosolids.
There are only three alternatives for biosolids use: put them in the sea, use them on the land or put them in the air (burn it). Storage of biosolids can delay the use of one of these alternatives.
It is generally accepted that any discharge to the sea or a waterway is not environmentally desirable. In most cases burning biosolids takes much more energy than you get back, so is expensive and generates unwanted greenhouse gas emissions. In some cases it is possible to get energy from biosolids and in these cases the processes that do this can be found at many of the larger plants around Australia and the world.
The final alternative available for managing biosolids isto apply them to farm land as a fertiliser and soil conditioner. This takes advantage of the nutrients and organic matter in the biosolids and, provided it is done appropriately, gives a sustainable solution for biosolids management. Many countries around the world consider land application to be the most sustainable route and Best Practicable Environmental Option for biosolids management. In Australia about 60% of biosolids are used in this way. In New Zealand almost no biosolids are used on farmland but there is some application to forests and turf farms.
1.5 WHAT ARE BIOSOLIDS?Sewage sludge is a by-product of treating wastewater, coming from humans and industry. When treated to a standard acceptable for beneficial use sewage sludge is referred to as biosolids. Biosolids are treated in a way to reduce or eliminate health risks and improve beneficial characteristics. Biosolids are highly treated and bear little resemblance to what is flushed down the sewer.
Biosolids are mainly a mix of water and organic matter that are a by-product of the sewage treatment processes. Most wastewater comes from household, kitchens, laundries and bathrooms. Biosolids may contain:
Macronutrients, such as nitrogen, phosphorus, potassium and sulphur; and Micronutrients, such as copper, zinc, calcium, magnesium, iron, boron,
molybdenum and manganese.
Biosolids may also contain traces of synthetic organic compounds and metals, including arsenic, cadmium, chromium, lead, mercury, nickel and selenium. These trace compounds can limit the uses for biosolids, with all potential uses regulated by appropriate government authorities in each region. Australia has one of the strictest regulatory regimes for biosolids use in the world and the New Zealand Guidelines are similarly stringent.

SEWPAC BIOSOLIDS SNAPSHOT
Human waste may contains pathogenic micro-organisms which can cause illness. These pathogens are present in the sewage as it comes to the treatment plant. Through the treatment plant the pathogens are killed or reduced, depending on the desired end use for the recycled water or biosolids. Biosolids are always treated to reduce the pathogens to levels which are not harmful when used in accordance with the various guidelines.
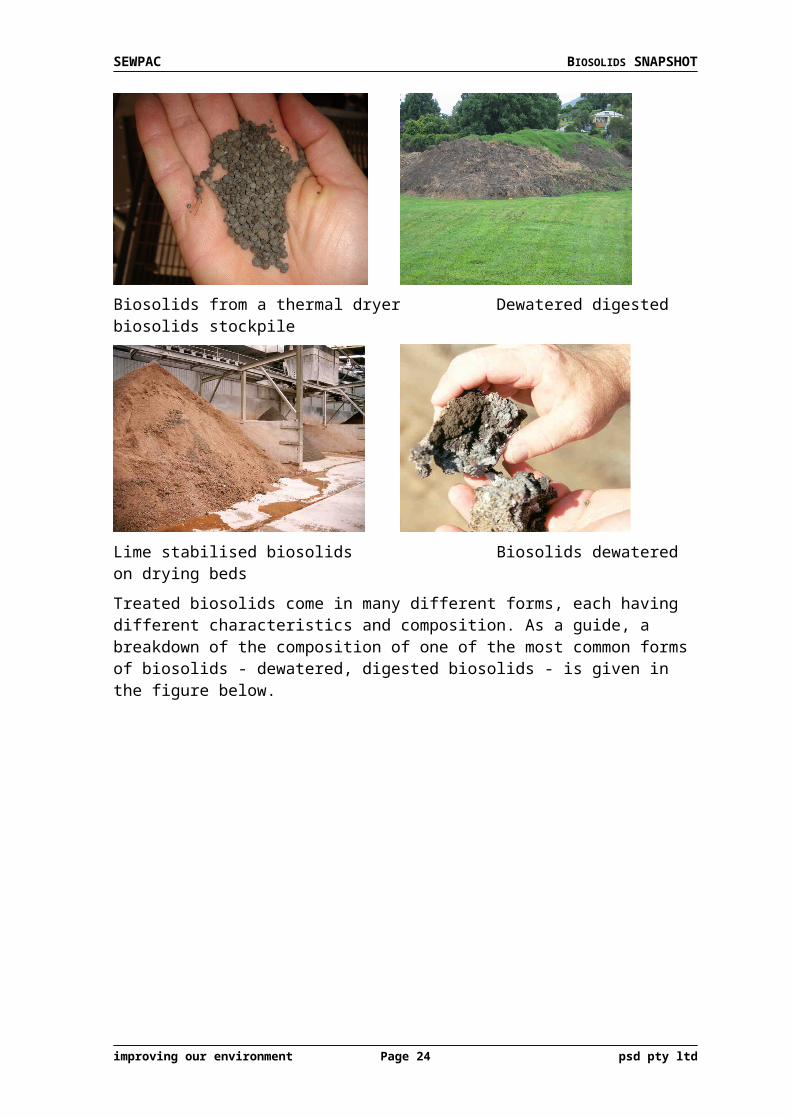
Biosolids from a thermal dryer Dewatered digested biosolids stockpile
Lime stabilised biosolids Biosolids dewatered on drying beds
Treated biosolids come in many different forms, each having different characteristics and composition. As a guide, a breakdown of the composition of one of the most common forms of biosolids - dewatered, digested biosolids - is given in the figure below.
improving our environment Page 16 psd pty ltd

SEWPAC BIOSOLIDS SNAPSHOT
Figure 1 - Typical biosolids breakdown
improving our environment Page 17 psd pty ltd

SEWPAC BIOSOLIDS SNAPSHOT
2 BIOSOLIDS PRODUCTION
2.1 AUSTRALIA
The total biosolids production in Australia identified in the survey is about 300,000 tonnes per year of dry solids. The average solids content of biosolids is 20–25% and this equates to around 1.2–1.5 million tonnes of biosolids in dewatered form (also called wet biosolids).
A breakdown by state of biosolids production in dry tonnes is given in the chart below
Figure 2 – Biosolids production in Australia (2010)
The results of the survey are also presented in Table 2 below.
Table 2 - Biosolids production in Australia (tonnes per year dry solids)
State tonnes per year (dry)
ACT 12,410
NSW 72,148
NT 1,095
QLD 68,009
SA 23,900
TAS 8,059
VIC 93,466
WA 24,719
Total 303,806
improving our environment Page 18 psd pty ltd

SEWPAC BIOSOLIDS SNAPSHOT
3 BIOSOLIDS END USE (MARKETS)
Biosolids end use nationally and for each state is presented in the charts below.
Figure 3 – Biosolids end use in Australia
Overall, around two thirds of all biosolids produced in Australia is applied to the land as a fertiliser, soil conditioner or soil replacement product. Application to agricultural land is by far the largest end use in Australia, followed by use in composted products.
Nationally Australia stockpiles around 25% of all biosolids produced, however this figure is driven by Victoria, which stockpiles around 75% of all biosolids it produces. Stockpiling of biosolids as a medium to long term strategy is not sustainable. It defers the cost of biosolids management to the future. Most stockpiles are also under anaerobic conditions and have very high greenhouse gas output as a result of fugitive methane emissions. Stockpiling of biosolids should be actively discouraged.
The following charts show the detail of biosolids use or destination in each state.
Figure 4 – Biosolids end use in NSW and ACT
improving our environment Page 19 psd pty ltd
SEWPAC BIOSOLIDS SNAPSHOT
Figure 5 – Biosolids end use in QLD
Figure 6 – Biosolids end use in South Australia
improving our environment Page 20 psd pty ltd

SEWPAC BIOSOLIDS SNAPSHOT
Figure 7 – Biosolids end use in Tasmania
Figure 8 – Biosolids end use in Victoria
improving our environment Page 21 psd pty ltd

SEWPAC BIOSOLIDS SNAPSHOT
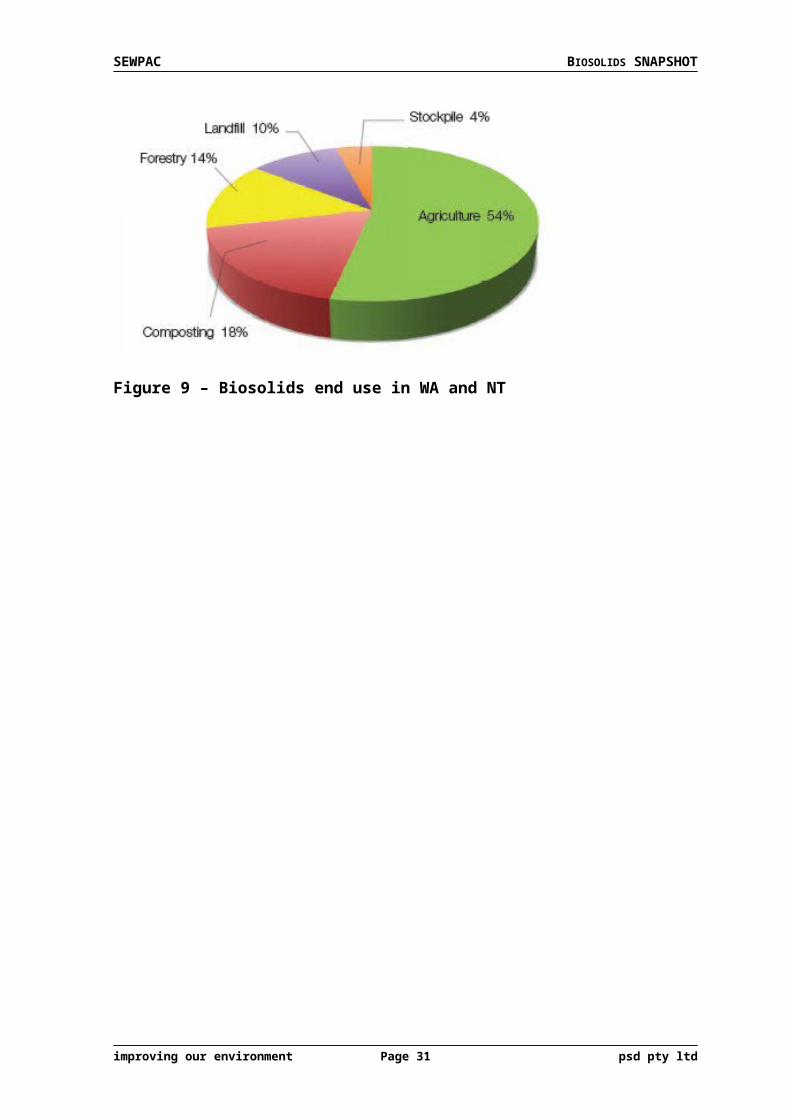
Figure 9 – Biosolids end use in WA and NT
improving our environment Page 22 psd pty ltd

SEWPAC BIOSOLIDS SNAPSHOT
4 BIOSOLIDS QUALITY
4.1 GENERAL
Stabilisation is the process by which the pathogen levels and odour potential of biosolids are reduced. Stabilisation regulatory requirements are based around two criteria: Pathogen reduction; Vector attraction reduction.Pathogen reduction involves killing potentially harmful micro-organisms which are present in the wastewater. The only mechanism recognised by regulatory authorities to kill pathogens is temperature. Time-temperature relationships are well established to relate process performance to pathogen kill. The longer the time and higher the temperature, the greater the pathogen kill. As a guide, 30 minutes is required at 70º C to achieve Grade A.A vector is a fly, mouse, rat, bird, or other animal which can carry and transmit pathogens. Vector attraction reduction is important to reduce the risk of the spread of disease from biosolids. Vector attraction reduction can be achieved by reducing the level of volatile solids in the sewage solids, increasing the solids content or increasing the pH.
Stabilisation performance is generally classified in two levels. The highest level is often referred to as Grade A or T1 and essentially involves almost total pathogen kill. This level is defined by microbiological criteria. The next level is Grade B and involves a significant reduction in pathogens. This level is defined by the type of process the sewage solids passes through. Stabilisation Grade C biosolids are unstable, and suitable for disposal only, although it is unlikely landfills would accept significant quantities of this material due to odour risk.
4.2 STABILISATION GRADE IN AUSTRALIA
Biosolids stabilisation grade nationally and for each state is presented in the charts below.
Figure 10 – Biosolids stabilisation grade in Australia
Around 75% of biosolids in Australia is stabilised to a standard where it is suitable for use under the biosolids guidelines. A significant amount, nearly 25%, of biosolids in Australia is unstabilised or of unknown stability.
improving our environment Page 23 psd pty ltd
SEWPAC BIOSOLIDS SNAPSHOT
Stabilised biosolids are made up roughly half of Grade A and B. The relatively high level of Grade A stabilised product is due to the high level of stockpiling in Victoria and the extended air drying process used in South Australia. These processes allow pathogens to die over a long period of time and result in a Stabilisation Grade A biosolids. Despite this relatively high proportion of Grade A biosolids in Australia a much lower proportion of biosolids are actually processed to Grade A standard and the NSW experience is probably more representative of the processing standard across the country.
Of greatest concern to the industry is the relatively high proportion of unstabilised biosolids, which is shown in the figure as Grade C. A large portion of the Unspecified biosolids are also suspected to be Grade C. Unstabilised biosolids represent a high odour risk and should be strongly discouraged.
The following charts show a detailed breakdown of stabilisation grade for each state.
Figure 11 – Biosolids stabilisation grade in NSW and ACT
Figure 12 – Biosolids stabilisation grade in QLD
improving our environment Page 24 psd pty ltd

SEWPAC BIOSOLIDS SNAPSHOT
Figure 13 – Biosolids stabilisation grade in South Australia
Figure 14 – Biosolids stabilisation grade in Tasmania
improving our environment Page 25 psd pty ltd

SEWPAC BIOSOLIDS SNAPSHOT
Figure 15 – Biosolids stabilisation grade in Victoria
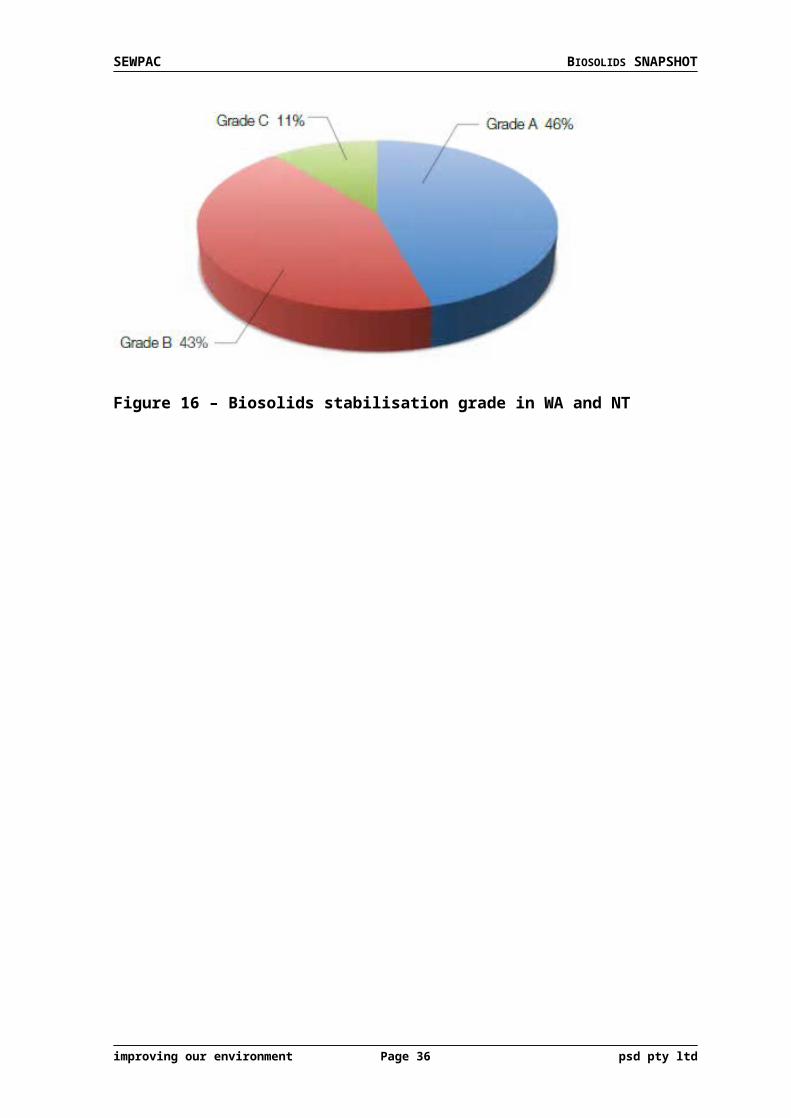
Figure 16 – Biosolids stabilisation grade in WA and NT
improving our environment Page 26 psd pty ltd

SEWPAC BIOSOLIDS SNAPSHOT
5 BIOSOLIDS PROCESSING
5.1 GENERAL
Biosolids management can be separated into two main categories, treatment and beneficial use. These categories can be further broken down into the following main steps:
Treatment
a. dewateringb. stabilisationc. storage (at treatment plant)
The two main steps in treating biosolids are stabilisation and dewatering. Stabilisation reduces the levels of pathogens and odour potential of biosolids. Dewatering removes water and hence reduces the volume of biosolids for subsequent use. Dewatering is an important step in improving the handling characteristics of biosolids and reducing the cost of subsequent management. The most common biosolids treatment processes are shown in the figures below. No data is currently available on biosolids storage.
5.2 STABILISATION PROCESS
Biosolids stabilisation processes nationally are presented in the chart below.
Figure 17 –Stabilisation processes in Australia
Stabilisation is varied but dominated by anaerobic digestion (31%), stockpiling (20%) and aerobic digestion (12%). These three main processes account for around 65% of all biosolids processed in Australia.
improving our environment Page 27 psd pty ltd

5.3 DEWATERING
Biosolids dewatering process nationally is presented in the chart below.
Dewatering in Australia is most commonly achieved with centrifuges with 40% of biosolids dewatered. This dominance of centrifuges reflects their suitability for medium to large treatment plants. Belt filter presses and drying beds are also very common, used to dewater about 25% each of Australian biosolids production. These technologies are important, particularly for small to medium size plants where they generally offer a lower cost dewatering option.
Figure 18 –Dewatering processes in Australia

SEWPAC BIOSOLIDS SNAPSHOT
6 TYPICAL COST OF BIOSOLIDS MANAGEMENT
6.1 GENERAL
Biosolids management can be separated into two main categories, treatment and beneficial use. These categories can be further broken down into the following main steps:
1. Treatmenta. dewateringb. stabilisationc. storage (at treatment plant)
2. Beneficial usea. transportb. storage (on farm)c. land application
The cost of each step varies significantly from treatment plant to treatment plant. In general the breakdown between treatment and beneficial use for the two most common approaches to sewage treatment in Australia are shown in Table 3 below as a proportion of the total cost of sewage treatment.
Table 3 – Cost of biosolids managementType of sewage treatment process Cost of biosolids management
Primary 70-90%
Secondary 30-60%
6.2 TREATMENT
The whole of life cost of dewatering varies significantly depending on the type of process, the size of the treatment plant and the utilisation of the plant – many plants operate only 30–40 hours per week. The normal range of cost for dewatering is around $100–300 per tonne of dry solids processed. This includes capital, operating and maintenance costs.
The total cost to the community in Australia of dewatering biosolids is about $50 million per year.
Stabilisation processes are even more varied than dewatering processes. The whole of life cost of stabilisation is higher than dewatering at around $300–1000 per tonne of dry biosolids processed.
The total cost to the community in Australia of stabilising biosolids is about $150 million per year.
The cost of storage during treatment is becoming increasingly expensive due to the need for ventilation and odour control. Typically enclosed biosolids storage buildings cost around $20–50 per tonne of dry biosolids processed over the life of the project, however a recent project addressing community odour concerns cost nearly $300 per tonne of biosolids.
The total cost to the community in Australia of storing biosolids at the treatment site is about $15 million per year.
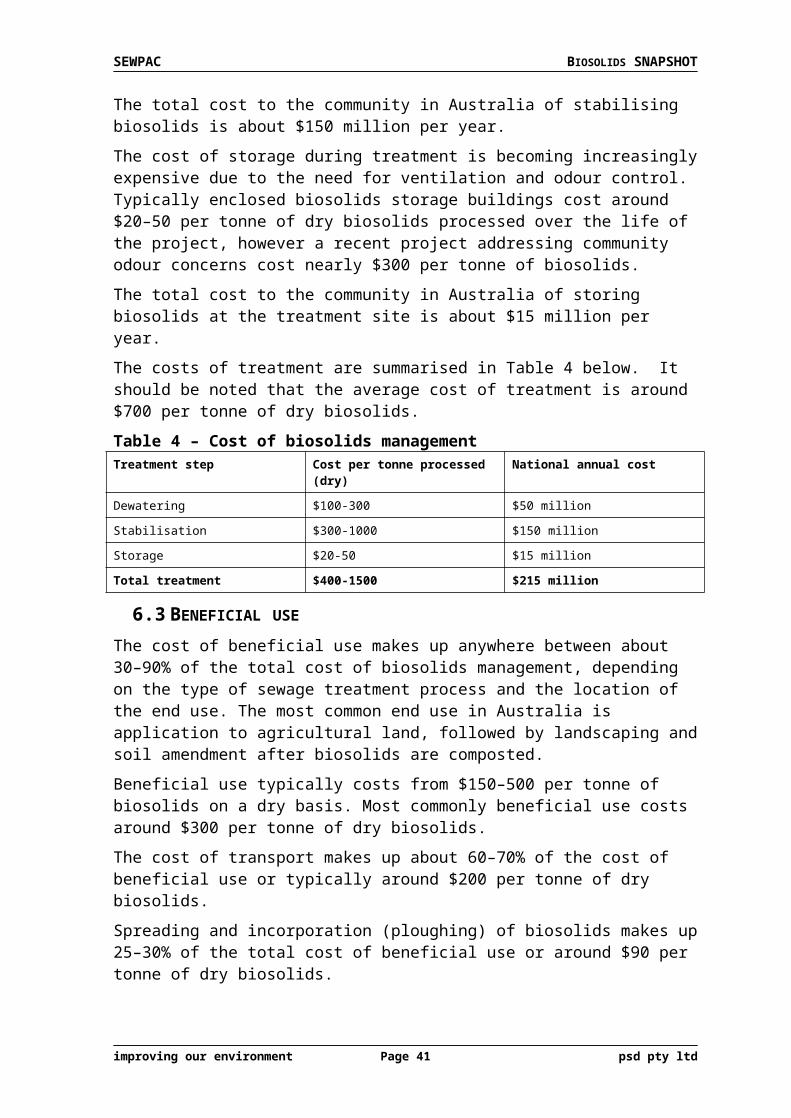
The costs of treatment are summarised in Table 4 below. It should be noted that the average cost of treatment is around $700 per tonne of dry biosolids.
improving our environment Page 29 psd pty ltd

SEWPAC BIOSOLIDS SNAPSHOT
Table 4 – Cost of biosolids managementTreatment step Cost per tonne processed (dry) National annual cost
Dewatering $100-300 $50 million
Stabilisation $300-1000 $150 million
Storage $20-50 $15 million
Total treatment $400-1500 $215 million
6.3 BENEFICIAL USE
The cost of beneficial use makes up anywhere between about 30–90% of the total cost of biosolids management, depending on the type of sewage treatment process and the location of the end use. The most common end use in Australia is application to agricultural land, followed by landscaping and soil amendment after biosolids are composted.
Beneficial use typically costs from $150–500 per tonne of biosolids on a dry basis. Most commonly beneficial use costs around $300 per tonne of dry biosolids.
The cost of transport makes up about 60–70% of the cost of beneficial use or typically around $200 per tonne of dry biosolids.
Spreading and incorporation (ploughing) of biosolids makes up 25–30% of the total cost of beneficial use or around $90 per tonne of dry biosolids.
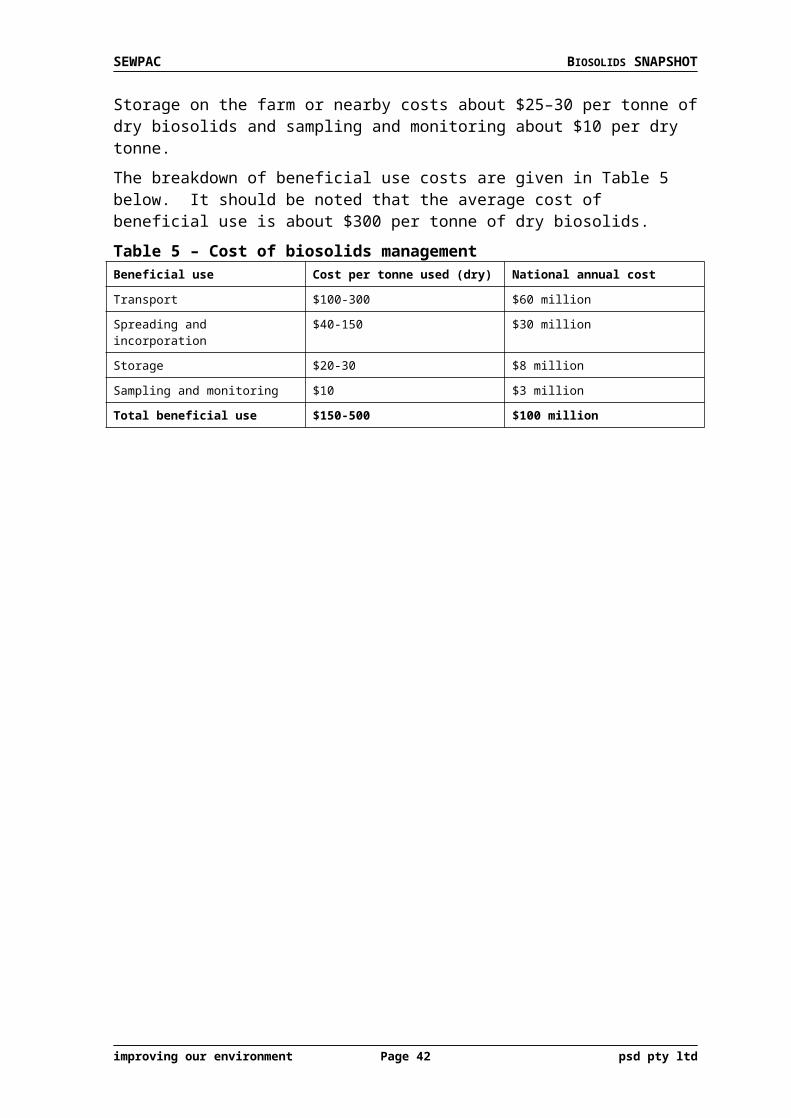
Storage on the farm or nearby costs about $25–30 per tonne of dry biosolids and sampling and monitoring about $10 per dry tonne.
The breakdown of beneficial use costs are given in Table 5 below. It should be noted that the average cost of beneficial use is about $300 per tonne of dry biosolids.
Table 5 – Cost of biosolids managementBeneficial use Cost per tonne used (dry) National annual cost
Transport $100-300 $60 million
Spreading and incorporation $40-150 $30 million
Storage $20-30 $8 million
Sampling and monitoring $10 $3 million
Total beneficial use $150-500 $100 million
improving our environment Page 30 psd pty ltd
SEWPAC BIOSOLIDS SNAPSHOT
7 VALUE OF BIOSOLIDS
7.1 GENERAL
Biosolids has value by virtue of their constituents. The components which give biosolids value are;
nutrients organic matter inorganic matter trace metals
The most valuable constituents are the nutrients and organic matter. Each constituent is discussed below.
7.2 NUTRIENTS
The current prices of the main plant nutrients, nitrogen and phosphorus, based on the price of commonly available inorganic fertilisers, are shown below in Table 6. Farmers must calculate the most cost effective fertiliser to use based on plant nutrient requirements and the cost of fertiliser.
Table 6 - Current inorganic fertiliser prices
FertiliserNitrogen content (%)
Phosphorus content (%)
Current price $/tonne1 $/kg N $/kg P
Ammonium phosphate 10 21.9 890 8.90 4.06
Diammonium phosphate 18 20 880 4.89 4.40
Urea 46 0 565 1.23 -
Superphosphate 0 8.8 440 - 5.00
Triple Superphosphate 0 20.7 870 - 4.20
Notes 1) Prices from Landmark, Orange, not including delivery.
The nitrogen and phosphorus content of biosolids varies widely from treatment plant to treatment plant. An estimate of typical average values would be about 4% nitrogen and 2.5% phosphorus. Table 7 shows the potential nutrient value of typical biosolids based on current price of inorganic fertilisers.
Table 7 - Nutrient value typical biosolids (per dry tonne)
Nitrogen PhosphorusP Value $/tonne2
N Value $/tonne3
Typical biosolids analysis 4% 2.5% 102 49Notes 1) Prices from Landmark, Orange, not including delivery.
2) Based on mono ammonium phosphate, which is the most cost effective source of phosphorus3) Based on urea, which is the most cost effective source of nitrogen
Biosolids has a current potential nutrient value of around $100 per tonne of dry biosolids. With approximately 300,000 tonnes of biosolids under management each year in Australia the potential nutrient value, based on phosphorus is around $30 million per year. This potential value represents around one third to one half of the cost of transport and beneficial use of biosolids (not including processing costs) in Australia. The current potential value of biosolids are therefore likely to be less than the cost of transport and beneficial use. It should be noted that the value of both nitrogen and phosphorus are not
improving our environment Page 31 psd pty ltd
SEWPAC BIOSOLIDS SNAPSHOT
counted as one of these is effectively ‘free’ when you buy complex fertilisers which have both. This is a conservative approach which reflects farming practice.
The future value of both nitrogen and phosphorus is likely to be linked closely to fuel prices and availability of phosphate rock. Both of these commodities are likely to continue to rise in price as they are non-renewable resources. The long term value of biosolids is therefore likely to continue to rise over the next 10–15 years as oil prices rise. The US Department of Energy is predicting the price of oil to increase by about three times over the next 10–15 years and this would put the potential future value of biosolids at $300 per tonne (dry basis).
When considered on a product (wet) basis the current value of biosolids is around $20 per tonne and the potential future value $60 per tonne. In the case of current value this is still significantly less than the current price of beneficial use, typically at $40-80 per tonne (wet basis), although it may provide a useful offset if the full value of nutrients in biosolids is realised.
7.3 ORGANIC MATTER
The primary value of organic matter in biosolids is for its energy content. Energy can be produced from biosolids by anaerobic decomposition of the organic matter or direct combustion. Anaerobic processes generate methane which can be burnt to produce electricity. Direct combustion processes can produce energy, however the energy content of biosolids is dependent on the moisture content and the volatile solids content. Biosolids must generally have higher solids content than most sewage treatment plants in Australia achieve with mechanical dewatering before it has a significant energy value.
The efficiency of energy from biosolids processes varies significantly. Table 8 below shows the upper bounds of the gross energy value of biosolids from anaerobic decomposition and combustion. The value includes an allowance for Renewable Energy Credits.
Table 8 - Value of biosolids for energy (per dry tonne)Process Electricity generated
(MWhr/dry tonne)Value of Energy ($/dry tonne)
Anaerobic digestion 1.0 100
Combustion 1.0 100
The organic matter in biosolids also provides substantial agronomic benefit, by improving soil biological and physical properties, such as structure, infiltration, water holding capacity, and porosity. The carbon in biochar is also expected to provide similar agronomic benefits. The value of the benefit of increased organic carbon is not readily quantifiable, however biochar sales are now increasingly common and achieve $200–400 per tonne of char. This equates to a value of $120–320 per tonne of dry biosolids, based on an organic content of 60–80%. It should be noted that there are substantial technical issues around production of biochar from biosolids.
7.4 INORGANIC MATTER
The value of inorganic matter in biosolids applies largely to cement and brick making where the inorganic matter provides a substitute for some raw materials (such as clay) in these products. Generally the value of raw materials is low, particularly of inert solids found in biosolids, because the source of raw materials, like clay, used for building products is close to the point of manufacturing. For example a cement works or brick
improving our environment Page 32 psd pty ltd

SEWPAC BIOSOLIDS SNAPSHOT
works usually has an associated quarry close by. As a result the value of inorganic matter in biosolids is potentially $5–15 per tonne.
Biosolids have a wide range of inorganic matter content and typically ranges from around 20% up to 40%, depending on the biosolids treatment processes. At an assumed average value of $10 per tonne of inorganic matter this gives biosolids a value of $2–4 per tonne (dry basis). Whilst this value is relatively low it may be significant to a brick making operation.
7.5 TRACE METALS
The trace metals in biosolids are not usually valued, however farmers use copper and zinc sulphate as well as a range of other trace metals to aid plant growth. Boron, chlorine, manganese, iron, molybdenum, selenium and sodium are all plant micronutrients which are present in biosolids.
Based on the main micronutrients present in biosolids, that is copper and zinc, the value of biosolids can be determined from the current market price for copper and zinc sulphate, which are the most commonly used forms of these metals when applied to land. A typical biosolids product has about 550 mg/kg copper and 800 mg/kg zinc. This gives around 1 kg of copper and 1.5 kg of zinc per tonne of biosolids (dry basis). The copper and zinc in their respective sulphates are worth around $13 and $7 per kilogram respectively, which therefore makes the micronutrient value of biosolids around $13 per tonne (dry basis).
Table 9 - Current inorganic fertiliser prices
Micro nutrientTypical level in biosolids (mg/kg)
Typical price $/kg
Value $/ dry tonne of biosolids
Copper 550 13 7.15
Zinc 800 7 5.60
7.6 SUMMARY OF PRODUCT VALUE
The current and future value of biosolids based on the key value characteristics are summarised in Table 10 below. This shows that the likely value of biosolids will increase significantly over the next 10–20 years if Australia produces products which meet the market needs. It should be noted that the highest biosolids value products are those which have the best visual and low odour characteristics and are least recognisable as biosolids. In general these are thermally dried biosolids in a granular form.
Thermally dried biosolids granules
improving our environment Page 33 psd pty ltd

SEWPAC BIOSOLIDS SNAPSHOT
It is essential however that the cost of producing higher value products is assessed as this may exceed the benefits gained. It is also critical to establish a market based approach for products which are potentially of higher value. If the current distribution framework is used for higher value products without differentiating these products from current biosolids products then it will be difficult or impossible to realise the full value of these higher value products.
Table 10 – Summary of product value
Characteristic DescriptionCurrent value $/tonne
Future value $/tonne
Value based on
Macro-nutrients Nitrogen and phosphorus 40-1401 120-4002 Phosphorus content
Organic matter Volatile solids 100-1503 210-3004
Electricity generated relative to coal, plus the value of RECs
Inorganic matter Non volatile solids 2-45 5-106 Clay replacement
Micro-nutrients Copper and zinc 137 Not estimated Copper and zincNotes 1) Based on current value of inorganic fertiliser phosphorus and typical phosphorus levels in biosolids.
2) Based on assumed increase of phosphorus of three times consistent with US DOE predictions for oil prices.3) Based on potential electricity generation using $15/MWhr plus $40/MWhr for RECs.4) Based on a threefold increase in the price of RECs due to carbon management policies and stable coal prices as per World Bank predictions.5) Based on non volatile solids content and typical cost of clay for brick making.6) Based on increased cost of raw materials including diminishing local reserves.7) Based on current price of agricultural copper and zinc sulphate, and their copper and zinc content relative to biosolids.
improving our environment Page 34 psd pty ltd

SEWPAC BIOSOLIDS SNAPSHOT
8 BIOSOLIDS MARKETS
8.1 GENERAL
Biosolids have been used in Australia under the current regulations since the early 1990’s. In this time around 2 million tonnes (dry) of biosolids have been beneficially used, the majority of this on agricultural land. The key existing and potential future biosolids markets are outlined below and broadly defined in Table 11 below.
Table 11 Definition and scope of markets consideredMarket Definition
Agriculture Fertiliser supplement for broadacre pasture and cereal cropping, not including orchards, vegetables, vineyards or small agricultural endeavours
Soil rehabilitation Remediation of degraded soils
Forestry Fertiliser supplement for pinus radiata plantations
Site (mine) rehabilitation Remediation of degraded sites to aid re-establishment of plant growth
Landscaping and minor horticulture Composted product largely for urban landscaping and small scale horticultural use
Building products Cement and brick making, not including roof and floor tiles, specialised ceramics, minor refractory products and artificial aggregates
Energy production Direct combustion of biosolids or biosolids derived products to produce energy
Carbon sequestration Land application of char derived from biosolids in order to gain carbon credits or similar.
8.2 AGRICULTURE, LANDSCAPING AND MINOR HORTICULTURE
Agriculture, landscaping and minor horticulture are existing, successful markets which have few barriers to their continued use. Agriculture has a total market potential likely in excess of 10 million tonnes per year of dry solids. Landscaping and minor horticulture has a likely maximum capacity of around 150,000 tonnes per year of dry solids and at this size all the compost made would have biosolids in it.
The value of biosolids in agriculture is primarily the nutrients and typical biosolids has a potential value of around $100 per tonne of dry solids on this basis. The value of compost in this market is as a soil conditioner and low grade fertiliser and has a typical sale price of about $34 per tonne of dry solids.
The demand for biosolids products in these markets is projected to continue to grow roughly in proportion to population growth. These markets are relatively expensive to access and have a high sensitivity to fuel prices.
The key risk to the agricultural market is odorous biosolids.
The key risk to the landscaping and minor horticulture market is the limited market size. For example, based on the dilution rate needed for biosolids to make unrestricted grade compost, about two thirds of the compost in Sydney has biosolids in it. This market saturation is significant when compared with agriculture, in which less than about 1% of the potential market is used.
improving our environment Page 35 psd pty ltd
SEWPAC BIOSOLIDS SNAPSHOT
8.3 SITE REHABILITATION, FORESTRY
Site rehabilitation and forestry are existing markets which have been used to a limited extent by water businesses in Australia. In NSW site rehabilitation has been estimated at a size of around 16,000 tonnes per year of dry solids and forestry up to around 60,000 tonnes per year of dry solids. Nationally there are no estimates of the size of these markets. Although both markets have larger potential to take biosolids, the practical size is limited due to other constraints. In practical terms the indication is that these markets are equal to or smaller than the production of biosolids and are therefore significantly more limited than agriculture.
The primary value of biosolids in the site rehabilitation market is as a soil replacement product, which have a typical sale price of $23–40 per tonne of dry solids. The value of biosolids in forestry is the nutrients and typical biosolids have a potential value of around $100 per tonne of dry solids on this basis. The demand for products in these markets is projected to be stable.
The key limitation to both these markets is application of biosolids. In both markets the terrain is very rough and conventional application equipment cannot access sites easily and often not at all. In the case of forestry there is the additional problem of spacing between the trees not allowing access for spreading equipment. Mine sites also have significant additional safety requirements for equipment and personnel which is both an additional cost and deterrent to contractors.
8.4 CEMENT PRODUCTION, BRICK MAKING, FUEL
Cement production, brick making and fuel are markets for which biosolids are not accessed in Australia, however all are utilised in Europe. These markets are significant in size. Cement and brick making have a potential capacity to take 100,000 and 200,000 tonnes per year of dry biosolids respectively in NSW. The fuel market is very large and has a potential size of over 1 million tonnes per year of dry biosolids.
The primary value of biosolids in these markets is their fuel value. Biosolids must be dried to a level of greater than 90% solids to be suitable for use a a fuel. There is also some small value in the inert matter in biosolids for cement production and brick making, which would act as a raw material replacement.
The potential value of biosolids as source of energy is difficult to estimate and depends on the use of the energy. The base value of a dried biosolids product can be compared with coal and equates to a potential value of $55–80 per dry tonne of biosolids. If biosolids are used to generate electricity they act as a replacement for non-renewable fuel and therefore attract renewable energy credits (RECs) with a total value of around $100 per tonne of dry biosolids. It is also possible such a use may gain carbon credits in the future.
The primary limitation of these markets is that they are not currently accessed by utilities in Australia to any extent. This means that a significant amount of market development work must be done, however it is important to note that there are precedents for biosolids use in all these markets which can be drawn on.
improving our environment Page 36 psd pty ltd

SEWPAC BIOSOLIDS SNAPSHOT
8.5 SOIL REHABILITATION, CARBON SEQUESTRATION
Soil rehabilitation and carbon sequestration are potentially large markets, each with the potential to take over 1 million tonnes per year of biosolids. These markets are not established markets.
The value of biosolids in these markets is primarily the organic matter. In the case of soil rehabilitation the value of improving soils so that they can become productive agricultural land is clearly significant, but currently no value is attributed to such endeavours. The current value of biosolids in this market is therefore zero. In the case of carbon sequestration the future potential value is up to about $30 per tonne of dry biosolids.
The primary limitation of these markets is that there are no current drivers to enable the markets. The advent of the Australian legislation on carbon, commonly called the carbon tax, will increase focus on reduction in greenhouse gas emissions. The most likely outcome of the carbon tax will be increased focus on energy recovery.
In the case of carbon sequestration through biochar, this market is still in the research and development phase and requires a price on carbon to be cost effective. Whilst the problems with soil degradation are broadly recognised there is little institutional support for work in this area.
improving our environment Page 37 psd pty ltd
SEWPAC BIOSOLIDS SNAPSHOT
9 GREENHOUSE GAS IMPLICATIONS OF BIOSOLIDS
9.1 GENERAL
Biosolids can reduce greenhouse gas emissions in two ways:
generation of green power through direct combustion or anaerobic digestion; offset of emissions associated with production of inorganic fertilisers.
Each of these points is discussed briefly below.
9.2 ELECTRICITY PRODUCTION
Biosolids are largely made up of organic matter which can be utilised to produce energy. Anaerobic digestion processes convert organic matter to methane, which is then burnt to generate heat and power. Direct combustion processes burn the biosolids and the heat is used to generate steam to drive a steam turbine which generates power.
Anaerobic digestions processes typically generate a net energy output of 300–700 kWhr per tonne of dry biosolids processed. This equates to around 0.3 to 0.7 tonnes of CO2e for every tonne of biosolids processed when replacing coal fired power generation.
Combustion processes must have more than about 35% solids content before they are net energy producers and as a result there are very few biosolids combustion plants in the world which directly produce net energy. However, there are cases where it is advantageous to process biosolids to a point where it does have a significant energy content. Thermal drying which produces a biosolids product with about 90% solids content is one example.
If biosolids are dried to 90% this equates to a net energy output of about 600–900 kWhr per tonne of dry biosolids which equates to around 0.6–0.9 tonnes of CO2e for every tonne of biosolids processed when replacing coal fired power generation. It should be noted that a significant amount of energy is required to process biosolids to 90% solids content.
9.3 REPLACEMENT OF INORGANIC FERTILISERS
When biosolids are used to replace inorganic fertilisers they reduce the emissions associated with the production of the inorganic fertilisers. If the biosolids are diverted from landfill disposal further emissions are avoided.
Studies by PSD on the emissions avoided by the use of biosolids show that for every tonne of dry biosolids used around 6 tonnes of CO2e are avoided from the production of the inorganic fertilisers. If the biosolids are diverted from landfill a further 5 tonnes of CO2e are avoided for every tonne of biosolids used.
Emissions associated with transport are small compared to the emissions listed above.
It is possible to both generate energy from biosolids through anaerobic digestion processes and have a final biosolids product which can be used as a fertiliser. In such a case the greenhouse gas benefits gained through biosolids are significant.
improving our environment Page 38 psd pty ltd

SEWPAC BIOSOLIDS SNAPSHOT
10 STANDARDS AND GUIDELINES APPLYING TO BIOSOLIDS
10.1 GENERAL
In Australia biosolids are regulated under a specific statutory framework in each State. Generally the key piece of legislation is the State’s head environment protection Act. These Acts require that any discharge to the environment must be managed so that they do not adversely affect the receiving environment. These Acts also generally describe the key principles of environment management and the waste hierarchy, with waste avoidance and recycling the preferred management option compared to disposal.
The Acts are legal documents and a person or company can be held liable under the relevant Act if they do not comply with them by creating pollution. The Acts set out penalties which include fines and/or gaol sentences for persons and companies.
Each State in Australia also has a biosolids guideline. This is a specific guideline which sets out the best practice requirements for biosolids use. The guidelines are not legal documents on their own but have legal significance because of reference from other legal documents. The guidelines are developed such that compliance with them will normally mean compliance with other relevant regulations and there is normally a statement in the guidelines to this effect.
Generally the biosolids guidelines are referred to in the Acts and may also be part of a water authority’s or Council’s operating licence. An operating licence is a legal document which sets out the environment agency’s requirements of an organisation, for example a Council operating a sewage treatment plant.
Generally biosolids are classified as a waste under the key environment legislation and is exempt from this waste classification if used in accordance with the guidelines. Therefore use of biosolids in a way which is not consistent with the guidelines would normally constitute an offence under the referring Act or Licence.
In general terms a person is liable under the Australian statutory framework if they create pollution or harm to the environment. Liability would be prosecuted under the relevant Act but other guidelines and policies are often used to determine whether harm has been caused to the environment or an action was contrary to best practice and the standards set out by the State.
In addition to the key piece of environment legislation there are a broad range of other regulations which cover areas which may be impacted by biosolids use. These include Acts which cover areas such as health, fertiliser use, food and livestock disease. When using biosolids it is therefore essential to comply with all the relevant Acts. Generally the biosolids guidelines are prepared in a way such that following them will achieve this aim.
A particular feature of biosolids guidelines is that they deal exclusively with application of biosolids to land, either directly or indirectly. Other uses for biosolids, such as in making bricks, conversion to energy through incineration or discharge to sea are covered by general legislation which is specific to the respective area; in the case of incineration, air pollution.
improving our environment Page 39 psd pty ltd

SEWPAC BIOSOLIDS SNAPSHOT
10.2 BIOSOLIDS GUIDELINES
Biosolids, nightsoil and manures have been applied to land for thousands of years. During the 1980’s biosolids became a focus of improved environmental performance in Europe and the US and not long after in Australia. As a result guidelines and regulations were developed controlling the use of biosolids when applied to land.
Table 12 below shows a timeline for the development of biosolids regulations
Table 12 – Timeline for Biosolids GuidelinesYear Guideline
1986 EU Sludge Directive
1987 NSW Agriculture
1993 US EPA 40CRF503 rule
1996 SA EPA
1997 NSW EPA
1999 Tasmanian EPA
2001 Qld EPA Operational policy
2001 Safe Sludge Matrix (UK Water and British Retail Consortium)
2002 WA EPA
2003 NZWWA supported by Ministry for the Environment
2004 Vic EPA
2004 National Water Quality Management Strategy (National guideline)
2009 SA EPA (draft)
2010 WA EPA (draft)
The body of research supporting these regulations was done through the 1980’s and 1990’s. Australian guidelines were largely based on the US EPA’s 40CFR503 rule, albeit supported by some local research and the local guidelines are much more conservative (protective of the environment) than the US rule. Australian guidelines are all based strongly on the NSW EPA’s guideline, which was the first comprehensive biosolids guideline to be released in Australia.
In recent years South Australia and Western Australia have released updates to their biosolids guidelines which include the outputs of the National Biosolids Research Program.
10.3 REGULATED COMPOUNDS
The compounds which are regulated in each region of Australia vary somewhat. Table 13 below shows the list of 22 regulated chemicals for each of the states in Australia and compares this to the EU and USA.
improving our environment Page 40 psd pty ltd
SEWPAC BIOSOLIDS SNAPSHOT
Table 13 – Regulated chemicalsContaminant
NSW, Qld, National, Tas, Vic, WA
SA EU USA
Arsenic Y - - YCadmium Y Y Y YChromium Y Y - YCopper Y Y Y YLead Y - Y YMercury Y - Y YNickel Y - Y YSelenium Y - - YZinc Y Y Y YHexachlorobenzene Y - - -
Benzene hexachloride total Y - - -
Lindane Y - - -
Dieldrin Y Y - -
Heptachlor Y - - -
DDD Y - - -
DDE Y - - -
DDT Y - - -
Total DDT analogs - -
PCB Total Y - - -
Aldrin Y - - -
Chlordane Y Y - -
Total dioxins - - - -Notes: 1) WA includes DDT analogs
2) Vic doesn’t have a limit for BHC
Of particular interest is the draft Biosolids Guidelines developed by the South Australian EPA in conjunction with the National Biosolids Research Program which proposes to regulate only 6 compounds, as shown above. This decision was made following a review of the levels of contaminants in biosolids and the potential risk these contaminants posed to human and environmental health.
10.4 AUSTRALIAN STANDARDS, BEST PRACTICE AND SPECIFICATIONS
There are no Australian Standards applying to biosolids use, however the Australian Standard AS 4454 (2003) for Composts, Soil Conditioners and Mulches references the biosolids guidelines. This reference to the biosolids guidelines has far reaching implications as it implies that composted products must be controlled in the same manner as biosolids. This means that restrictions due to contaminants and nutrients apply to compost. Arguably this restriction is inconsistent with the concept of a composted product, which is intended to be suitable for unrestricted use.
There are no best practice manuals or specifications relating to biosolids.
improving our environment Page 41 psd pty ltd
SEWPAC BIOSOLIDS SNAPSHOT
10.5 REGULATORY TRENDS
Regulation of biosolids in Australia is well established and has functioned successfully for around 15 years. In this regard there is not any major impetus from industry or the regulators to change the current guidelines (if it aint broke don’t fix it). In light of the age of the current guidelines and the outcomes of the National Biosolids Research Program, the Victorian and NSW EPA’s have expressed desire to update their biosolids guidelines and the South Australian and Western Australian EPA’s have released updated draft guidelines for comment.
From an institutional viewpoint, guideline update is not a high priority across Australia. The desire to update guidelines is impacted by the political implications arising from the Australian Standards for Compost (AS 4454) and certain conclusions of the National Biosolids Research Program.
The compost industry is strongly opposed to the application of biosolids guidelines to compost. Composted products become significantly more restricted if biosolids guidelines are applied to them. With the current reference in the Australian Compost Standard to biosolids guidelines, any discussion of review of the biosolids guidelines has drawn strong opposition from the compost industry. There is merit in the compost industry’s argument that compost should not be regulated as a biosolids product, even when it contains biosolids.
A number of the outcomes of the National Biosolids Research Program were keenly debated in the industry. Whilst the scientific method of the NBRP is generally considered sound, some conclusions of the research are contested. The contested areas of the NBRP lead to more conservative recommendations of application rates for biosolids in some conditions as a result of the metal content of the biosolids. The metals in questions are primarily copper and zinc.
If biosolids application rates are reduced below the agronomic nutrient requirements of crops as a result of the newly recommended metals levels this is a significant restriction to biosolids use. It will either operate as a pseudo-barrier to application or significantly increase the cost of biosolids use. Determining the correct limits for metals application is therefore essential for large parts of the industry to continue to operate successfully.
The Australian and New Zealand Biosolids Partnership recently undertook a major review of biosolids regulations in Australia and the overarching outcome was that whilst there was no perceived need to change the existing guidelines to protect human health and the environment there would be significant benefit to the industry if guidelines were consistent across Australia.
With respect to the NWQMS Guideline #13 (ARMCANZ 2004), generally referred to as the National Biosolids Guidelines, the Partnership’s review made no specific recommendations. This was largely due to the nature of biosolids regulation in Australia, i.e. biosolids are regulated on a State-basis and therefore the National Biosolids Guidelines are generally not used. In addition the development of the National Biosolids Guidelines was less rigorous and extensive than many of the State guidelines. In practical terms this makes the National Biosolids Guidelines a reference of last priority for the industry.
improving our environment Page 42 psd pty ltd

SEWPAC BIOSOLIDS SNAPSHOT
Other key conclusions from the review were:
The guidelines of Australia and New Zealand have many inconsistencies from region to region. It is the view of the project team that there is no need for the majority of these inconsistencies to exist. Further it is considered that there is significant benefit to biosolids management in having a consistent approach for all guidelines and that regulators should collaborate with stakeholders to develop such;
Odour from biosolids was considered by the project team as the greatest threat to the long term, sustainable, beneficial use of biosolids because of its potential negative impact on public perception. The project team considers that the vector attraction reduction requirements in all current guidelines are inadequate in some aspects to reduce the odour potential of biosolids and require further research and optimisation;
All guidelines in Australia, New Zealand and the USA have the same basic structure in that they set standards for contaminant levels, pathogen and vector attraction reduction, management practices and sampling and reporting requirements. The EU Sludge Directive does not have specific requirements for management practices and sampling and reporting requirements;
The Australian and New Zealand guidelines were developed with the primary aim of protecting the quality of grain and livestock products which are exported. The EU and US regulations were developed with the primary aim of protecting human health. As a result the Australian and New Zealand guidelines are significantly more stringent than the European and US regulations
The report also made a series of recommendations for development of future biosolids guidelines in Australia. These focussed on gaining greater consistency, incorporating the latest science and using a more performance based approach to regulation. These recommendations are repeated below:
1. Guidelines across Australia and New Zealand should be consistent in the limits and controls set on biosolids use;
2. Guidelines should be based on sound science with a proportionate risk basis;
3. Guidelines should be based around sustainable biosolids use;
4. The current guideline structure which addresses contaminant and pathogen levels in biosolids along with management practices and sampling and reporting requirements should be maintained;
5. Vector attractant reduction standards should be significantly improved with a focus to reducing the odour potential of biosolids;
6. The list of regulated compounds should be reviewed and can be significantly reduced for most circumstances. In the view of the project team not more than the six compounds need regular monitoring (cadmium, copper, chromium, zinc, chlordane and dieldrin) and possibly only four (cadmium, copper, chromium and zinc);
7. The guideline should have only two contaminant grades A and B with any biosolids unsuitable for use or ungraded remaining unclassified;
8. Contaminant levels for each of the contaminant grades should be updated in line with current international, Australian and New Zealand research experience;
improving our environment Page 43 psd pty ltd

SEWPAC BIOSOLIDS SNAPSHOT
9. The guideline should have only two pathogen grades A and B with any un-stabilised or ungraded biosolids remaining unclassified. The highest level of pathogen treatment should be equal to the National Guidelines P1 level. The Grade B pathogen level should be based on a 99% reduction in pathogen levels. Terminology used across ANZ should be consistent;
10. Pathogen reduction requirements should be performance-based as opposed to process-based with the helminth criteria removed. The requirement to prove pathogen destruction performance of unknown processes should be retained;
11. Sampling requirements should be streamlined where it can be demonstrated higher quality biosolids are produced which do not exceed certain ‘trigger’ levels of regulated chemicals;
12. Guidelines should recognise the need for accountability to the community as well as statutory reporting requirements. As a result, initial screening of a broader range of contaminants and intermittent monitoring of unregulated compounds should be carried out where appropriate on a semi-regular basis (say, annually) and inform the need for which compounds should be subject to ongoing analysis;
13. Management restrictions and guidance should be reduced and be more performance-based rather than descriptive (e.g. instead of limiting storage time at the farm, rely on a performance objective for prevention of fly strike, odour, groundwater pollution or the like);
14. Allowable end uses and associated controls should be rationalised on the basis of practicality and operating experience gained over the past 20 years.
improving our environment Page 44 psd pty ltd

SEWPAC BIOSOLIDS SNAPSHOT
11 MARKET BARRIERS/RISKS AND OPPORTUNITIES
11.1 MARKET BARRIERS/RISKS
The key barriers to a high level of sustainable biosolids use are discussed briefly below. In terms of the community and the environment the overall risk of biosolids use is extremely low. Health and environmental impacts associated with biosolids are few and minor and the body of scientific research supports the position that biosolids used in accordance with the regulations are safe.
11.1.1 Biosolids health and environment risksResearchers and regulators have concluded that “application of biosolids on agricultural land is safe, provided the guidelines are followed” (WEAO, 2001), and cite studies showing that there are no significant health effects from living on farms receiving biosolids. Further, biosolids are beneficial to soils in terms of structure, water holding and microbial population (Tenenbaum, 1997) and provide a useful alternative to inorganic fertilisers.
The US EPA concluded more cautiously, “that there is no documented scientific evidence that sewage sludge regulations have failed to protect public health” (USEPA, 2003). However, in response to concerns raised by the National Research Council, the EPA identified areas requiring further investigations and risk assessment, particularly regarding pathogens and a specific list of 15 chemicals (USEPA, 2003).
Since 1990, around 1 billion tonnes of biosolids have been applied to agricultural land in Australia, the EU and USA without significant adverse impact.
When considering regulated compounds there is a substantial body of scientific evidence which defines the behaviour of these compounds and hence allows accurate definition of safe levels, such as set out in the various biosolids guidelines. Research and anecdotal evidence support that the levels stipulated in the various biosolids guidelines are adequate to protect human health, produce quality and the environment.
When considering potential impacts of chemicals in biosolids it is important to think of the way in which people and animals may be exposed. The worst exposure route for humans is by direct contact with biosolids. Indirect exposure poses a far lower risk. Another important consideration is that many of the chemicals of concern in biosolids come from household products such as detergent, shampoo, soap, cleaners, etc which are used every day and which people apply directly to themselves. Other chemicals arise mainly as a result of atmospheric deposition. Exposure to these types of chemicals through biosolids is therefore negligible when compared to the overall exposure a person may have.
In addition to the regulated compounds in biosolids there are a broad range of unregulated compounds including endocrine disruptors, poly brominated fire retardants, pharmaceuticals and new compounds which pose a potential threat to the environment and human health. In these cases environmental impact is often more important for persistent chemicals than human health impacts.
By way of example triclosan, which is increasingly common in personal care products, is a persistent environmental antibacterial agent. Whilst the concentrations in biosolids are low the increasing use of triclosan and its persistence raise potential long term concerns primarily about its use, but also about its long term impact. Triclosan is not regulated and is not normally measured by water utilities.
improving our environment Page 45 psd pty ltd

SEWPAC BIOSOLIDS SNAPSHOT
The mitigating factors for biosolids with a compound like triclosan are that levels in biosolids are generally low and when biosolids are applied to land it is ploughed into the soil giving a dilution of around 100-150 to one. In addition repeat applications of biosolids are not normal practice and when they do occur are generally separated by 3–5 years. These factors combine to reduce the potential risk of accumulation and movement of triclosan in and around the application site.
Overall the risks to human and environmental health from biosolids use are considered to be extremely low. Regulators and the industry support the need for further information and continual monitoring of emerging chemicals of concern to improve understanding and provide greater assurance to end users and the community.
11.1.2 Odour nuisanceBiosolids are by nature odorous. Almost all biosolids products have a recognisable level of sewage odour. The exception to this are composted products, which have an earth-like odour.
The vast majority of objections to biosolids use and processing arise from odour nuisance. With biosolids the most likely scenario is that odour potential can be minimised but not eliminated. The existing regulatory framework across Australia is however inadequate in setting appropriate standards for low odour potential biosolids and this fact has been recognised by the industry.
Odour incidents create public opposition to biosolids use. It also creates a lower level of trust, as the logic ‘if it smells bad it must be dangerous’ appears to apply to community response. Producing biosolids products with lower odour potential is one of the most effective ways of reducing opposition to biosolids use.
11.1.3 Public perception Public perception to biosolids has been researched in some detail by the Australian and New Zealand Biosolids Partnership’s Community Attitudinal Survey. This work highlighted the following key points:
the public is averse to odour; bad odour is perceived by the public as high health risk; the public generally supports recycling and biosolids use; most people accept that biosolids use in agriculture is a good thing; the general public is less concerned about biosolids than people working in the
industry perceive they are.
Public perception is therefore a key risk to biosolids use, however the public is generally quite supportive of appropriate biosolids use.
11.1.4 Distance to marketsA key barrier to biosolids use is the distance to the beneficial use markets. Most biosolids are produced in the cities and the most common use for biosolids is in broad acre agriculture. Typical transport distances are 200–300 km from point of generation to end use destination for the major population centres of Australia.
improving our environment Page 46 psd pty ltd
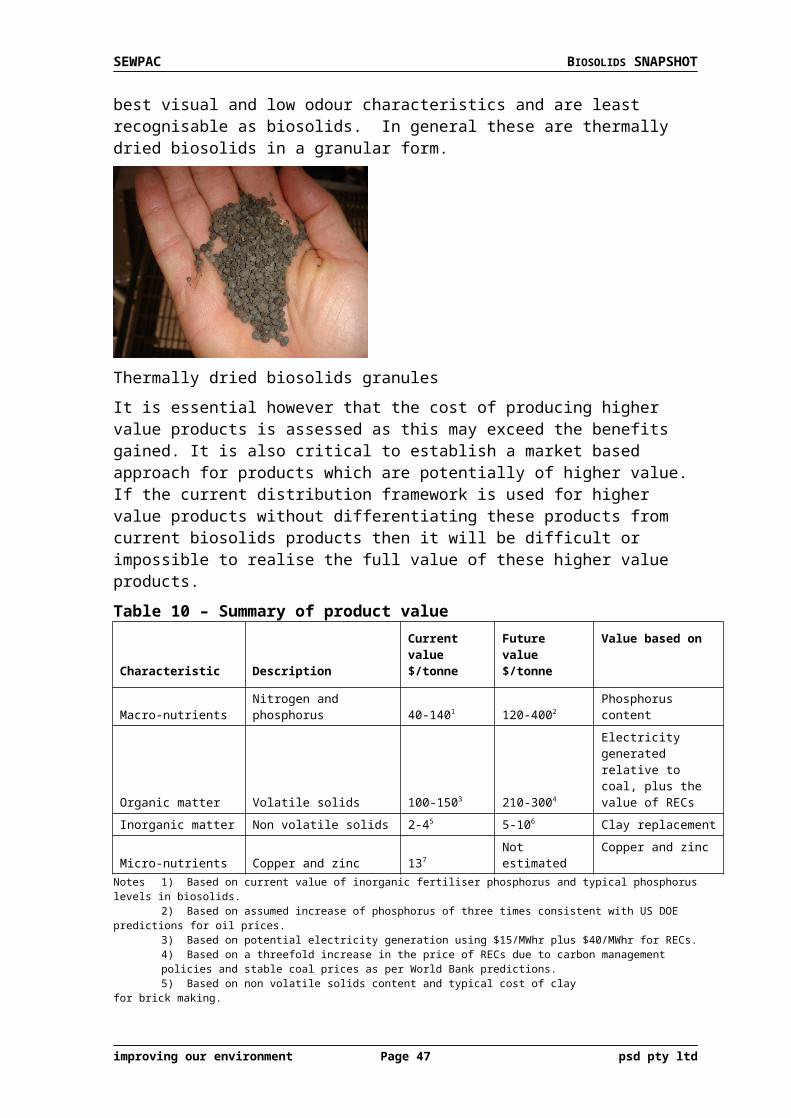
SEWPAC BIOSOLIDS SNAPSHOT
Transport is the most significant component of beneficial use of biosolids and the most energy intensive. However the majority of biosolids production is a significant distance from the largest end use market, agriculture. Agriculture is by far the largest biosolids market and the distance to the market will result in increasingly high cost of beneficial use as fuel prices increase.
11.1.5 Regulatory frameworkBiosolids are regulated independently in each state and territory of Australia. Whilst sharing some similarities in structure, the State regulations, typically called guidelines, are inconsistent in terminology, content, extent and limitations on biosolids use. Although the guidelines have been very successful in establishing safe and sustainable biosolids use in Australia the inconsistencies do not support the continued growth and sustainability of biosolids in a national sense.
All Australian guidelines are lacking in their requirements for reducing odour potential of biosolids. This area of the guidelines needs to be improved in recognition of the importance of reducing odour nuisance and minimising public opposition to biosolids as a result of odour.
The National Biosolids Research Program made significant improvements in the approach to regulating cadmium, copper and zinc in biosolids. As a result, new recommendations were made as to appropriate concentrations of these metals when applied to agricultural land. The level of conservatism in setting the appropriate metal concentrations has however been a matter of some debate and it is possible that the concentrations are overly conservative, i.e. too low. It would be of significant benefit to the industry if further research could be undertaken to eliminate any debate around this issue and gain consensus in the industry for the concentrations of these metals which is appropriate.
11.1.6 Policy frameworkIn a national policy framework there would be significant benefit in recognising the value of biosolids. Two key areas which are not currently supported by any policy initiative are:
Carbon benefits. As discussed elsewhere in this report the value of biosolids in terms of carbon is significant. Every tonne of biosolids use can reduce carbon emissions by up to around 2 tonnes of carbon dioxide equivalents.
Agronomic benefits. Research and anecdotal reports support that the benefits from biosolids use are far greater than the nutrient only benefits of biosolids. It is likely that the combined effect of applying nutrients, trace metals, organic matter and a healthy microbial population give greater benefit to plant growth than nutrients alone.
The absence of policy support for biosolids limits the development of higher quality biosolids products. A policy platform which gave direct incentives for production of higher quality biosolids products, as opposed to traditional biosolids products, would assist greatly in developing the extent and improving the sustainable performance of the industry.
improving our environment Page 47 psd pty ltd

SEWPAC BIOSOLIDS SNAPSHOT
11.1.7 Biosolids appearanceMany biosolids products have poor appearance which encourages the ‘yuk!’ factor. Production of biosolids products which are not recognisably of sewage origin is a significant benefit and a barrier which the industry needs to overcome
Lime stabilised biosolids Dewatered anaerobically digested biosolids
11.2 MARKET OPPORTUNITIES
The key opportunities for biosolids are discussed below.
11.2.1 Environmental and economic valueBiosolids has a significant potential value in terms of the total cost of biosolids management. If this value is realised the cost of biosolids management can be reduced. Historically biosolids has been treated as a waste product and the current regulatory framework enshrines the concept of waste for many reusable organic products. Increasingly the community is recognising the value of biosolids and other organic products, particularly in agriculture.
Research and anecdotal reports support that the benefits from biosolids use are far greater than the nutrient only benefits of biosolids. It is likely that the combined effect of applying nutrients, trace metals, organic matter and a healthy microbial population give greater benefit to plant growth than nutrients alone.
Recognition and support of the increasing trend to capture the value of biosolids is essential as the industry moves forward.
11.2.2 Reduction in carbon emissionsAs discussed elsewhere in this report the value of biosolids in terms of carbon is significant. Every tonne of biosolids use can reduce carbon emissions by up to around 2 tonnes of carbon dioxide equivalents. Current practice and regulation still sees a significant amount of biosolids in Australia disposed to landfill and the use of biosolids as a means to reduce greenhouse gas emissions is not recognised by the Australian Government climate policy.
11.2.3 Reduced reliance on non renewable resourcesUse of biosolids as a fertiliser, soil conditioner or soil replacement product reduces the community’s reliance on non-renewable resources. Increased biosolids use will continue to reduce consumption of non-renewable resources.
improving our environment Page 48 psd pty ltd
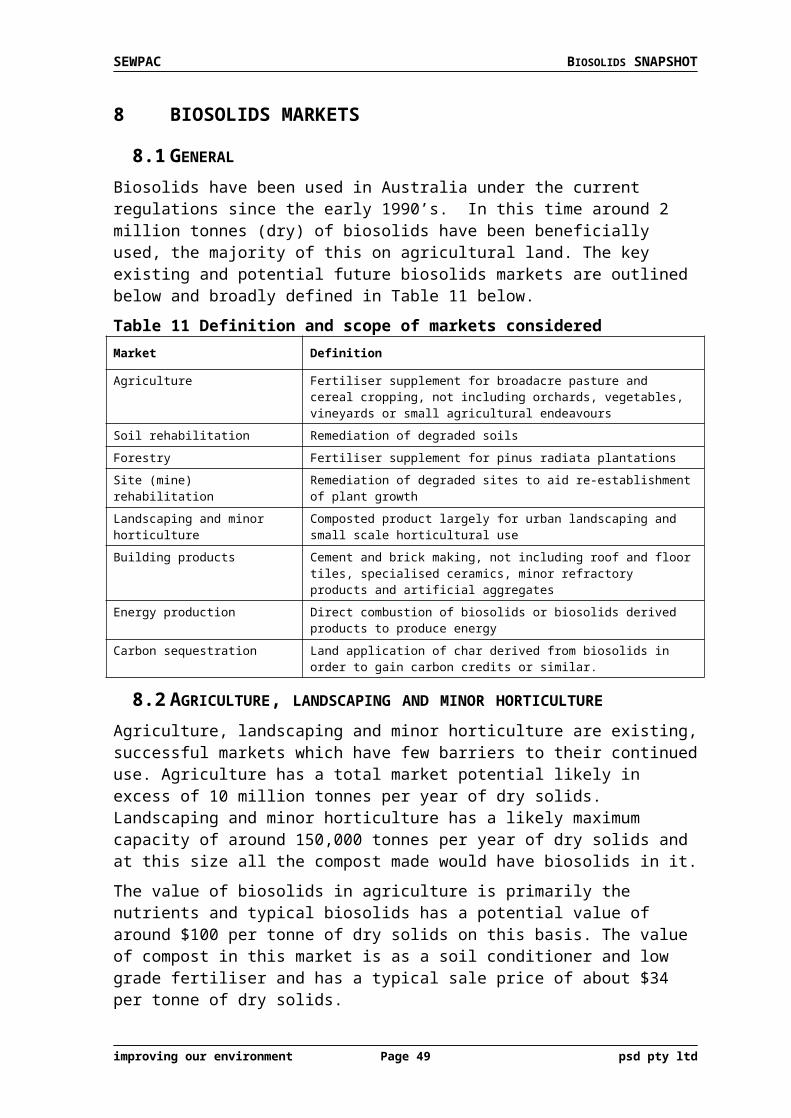
SEWPAC BIOSOLIDS SNAPSHOT
12 REFERENCES
1. Darvodelsky, P., Health Risks from Biosolids. Identifying the Gaps in the Literature. Australian Water Assocation, Biosolids Speciality Conference, June 2006.
2. Tenenbaum, D., The beauty of biosolids. Environmental Health Journal, 105(1), 1997.
3. United States Environmental Protection Agency, Office of Water, Use and Disposal of Biosolids (Sewage Sludge): Agency Final Response to the National Research Council Report on Biosolids Applied to Land and the Results of the Review of Existing Sewage Sludge Regulations. 4304T, EPA-822-F-03-010, December 2003
4. The Water Environment Association of Ontario, Fate and significance of selected contaminants in sewage biosolids applied to agricultural land through literature review and consultation with stakeholder groups. April 2001.
5. Biosolids Applied to Land: Advancing Standards and Practices, National Research Council July 2002.
6. The Australian and New Zealand Biosolids Partnership, Biosolids Production in Australia, 2010.
7. The Australian and New Zealand Biosolids Partnership, Review of Biosolids Guidelines, December 2009.
improving our environment Page 49 psd pty ltd