
BIOFUNCTIONALIZATION OF … OF SUPERPARAMAGNETIC IRON OXIDE NANOPARTICLES A THESIS SUBMITTED TO THE...
98
BIOFUNCTIONALIZATION OF SUPERPARAMAGNETIC IRON OXIDE NANOPARTICLES A THESIS SUBMITTED TO THE MATERIALS SCIENCE AND NANOTECHNOLOGY PROGRAM OF GRADUATE SCHOOL OF ENGINEERING AND SCIENCE OF BILKENT UNIVERSITY IN PARTIAL FULFILLMENT OF THE REQUIREMENTS FOR THE DEGREE OF MASTER OF SCIENCE By SELİM SÜLEK July, 2011
Transcript of BIOFUNCTIONALIZATION OF … OF SUPERPARAMAGNETIC IRON OXIDE NANOPARTICLES A THESIS SUBMITTED TO THE...

BIOFUNCTIONALIZATION OF SUPERPARAMAGNETIC IRON
OXIDE NANOPARTICLES
A THESIS
SUBMITTED TO THE MATERIALS SCIENCE AND NANOTECHNOLOGY
PROGRAM OF GRADUATE SCHOOL OF ENGINEERING AND SCIENCE
OF BILKENT UNIVERSITY
IN PARTIAL FULFILLMENT OF THE REQUIREMENTS
FOR THE DEGREE OF
MASTER OF SCIENCE
By
SELİM SÜLEK
July, 2011
ii
I certify that I have read this thesis and that in my opinion it is fully adequate, in
scope and in quality, as a thesis of the degree of Master of Science.
…………………………………
Prof. Dr. Salim Çıracı (Advisor)
I certify that I have read this thesis and that in my opinion it is fully adequate, in
scope and in quality, as a thesis of the degree of Master of Science.
………………………………….
Assist. Prof. Dr. Mustafa Özgür Güler (Co-Advisor)
I certify that I have read this thesis and that in my opinion it is fully adequate, in
scope and in quality, as a thesis of the degree of Master of Science.
………………………………….
Prof. Dr. Engin U. Akkaya
I certify that I have read this thesis and that in my opinion it is fully adequate, in
scope and in quality, as a thesis of the degree of Master of Science.
………………………………….
Prof. Dr. Mahinur Akkaya
Approved for the graduate school of engineering and science:
………………………………….
Prof. Dr. Levent Onural
Director of the graduate school of engineering and science
iii
ABSTRACT
BIOFUNCTIONALIZATION OF SUPERPARAMAGNETIC IRON
OXIDE NANOPARTICLES
Selim Sülek
Supervisor: Prof. Dr. Salim ÇIRACI
M.S. in Materials Science and Nanotechnology
July, 2011
Magnetic resonance imaging (MRI) has attracted intensive interest due to its
non-invasive monitoring capacity. Gadolinium based contrast agents, most
widely used CA, suffer from high level of toxicity and high threshold of
detection. Superparamagnetic iron oxide nanoparticles (SPION) based contrast
agents (CA) are good alternatives for gadolinium based CAs, since they have
extraordinary magnetic properties within nanometer size and relatively low
toxicity. Surface active group of SPIONs are mostly responsible for these
advantages. In this thesis, we studied biofunctionalization of iron oxide
magnetic nanoparticles with variety of peptide molecules for the solubilization
and biofunctionalization of SPIONs. Particle synthesis was carried out via two
methods: co-precipitation and thermal decomposition and they were compared
by means of size and stability. Several characterization methods, such as
Fourier Transform Infrared Spectroscopy (FT-IR), Circular Dichroism (CD),
Rheology, X-ray diffraction (XRD) X-ray photon spectroscopy (XPS), vibrating

iv
sample magnetometer (VSM), Magnetic resonance imaging (MRI), Atomic
Force Microscopy (AFM), Scanning Electron Microscopy (SEM), Transmission
Electron Microscopy (TEM) were used in order to fully characterized the
SPIONs prepared.methods were used in order to fully characterize the SPIONs.
Thermal decomposition is the best method to control the particle size and avoid
aggregation problems. Peptide amphiphile molecules are used to non-covalently
functionalize SPIONs synthesized by thermal decomposition method to provide
water solubility and biocompatibility. Particles are found to be around 35 nm
with r2 values of 100.4 and 93.7 s-1
mM-1
which are comparable with
commercially available SPIONs. In vitro cell culture experiments revealed that
peptide-SPION complexes are biocompatible and are localized around the cells
due to their peptide coating. Finally, SPIONs were evaluated in terms of their
potential use as MRI contrast agent.
Keywords: Magnetite, maghemite, MRI, superparamagnetic, bioactive, peptide
amphiphile, iron oxide, contrast agent, non-covalent interactions, thermal
decomposition, co-precipitation.
v
ÖZET
SÜPERPARAMANYETİK DEMİR OKSİT
NANOPARÇACIKLARIN BİYOİŞLEVSELLEŞTİRİLMESİ
Selim Sülek
Malzeme Bilimi ve Nanoteknoloji Programı, Yüksek Lisans
Tez Yöneticisi: Prof. Dr. Salim ÇIRACI
Temmuz, 2011
Manyetik rezonans görüntüleme tekniği sunduğu invazif olmayan görüntüleme
kapasitesi nedeniyle büyük ilgi çekmektedir. Manyetik rezonans görüntüleme
tekniğinde istenilen dokunun görüntülenmesi için kontrast ajanları
kullanabilmektir. Yaygın olarak kullanılan gadolinyum tabanlı kontrast ajanları,
yüksek toksik özellikler ve de yüksek deteksiyon seviyeleri nedeniyle
eleştirilmektedirler. Süperparamanyetik demir oksit nanoparçacık tabanlı
kontrast ajanları, sahip oldukları nanometre ölçeğinde gösterdikleri üstün
manyetik kuvvet ve düşük toksik özellikleri sayesinde gadolinyum tabanlı
kontrast ajanlarına güzel bir alternatiftirler. Parçacıkların yüzeyinde bulunan
aktif biyoaktif moleküller bu avantajların sağlanmasında büyük rol
oynamaktadır. Sunulan bu çalışmada, demir oksit nanoparçacıklarının ko-
presipitasyon ve termal dekompozisyon yöntemleri ile sentezlenmesi ve
vi
yüzeylerinin fonksiyonalizasyonu gösterilmiştir. Elde edilen parçacıklar Fourier
Transform Kızılötesi Spektroskopisi (FT-IR), Circular Dichroism (CD), Reoloji,
X-Işını Saçılım Spekroskopisi (XRD), X-ray fotoelektron spektroskopisi (XPS),
titreşimli örnek manyetometresi (VSM), manyetik rezonans görüntüleme tekniği
(MRI) Atomik Kuvvet Mikroskopu (AFM), Taramalı Elektron Mikroskopu
(SEM), Geçirmeli Elektron Mikroskopu (TEM) ile elde edilmiş ayrıca
sentezlenen parçacıkların biyolojik örnekler ile etkileşimi incelenmiştir. ile
karakterize edilmiş ve sentezlenen parçacıkların biyolojik örnekler ile etkileşimi
incelenmiştir. Elde edilen sonuçlara göre termal dekompozisyon yöntemi hem
parçacık büyüklüğünün kontrolü hem de topaklaşmanın önlenmesi için en uygun
yöntemdir. Termal dekompozisyon yöntemi ile sentezlenmiş parçacıkların
kaplanması için amfifilik peptitler kullanılmıştır. Hidrofobik etkileşim
prensibine dayanan bu yöntem ile parçacıklara suda çözünebilirlik ve
biyoaktiflik kazandırılmıştır. Sentezlenen parçacıklar 35 nm civarlarında olup r2
değerleri 100.4 ve 93.7 s-1
mM-1
olduğunu göstermektedir. Elde edilen in vitro
sonuçlara göre parçacıkların biyouyumlu olduğu ve hücrenin çevresinde
toplandığı gözlemlenmiştir. Sentezlenen parçacıkların MRI contrast ajanı
kullanımı MR aletiyle ölçülmüştür.
Anahtar Sözcükler: Manyetit, maghemit, MRI, süperparamanyetik,
biyofonksiyonel, amfifilik peptid, demir oksit, kontrast ajanı, kovalent olmayan
etkileşimler, termal dekompozisyon, ko-presipitasyon.
vii
ACKNOWLEDGMENT
I would like to express my gratitude to my supervisor Assist. Prof. Dr. Mustafa
Özgür Güler for his guidance in this research.
I would like to thank to Büşra Mammadov and Davut İbrahim Mahçiçek for
their partnership in this research.
I would like to express my special thanks to Assist. Prof. Dr. Ayşe Begüm
Tekinay, Prof. Dr. Ergin Atalar, Assoc. Prof. Dr. Hüseyin Sözeri, Assoc. Prof.
Dr. Muhammet Toprak and Assoc. Prof. Dr. Aykutlu Dâna for their support and
sharing their knowledge.
I want to thank to my group members Rukan Genç, Handan Acar, Ruslan
Garifullin, Sıla Toksöz, Turan Selman Erkal, Zeliha Soran, Oya Ustahüseyin,
Okan Öner Ekiz and Adem Yıldırım. It was wonderful to work with them.
I would like to thank to UNAM (National Nanotechnology Research Center)
and TÜBİTAK (The Scientific and Technological Research Council of Turkey)
grant number 109S386 for financial support, UMRAM (National Institute of
Magnetic Resonance Imaging) and UME (National Metrology Institute) for help
with characterizations.

viii
Dedicated to
My dearest Family
ix
LIST OF ABBREVIATIONS
PA: Peptide Amphiphile
MRI: Magnetic Resonance Imaging
SPION: Superparamagnetic iron oxide nanoparticles
IOP : Iron Oxide Nanoparticles
T1: Longitudinal Relaxation
T2: Transversal Relaxation
FMOC: 9-Fluorenylmethoxycarbonyl
HBTU: 2-(1H-Benzotriazol-1-yl)-1,1,3,3-tetramethyluronium
hexafluorophosphate
DIEA: N, N-Diisopropylethylamine
DMF: Dimethylformamide
TFA: Trifluoroacetic Acid
TIS: Triisopropylsilane
MTBS: Mono-tert-Butyl Succinate
APTES: (3-Aminopropyl)triethoxysilane
Fe(acac)3 : Iron (III) acetylacetonate
x
LC-MS: Liquid Chromatography-Mass Spectrometry
AFM: Atomic Force Microscopy
TEM: Transmission Electron Microscopy
FT-IR: Fourier Transform Infrared Spectroscopy
SEM: Scanning Electron Microscopy
CA: Contrast Agent
VSM: Vibrating Sample Magnetometer
XRD: X-Ray Diffraction Spectroscopy
DLS: Dynamic light Scattering
r2: Transverse relaxivity
r1: longitudinal relaxivity
Mag-TE: Magnetic Tissue Engineering
Ms: Magnetic Saturation
xi
TABLE OF CONTENTS
INTRODUCTION .............................................................................................. 1
1.1. INTRODUCTION ..................................................................................... 1
1.2. Superparamagnetism ..................................................................................... 3
1.3. Synthesis of SPIONs ..................................................................................... 6
1.4. Surface Modification of SPIONs .................................................................. 9
1.5. Applications of SPIONs in Medicine .......................................................... 12
1.5.1. MRI .......................................................................................................... 12
1.5.2. Magnetic Tissue Engineering ................................................................... 15
EXPERIMENTAL SECTION ........................................................................ 17
2.1 General Methods .......................................................................................... 17
2.2. Materials ...................................................................................................... 18
2.3. Synthesis of Peptides ................................................................................... 18
2.4. Superparamagnetic Iron Oxide Nanoparticle Synthesis via Thermal
Decomposition Method ...................................................................................... 19
2.5. Non-covalent Functionalization of Superparamagnetic Iron Oxide
Nanoparticles ...................................................................................................... 19
2.6. SPION’s Surface Modification with APTES .............................................. 20
2.7. SPION Synthesis via Co-Precipitation Method .......................................... 21
2.8. Protein Conjugation Studies ........................................................................ 21
xii
2.9. Characterization of Iron Oxide Nanoparticles ............................................. 22
Dynamic Light Scattering ...................................................................................... 22
X-Ray Diffraction (XRD) ...................................................................................... 22
FT-IR ..................................................................................................................... 22
Transmission ElectronMicroscopy ........................................................................ 23
Cell Viability.......................................................................................................... 23
Prussian Blue Staining ........................................................................................... 24
Magnetic Resonance Imaging ................................................................................ 24
RESULTS AND DISCUSSIONS .................................................................... 26
3.1. Synthesis of SPIONs ................................................................................... 26
3.1.1. Synthesis of SPIONs via Co-Precipitation Method ..................................... 26
3.1.2 Synthesis of SPIONs with Thermal Decomposition Method ....................... 31
3.2. Peptide Amphiphiles ................................................................................... 35
3. 3. Synthesis of Peptide-SPION Complex and Their Physicochemical
Properties ............................................................................................................ 48
3.4. Surface Modification of SPIONs with APTES molecules .......................... 58
3.5. Cellular Interaction of functionalized SPIONs ........................................... 60
3.6 Conjugation of SPIONs with Proteins.......................................................... 65
CONCLUSIONS AND FUTURE DIRECTION ........................................... 73
4.1. Conclusion ................................................................................................... 73
4.2 Future Direction ........................................................................................... 76
REFERENCES ................................................................................................. 78
xiii
LIST OF FIGURES
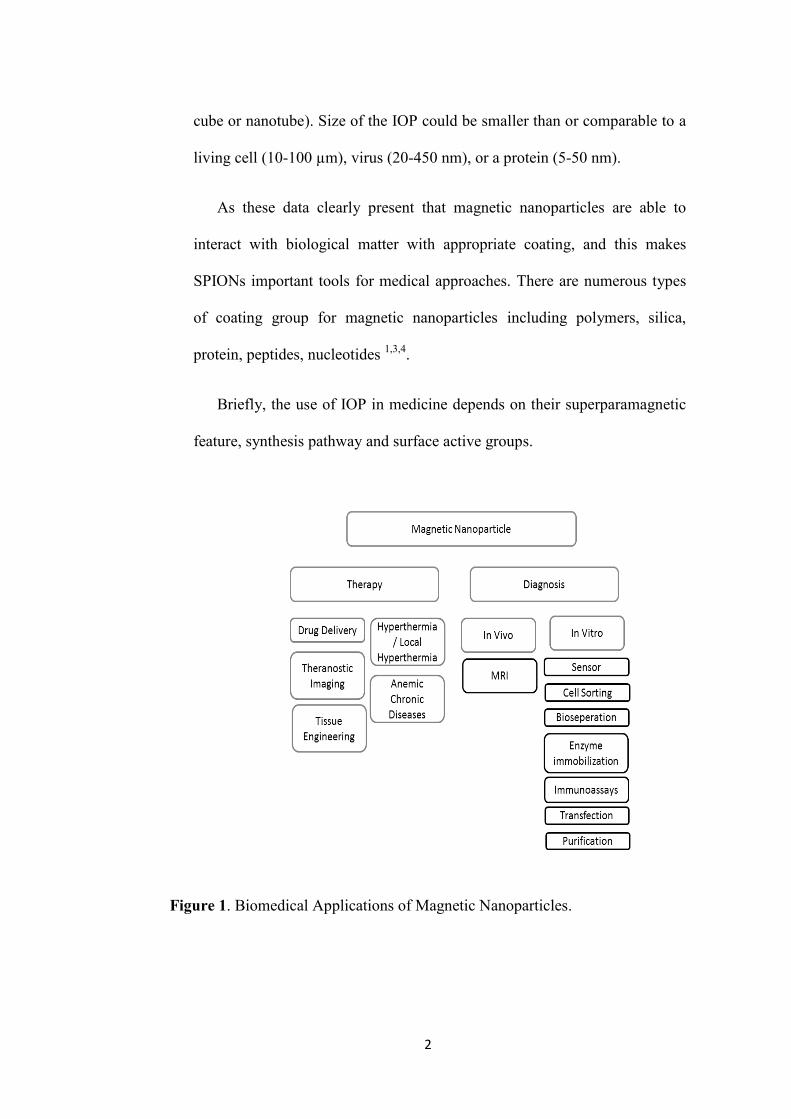
Figure 1. Biomedical Applications of Magnetic Nanoparticles. .......................... 2
Figure 2. A typical hysteresis loop of magnetic materials. ................................ 5
Figure 3. Hysterysis loop of superparamagnetic materials.. ................................ 5
Figure 4. LaMer plot illustrating the nucleation and growth during the synthesis.
Picture is adapted with permission from references 9 .................................. 7
Figure 5. A schematic representation of SPIONs synthesized by thermal
decomposition method. ................................................................................. 9
Figure 6. Schematic representation of MRI working principles ........................ 15
Figure 7. SEM image representing the large aggregations of SPIONs when they
synthesized with co-precipitation method. .................................................. 28
Figure 8. The FT-IR spectrum of SPIONs synthesized by co-precipitation
method. ........................................................................................................ 29
Figure 9. The FT-IR graphic of mono tert-butyl succinate functionalized
SPIONs.. ...................................................................................................... 29
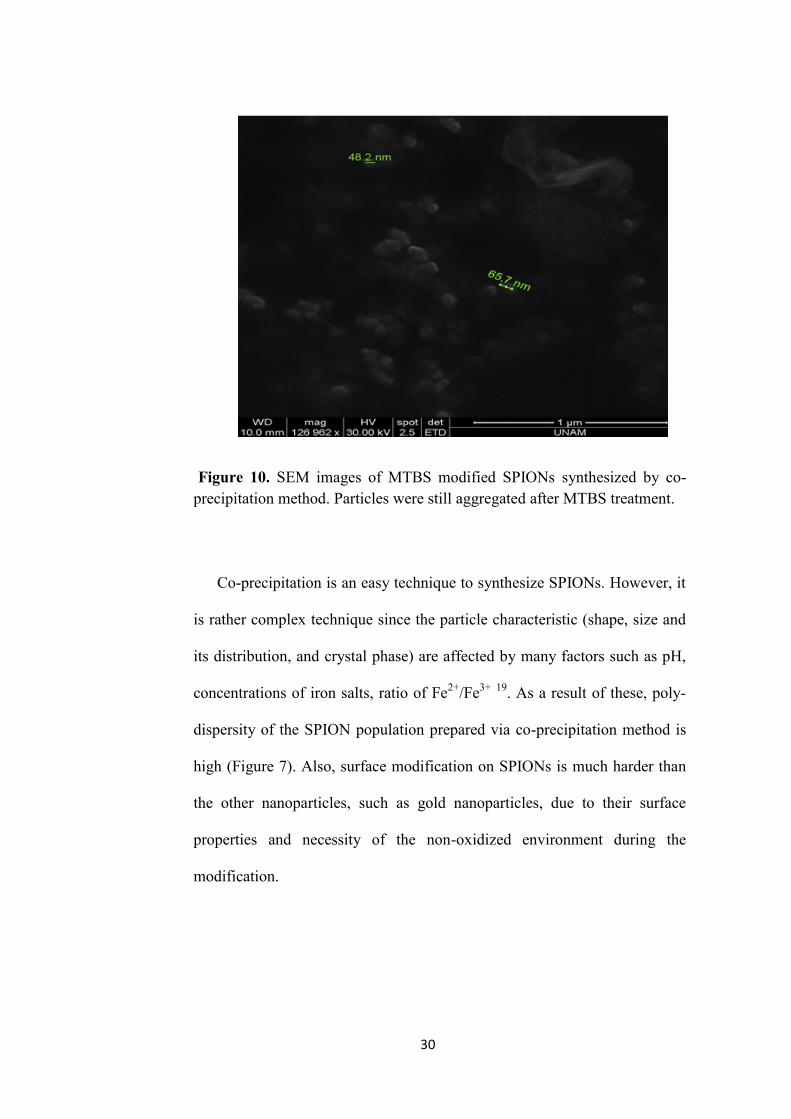
Figure 10. SEM images of MTBS modified SPIONs synthesized by co-
precipitation method. .................................................................................. 30
Figure 11. Characteristics of SPIONS synthesized via thermal decomposition
method: a) Hydrodynamic size of the SPIONs, b) TEM images ............... 33
Figure 12. a) XRD spectrum graphic and b) XPS spectrum of SPIONs
synthesized with thermal decomposition method ....................................... 34
xiv
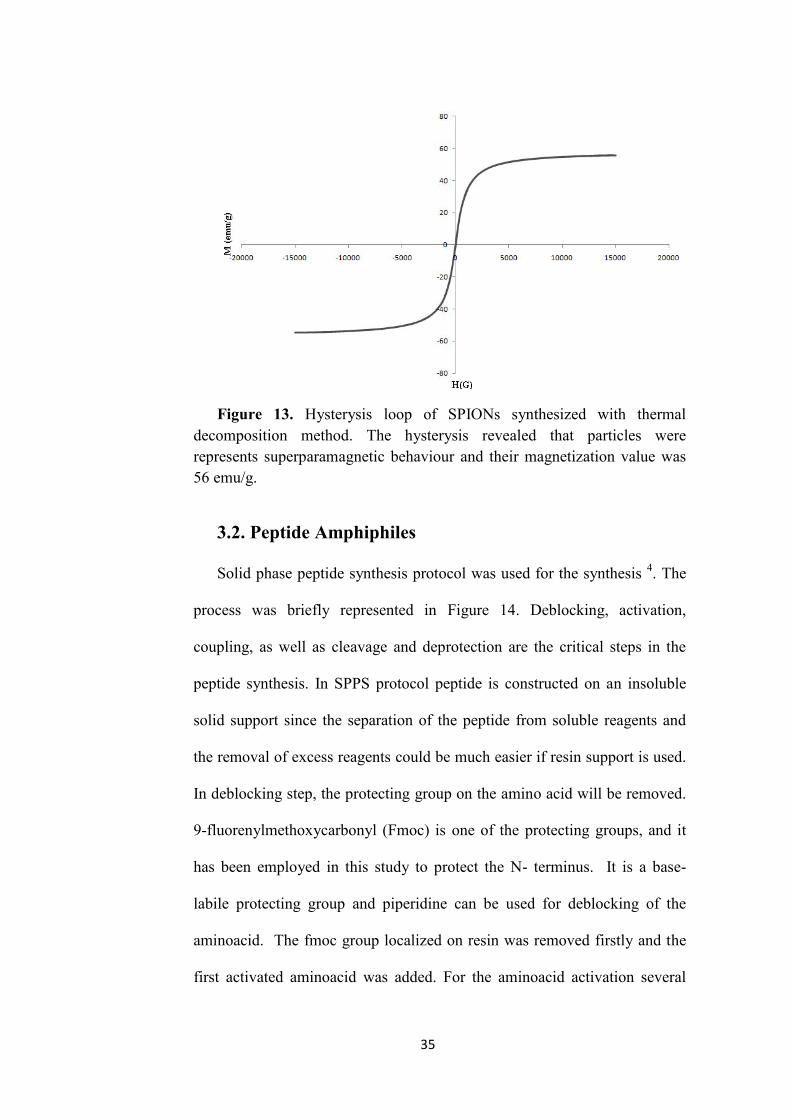
Figure 13. Hysterysis loop of SPIONs synthesized with thermal decomposition
method. ....................................................................................................... 35
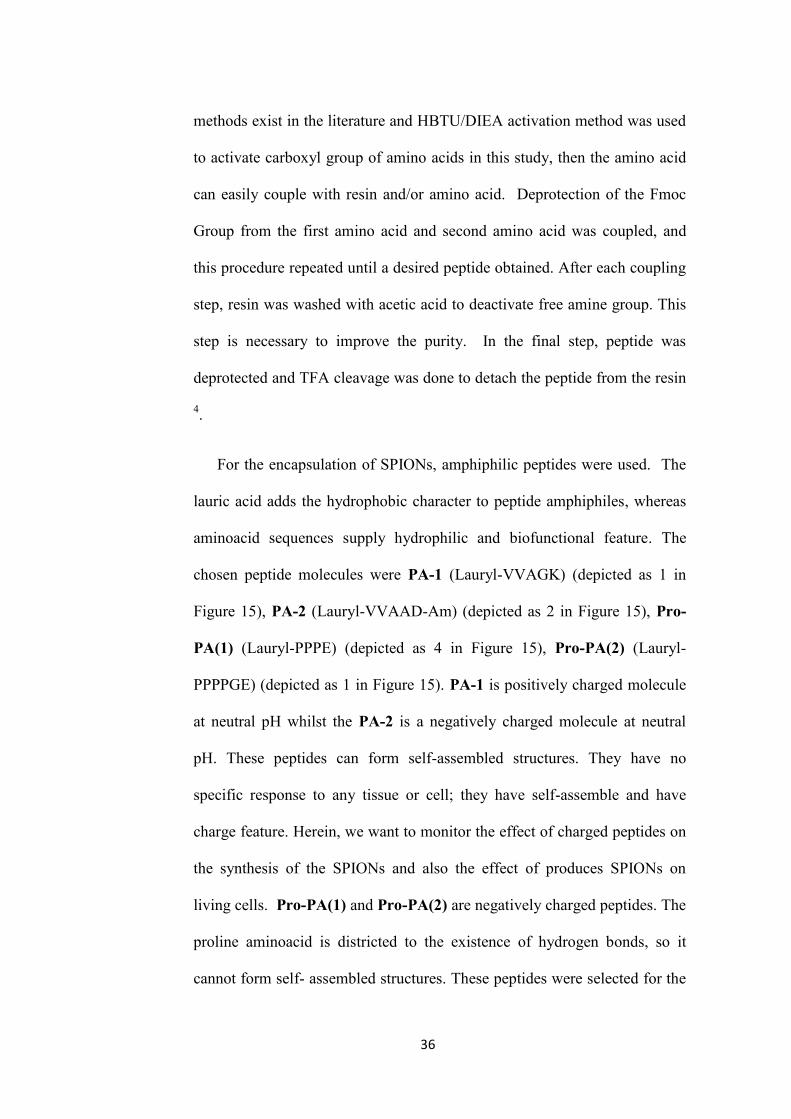
Figure 14. A schematic representation of solid phase peptide synthesis.. ......... 38
Figure 15. Chemical representation of PAs used for surface modification of
SPIONs in order to increase their solubility in water and biocompatibility:
1) amide functionalized PA-1, 2) carboxylic acid functionalized PA-2; and
carboxylic acid functionalized 3) Pro-PA(2) and 4) Pro-PA(1) which do not
form hydrogen bond because of proline sequences. ................................... 39
Figure 16. RP-HPLC chromatogram of PA-1. ................................................... 40
Figure 17. Mass spectrometry of the PA-1. ........................................................ 41
Figure 18. RP-HPLC chromatogram of PA-2. ................................................... 42
Figure 19. Mass spectrometry of PA-2. ............................................................. 43
Figure 20. RP-HPLC chromatogram of Pro-PA(2). ........................................... 44
Figure 21. Mass spectrometry of Pro-PA(2). ..................................................... 45
Figure 22. RP-HPLC chromatogram of Pro-PA(1). ........................................... 46
Figure 23. Mass spectrometry of Pro-PA_1. ...................................................... 47
Figure 24. Non-covalent functionalization of SPIONs with peptide amphiphile
molecules.. .................................................................................................. 49
Figure 25. Dichloromethane (DCM)-water phase image of lauric acid coated
SPIONs b) TEM image of lauric acid coated SPION c) DCM-water phase
image of PA1-SPION complex d) TEM image of PA1-SPION complex e)
xv
DCM-water phase image of PA2-SPION f) TEM image of PA2-SPION g)
XRD pattern of lauric acid coated SPION, PA1-SPION and PA2-SPION..
..................................................................................................................... 51
Figure 26. TEM image of PA1-SPION complex stained with uranyl acetate. b)
TEM image of PA2-SPION complex stained with phosphotungstic acid. . 52
Figure 27. FT-IR spectra of SPION, PA1-SPION and PA2-SPION. ................. 52
Figure 28. Hysteresis loop graphs of PA1-SPION, PA2-SPION and SPION
obtained by VSM. ....................................................................................... 53
Figure 29. Gel Electrophoresis Results of Pro-PA(2) functionalized SPIONs. . 54
Figure 30. UV spectrum of peptide-SPION solutions before and after washing
step. ............................................................................................................. 55
Figure 31. Contrast images of the peptide-SPION complexes measured at TR=
3000 ms and TE=50 ms (top). Relaxation rates (1/T2, s-1) of PA1-SPION
and PA2-SPION versus iron concentration in water in a magnetic field of 3
T at room temperature (bottom) .................................................................. 57
Figure 32. FT-IR spectrum graphic of APTES modified SPIONs.. ................... 59
Figure 33. Hydrodynamic size of the APTES modified SPIONs measured with
DLS. .......................................................................................................... 60
Figure 34. Zeta potential graphic of APTES modified SPIONs.. ...................... 60
Figure 35. Cell Viability results of PA1-SPION and PA2-SPION incubated
cells. ............................................................................................................ 62
Figure 36. Cell viability result of PA1 and PA2 incubated cells.. ..................... 63
xvi
Figure 37. Cellular localization images of a) PA1-SPION b) PA2-SPION c)
Negative Control.. ....................................................................................... 64
Figure 38. Representative scheme of conjugation studies. ................................ 66
Figure 39. Hydrodynamic Size of the Pro-PA(1)-SPION complex measured with
DLS.. ........................................................................................................... 67
Figure 40. Zeta Potential graphic of Pro-PA(1)SPION complexes measured with
DLS.. ........................................................................................................... 68
Figure 41. Hydrodynamic Size of the protein conjugated SPIONs measured with
DLS. ............................................................................................................ 68
Figure 42. Zeta Potential graphic of protein conjugated SPIONs measured with
DLS. ............................................................................................................ 68
Figure 43. FT-IR spectrum of Pro-PA(1)-SPION and protein conjugated
SPION.. ....................................................................................................... 69
Figure 44. Hydrodynamic size of the SPIONs modified with APTES measured
with DLS. .................................................................................................... 70
Figure 45. Zeta Potential graphic of SPIONS modified with APTES measured
with DLS. .................................................................................................... 70
Figure 46. Zeta Potential graphic of biotin conjugated SPIONs measured with
DLS. ............................................................................................................ 71
Figure 47. Hydrodynamic Size of the protein conjugated APTES-SPIONs
measured with DLS. .................................................................................... 71
Figure 48. FT-IR graph of APTES modified and biotin conjugated SPIONs.. .. 72

xvii
Figure 49. Fluorescence microscopy images of FITC labeled streptavidin biotin
conjugated SPION interaction. ................................................................... 72

xviii
LIST OF TABLES
Table 1. Physicochemical properties of peptide-SPION complexes .................. 58
1
CHAPTER 1
INTRODUCTION
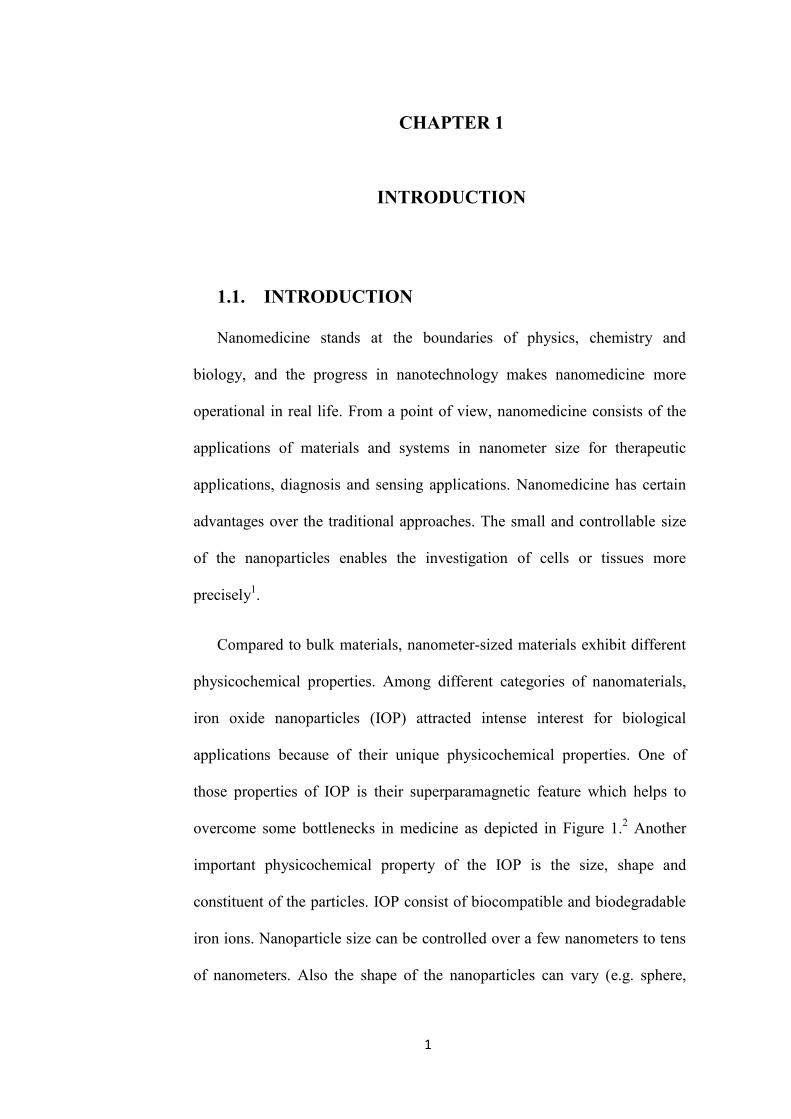
1.1. INTRODUCTION
Nanomedicine stands at the boundaries of physics, chemistry and
biology, and the progress in nanotechnology makes nanomedicine more
operational in real life. From a point of view, nanomedicine consists of the
applications of materials and systems in nanometer size for therapeutic
applications, diagnosis and sensing applications. Nanomedicine has certain
advantages over the traditional approaches. The small and controllable size
of the nanoparticles enables the investigation of cells or tissues more
precisely1.
Compared to bulk materials, nanometer-sized materials exhibit different
physicochemical properties. Among different categories of nanomaterials,
iron oxide nanoparticles (IOP) attracted intense interest for biological
applications because of their unique physicochemical properties. One of
those properties of IOP is their superparamagnetic feature which helps to
overcome some bottlenecks in medicine as depicted in Figure 1.2 Another
important physicochemical property of the IOP is the size, shape and
constituent of the particles. IOP consist of biocompatible and biodegradable
iron ions. Nanoparticle size can be controlled over a few nanometers to tens
of nanometers. Also the shape of the nanoparticles can vary (e.g. sphere,
2
cube or nanotube). Size of the IOP could be smaller than or comparable to a
living cell (10-100 µm), virus (20-450 nm), or a protein (5-50 nm).
As these data clearly present that magnetic nanoparticles are able to
interact with biological matter with appropriate coating, and this makes
SPIONs important tools for medical approaches. There are numerous types
of coating group for magnetic nanoparticles including polymers, silica,
protein, peptides, nucleotides 1,3,4
.
Briefly, the use of IOP in medicine depends on their superparamagnetic
feature, synthesis pathway and surface active groups.
Figure 1. Biomedical Applications of Magnetic Nanoparticles.
3
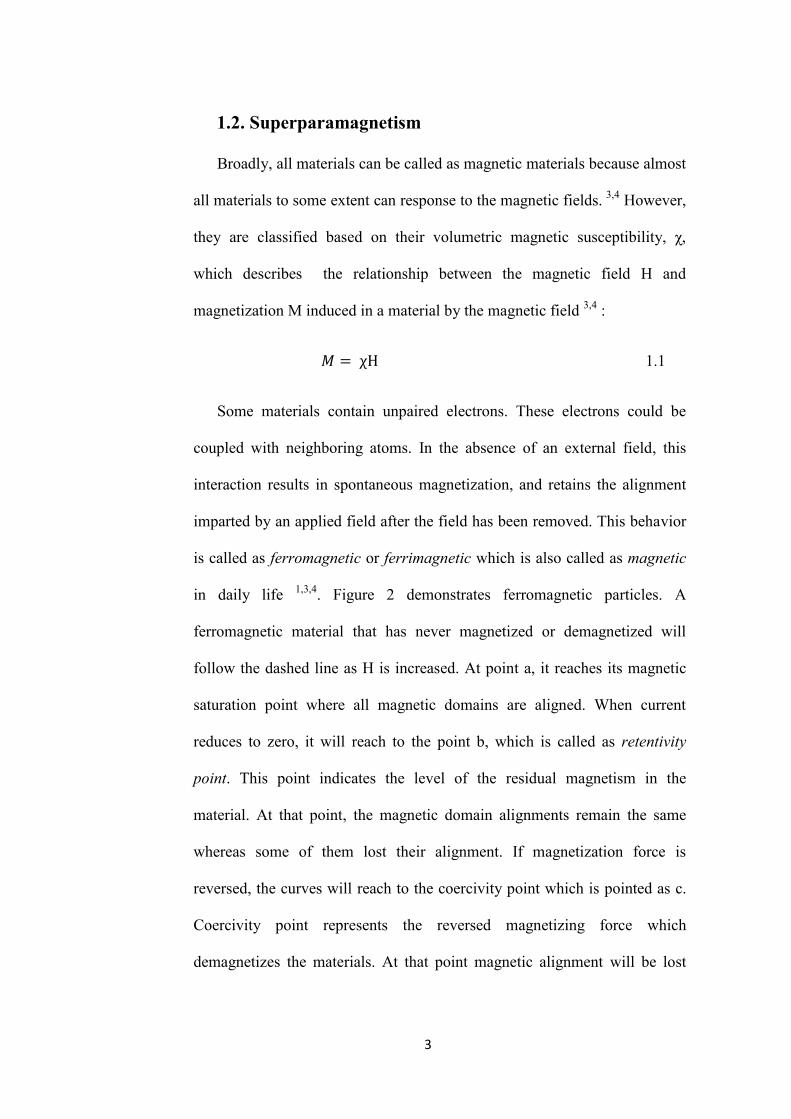
1.2. Superparamagnetism
Broadly, all materials can be called as magnetic materials because almost
all materials to some extent can response to the magnetic fields. 3,4
However,
they are classified based on their volumetric magnetic susceptibility, χ,
which describes the relationship between the magnetic field H and
magnetization M induced in a material by the magnetic field 3,4
:
1.1
Some materials contain unpaired electrons. These electrons could be
coupled with neighboring atoms. In the absence of an external field, this
interaction results in spontaneous magnetization, and retains the alignment
imparted by an applied field after the field has been removed. This behavior
is called as ferromagnetic or ferrimagnetic which is also called as magnetic
in daily life 1,3,4
. Figure 2 demonstrates ferromagnetic particles. A
ferromagnetic material that has never magnetized or demagnetized will
follow the dashed line as H is increased. At point a, it reaches its magnetic
saturation point where all magnetic domains are aligned. When current
reduces to zero, it will reach to the point b, which is called as retentivity
point. This point indicates the level of the residual magnetism in the
material. At that point, the magnetic domain alignments remain the same
whereas some of them lost their alignment. If magnetization force is
reversed, the curves will reach to the coercivity point which is pointed as c.
Coercivity point represents the reversed magnetizing force which
demagnetizes the materials. At that point magnetic alignment will be lost
4
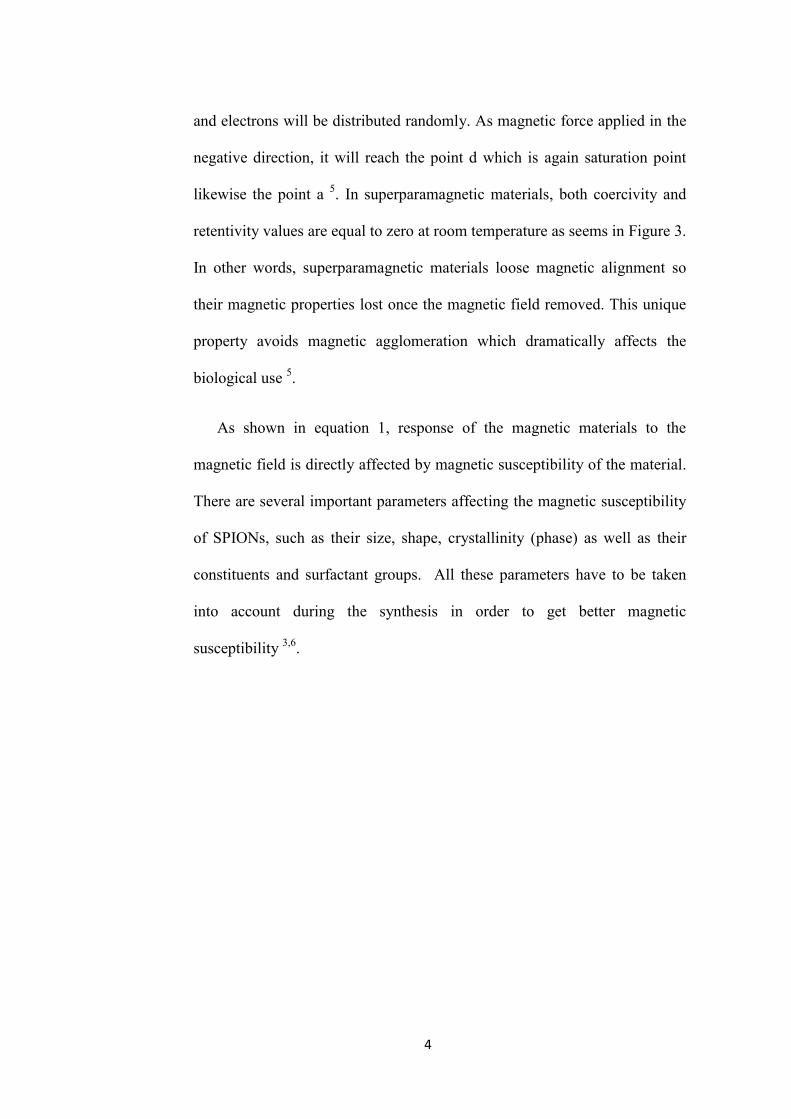
and electrons will be distributed randomly. As magnetic force applied in the
negative direction, it will reach the point d which is again saturation point
likewise the point a 5. In superparamagnetic materials, both coercivity and
retentivity values are equal to zero at room temperature as seems in Figure 3.
In other words, superparamagnetic materials loose magnetic alignment so
their magnetic properties lost once the magnetic field removed. This unique
property avoids magnetic agglomeration which dramatically affects the
biological use 5.
As shown in equation 1, response of the magnetic materials to the
magnetic field is directly affected by magnetic susceptibility of the material.
There are several important parameters affecting the magnetic susceptibility
of SPIONs, such as their size, shape, crystallinity (phase) as well as their
constituents and surfactant groups. All these parameters have to be taken
into account during the synthesis in order to get better magnetic
susceptibility 3,6
.

5
Figure 2. A typical hysteresis loop of magnetic materials. Picture is adapted
with permission from NDT group 5
Figure 3. Hysterysis loop of superparamagnetic materials. When a magnetic
field applied to superparamagnetic materials, the hysterysis follows a similar
pattern within positive and negative direction.
6
1.3. Synthesis of SPIONs
Numerous methods have been developed to synthesize magnetic
nanoparticles, and the most wildly used examples are sonochemical
reactions, co-precipitation reactions, hydrothermal reactions and thermal
decomposition 7,8
.
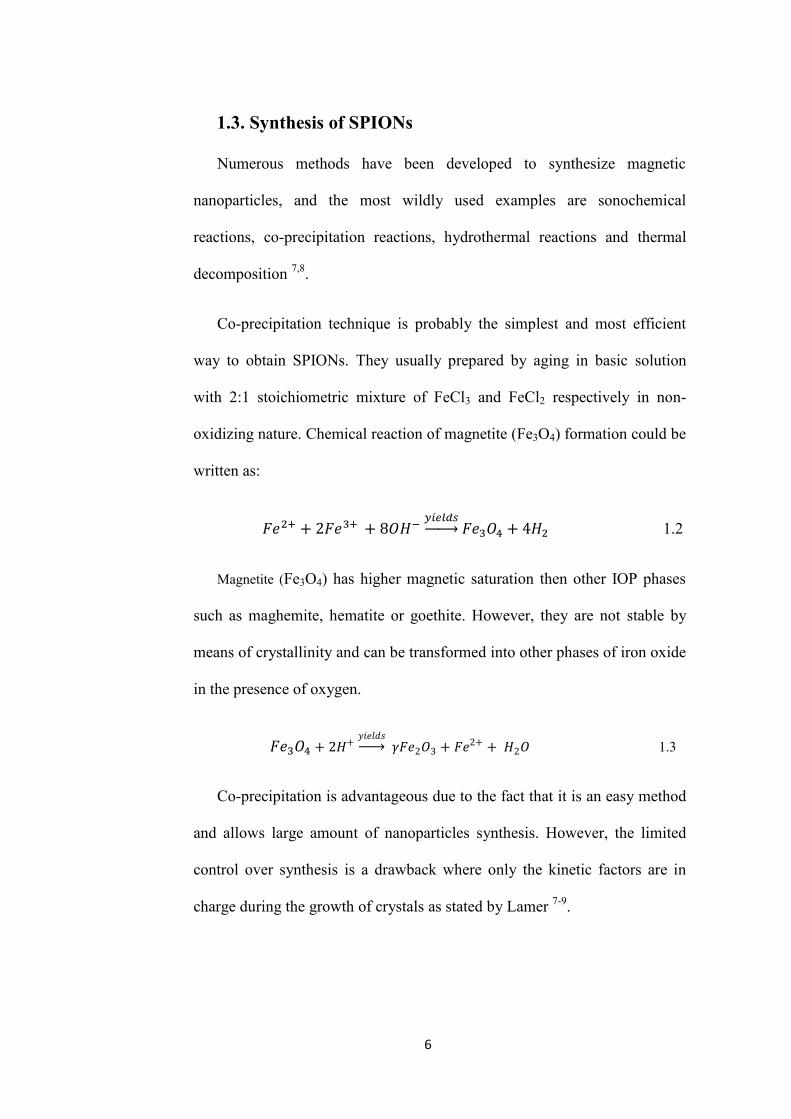
Co-precipitation technique is probably the simplest and most efficient
way to obtain SPIONs. They usually prepared by aging in basic solution
with 2:1 stoichiometric mixture of FeCl3 and FeCl2 respectively in non-
oxidizing nature. Chemical reaction of magnetite (Fe3O4) formation could be
written as:
1.2
Magnetite (Fe3O4) has higher magnetic saturation then other IOP phases
such as maghemite, hematite or goethite. However, they are not stable by
means of crystallinity and can be transformed into other phases of iron oxide
in the presence of oxygen.
1.3
Co-precipitation is advantageous due to the fact that it is an easy method
and allows large amount of nanoparticles synthesis. However, the limited
control over synthesis is a drawback where only the kinetic factors are in
charge during the growth of crystals as stated by Lamer 7-9
.
7
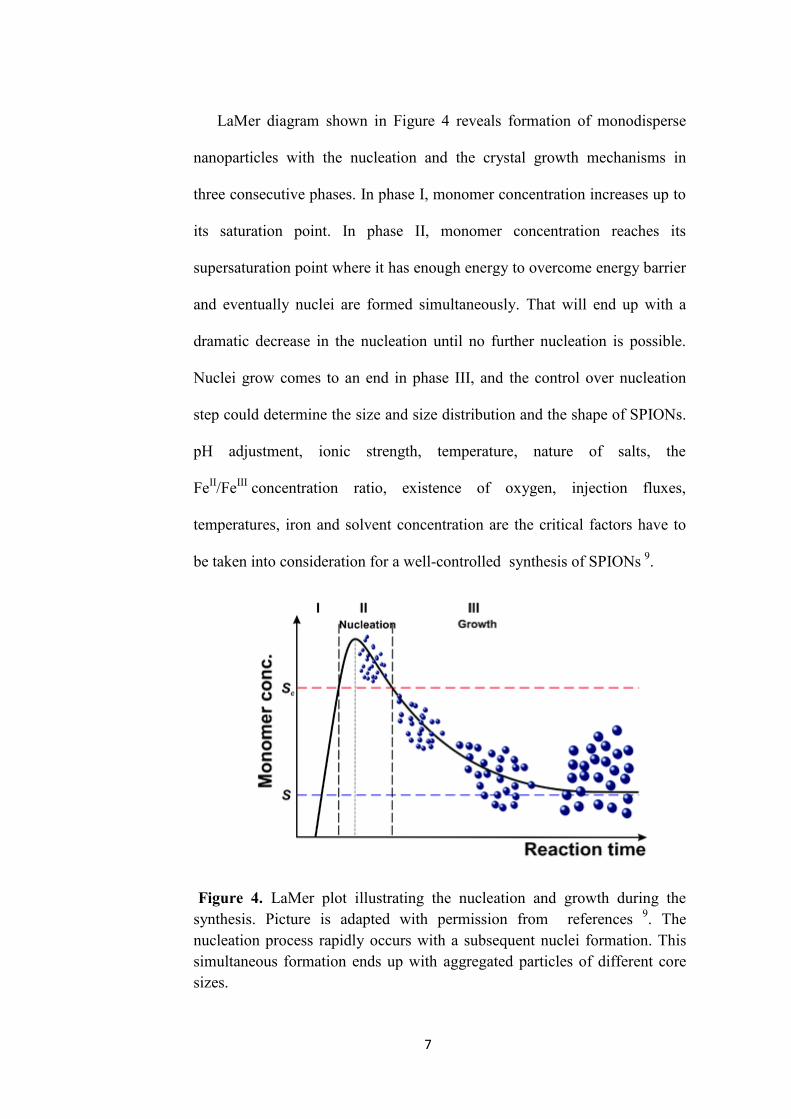
LaMer diagram shown in Figure 4 reveals formation of monodisperse
nanoparticles with the nucleation and the crystal growth mechanisms in
three consecutive phases. In phase I, monomer concentration increases up to
its saturation point. In phase II, monomer concentration reaches its
supersaturation point where it has enough energy to overcome energy barrier
and eventually nuclei are formed simultaneously. That will end up with a
dramatic decrease in the nucleation until no further nucleation is possible.
Nuclei grow comes to an end in phase III, and the control over nucleation
step could determine the size and size distribution and the shape of SPIONs.
pH adjustment, ionic strength, temperature, nature of salts, the
FeII/Fe
III concentration ratio, existence of oxygen, injection fluxes,
temperatures, iron and solvent concentration are the critical factors have to
be taken into consideration for a well-controlled synthesis of SPIONs 9.
Figure 4. LaMer plot illustrating the nucleation and growth during the
synthesis. Picture is adapted with permission from references 9. The
nucleation process rapidly occurs with a subsequent nuclei formation. This
simultaneous formation ends up with aggregated particles of different core
sizes.
8
Another important synthesis method is hydrothermal synthesis.
Reactions are performed in the aqueous media in autoclave where the
pressure can be higher than 2000 psi and the temperature can reach above
200 ºC. In hydrothermal reactions, particle size can be tailored simply by
temperature where ultrafine SPIONs can easily be synthesized 7,8
.
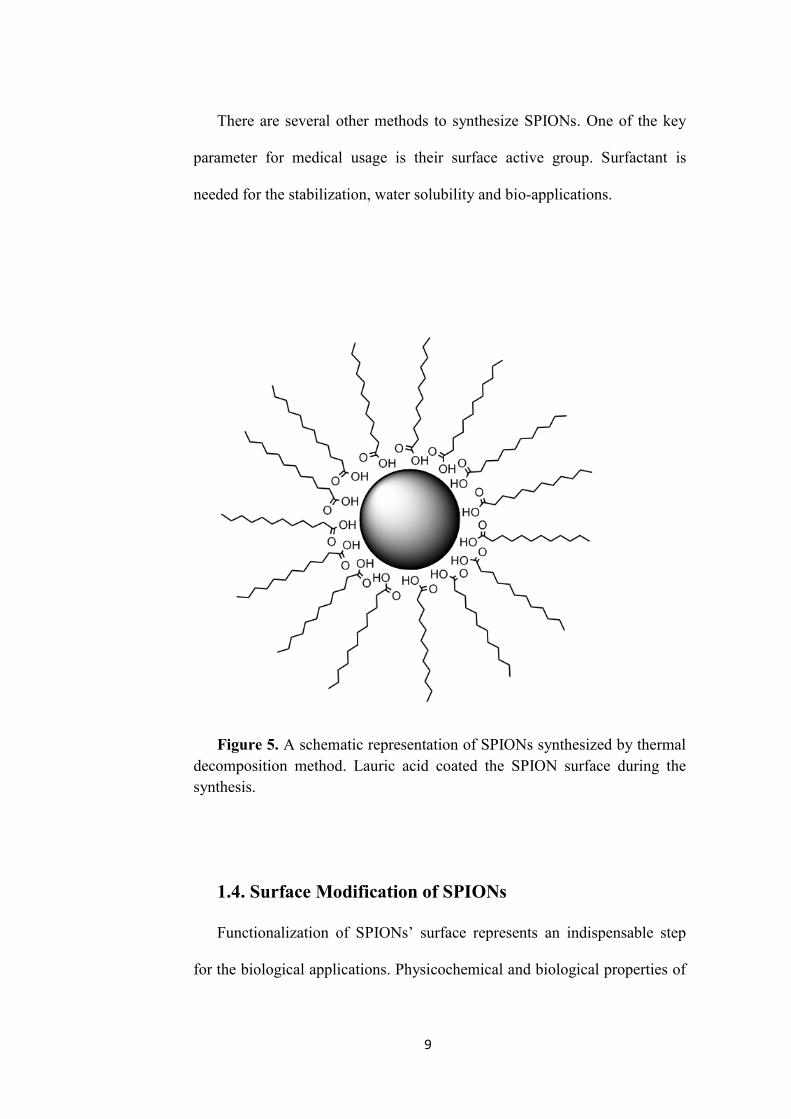
Thermal decomposition method is the best method to control the size and
monodispersity of the synthesized nanoparticles. For many variations of
thermal decomposition method, many different solvents and surfactants are
used. Numerous types of thermal decomposition method have been
developed. Sun et al. described a high temperature mediated reaction of
Fe(acac)3 with 1,2-hexadecanediol in the presence of oleic acid and
oleylamine. Resulting nanoparticles were monodisperse and size could be
tuned from 4 nm to 20 nm 10
. Size of the SPIONs synthesized using thermal
decomposition method depends strongly to reaction temperature, iron to
surfactant ratio and reaction time which are easily controllable. SPIONs
synthesized by thermal decomposition method is soluble in organic solvents
because SPIONs are stabilized and protected from aggregation by surfactant
surface coating through the polar head group of the surfactant attached to the
hydrophobic tail extending away from the SPIONs as shown in Figure 5
3,4,7,8,10.
9
There are several other methods to synthesize SPIONs. One of the key
parameter for medical usage is their surface active group. Surfactant is
needed for the stabilization, water solubility and bio-applications.
Figure 5. A schematic representation of SPIONs synthesized by thermal
decomposition method. Lauric acid coated the SPION surface during the
synthesis.
1.4. Surface Modification of SPIONs
Functionalization of SPIONs’ surface represents an indispensable step
for the biological applications. Physicochemical and biological properties of
10
SPIONs can be tailored with their surface active groups 11
. In the absence of
any surfactant, SPIONs tend to agglomerate due to a physical phenomenon
explained by DLVO theory 12
.
DLVO theory suggests that stability of a particle is dependent upon its
total potential energy function VT. According to the theory, VT is the balance
between several factors which are solvent potential energy Vs, attractive
forces VA and repulsive forces VS :
1.4
According to DLVO theory, stability of the colloidal nanoparticles
determined by the balances between the Van der Waals (VA) and electrical
double layer repulsive (VR) forces exist between nanoparticles. If the
repulsive forces between the particles are sufficient, the dispersion will resist
to flocculation and it will stabilized the colloidal nanoparticles 13
. Herein,
bare nanoparticles have not sufficient repulsive forces so that eventually
aggregation takes places 14
.
Moreover, in the presence of salts or any other electrolytes in the
biological media, electrostatic stabilization arising from the SPIONs’ surface
charge falls behind the adequate level to overcome the attractive forces
between two NPs and leads larger aggregates which can easily be removed
by reticuloendothelial system and/or by opsonization 14
.
The most applied surfactant types for steric stabilization of particles are
polymers 7. Polymers can provide stability against agglomeration and
11
opsonization. Also it provides surface groups which can be used for
biological functionalization of NPs with proteins, peptides and hyaluronic
acids. Poly(ethylene glycol) and dextran are most common polymer types
for not only coating of SPIONs but also all nanoparticles due their high
biocompability. Poly(ethylene glycol) also reveals antifouling properties
that reduces their uptake by macrophages and extends their blood
circulation time 15
.
Another trend for the SPION functionalization is the core-shell structure
16. These core-shell structures offer a potential in such areas as theranostic
imaging, delivery agent and sensor applications, better biocompatibility, and
better stability in aqueous solutions 1,4
.
First and the most common core shell structures are SPION core silica
shell structures in which silica comes with some advantages, such as better
biocompatibility, easy coating process, chemical inertness and optical
transparency as well as better stability in aqueous solutions and controlled
porosity. The thickness of the silica coat can be tuned in a range of 10-100
nm by varying the concentration of ammonium and the ratio of
tetraethoxysilane (TEOS) which have unique porous structure. Controlled
porosity of the resulting structure offers some advantages in encapsulation of
other molecules like drugs, inorganic nanoparticles and dyes within the
complex. These encapsulated nanoparticles can be promising tools with a
potential use in dual imaging and/or theranostic applications 17
.
12
Other core-shell structures are metals/metal oxides. These
SPIONs core-shell structure can offer semiconducting, plasmonic, specific
affinity and magneto-optical properties. For that purposes SPIONs can be
coated with gold, TiO2, CdSe and/or CdTe. These structures can especially
be used for biosensor applications 16
.
1.5. Applications of SPIONs in Medicine
SPIONs offer some attractive possibilities in medicine and come up with
several advantages. The first advantage is the controllable size of SPIONs
ranging from a few nanometers up to tens of nanometers. This feature led
them to be close to biological entities which are in same dimension in size
perspective. Another important point is that SPIONs can be manipulated by
an external magnetic field. This action at a distance feature can be combined
with many applications such as MRI, delivery vehicles, therapeutic
applications, theranostic applications, sensor applications, tissue engineering
applications and purification & isolation applications 1.
1.5.1. MRI
MRI is one of the most powerful non-invasive imaging techniques in
clinical use. Its basic principle is the measurement of the relaxation of
protons in an external magnetic field after the radio-frequency pulse
excitation 18
.
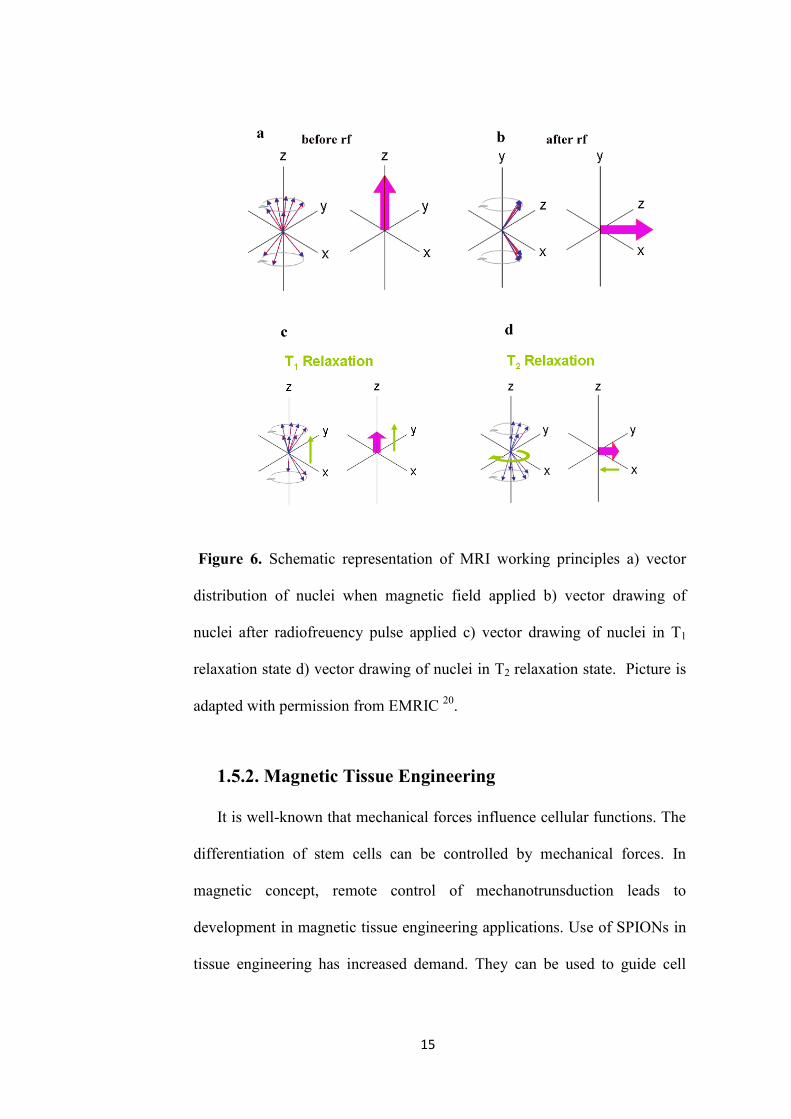
When nuclei placed in a magnetic field, randomly oriented nuclei tend
to align either in the same or opposite direction of the magnetic field and

13
there is no overall magnetic vector in the XY plane as represented in Figure
6-a. After radiofrequency excitation with a 90º, the spin up and spin down
states are equalized resulting in a zero mz as represented in Figure 6-b and
the magnetization is maximum in the perpendicular XY plane. There are two
forms of relaxation from this excited state; transversal relaxation and
longitudinal relaxation.
Over the time, as represented in Figure 6-c, the magnetization in XY
plane decreases and returns to the magnetic field direction, and an energy
release to the environment occurs (lattice). This process is called
longitudinal (or spin-lattice) relaxation.
Another loss type of magnetization in XY plane is transverse relaxation.
After the excitation, all spins are localized on the XY plane. There can be
energy exchange between spins at that step which induced by a local
magnetic field and this relaxation is called transverse (spin-spin) relaxation.
A representative graphic can be seen in Figure 6-d.
As mentioned before, MRI is one of the most powerful methods for
medical diagnosis owing to its non-invasive process, high spatial resolution
multidimensional tomographic capabilities dynamic and functional
monitoring capabilities. This enormous versatility and functionality of MRI
has led to huge demand in medical diagnosis of abnormal tissues and organs
1,3,18.
From the perspective of medicine; the contrast in MRI arises from the
physicochemical interaction between water and tissues; hence this technique
14
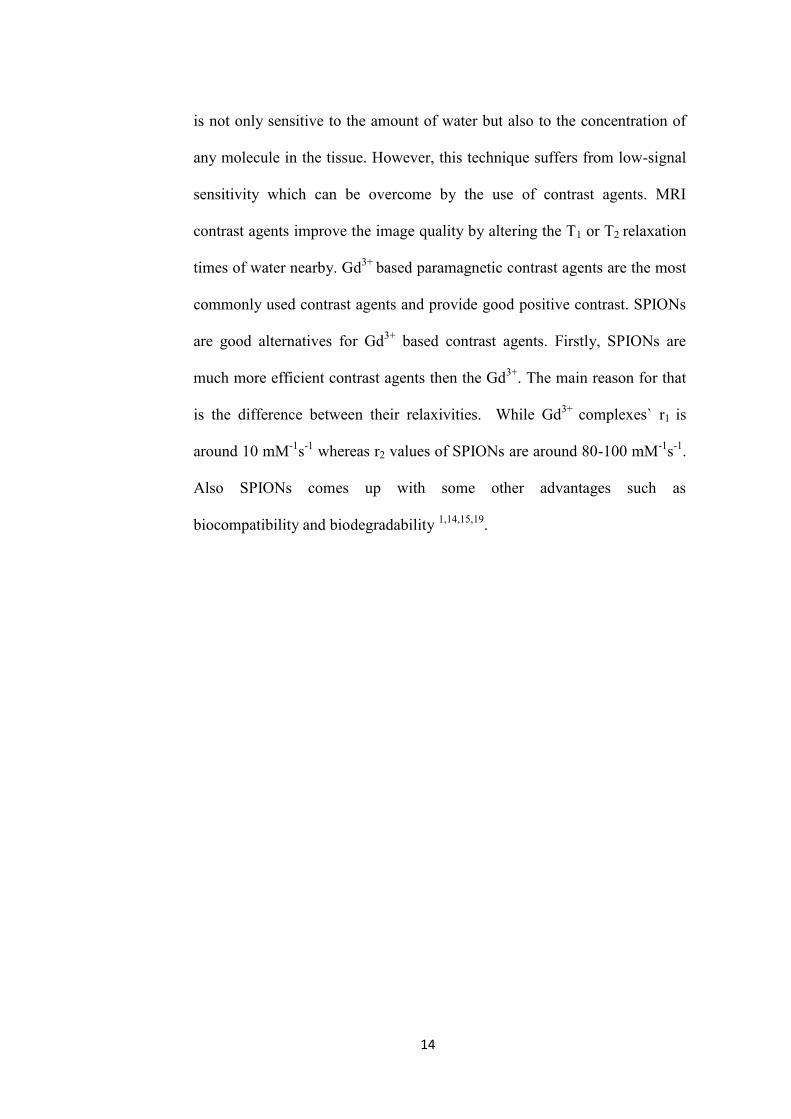
is not only sensitive to the amount of water but also to the concentration of
any molecule in the tissue. However, this technique suffers from low-signal
sensitivity which can be overcome by the use of contrast agents. MRI
contrast agents improve the image quality by altering the T1 or T2 relaxation
times of water nearby. Gd3+
based paramagnetic contrast agents are the most
commonly used contrast agents and provide good positive contrast. SPIONs
are good alternatives for Gd3+
based contrast agents. Firstly, SPIONs are
much more efficient contrast agents then the Gd3+
. The main reason for that
is the difference between their relaxivities. While Gd3+
complexes` r1 is
around 10 mM-1
s-1
whereas r2 values of SPIONs are around 80-100 mM-1
s-1
.
Also SPIONs comes up with some other advantages such as
biocompatibility and biodegradability 1,14,15,19
.
15
Figure 6. Schematic representation of MRI working principles a) vector
distribution of nuclei when magnetic field applied b) vector drawing of
nuclei after radiofreuency pulse applied c) vector drawing of nuclei in T1
relaxation state d) vector drawing of nuclei in T2 relaxation state. Picture is
adapted with permission from EMRIC 20
.
1.5.2. Magnetic Tissue Engineering
It is well-known that mechanical forces influence cellular functions. The
differentiation of stem cells can be controlled by mechanical forces. In
magnetic concept, remote control of mechanotrunsduction leads to
development in magnetic tissue engineering applications. Use of SPIONs in
tissue engineering has increased demand. They can be used to guide cell
16
adherence locations. Since SPION labeled cells can be manipulated by a
magnet, a novel methodology for cell seeding in 3-D scaffold could be
possible via magnetic guidance. In conventional cell seeding methods, cell
suspension is seeded into small scaffolds using small volumes of highly
concentrated cell suspension. The problem in here is that the seeded cell
suspension flow away and very few cells remain in the scaffold. Mag-Te
could help to overcome this problem via magnetic attraction.
Mag-Te have been used in various tissue types such as bone and
cartilage, blood vessels, skin, lung, eye, liver, and nervous tissue. Mag-Te is
undergoing a rapid expansion in tissue engineering applications. The ability
to manipulate cellular process remotely will open myriad opportunities in
tissue engineering Also SPIONs can also be used to monitor cellular
movement in vivo by MRI 1.
17
CHAPTER 2
EXPERIMENTAL SECTION
2.1 General Methods
SPIONs were characterized by Panalytical X’PERT Pro MRD model
XRD and their magnetic behavior was examined by the vibrating sample
magnetometer (LDJ, Electronics Inc., Model 9600) with maximum field up
to 15 kOe. Reverse phase HPLC on Agilent 6530 accurate-Mass Q-TOF
LC/MS equipped with Agilent 1200 HPLC was used to characterize the
peptide amphiphiles. Agilent Zorbax Extend-C18 2.1 x 50 mm column for
basic conditions and Zorbax SB-C8 4.6 mm x 100 mm column for acidic
conditions were used to analyze peptides. A gradient of (a) water (0.1%
formic acid or 0.1% NH4OH) and (b) acetonitrile (0.1% formic acid or 0.1%
NH4OH) was used for the analysis of peptides. For purification of the
molecules, reverse-phase HPLC system with Zorbax Extend-C18 21.2 x 150
mm column for negative molecules and Zorbax SB-C8 21.2 x 150 mm
column for positive molecules was employed. A gradient of (a) water (0.1%
TFA or 0.1% NH4OH) and (b) acetonitrile (0.1% TFA or 0.1% NH4OH) was
used for the analysis of peptides.
18
2.2. Materials
Dibenzyl ether was purchased from Merck, lauryl amine was purchased
from Sigma-Aldrich, iron 2,4 pentadionate (Fe(acac)3) and lauric acid were
purchased from Alfa Aesar. 1,2 hexadecane diol was purchased from Sigma-
Aldrich. 9-Fluorenylmethoxycarbonyl (Fmoc) and tert-butoxycarbonyl
(Boc) protected amino acids, [4-[α-(2',4'-dimethoxyphenyl)Fmoc-
aminomethyl]phenoxy]acetamidonorleucyl-MBHA resin (Rink amide
MBHA resin), Fmoc-Asp(OtBu)-Wang resin and 2-(1H-Benzotriazol-1-yl)-
1,1,3,3-tetramethyluronium hexafluorophosphate (HBTU) were provided
from NovaBiochem and ABCR. NH4OH, NaOH and HCl were purchased
from Riedel-de Haen. FeCl3 was bought from Merck. FeCl2 was bought from
Sigma-Aldrich. TFA solution NHS and EDC bought from Merck. The other
chemicals were purchased from Fisher, Merck, Alfa Aesar or Aldrich and
used as provided.
2.3. Synthesis of Peptides
Positive peptides were constructed on Rink Amide MBHA resin, whilst
negative peptides were constructed on preloaded wang resin. Amino acid
couplings were done with 2 equivalents of Fmoc protected amino acid, 1.95
equivalents HBTU and 3 equivalents of DIEA for 2 hours. Fmoc removals
were performed with 20% piperidine/DMF solution for 20 min. Cleavage of
the peptides from the resin was carried out using a mixture of TFA:TIS:H2O
in 95:2.5:2.5 ratio for 2 h. Excess TFA was removed by rotary evaporation.
19
Remaining viscous peptide solution was treated with ice-cold diethyl ether,
and the resulting white pellet was freeze-dried.
2.4. Superparamagnetic Iron Oxide Nanoparticle
Synthesis via Thermal Decomposition Method
Magnetite (Fe3O4) nanoparticles were synthesized as previously reported
with slight modifications in synthesis protocol10
. 2 mmol Fe(acac)3, 10
mmol 1,2 hexadecane-diol, 6 mmol lauric acid and 6 mmol lauryl amine
were dissolved in 20 ml benzyl ether. Solution was then deoxygenated with
nitrogen gas and magnetically stirred while heating up to 200 °C for 2 h.
Afterwards, resulting solution was refluxed at 270 °C for 1 h and cooled
down to room temperature. Subsequently, 50 ml ethanol was added to
precipitated nanoparticles. In following step, solution was centrifuged at
8000 rpm for 10 min. Precipitated nanoparticles were collected and
dissolved in hexane. More ethanol was added and centrifuged at 8000 rpm
for 10 min. The pellet was treated with hexane in the presence of 1 mmol
lauric acid, lauryl amine and sonicated for 10 min to recover the NPs.
Finally, solution was centrifuged at 6000 rpm for 10 min to remove the
aggregated particles.
2.5. Non-covalent Functionalization of Superparamagnetic
Iron Oxide Nanoparticles
30 mg of peptide amphiphile was dissolved in 3 ml distilled water and
pH of the solution was adjusted to pH 2 and pH 10 for the positive charged
20
peptide amphiphile and negative charged peptide amphiphile, respectively.
Then 10 mg/ml of SPION stock solution in hexane was prepared. Peptide
amphiphiles and SPION’s were mixed with a ratio of 1:7. 21mg/2.1 ml and
peptide amphiphile solution was then sonicated for 5 min and 3 mg/0.3 ml.
After pouring SPION solution into the PA solution, mixture was shaken for
a couple of seconds and sonicated for 1 min. This step was repeated for 10
min and sonication was performed for 30 min. Further, solution was heated
to 60 °C, and vigorously mixed for 20 min more at 60 °C. Then, the solution
was filtered through 0.2 µm PTFE filter and centrifuged at 10000 rpm for 90
seconds. Supernatant solution was removed and centrifuged at 12500 rpm
for 20 min. Precipitated particles were dissolved in ddH2O. Free peptide
concentration was measured with UV Nano-drop at 205 nm.
2.6. SPION’s Surface Modification with APTES
Surface modification was done according to literature 21
. 10 mg SPION
was dissolved in 100 ml hexane. 0.5 ml APTES and 10 µL acetic acid
solutions were added into hexane solution. Then, the solution was mixed at
120 rpm for three days. It was centrifuged at 8000 rpm for 10 minute and
supernatant removed. More hexane added into solution and magnetic
particles were separated with magnet. This step was repeated three times
more and dissolved in H2O.
21
2.7. SPION Synthesis via Co-Precipitation Method
50 ml NH4OH solution (1 M) was prepared and the pH of the solution
was adjusted to pH 11 by adding HCl. Solution was deoxygenated with
nitrogen gas for 30 minutes. 0,65g FeCl3 and 0.25g FeCl2 were mixed in 2.5
mL pH 3 solutions with a molar ratio of 2:1. Then, the solution was injected
into pH 11 solution under nitrogen gas and sonicated for 1 h. Precipitated
particles with black color were collected and centrifuged at 6000 rpm for 10
min and washed three times.
2.8. Protein Conjugation Studies
For the conjugation process, EDC/NHS reaction was applied. 11 mg
EDC and 15 mg NHS were mixed in 0.1M MES buffer (pH 5). For the
functionalization of Pro-PA(1) and Pro-PA(2) SPION complexes, 200 µL of
SPION solution was added into the previously prepared solution and the
final solution was shaken overnight. Then, 10X PBS was added to raise the
pH and further, FITC labeled streptavidin was added into solution. The
mixture was shaken for 3 hours more. For the APTES modified SPIONs,
200 µL of 1 mg/ml biotin solution was mixed with 11 mg EDC and 15 mg
NHS in 0.1 M MES buffer and shaken overnight. Subsequently, 10X PBS
was added to raise the pH and 200 µL APTES modified SPION solution
added into solution of previously prepared NHS/EDC activated biotin.

22
2.9. Characterization of Iron Oxide Nanoparticles
Dynamic Light Scattering
Hydrodynamic size and zeta potential of the particles were measured by
dynamic light scatteringusing Malvern Nanosizer/Zetasizer®nano-ZS ZEN
3600 (Malvern Instruments, USA) instrument. Basically, hydrophobic
particles were dissolved in hexane and measurements were performed in a
quartz cuvette. The hydrophilic particles were dissolved in water and
measurements were performed in a polystyrene cuvette.
X-Ray Diffraction (XRD)
Panalytical X’PERT Pro MRD was used to collect XRD diffraction
pattern analysis under Cu Kα radiation. Samples were dried by vacuum and
grinded to obtain a fine powder. After that, samples were spread onto glass
XRD substrate and analyzed.
FT-IR
Bruker VERTEX 70 with Hyperion Scanning Microscope was used for
the FT-IR analysis at the transmittance mode. 1 mg SPION was grinded
with 99 mg KBr until very fine powders were obtained. The mixtures were
stated between two stainless steel disks and hydraulic press was applied up
to 7 atm. Transmittance characterization was done between 370-4000 cm-1
.
Scanning Electron Microscopy (SEM)
SEM imaging was performed with FEI Quanta 200 FEG, using the ETD
detector at high vacuum mode with 30 keV beam energy. For sample
23
preparation; 1 mg/ml of sample solutions were drop cast on silicon wafer
and dried before sample analysis. Particle morphology was evaluated by
comparison of several images taken from diverse sides of the specimen.
Transmission ElectronMicroscopy
TEM was performed with FEI Tecnai G2 F30. Diluted samples were
placed on a Lacey mesh ultrathin carbon coated copper grid. In order to
observe the organic layer around the SPION, the particles were stained with
2 wt % uranyl acetate solution or phosphotungstic acid solutions for positive
and negative staining, respectively. 5µL SPION solution dropped onto grid.
Then, the grid was washed to remove excess coating and was put over the
staining solution for 15 min. After the staining, the grids were dried at room
temperature overnight before further analysis. Particle size and sample
uniformity were evaluated by comparison of several images taken from
diverse sides of the specimen.
Cell Viability
The effect of synthesized SPIONs on cell viability were analyzed using
Mouse embryonic fibroblast cells (NIH 3T3). NIH 3T3 cells were cultured
in DMEM supplemented with 10% calf serum. 24 h later, cells were seeded
on 96 well-plates (5000 cells/well) containing different concentration of
SPIONs (500 µg/ml, 200 µg/ml, 100 µg/ml, 50 µg/ml) (pH 7). Live/Dead
assay was used to detect living cells by Calcein AM (2 µM) and death ones
by ethidium homodimer 1 (2µM) 48 h after the addition of SPIONs.
Fluorescence measurements were taken by M5 microplate reader. Peptides

24
without iron oxide nanoparticles were used as negative control at same
concentrations.
Prussian Blue Staining
Cellular localization and internalization was detected by Prussian Blue
staining. NIH 3T3 cells were seeded in 96 well-plates (3000 cells/well). 24 h
after seeding the cells, SPIONs were added with the concentration of 500
µg/ml at pH 7. 24 h after the addition of SPIONs, PB staining was
performed. Wells were washed using PBS and fixed 4% paraformaldehyde.
Fresh mixture of 2% HCl: 2% K4Fe[CN]6 (1:1) was added on the cells and
incubated at room temperature for 30 min. Then wells were washed with
PBS and images were taken under inverted microscope (Zeiss).
The iron content of peptide coated SPIONs was quantitatively
determined by the colorimetric PB assay and measured by Spectramax M5.
Samples were prepared by mixing 200 µl of SPIONs or their diluted solution
with 200 µl of 6 N HCl for 1 h at 60 °C. After mixing process 100 µl 5%
K4Fe[CN]6 solution was added. The iron content of samples was calculated
by comparing its absorbance (650 nm) to that of a range of standard
concentrations of equal volume.
Magnetic Resonance Imaging
MRI measurements of the peptide coated SPIONs were performed on a
Siemens 3T TIMTrio Scanner. Peptide coated SPIONs were dispersed in
water and diluted to various concentrations (0.0375, 0.075, 0.15, 0.2, 0.5
25
mM) and pH of the solutions was adjusted to 7. A 5 ml glass sample holder
was placed in the iso-center of the magnet. Spin-echo pulse sequences were
utilized to obtain T1 and T2 maps of each sample. T1 and T2 relaxation times
were measured from the large regions of interest, and the R1 and R2
relaxation rates were obtained from the reciprocal of obtained T1 and T2
result. MR imaging capabilities of the SPIONs were examined at 3 T with
the following parameters’ point resolution: 0.11-0.11 cm, section thickness:
2.3 mm, TE: 11, 13, 15, 18, 20, 30, 50, 100, 200, 500 ms, TR: 3000 ms;
another set of experiment was set up with the following parameters: TR:
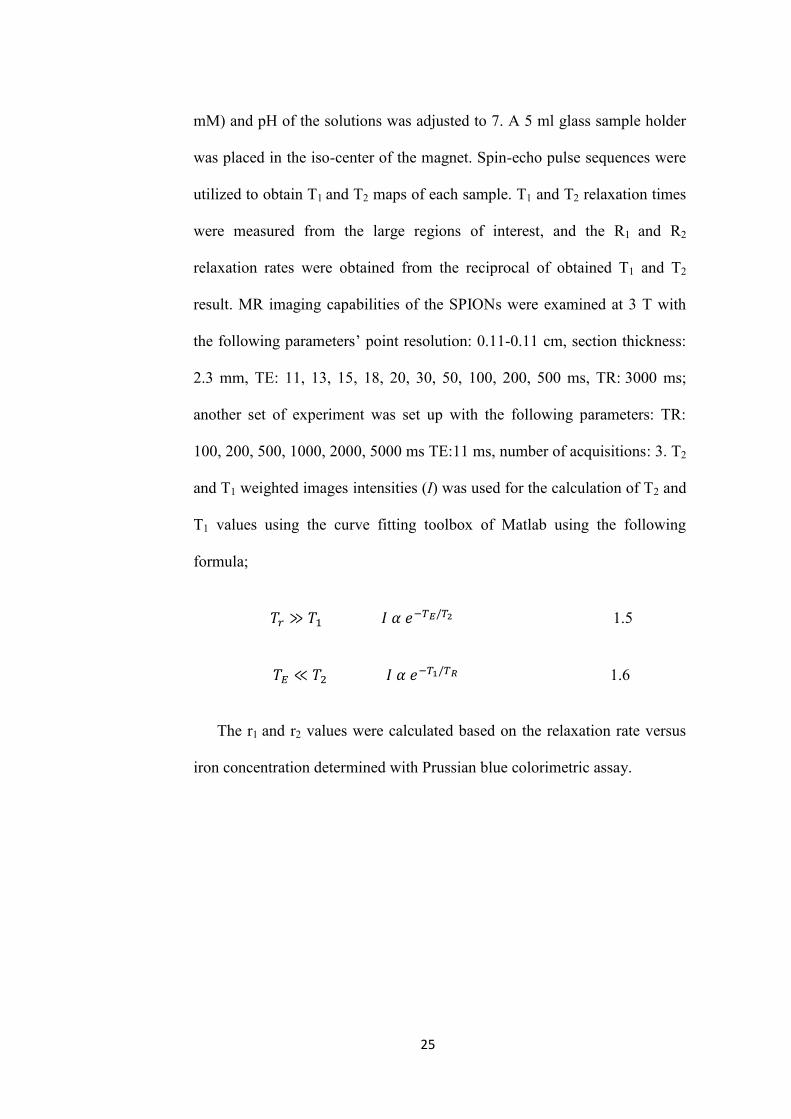
100, 200, 500, 1000, 2000, 5000 ms TE:11 ms, number of acquisitions: 3. T2
and T1 weighted images intensities (I) was used for the calculation of T2 and
T1 values using the curve fitting toolbox of Matlab using the following
formula;
1.5
1.6
The r1 and r2 values were calculated based on the relaxation rate versus
iron concentration determined with Prussian blue colorimetric assay.
26
CHAPTER 3
RESULTS AND DISCUSSIONS
3.1. Synthesis of SPIONs
According to the chemical route, synthesis of iron oxide nanoparticles
can be classified in two categories which are hydrolytic and non-hydrolytic.
The hydrolytic synthesis routes, such as co-precipitation rely on hydrolysis
of ferric and ferrous ions, while non-hydrolytic routes, such as thermal
decomposition, rely on pyrolysis of iron-organic compounds. Herein, we
performed and compared both co-precipitation and thermal decomposition
methods for the synthesis of SPIONs and results were discussed by means of
the particle size, shape and monodispersity 19
.
3.1.1. Synthesis of SPIONs via Co-Precipitation Method
The co-precipitation method is the most widely used method which has
been firstly reported by Welo et al. who produced magnetic particles in
19255. Many methods were developed later on. Basic principles in magnetite
formation can be explained by Lewis acid-base concepts. The iron atom on
the SPION surface is a hard Lewis acid, while compounds which are able to
accept oxygen atom (O-), water or NH3, are hard lewis bases. Therefore,
27
based on this theory, hard acids are able to react faster and form strong
bonds with hard bases as stated in Lamer diagram above 22
.
For the SPION synthesis via co-precipitation method, iron (II) chloride
and iron (III) chloride were mixed in 2:1 molar ratio at low pH around 2 to
3. 1 M ammonium hydroxide solution was deoxygenated with nitrogen gas.
Further, pH of the ammonium hydroxide solution was adjusted to pH 11 and
iron solution was quickly poured into the ammonia solution under continues
sonication. They were sonicated for 30 min under nitrogen gas. Resulting
particles were analyzed by FT-IR and DLS and SEM at this step. According
to results from SEM shown in Figure 7, particles tend to aggregate into
larger particles with size range that is not suitable for their use in medicine.
Particle surface properties and their crystalline state were characterized
by FT-IR. Obtained peak at 577 cm-1
in Figure 7 belongs to Fe-O stretching
band which represents the existence of magnetite crystals23
. At this step,
SPIONs surface were coated with MTBS. It would not only to avoid the
particle aggregation but also to functionalize them. MTBS has two carboxyl
groups and one of those carboxyl groups was modified with a protective
group. When MTBS treated with highly acidic or basic solution, the
protective group detached. After the attachment of MTBS to the SPION,
solution was treated with basic solution. To detect free carboxyl group on
SPION surface, FT-IR was analysis were pursued. As reported earlier in the
literature, free carboxyl group peak locates at 1400 cm-1
which was not

28
present in our FT-IR results in Figure 9. According to these results, SPION
surface modification with MTBS was not successful.
SPION size after the MTBS modification were measured with DLS and
visualized through the SEM. According to results presented in Figure 10, the
hydrodynamic size of the particles was around 65 nm which is highly
correlated with SEM results.
Figure 7. SEM image representing the large aggregations ofSPIONs when
they synthesized with co-precipitation method.

29
Figure 8. The FT-IR spectrum of SPIONs synthesized by co-precipitation
method. The existence of Fe-O strecting peak at 570 cm-1
proves that
particles were at magnetite phase.
Figure 9. The FT-IR graphic of mono tert-butyl succinate functionalized
SPIONs. There is no carboxyl peak around 1400 cm-1
which means that
surface modification was not successful.
0
0,1
0,2
0,3
0,4
0,5
0,6
0,7
0,8
0,9
400900140019002400290034003900
Tra
nsm
itta
nce
%
Wavelength(cm-1)
0
0,1
0,2
0,3
0,4
0,5
0,6
0,7
0,8
0,9
1
400900140019002400290034003900
Tra
nsm
itta
nce
%
Wavelength(cm-1)
30
Figure 10. SEM images of MTBS modified SPIONs synthesized by co-
precipitation method. Particles were still aggregated after MTBS treatment.
Co-precipitation is an easy technique to synthesize SPIONs. However, it
is rather complex technique since the particle characteristic (shape, size and
its distribution, and crystal phase) are affected by many factors such as pH,
concentrations of iron salts, ratio of Fe2+
/Fe3+
19
. As a result of these, poly-
dispersity of the SPION population prepared via co-precipitation method is
high (Figure 7). Also, surface modification on SPIONs is much harder than
the other nanoparticles, such as gold nanoparticles, due to their surface
properties and necessity of the non-oxidized environment during the
modification.

31
3.1.2 Synthesis of SPIONs with Thermal Decomposition
Method
Among the non-hydrolytic synthetic routes, thermal decomposition
based on the pyrolysis of the organometallic compounds has become the
most widely used and successful approach to synthesize SPIONs with
perfect monodispersity, size tunability, high crystallinity 19
. Alivisatos et al.
was the first group who synthesized maghemite nanoparticles with thermal
decomposition method, however, method reported by Sun et al. is the most
widely used and accepted method for SPION synthesis using thermal
decomposition method 10,19
.
Although the exact mechanism behind the thermal decomposition
method is still vague, experimental parameters reveal some important
features. High-temperature reaction of Fe(acac)3 with polyols, lauric acid,
and dodecylamine in high boiling ether solution allowed the formation of
nanosized magnetite with well controlled size and size distribution with high
crystallinity 7,11,19,23
. Polyols are used as a chelating agent, which have high
dielectric constant and high donor number where these polyols forms
stronger associates with metal ions19
. Lauric acid and dodecylamine are used
as stabilizing agents to control size of the SPIONs and inhibit the
aggregation during the synthesis. High boiling ether solution is used as
solvent and it determines the size fate of the nanoparticles. The key for the
efficient synthesis of SPIONs relies on preheating step where the reaction
solution is heated up to 200 ºC. This step is highly effective on the size

32
distribution of the nanoparticles 10
. Although the exact mechanism is not
known, researchers hypothesize that at preheating step acetylacetonate group
of Fe(acac)3 exchanges with the polyols added into the solution 3. The
crystal phase of the SPIONs is determined by the reflux step. Refluxing time
has to be optimized to be able to get SPIONs in magnetite phase; in low
refluxing time, it was shown that non-magnetic Fe-O could be synthesized 7.
By thermal decomposition method developed by Sun et al., we were able
to synthesize monodisperse uniform nanoparticles with diameters of 6-7 nm
as represented in Figure 11. Lauric acid and dodecylamine were used as
surfactant. The carboxyl and amine head groups were attached to the SPION
surface during the synthesis and tailed away. End product is soluble in
organic solvent. The core of the SPIONs was characterized with XPS and
XRD methods. According to obtained results in Figure 12 IOPs are in
magnetite phase 10
which have the highest magnetization value. The
magnetization value represents the response of materials to the magnetic
field. and their magnetization saturation was 56 emu/g (Figure 13).
Moreover, hysteresis loop also showed that the nanoparticles were
superparamagnetic.

33
Figure 11. Characteristics of SPIONS synthesized via thermal
decomposition method: a) Hydrodynamic size of the SPIONs, b) TEM
images illustrating the monodisperse SPIONs of around 7 nm.
a)
b)

34
Figure 12. a) XRD spectrum graphic and b) XPS spectrum of SPIONs
synthesized with thermal decomposition method showing that produced
particles are in magnetite phase.
a
b
35
Figure 13. Hysterysis loop of SPIONs synthesized with thermal
decomposition method. The hysterysis revealed that particles were
represents superparamagnetic behaviour and their magnetization value was
56 emu/g.
3.2. Peptide Amphiphiles
Solid phase peptide synthesis protocol was used for the synthesis 4. The
process was briefly represented in Figure 14. Deblocking, activation,
coupling, as well as cleavage and deprotection are the critical steps in the
peptide synthesis. In SPPS protocol peptide is constructed on an insoluble
solid support since the separation of the peptide from soluble reagents and
the removal of excess reagents could be much easier if resin support is used.
In deblocking step, the protecting group on the amino acid will be removed.
9-fluorenylmethoxycarbonyl (Fmoc) is one of the protecting groups, and it
has been employed in this study to protect the N- terminus. It is a base-
labile protecting group and piperidine can be used for deblocking of the
aminoacid. The fmoc group localized on resin was removed firstly and the
first activated aminoacid was added. For the aminoacid activation several
36
methods exist in the literature and HBTU/DIEA activation method was used
to activate carboxyl group of amino acids in this study, then the amino acid
can easily couple with resin and/or amino acid. Deprotection of the Fmoc
Group from the first amino acid and second amino acid was coupled, and
this procedure repeated until a desired peptide obtained. After each coupling
step, resin was washed with acetic acid to deactivate free amine group. This
step is necessary to improve the purity. In the final step, peptide was
deprotected and TFA cleavage was done to detach the peptide from the resin
4.
For the encapsulation of SPIONs, amphiphilic peptides were used. The
lauric acid adds the hydrophobic character to peptide amphiphiles, whereas
aminoacid sequences supply hydrophilic and biofunctional feature. The
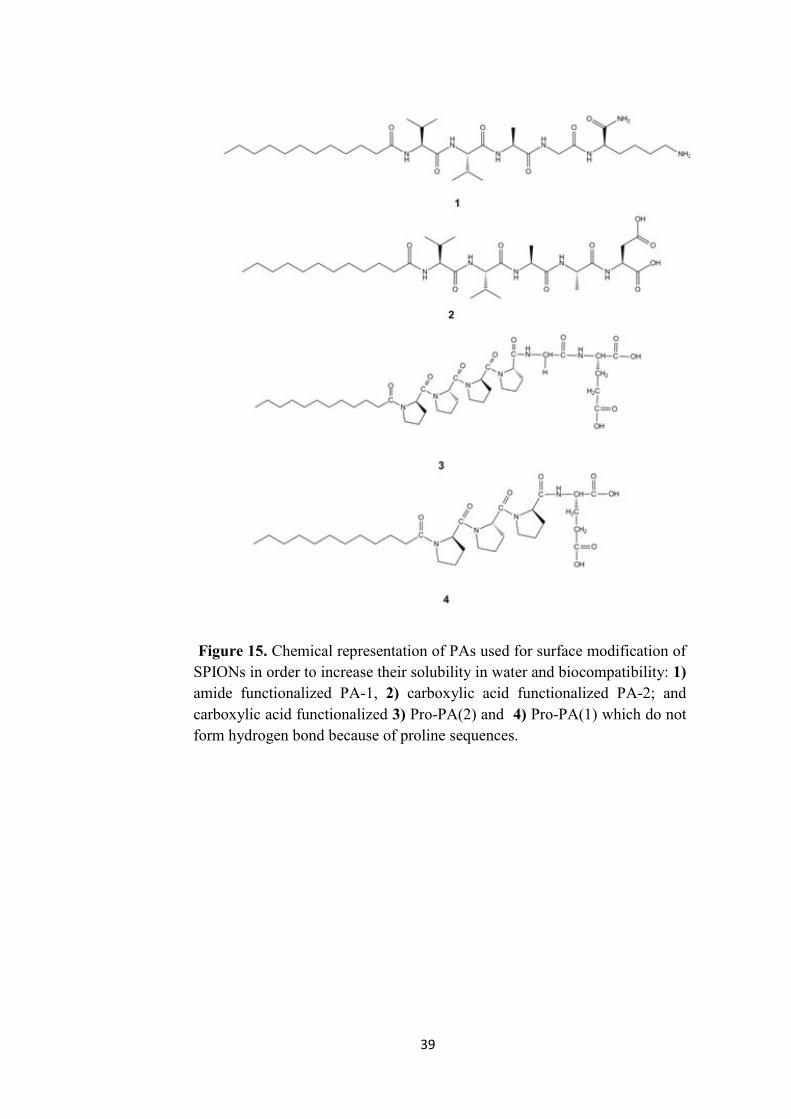
chosen peptide molecules were PA-1 (Lauryl-VVAGK) (depicted as 1 in
Figure 15), PA-2 (Lauryl-VVAAD-Am) (depicted as 2 in Figure 15), Pro-
PA(1) (Lauryl-PPPE) (depicted as 4 in Figure 15), Pro-PA(2) (Lauryl-
PPPPGE) (depicted as 1 in Figure 15). PA-1 is positively charged molecule
at neutral pH whilst the PA-2 is a negatively charged molecule at neutral
pH. These peptides can form self-assembled structures. They have no
specific response to any tissue or cell; they have self-assemble and have
charge feature. Herein, we want to monitor the effect of charged peptides on
the synthesis of the SPIONs and also the effect of produces SPIONs on
living cells. Pro-PA(1) and Pro-PA(2) are negatively charged peptides. The
proline aminoacid is districted to the existence of hydrogen bonds, so it
cannot form self- assembled structures. These peptides were selected for the

37
protein conjugation studies. The mass spectrometry and the HPLC
chromatograms can be seen in Figures 16-23. We faced serious problems in
the synthesis of the Pro-PA(1). Based on these serious problems, an
alternative peptide, Pro-PA(2) was synthesized.
38
Figure 14. A schematic representation of solid phase peptide synthesis. The
protected aminoacid was activated from its carboxyl group. Then it was
coupled to the other aminoacid from its amine reactive group. After the
final deblock peptide was cleaved from resin.
39
Figure 15. Chemical representation of PAs used for surface modification of
SPIONs in order to increase their solubility in water and biocompatibility: 1)
amide functionalized PA-1, 2) carboxylic acid functionalized PA-2; and
carboxylic acid functionalized 3) Pro-PA(2) and 4) Pro-PA(1) which do not
form hydrogen bond because of proline sequences.

40
Figure 16. RP-HPLC chromatogram of PA-1. Absorbance at 220 nm vs.
retention time graph. HPLC results revealed that the synthesized peptides
were more pure than 90%.
41
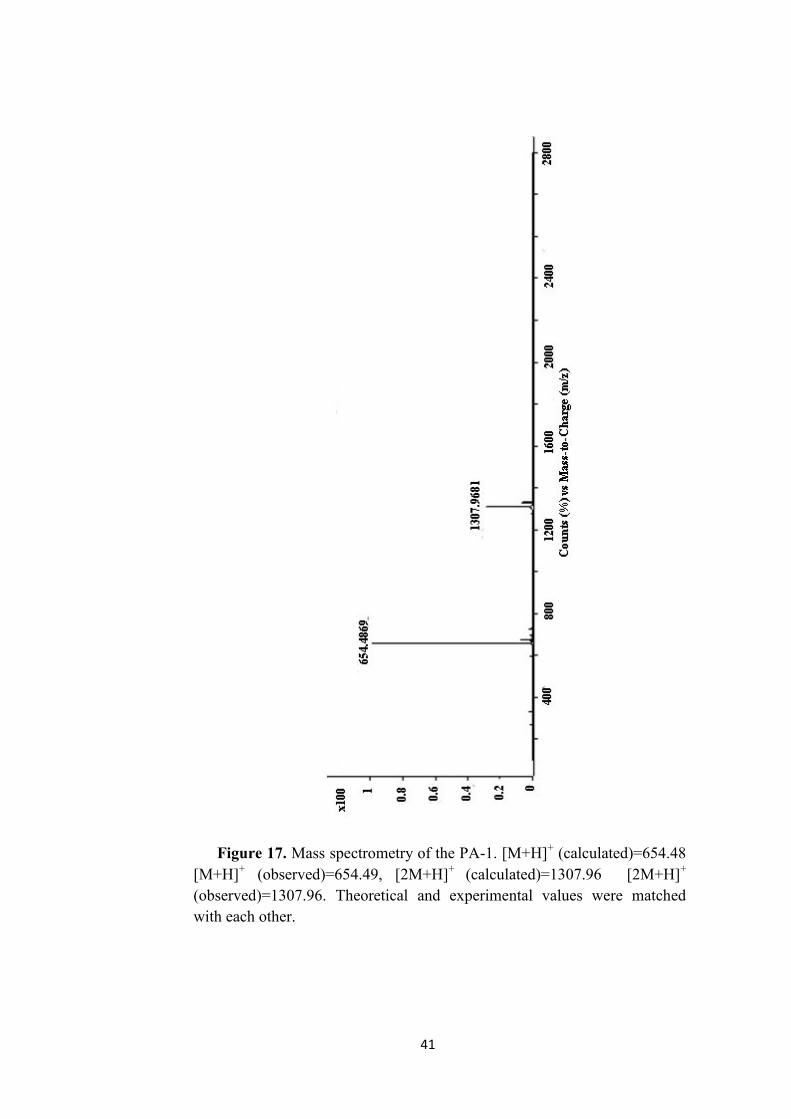
Figure 17. Mass spectrometry of the PA-1. [M+H]+ (calculated)=654.48
[M+H]+ (observed)=654.49, [2M+H]
+ (calculated)=1307.96 [2M+H]
+
(observed)=1307.96. Theoretical and experimental values were matched
with each other.
42
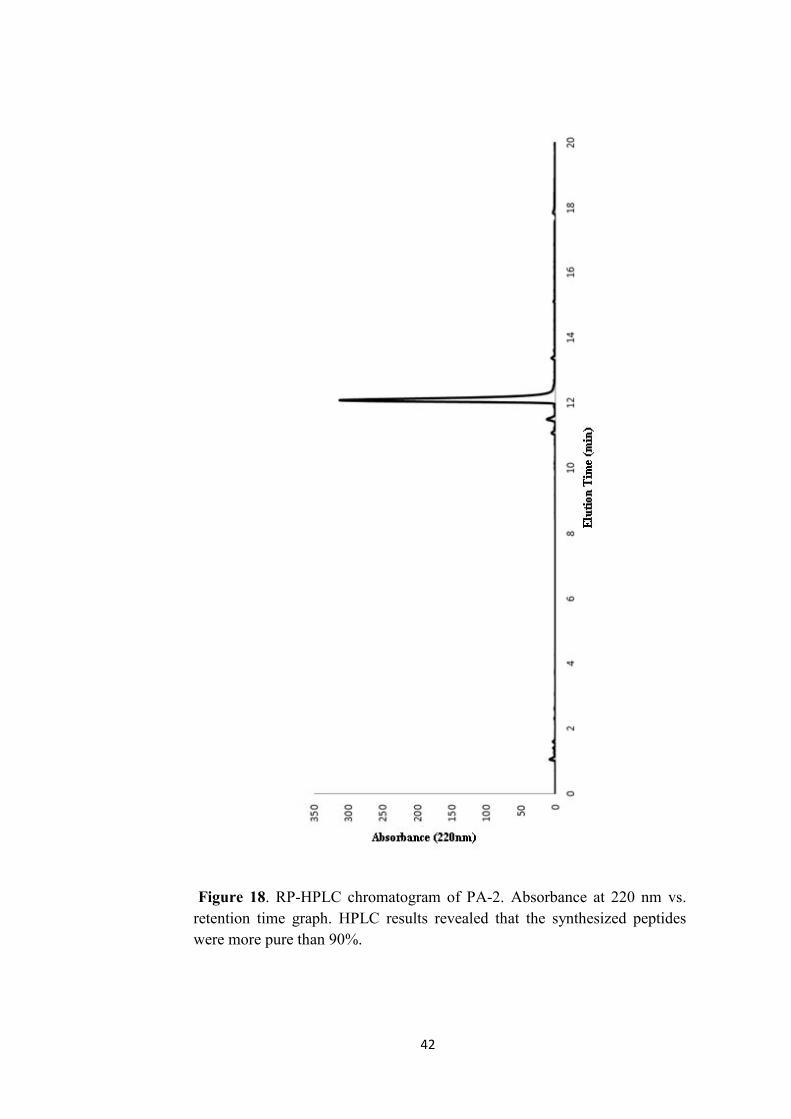
Figure 18. RP-HPLC chromatogram of PA-2. Absorbance at 220 nm vs.
retention time graph. HPLC results revealed that the synthesized peptides
were more pure than 90%.
43
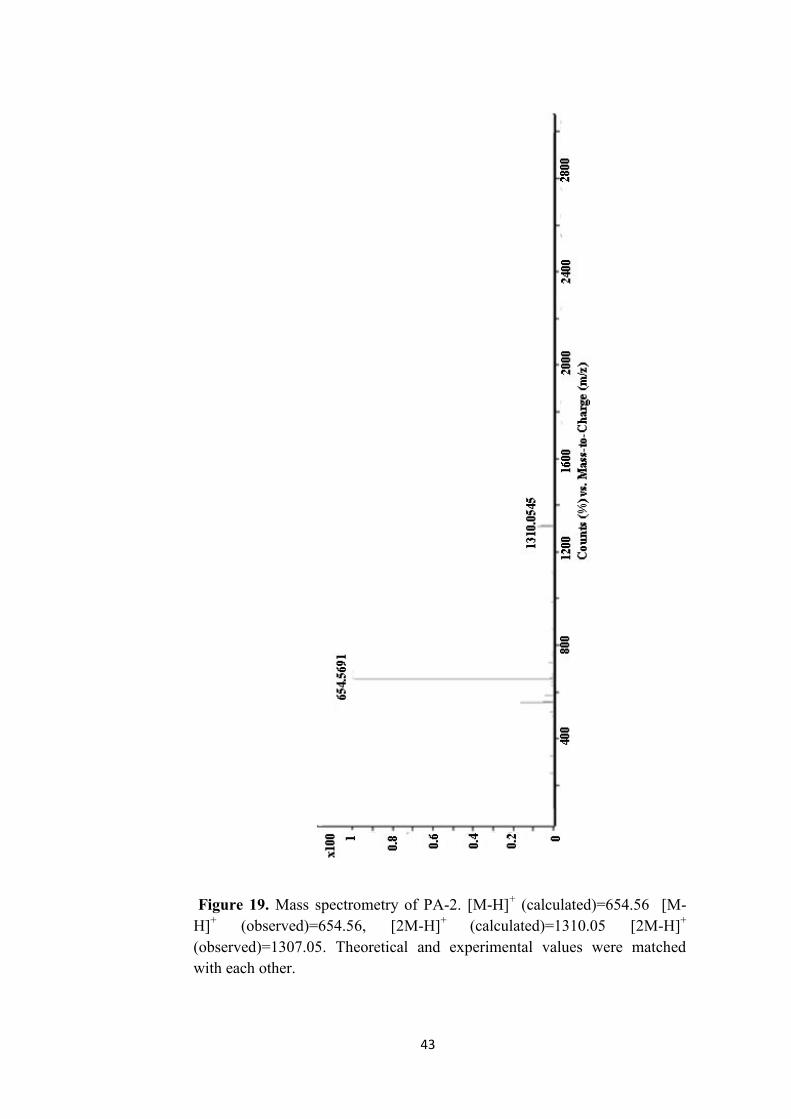
Figure 19. Mass spectrometry of PA-2. [M-H]+ (calculated)=654.56 [M-
H]+ (observed)=654.56, [2M-H]
+ (calculated)=1310.05 [2M-H]
+
(observed)=1307.05. Theoretical and experimental values were matched
with each other.
44
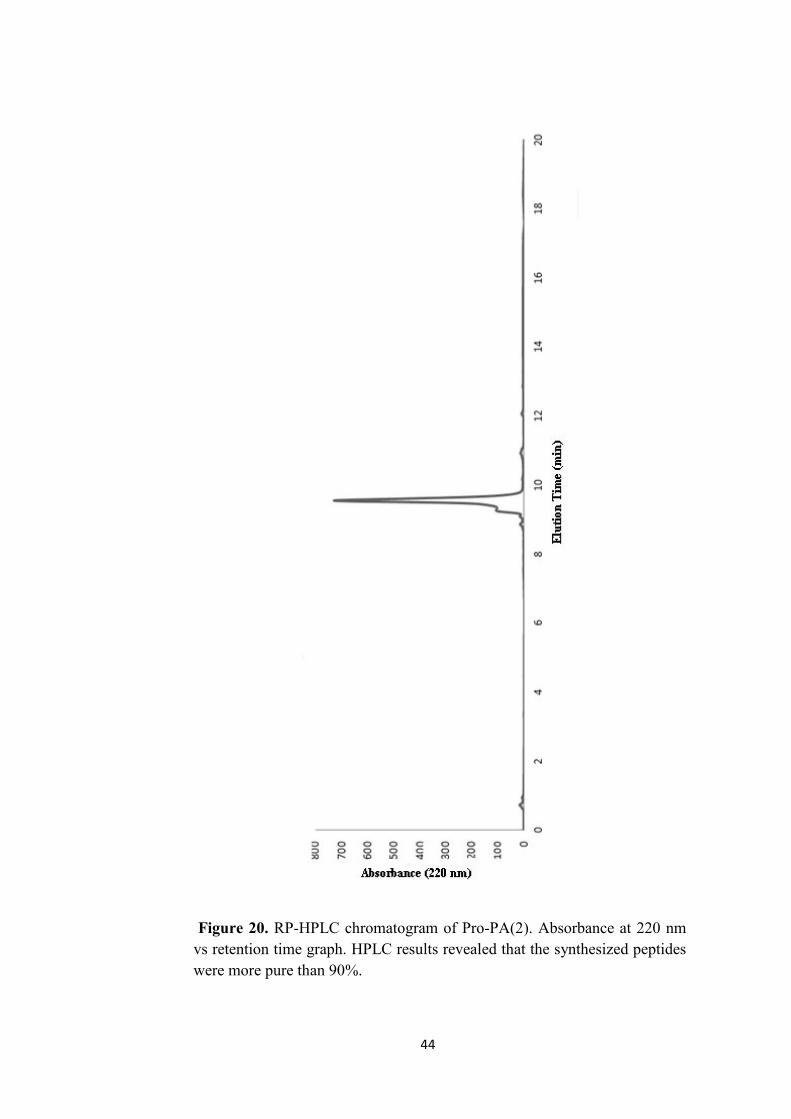
Figure 20. RP-HPLC chromatogram of Pro-PA(2). Absorbance at 220 nm
vs retention time graph. HPLC results revealed that the synthesized peptides
were more pure than 90%.
45
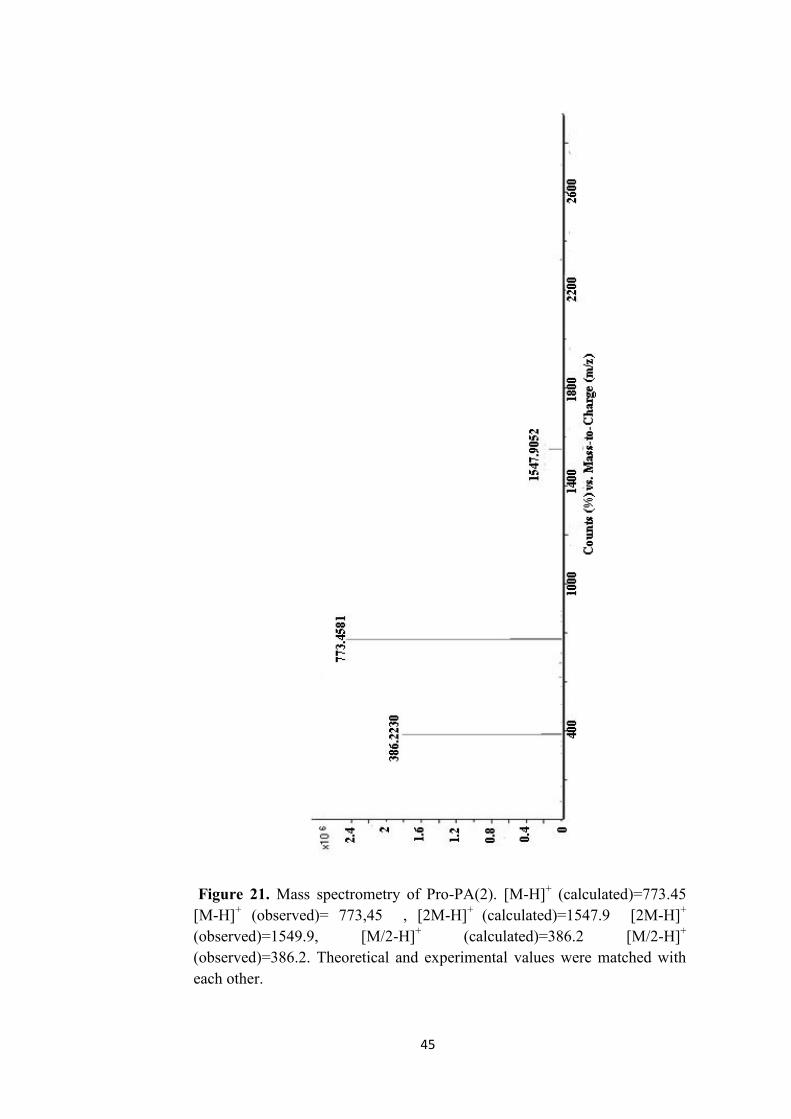
Figure 21. Mass spectrometry of Pro-PA(2). [M-H]+ (calculated)=773.45
[M-H]+ (observed)= 773,45 , [2M-H]
+ (calculated)=1547.9 [2M-H]
+
(observed)=1549.9, [M/2-H]+ (calculated)=386.2 [M/2-H]
+
(observed)=386.2. Theoretical and experimental values were matched with
each other.

46
Figure 22. RP-HPLC chromatogram of Pro-PA(1). Absorbance at 220 nm
vs retention time graph.

47
Figure 23. Mass spectrometry of Pro-PA_1. [M-H]+ (calculated)=619,37
[M-H]+ (observed)= 619,37 , [2M-H]
+ (calculated)=1239.75 [2M-H]
+
(observed)=1239.75, [M/2-H]+ (calculated)=309.18 [M/2-H]
+
(observed)=309.18. Theoretical and experimental values were matched with
each other.
48
3. 3. Synthesis of Peptide-SPION Complex and Their
Physicochemical Properties
Surface group of the SPION has to meet three features: (i) binding
region, (ii) water soluble region and (iii) bioactive region 7. There are
numerous attempts to meet these three features 11
. Herein, we developed a
novel method to functionalize SPIONs for medical use by exploiting the
peptide amphiphiles for surface functionalization.
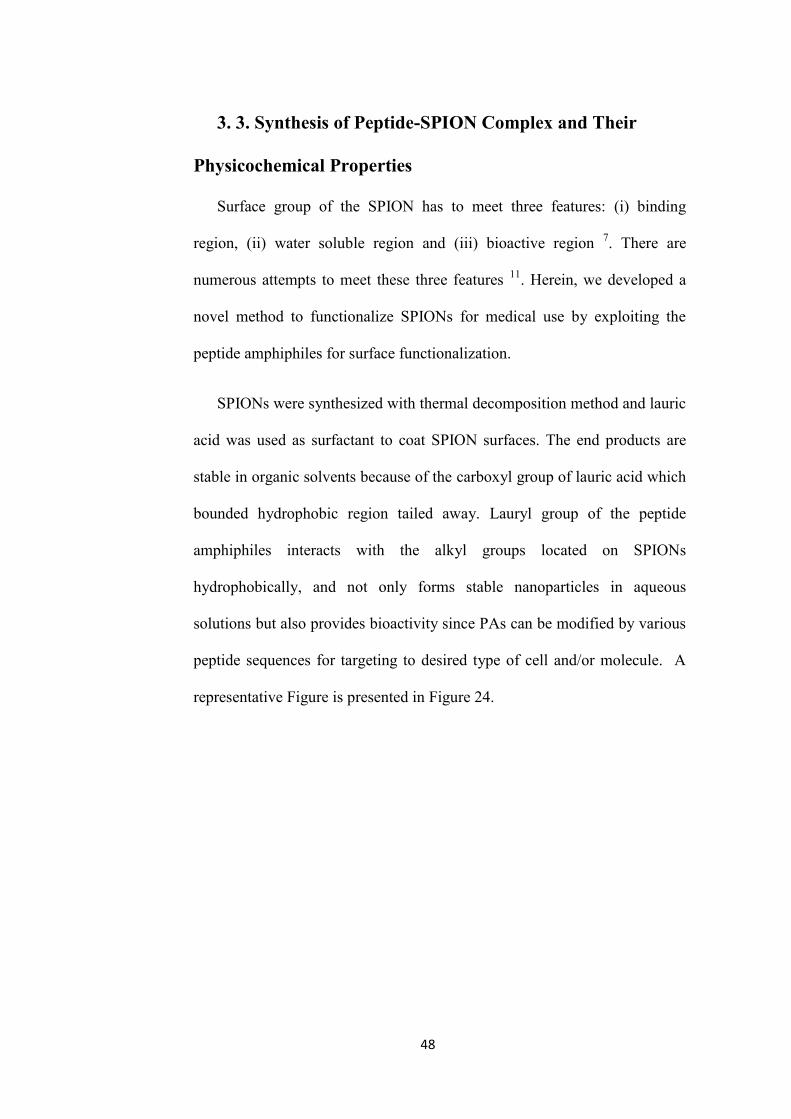
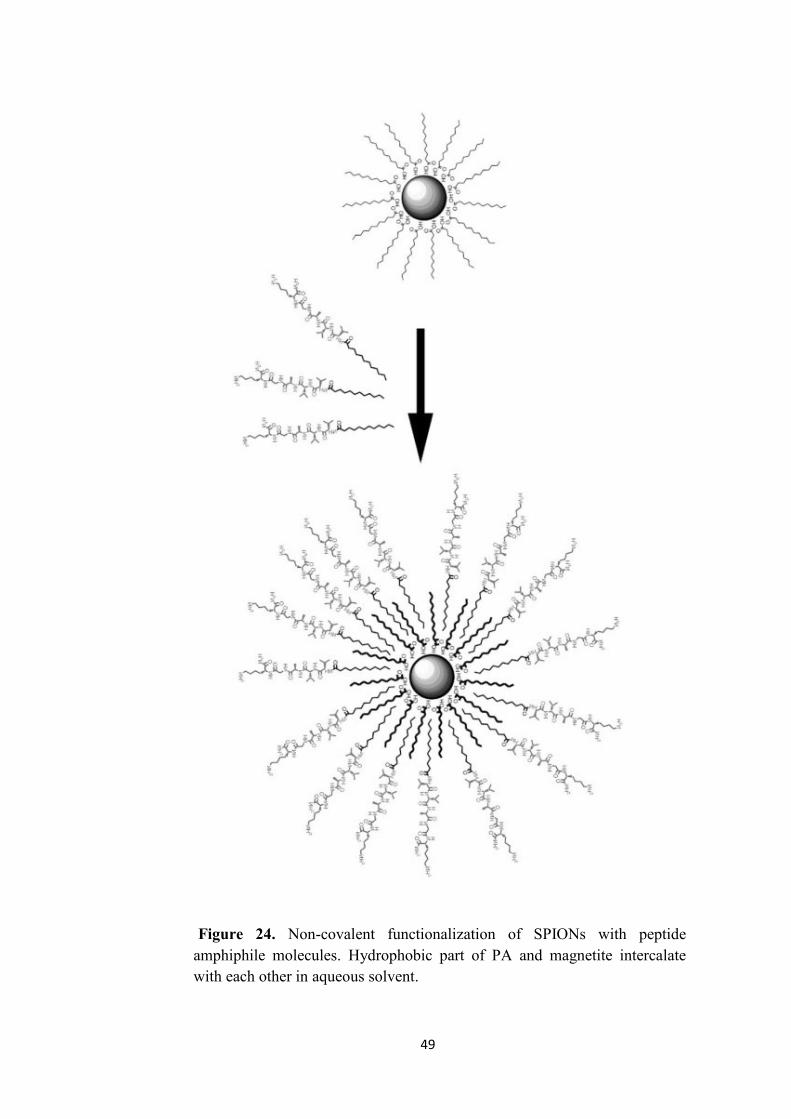
SPIONs were synthesized with thermal decomposition method and lauric
acid was used as surfactant to coat SPION surfaces. The end products are
stable in organic solvents because of the carboxyl group of lauric acid which
bounded hydrophobic region tailed away. Lauryl group of the peptide
amphiphiles interacts with the alkyl groups located on SPIONs
hydrophobically, and not only forms stable nanoparticles in aqueous
solutions but also provides bioactivity since PAs can be modified by various
peptide sequences for targeting to desired type of cell and/or molecule. A
representative Figure is presented in Figure 24.
49
Figure 24. Non-covalent functionalization of SPIONs with peptide
amphiphile molecules. Hydrophobic part of PA and magnetite intercalate
with each other in aqueous solvent.

50
Synthesis procedure of peptide-SPION complex was optimized and it
was found to be 7 mg PA to 1 mg SPION and the optimum volume for the
mixture was 10 ml PA solution in water to 1 ml SPIONs in hexane. Excess
amount of PA was used at the optimum volume to prevent aggregation of
SPIONs. Aggregated SPIONs were removed by 0.2 µm cut-off filter and
excess PA was dialyzed with 500-1000 Dalton cellulose membrane bags.
After the PA coating phase transition occurred, SPIONs were transferred to
water from organic solvent (Figure 25 a,c,e). FT-IR spectrum in Figure 27
revealed the existence of amine and amide peaks due to the presence of
peptide on the SPION surface. TEM characterization of SPIONs revealed
that SPIONs had narrow size distribution even after PA coating, and are
stable in aqueous solution (25-40 nm in diameter) (table 1, Figure 25 and
Figure 26) XRD pattern shown in Figure 2g demonstrates that SPIONs
stayed still in magnetite form similar to the unmodified ones.
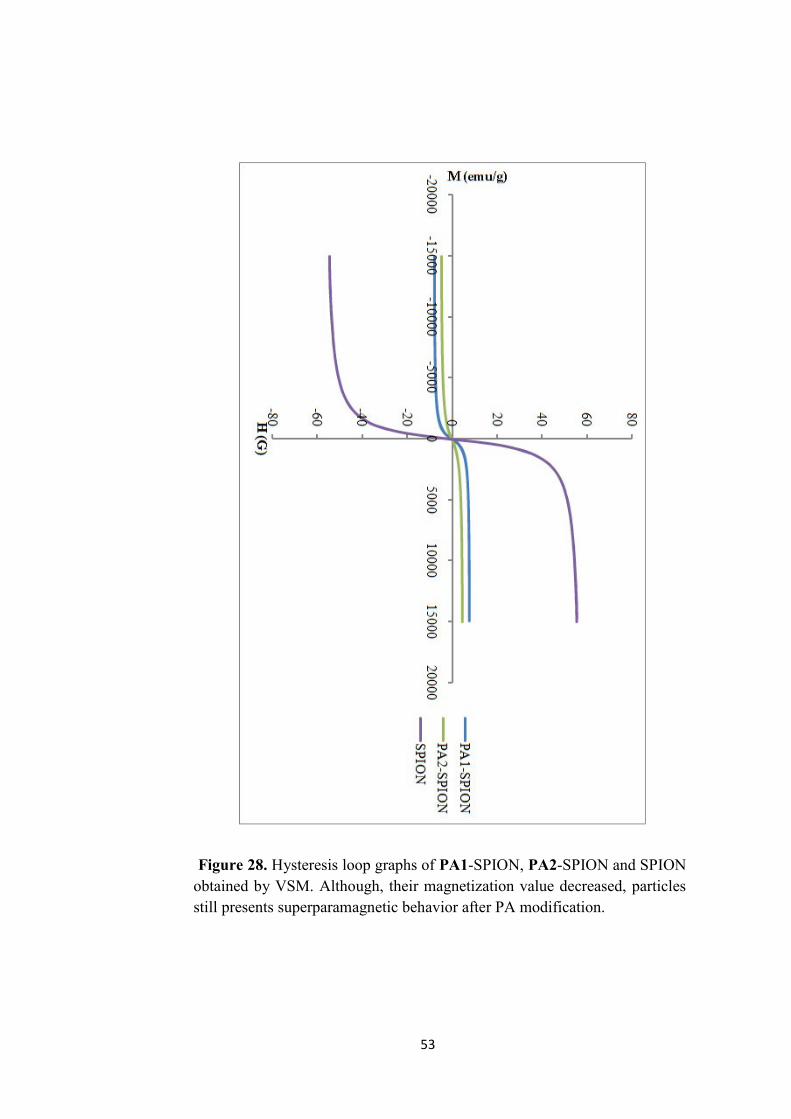
The magnetic properties of the SPIONs were examined with VSM. The
saturation magnetization (Ms) of lauric acid stabilized SPION was found to
be 56 emu g-1
. After functionalization process, peptide coated SPIONs Ms
dramatically decrease to 5 emu g-1
and 8 emu.g-1
for PA1-SPION and PA2-
SPION, respectively, (Figure 28) the decrease in Ms value was caused by
the peptide coating24
. Moreover, as shown in Figure 28, peptide-SPION
complexes have zero coercivity fields indicating that these nanoparticles are
superparamagnetic.
51
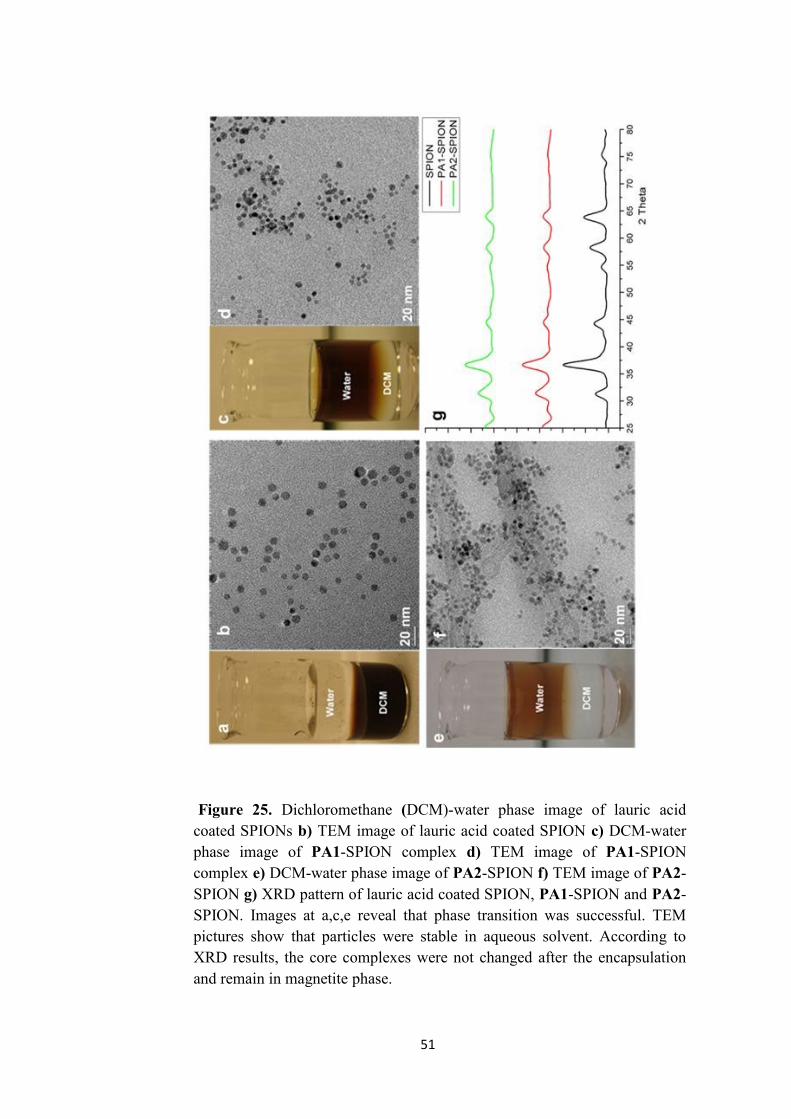
Figure 25. Dichloromethane (DCM)-water phase image of lauric acid
coated SPIONs b) TEM image of lauric acid coated SPION c) DCM-water
phase image of PA1-SPION complex d) TEM image of PA1-SPION
complex e) DCM-water phase image of PA2-SPION f) TEM image of PA2-
SPION g) XRD pattern of lauric acid coated SPION, PA1-SPION and PA2-
SPION. Images at a,c,e reveal that phase transition was successful. TEM
pictures show that particles were stable in aqueous solvent. According to
XRD results, the core complexes were not changed after the encapsulation
and remain in magnetite phase.

52
Figure 26. TEM image of PA1-SPION complex stained with uranyl
acetate. b) TEM image of PA2-SPION complex stained with
phosphotungstic acid. Uranyl acetate is able to bind organic molecules
whereas phospotungstic acid dyed the background. Based on the stained
particles and background, the encapsulated particles total sizes were around
30 nm.
Figure 27. FT-IR spectra of SPION, PA1-SPION and PA2-SPION. The
lauric acid located on SPION surface did not contain amide group. However
after the encapsulation, peaks around 1560 cm-1
and 3300 cm-1
were
observed demostrating the existence of PA around the magnetic
nanoparticles.
53
Figure 28. Hysteresis loop graphs of PA1-SPION, PA2-SPION and SPION
obtained by VSM. Although, their magnetization value decreased, particles
still presents superparamagnetic behavior after PA modification.
54
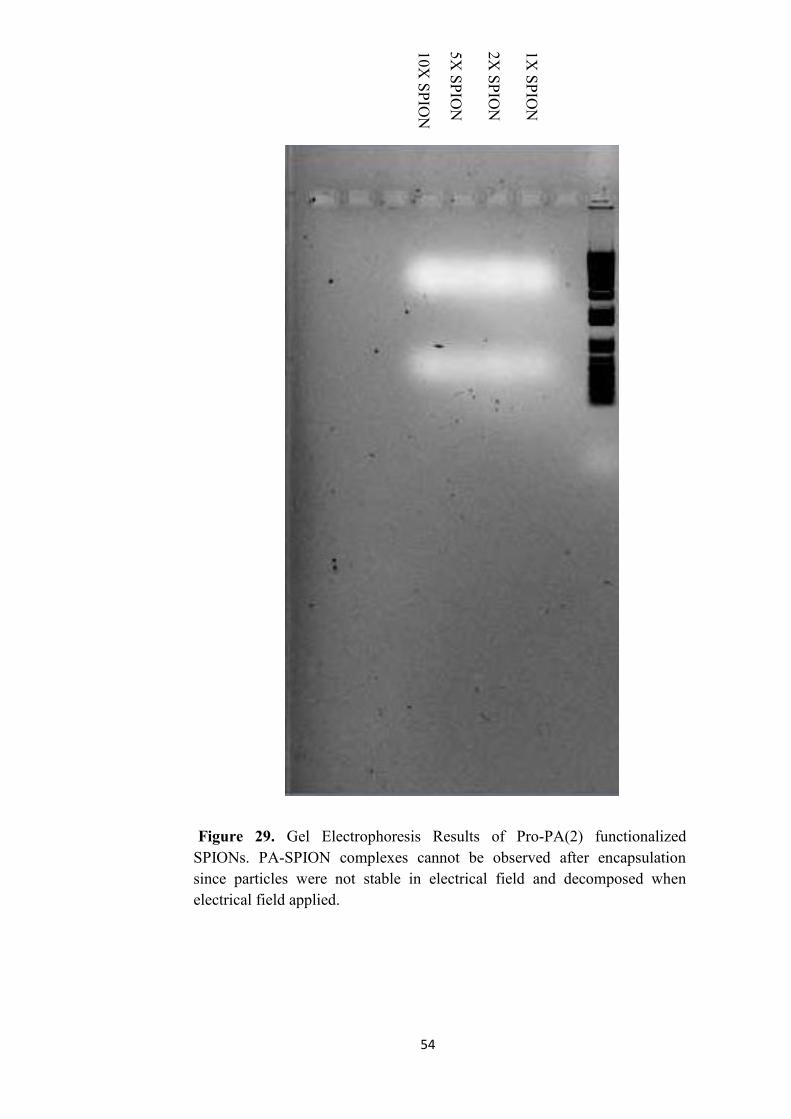
Figure 29. Gel Electrophoresis Results of Pro-PA(2) functionalized
SPIONs. PA-SPION complexes cannot be observed after encapsulation
since particles were not stable in electrical field and decomposed when
electrical field applied.
1X
SP
ION
2X
SP
ION
5X
SP
ION
10X
SP
ION

55
To analyze the purity of the SPION population obtained, gel
electrophoresis was applied to the sample with 1X TAE buffer at 120V for
an hour. According to the gel electrophoresis result shown in Figure 29,
peptide-SPION complex was affected by electrical field and decomposed.
Then the purity of the peptide-SPION complex was studied with UV Nano-
drop. Peptides have a specific absorbance at 205 nm25
. Peptide concentration
was calculated based on the absorbance value at 205 nm wavelength
(extinction coefficient chosen as 31) 25
. To remove the excess amount of
peptide, the solution was firstly centrifuged at 12500 rpm for 15 min. Then it
was centrifuged at 10000 rpm for 15 min. According to the UV
spectrophotometry measurements, peptide concentration was found to be
4.97 mg/ml before the washing step, and 0.198 mg/ml after (Figure30).
Figure 30. UV spectrum of peptide-SPION solutions before and after
washing step. Excess peptides were successfully removed after 2 subsequent
centrifugation steps.
56
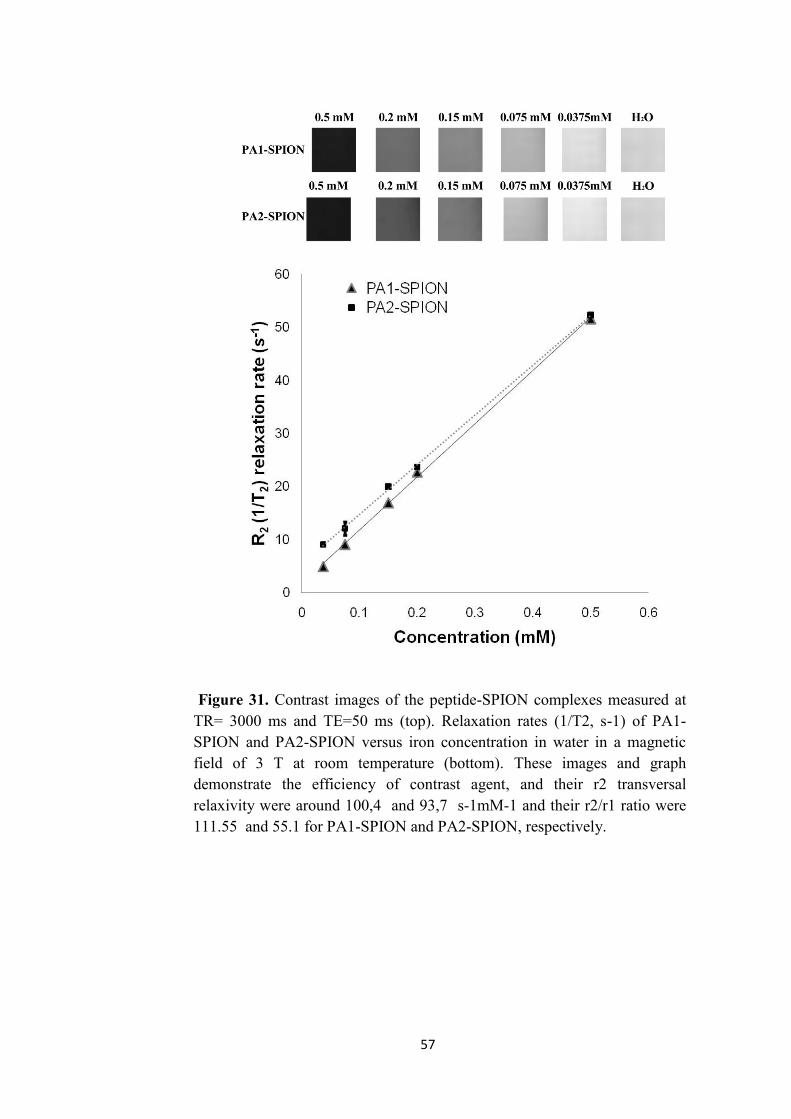
Contrast agents locally enhance the response of the water molecules to
the magnetic field15
. SPIONs are negative contrast agents and they reduce
T2 relaxation time of the water protons resulting in darker signals, and the
efficiency of the contrast agent depends on the relaxivity and r2/r1 values26
.
Relaxation rates R1 and R2 reveal the relaxivity values r1 and r2 of SPIONs
which depend on the total metal concentration. These values were
investigated under 3T magnetic field and r1 and r2 relaxivity values of PA1-
SPION and PA2-SPION were measured. r1 and r2 values of PA1-SPIONs
were 0.9 mM-1
s-1
and 100.4 mM-1
s-1
, whereas, that of PA2-SPION were 1.8
mM-1
s-1
and 93.7 mM-1
s-1
, respectively (Figure 31, table 1). As mentioned
above, r2/r1 is another feature determining the efficiency of the SPIONs.
Measured value of r2/r1 ratio for PA1-SPION was 111.55 and 52.1 for PA2-
SPION. The r2 values observed here were close to the commercial ones,
whereas r2/r1 values were much greater than the commercial ones 27-30.
57
Figure 31. Contrast images of the peptide-SPION complexes measured at
TR= 3000 ms and TE=50 ms (top). Relaxation rates (1/T2, s-1) of PA1-
SPION and PA2-SPION versus iron concentration in water in a magnetic
field of 3 T at room temperature (bottom). These images and graph
demonstrate the efficiency of contrast agent, and their r2 transversal
relaxivity were around 100,4 and 93,7 s-1mM-1 and their r2/r1 ratio were
111.55 and 55.1 for PA1-SPION and PA2-SPION, respectively.
58
Table 1. Physicochemical properties of peptide-SPION complexes
SPION
coating
size by
TEM
(nm)
size by
DLS
(nm)
Transver
sal
Relaxivit
y (r2)
(s-1
mM-1
)
r2/r1
Saturation
Magnetization
(Ms) (emu/g)
Lauric acid 7 nm 8-10 nm --- --- 53
P1 24 nm
24-32
nm
100.4 111.55 8
P2 30 nm
26-38
nm
93.7 55.1 5
3.4. Surface Modification of SPIONs with APTES
molecules
Surfactant group attaches to the core of the iron oxide with coordination
bond. As mentioned earlier, peptide-SPION is not stable in electrical field.
Herein, we search for an alternative system in place of peptide-SPION
complex. APTES modification is one of the best studied molecule forming
water soluble SPIONs. Briefly, 10 mg SPION was diluted in 100 ml hexane
and 0.5 ml APTES solution was added into the solution with 10 µL acetic
59
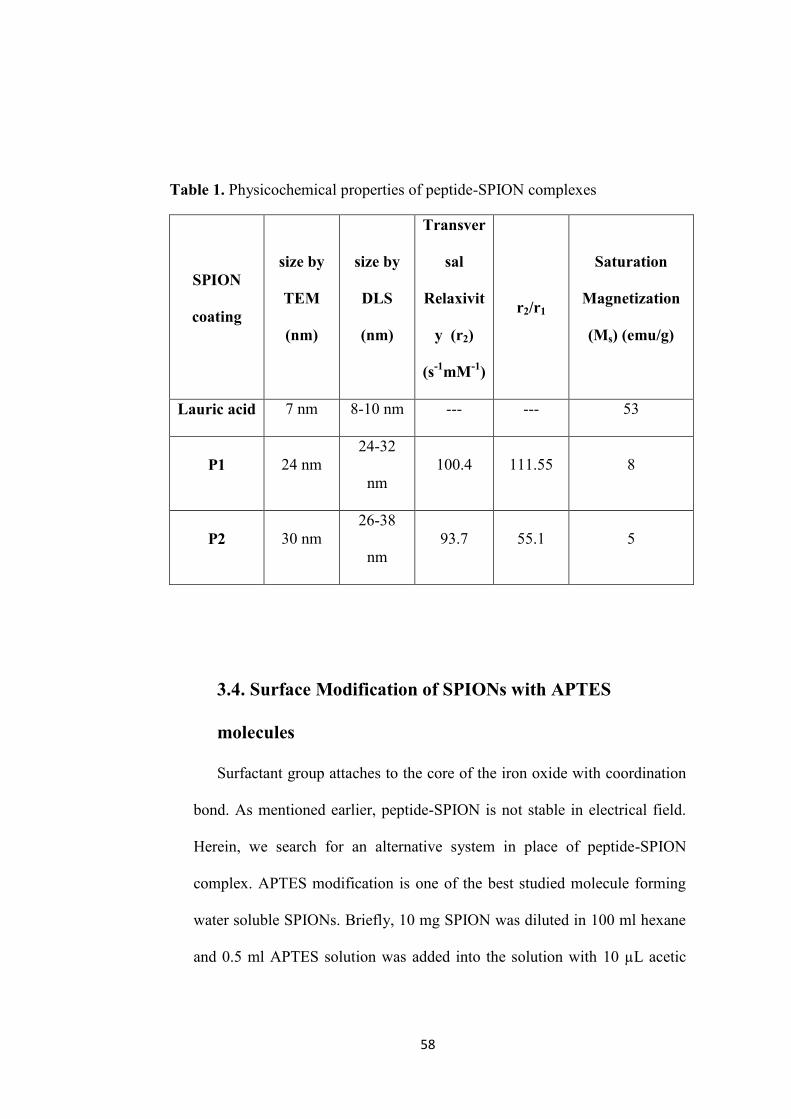
acid solutions. They were mixed and SPIONs were subsequently
precipitated. They were washed with the help of magnet. After the washing
step, they were characterized with FT-IR. The peak around 3400 cm-1
demonstrated the existence of APTES attached to the SPION surface (Figure
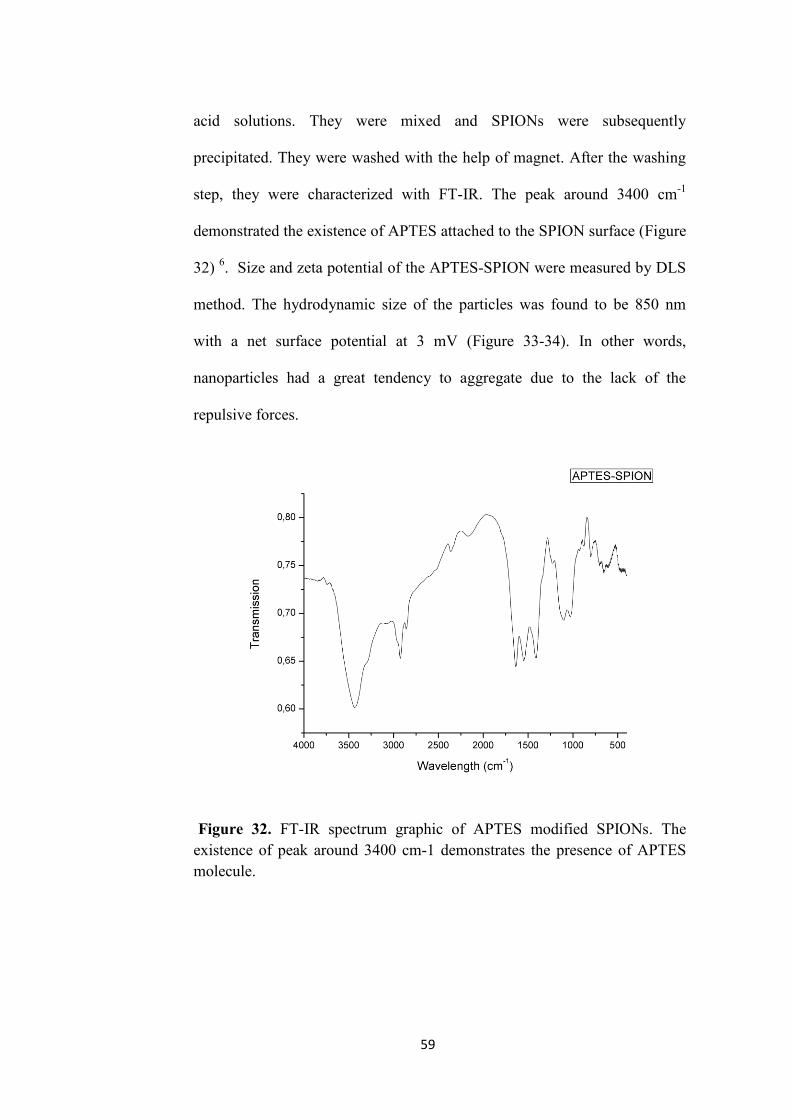
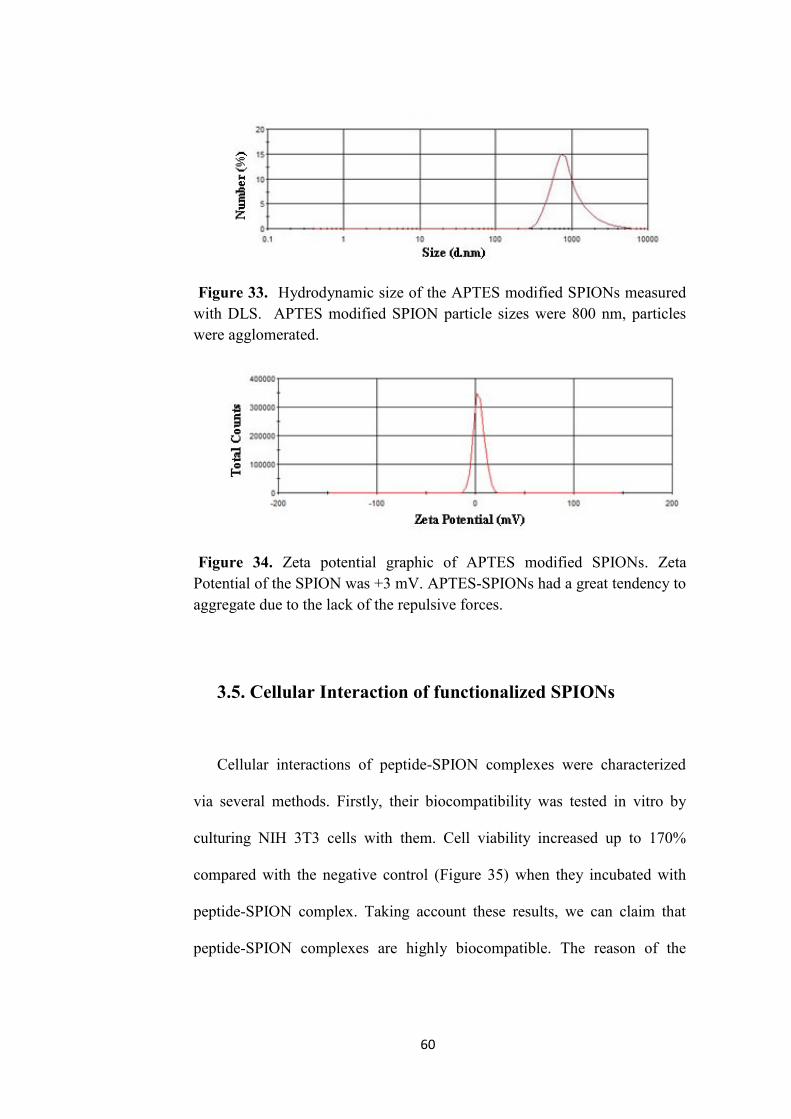
32) 6. Size and zeta potential of the APTES-SPION were measured by DLS
method. The hydrodynamic size of the particles was found to be 850 nm
with a net surface potential at 3 mV (Figure 33-34). In other words,
nanoparticles had a great tendency to aggregate due to the lack of the
repulsive forces.
Figure 32. FT-IR spectrum graphic of APTES modified SPIONs. The
existence of peak around 3400 cm-1 demonstrates the presence of APTES
molecule.
60
Figure 33. Hydrodynamic size of the APTES modified SPIONs measured
with DLS. APTES modified SPION particle sizes were 800 nm, particles
were agglomerated.
Figure 34. Zeta potential graphic of APTES modified SPIONs. Zeta
Potential of the SPION was +3 mV. APTES-SPIONs had a great tendency to
aggregate due to the lack of the repulsive forces.
3.5. Cellular Interaction of functionalized SPIONs
Cellular interactions of peptide-SPION complexes were characterized
via several methods. Firstly, their biocompatibility was tested in vitro by
culturing NIH 3T3 cells with them. Cell viability increased up to 170%
compared with the negative control (Figure 35) when they incubated with
peptide-SPION complex. Taking account these results, we can claim that
peptide-SPION complexes are highly biocompatible. The reason of the
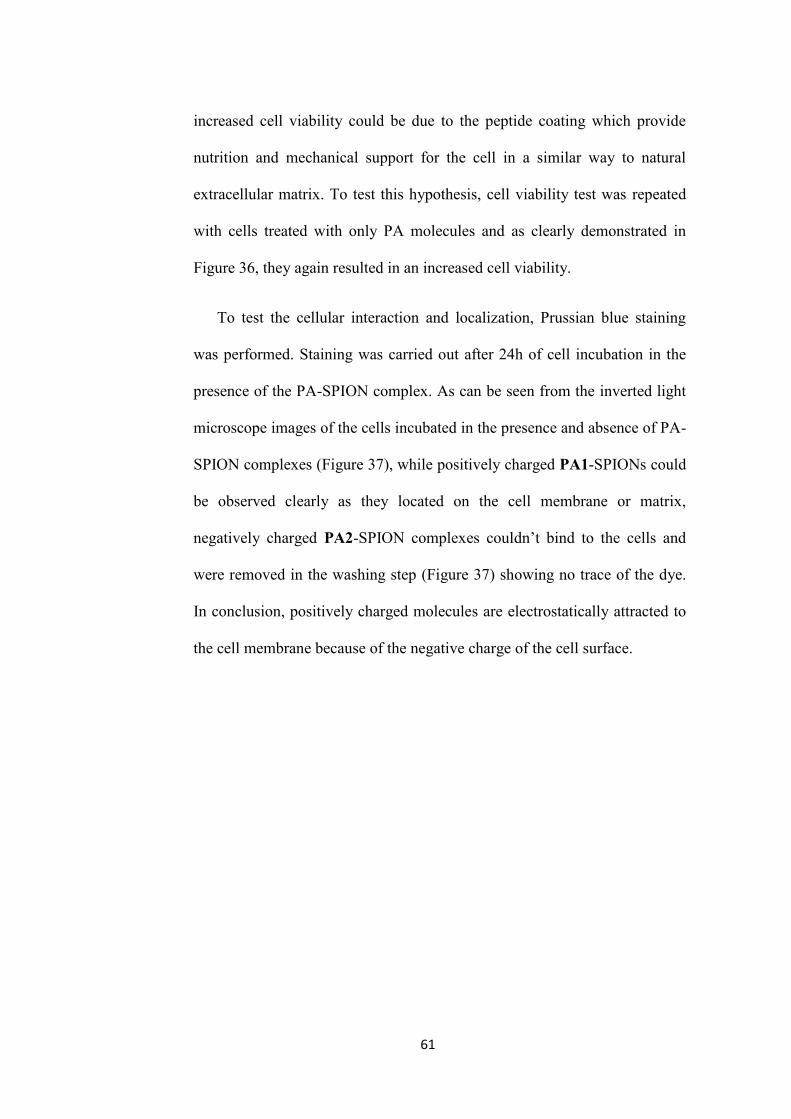
61
increased cell viability could be due to the peptide coating which provide
nutrition and mechanical support for the cell in a similar way to natural
extracellular matrix. To test this hypothesis, cell viability test was repeated
with cells treated with only PA molecules and as clearly demonstrated in
Figure 36, they again resulted in an increased cell viability.
To test the cellular interaction and localization, Prussian blue staining
was performed. Staining was carried out after 24h of cell incubation in the
presence of the PA-SPION complex. As can be seen from the inverted light
microscope images of the cells incubated in the presence and absence of PA-
SPION complexes (Figure 37), while positively charged PA1-SPIONs could
be observed clearly as they located on the cell membrane or matrix,
negatively charged PA2-SPION complexes couldn’t bind to the cells and
were removed in the washing step (Figure 37) showing no trace of the dye.
In conclusion, positively charged molecules are electrostatically attracted to
the cell membrane because of the negative charge of the cell surface.

62
Figure 35. Cell Viability results of PA1-SPION and PA2-SPION incubated
cells. Viability of the NIH3T3 cells incubated with SPIONs was increased
up to 160 %.
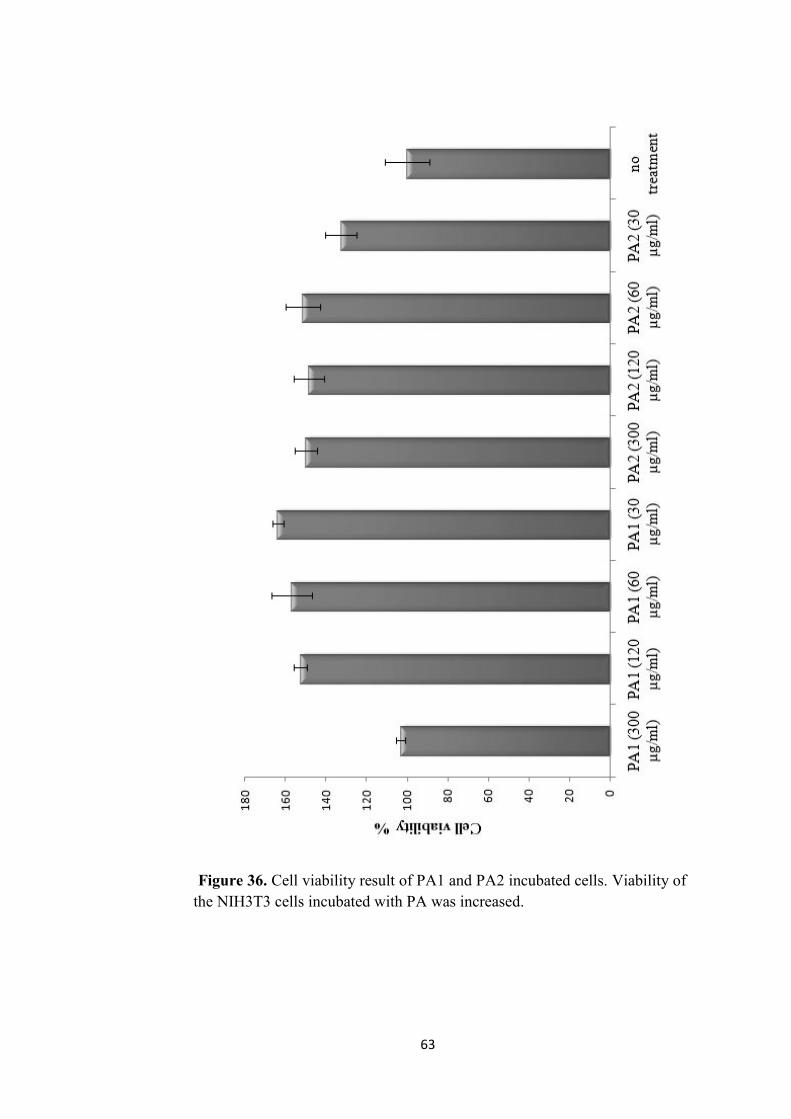
63
Figure 36. Cell viability result of PA1 and PA2 incubated cells. Viability of
the NIH3T3 cells incubated with PA was increased.

64
Figure 37. Cellular localization images of a) PA1-SPION b) PA2-SPION
c) Negative Control. Positively charged SPIONs were located around cells
whereas negatively charged SPIONs were removed at washing step.
65
3.6 Conjugation of SPIONs with Proteins
Targeted therapy and imaging is the feature direction of the medicine.
Targeted molecules would not only increase the effectiveness of the carried
molecules but also would decrease their side effects to the untargeted tissues
or cells. Protein conjugation is one of the ways to target molecules into the
desired area. In this study, we aimed to develop targeted superparamagnetic
contrast agents modified with peptides. For that purpose, we conjugated
streptavidin molecules with the PA2-SPION, and biotin with APTES
modified SPIONs. Streptavidin has high affinity to biotin and they are often
used for the protein conjugation studies. Thus, we attempted to conjugate
proteins (Streptavidin or biotin) on SPION surface by EDC/NHS
conjugation method. A representative diagram of conjugation studies with
EDC/NHS reaction represented in Figure 38. EDC/NHS reaction has two
distinctive steps. At the first step free carboxyl group interacted with EDC
and NHS will stabilize the EDC group. This step has to be done at pH 5-6
where EDC mostly active. Then the activated molecule can be conjugated
with a molecule that contains amine group. This step needs to be in a pH
above 7 where EDC is in inactive form. Later, SPIONs are activated through
EDC/NHS reaction and then conjugated with streptavidin molecules.

66
Figure 38. Representative scheme of conjugation studies. EDC binds to
carboxyl groups, and then NHS stabilizes the complex. A molecule with
amide group can be conjugated after carboxyl activation.
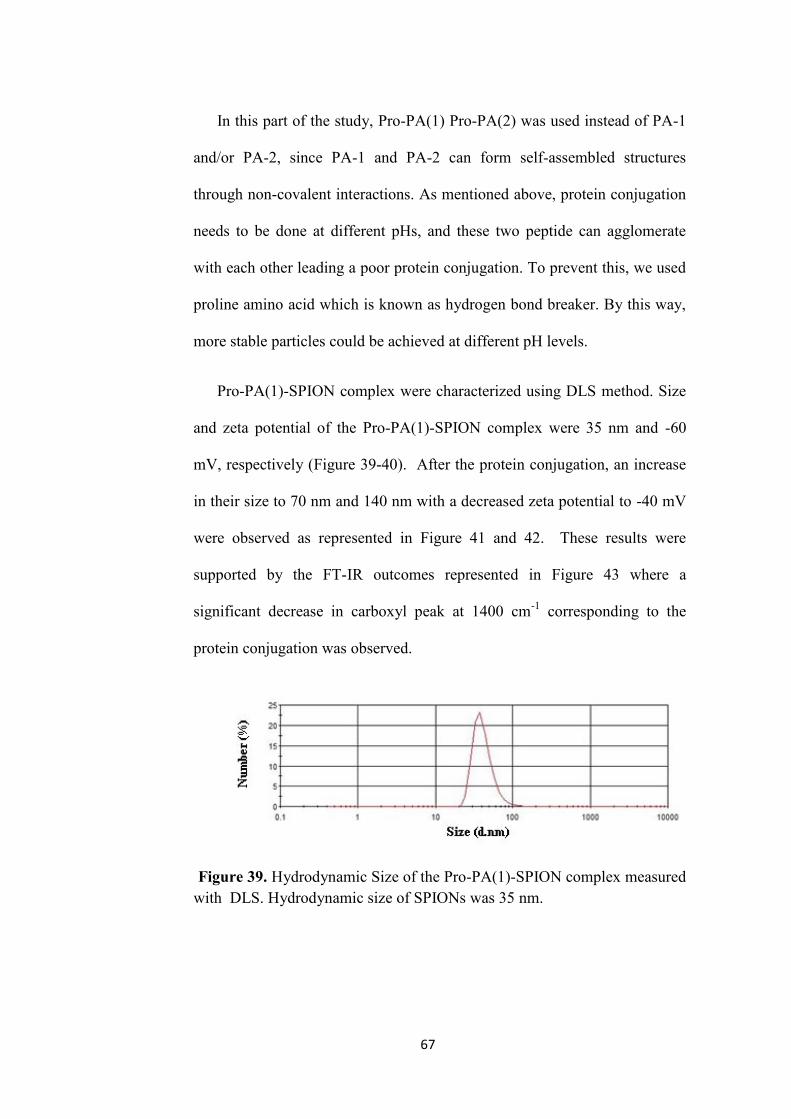
67
In this part of the study, Pro-PA(1) Pro-PA(2) was used instead of PA-1
and/or PA-2, since PA-1 and PA-2 can form self-assembled structures
through non-covalent interactions. As mentioned above, protein conjugation
needs to be done at different pHs, and these two peptide can agglomerate
with each other leading a poor protein conjugation. To prevent this, we used
proline amino acid which is known as hydrogen bond breaker. By this way,
more stable particles could be achieved at different pH levels.
Pro-PA(1)-SPION complex were characterized using DLS method. Size
and zeta potential of the Pro-PA(1)-SPION complex were 35 nm and -60
mV, respectively (Figure 39-40). After the protein conjugation, an increase
in their size to 70 nm and 140 nm with a decreased zeta potential to -40 mV
were observed as represented in Figure 41 and 42. These results were
supported by the FT-IR outcomes represented in Figure 43 where a
significant decrease in carboxyl peak at 1400 cm-1
corresponding to the
protein conjugation was observed.
Figure 39. Hydrodynamic Size of the Pro-PA(1)-SPION complex measured
with DLS. Hydrodynamic size of SPIONs was 35 nm.
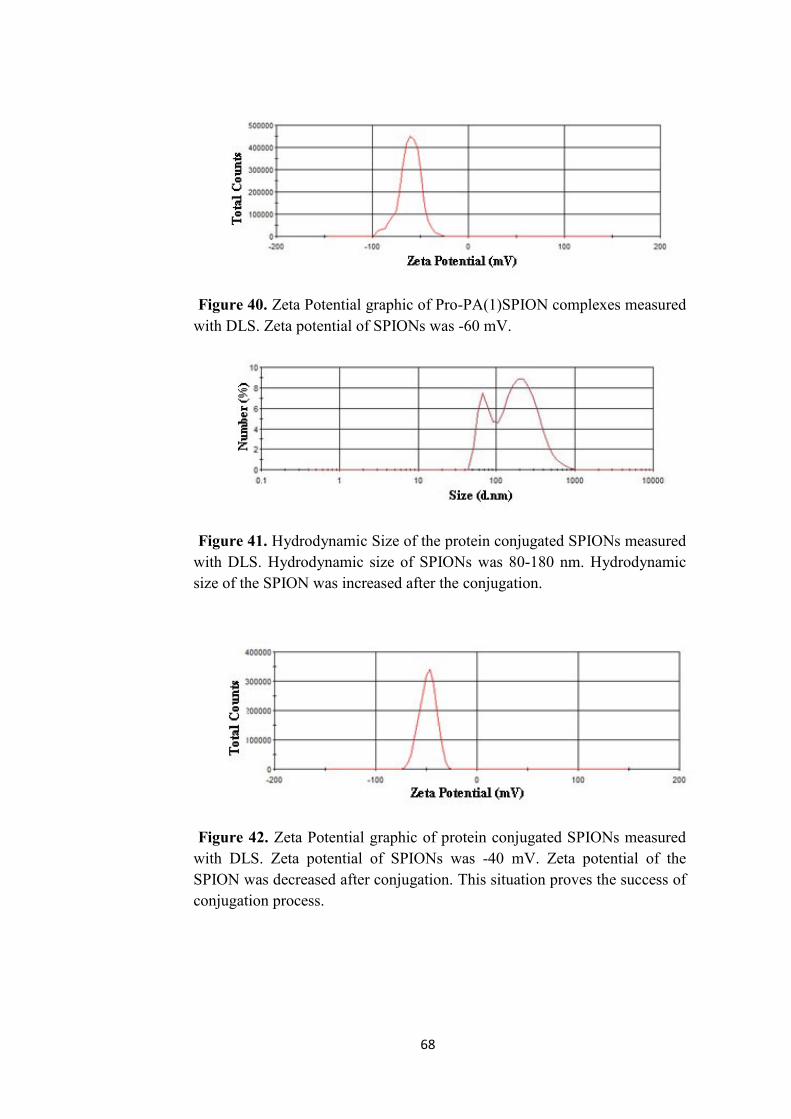
68
Figure 40. Zeta Potential graphic of Pro-PA(1)SPION complexes measured
with DLS. Zeta potential of SPIONs was -60 mV.
Figure 41. Hydrodynamic Size of the protein conjugated SPIONs measured
with DLS. Hydrodynamic size of SPIONs was 80-180 nm. Hydrodynamic
size of the SPION was increased after the conjugation.
Figure 42. Zeta Potential graphic of protein conjugated SPIONs measured
with DLS. Zeta potential of SPIONs was -40 mV. Zeta potential of the
SPION was decreased after conjugation. This situation proves the success of
conjugation process.

69
Figure 43. FT-IR spectrum of Pro-PA(1)-SPION and protein conjugated
SPION. The peak located at 1400 cm-1 belongs to carboxyl group. There
was significant decrease at carboxyl peak after streptavidin conjugation
demonstrating a successful protein conjugation.
Protein conjugation was also studied with APTES modified SPIONs.
Firstly, biotin was activated through EDC/NHS reaction. 1 mg biotin mixed
with 11 mg EDC and 15 mg NHS in 5 ml MES buffer (0.1M, pH 5). This
solution was mixed overnight, and then was left to conjugate through the
amine groups of APTES. Before the conjugation reaction, hydrodynamic
size of the APTES-SPION was found to be 850 nm whereas their zeta
potential was 3 mV (Figure 44, 45). After the biotin conjugation, zeta
potential of the SPIONs significantly decreased to -28 mV and their
hydrodynamic size decreased to 110 nm. Nanoparticles are known to be
more stable when they have zeta potential values around or higher than ±30
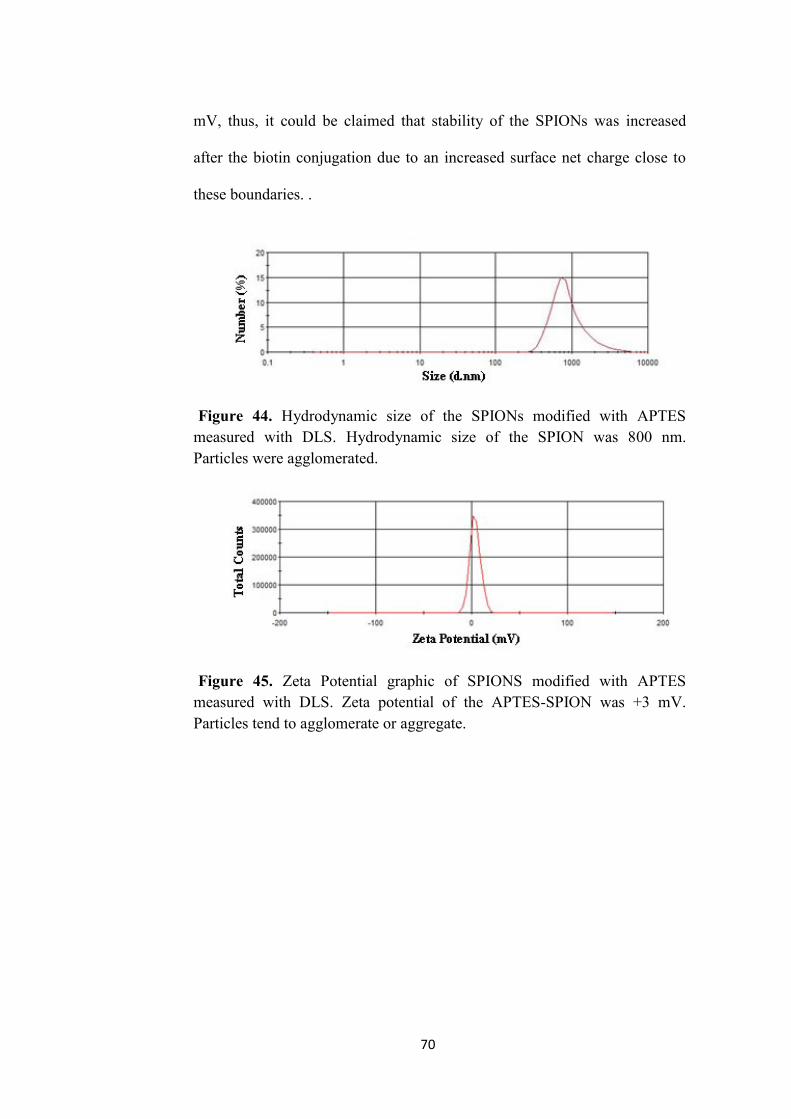
70
mV, thus, it could be claimed that stability of the SPIONs was increased
after the biotin conjugation due to an increased surface net charge close to
these boundaries. .
Figure 44. Hydrodynamic size of the SPIONs modified with APTES
measured with DLS. Hydrodynamic size of the SPION was 800 nm.
Particles were agglomerated.
Figure 45. Zeta Potential graphic of SPIONS modified with APTES
measured with DLS. Zeta potential of the APTES-SPION was +3 mV.
Particles tend to agglomerate or aggregate.
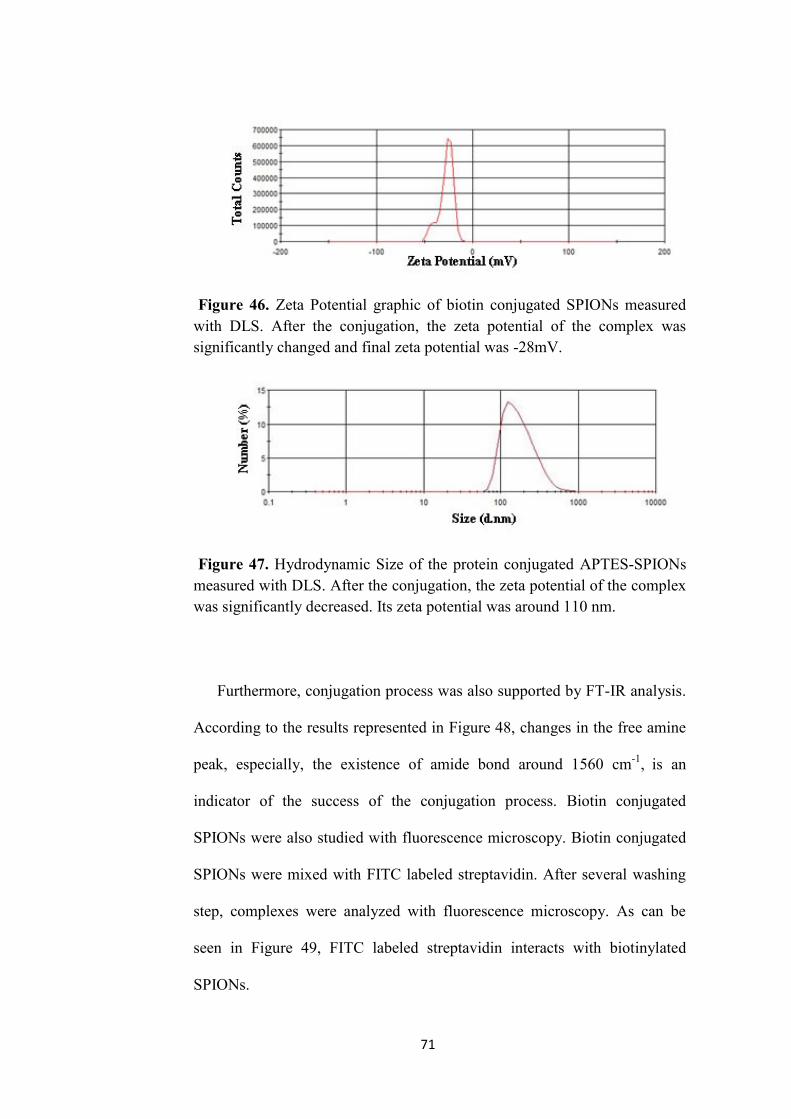
71
Figure 46. Zeta Potential graphic of biotin conjugated SPIONs measured
with DLS. After the conjugation, the zeta potential of the complex was
significantly changed and final zeta potential was -28mV.
Figure 47. Hydrodynamic Size of the protein conjugated APTES-SPIONs
measured with DLS. After the conjugation, the zeta potential of the complex
was significantly decreased. Its zeta potential was around 110 nm.
Furthermore, conjugation process was also supported by FT-IR analysis.
According to the results represented in Figure 48, changes in the free amine
peak, especially, the existence of amide bond around 1560 cm-1
, is an
indicator of the success of the conjugation process. Biotin conjugated
SPIONs were also studied with fluorescence microscopy. Biotin conjugated
SPIONs were mixed with FITC labeled streptavidin. After several washing
step, complexes were analyzed with fluorescence microscopy. As can be
seen in Figure 49, FITC labeled streptavidin interacts with biotinylated
SPIONs.
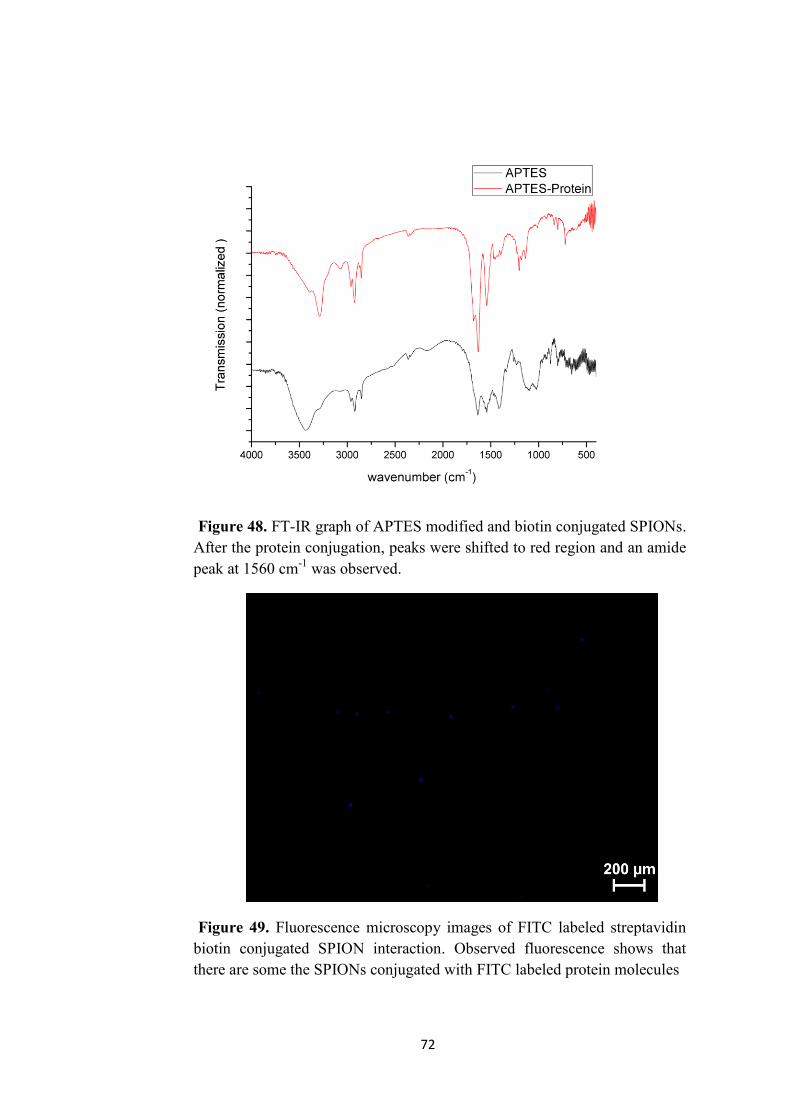
72
Figure 48. FT-IR graph of APTES modified and biotin conjugated SPIONs.
After the protein conjugation, peaks were shifted to red region and an amide
peak at 1560 cm-1
was observed.
Figure 49. Fluorescence microscopy images of FITC labeled streptavidin
biotin conjugated SPION interaction. Observed fluorescence shows that
there are some the SPIONs conjugated with FITC labeled protein molecules
73
CHAPTER 4
CONCLUSIONS AND FUTURE DIRECTION
4.1. Conclusion
Several methods have been developed to synthesize SPIONs. In the first
part of this study, comparison studies were carried out in order to find the
best fitting method of SPION synthesis. SPIONs are exclusively produced
by hydrolytic routes such as co-precipitation. The growth of iron oxide in
aqueous media is controlled via large number kinetic factors. On account of
this, widen particle size distribution was obtained using this method where
the produced particles tend to aggregate in aqueous solutions. In contrast,
another known method, thermal decomposition method, was shown to be
overcoming these drawbacks of co-precipitation method by adopting
pyrolysis rather than hydrolysis. In thermal decomposition method, the
numbers of kinetic factors are greatly reduced and thus uniform SPIONs can
easily be synthesized.
In thermal decomposition method; acids, amine bearing long
hydrophobic tail molecules are used to coat SPIONs eventually provide
them solubility in non-polar solvents. For their medical use, surface
engineering has to be applied.
74
Herein, we developed a novel method for coating SPIONs based on the
intercalation of PA molecules with SPIONs by hydrophobic interactions.
The hydrophobic encapsulation of SPIONs by PA molecules provided
solubility in water and enabled us to overcome problems associated with the
surfactant exchange for SPION coating such as changes in crystallinity,
synthesis efficiency, and conformational changes in proteins.
Peptide amphiphile molecules provide stability to SPIONS in aqueous
solutions due to their amphiphilic character. Moreover, an incremented
biofunctionality based on the peptide sequence and enhanced
physicochemical properties of SPIONs could be achieved by the peptide
coating. Also SPPS protocol enables control over peptide sequences 31
for
more specific and selective localization of nanoparticles to target cells. By
using homing peptide sequences 32
, it is possible to target SPIONs to the
organs such as brain 33, kidney 33
, hearth 34, breast 32
and several other tumor
tissues 35,36
. Thus, by using non-covalent functionalization of SPIONs with
appropriate peptide sequences, cellular or molecular targeting is possible
without any further coupling process. There are specific molecular tags, so
called “zip codes” that can be specifically over-regulated either by normal or
abnormal organs or tissues, such as cancer tissues. These zip codes can be
recognized by specific homing proteins or peptides.
To improve the signal to noise ratio, contrast agents have to be used. In
this study, use of peptide-SPION complex as MRI contrast agent was also
studied. There are several factors have to be taken into consideration for a
75
good contrast agent which are size of the nanoparticles, magnetization
values of nanoparticles as well as r2 values, r2/r1 values and biocompability.
The size of the nanoparticles was around 35 nm which is acceptable for
biological uses. The magnetization values of the peptide-SPION complex
(PA1-SPION and PA2-SPION) were in a sufficient range for their use in
biological applications. The efficiency of the contrast agents are determined
mostly with r2 and r2/r1 ratio. In this study, r2 values of PA1-SPION and
PA2-SPION were 100.4 and 93.7 mm-1
s-1
respectively which are very close
to commercial examples as stated above. The r2/r1 ratio was much greater
than the commercial examples. In vitro cell culture experiments on NIH 3T3
cells revealed that the peptide-SPION complex promises biocompatible
feature.
Briefly, we developed a new method to synthesize a biofunctional and
biocompatible material. The synthesis protocol consists of just mixing the
material in appropriate conditions. As mentioned above MR active system
shown here can be selectively functionalized by using various peptide
molecules for targeting specific tissues.
Protein conjugation was also studied with these complexes. Several
methods have been used for the protein conjugation. EDC/NHS reaction was
used for the conjugation studies. Pro-PA(1) and Pro-PA(2) SPION
complexes and APTES modified nanoparticles complexes were incubated
with protein molecules both type of particles were successfully synthesized.
These studies are still in progress.
76
Whilst SPIONs have tremendous potential in a wide range of
applications, to date problems in their stability has limited the wide-spread
use of them. In this direction, the present thesis is a contribution to the
optimization of a rapid and efficient method of SPION preparation and
surface modification, and explores their potential as MRI contrast agent.
4.2 Future Direction
SPIONs can also be functionalized with various molecules such as
proteins for the targeted therapy and diagnosis. Herein, we also demonstrate
protein conjugation studies which can also be used for the targeted imaging.
Conjugation was studied with peptide-SPION and APTES-SPION
complexes. Although, peptide-SPION complex offers great feature with
mimicking procedure, to increase the selectivity and specificity protein can
be conjugated with amphiphilic peptides.
APTES covalently attached to SPIONs. SPION complex gained
durability in different circumstances; they tend to aggregate, though. On
account of that, purification and isolation of SPIONs are much easier than
the peptide-SPION complex. The self-assembly on peptide-SPION will be
studied. Self-assembled system is a new era in nanomedicine especially in
tissue engineering and delivery applications. Tissues need unique cell
scaffolds which have unique chemical and mechanotransduction properties.
The chemical factors can be supplied with the peptide that is synthesized
with SPPS protocol. SPIONs offer tremendous future for the tissue
engineering applications. Rheological and optical properties of peptide-

77
SPION complex will be studied. Rheological properties of peptide-SPION
complex represent their mechanical properties which are necessary
information for tissue engineering process and drug delivery system. Their
self-assembly feature will also be studied with circular dichroism. The gel
formation will be visualized with SEM TEM and AFM.
Directed assembly with peptide-SPION will also be studied. Under the
magnetic field these SPIONs can be formed aligned structure. Herein a
unique magnet will be developed and peptide-SPION complex will be
located on them.
For therapeutic applications and other imaging properties, we are
working on a peptide coated magnetite and dye doped silica nanoparticles.
We are also working on a polymer and peptide coated SPION complexes.

78
REFERENCES
(1) Vijay K. Varadan, L. C., Jining Xie Nanomedicine: Design and
Applications of Magnetic Nanomaterials, Nanosensors and Nanosystems; wiley,
2008.
(2) Arruebo, M.; Fernández-Pacheco, R.; Ibarra, M. R.; Santamaría,
J. Nano Today 2007, 2, 22.
(3) Kumar, C. S. S. R. Magnetic Nanomaterials; wiley, 2009.
(4) Gubin, S. P. Magnetic Nanoparticles; wiley-vch, 2009.
(5) NDT, r. c.; center, N. r., Ed.; NDT resource center.
(6) Lu, A.-H.; Salabas, E. L.; Schüth, F. Angewandte Chemie
International Edition 2007, 46, 1222.
(7) Jun, Y.-w.; Lee, J.-H.; Cheon, J. Angewandte Chemie
International Edition 2008, 47, 5122.
(8) Gupta, A. K.; Gupta, M. Biomaterials 2005, 26, 3995.
(9) Schladt, T. D.; Schneider, K.; Schild, H.; Tremel, W. Dalton
Transactions 2011, 40, 6315.
(10) Sun, S.; Zeng, H.; Robinson, D. B.; Raoux, S.; Rice, P. M.;
Wang, S. X.; Li, G. Journal of the American Chemical Society 2003, 126, 273.
(11) Laurent, S.; Forge, D.; Port, M.; Roch, A.; Robic, C.; Vander
Elst, L.; Muller, R. N. Chemical Reviews 2008, 108, 2064.
(12) Elimelech, M.; Gregory, J.; Jia, X.; Williams, R. A.; Gregory, J.;
Jia, X.; Williams, R. A. In Particle Deposition & Aggregation; Butterworth-
Heinemann: Woburn, 1995, p 33.

79
(13) Malvern
http://www.malvern.com/LabEng/industry/colloids/dlvo_theory.htm
(14) Sun, C.; Lee, J. S. H.; Zhang, M. Advanced Drug Delivery
Reviews 2008, 60, 1252.
(15) Na, H. B.; Song, I. C.; Hyeon, T. Advanced Materials 2009, 21,
2133.
(16) Zhou, L.; Yuan, J.; Wei, Y. Journal of Materials Chemistry 2011,
21, 2823.
(17) Wang, G.; Su, X. Analyst 2011, 136, 1783.
(18) Brown, M. A. a. S., R. C MRI: Basic Principles and Applications;
3.rd ed.; Wiley: Hoboken: New York, 2005.
(19) Qiao, R.; Yang, C.; Gao, M. Journal of Materials Chemistry
2009, 19, 6274.
(20) EMRIC. http://www.cardiff.ac.uk/biosi/researchsites/emric/
(21) De Palma, R.; Peeters, S.; Van Bael, M. J.; Van den Rul, H.;
Bonroy, K.; Laureyn, W.; Mullens, J.; Borghs, G.; Maes, G. Chemistry of
Materials 2007, 19, 1821.
(22) van Oss, C. J. In Interface Science and Technology; Carel, J. v.
O., Ed.; Elsevier: 2008; Vol. Volume 16, p 31.
(23) Srinivasan, B.; Huang, X. Chirality 2008, 20, 265.
(24) Tartaj, P.; Serna, C. J. Journal of the American Chemical Society
2003, 125, 15754.
(25) Scopes, R. K. Analytical Biochemistry 1974, 59, 277.
80
(26) Mail nder, V.; Landfester, K. Biomacromolecules 2009, 10,
2379.
(27) Weissleder, R.; Stark, D. D.; Engelstad, B. L.; Bacon, B. R.;
Compton, C. C.; White, D. L.; Jacobs, P.; Lewis, J. Am. J. Roentgenol. 1989,
152, 167.
(28) Wang, L.; Neoh, K. G.; Kang, E. T.; Shuter, B.; Wang, S.-C.
Advanced Functional Materials 2009, 19, 2615.
(29) Reimer, P.; Rummeny, E. J.; Daldrup, H. E.; Balzer, T.;
Tombach, B.; Berns, T.; Peters, P. E. Radiology 1995, 195, 489.
(30) Jung, C. W.; Jacobs, P. Magn. Reson. Imaging 1995, 13, 661.
(31) W. C. Chan , P. D. W. Fmoc Solid Phase Peptide Synthesis A
Practical Approach; oxford university press inc.: new york, 2004.
(32) Essler, M.; Ruoslahti, E. Proceedings of the National Academy of
Sciences of the United States of America 2002, 99, 2252.
(33) Pasqualini, R.; Ruoslahti, E. Nature 1996, 380, 364.
(34) Zhang, L.; Hoffman, J. A.; Ruoslahti, E. Circulation 2005, 112,
1601.
(35) Arap, W.; Pasqualini, R.; Ruoslahti, E. Science 1998, 279, 377.
(36) Pasqualini, R.; Koivunen, E.; Kain, R.; Lahdenranta, J.;
Sakamoto, M.; Stryhn, A.; Ashmun, R. A.; Shapiro, L. H.; Arap, W.; Ruoslahti,
E. Cancer Research 2000, 60, 722.