binary phase diagram
16
3.012 Fundamentals of Materials Science Fall 2005 Lecture 19: 11.23.05 Binary phase diagrams Today: LAST TIME .........................................................................................................................................................................................2 ...........................................................................................................3 Eutectic Binary Systems ...............................................................................................................................................................2 Analyzing phase equilibria on eutectic phase diagrams Example eutectic systems .............................................................................................................................................................4 INVARIANT POINTS IN BINARY SYSTEMS ..........................................................................................................................................5 The phase rule and eutectic diagrams: eutectic invariant points .............................................................................................5 Other types of invariant points....................................................................................................................................................6 Congruent phase transitions........................................................................................................................................................7 INTERMEDIATE COMPOUNDS IN PHASE DIAGRAMS 3 ........................................................................................................................8 EXAMPLE BINARY PHASE DIAGRAMS ...............................................................................................................................................9 DELINEATING STABLE AND METASTABLE PHASE BOUNDARIES: SPINODALS AND MISCIBILITY GAPS ........................................ 11 Conditions for stability as a function of composition ............................................................................................................. 11 SUPPLEMENTARY INFORMATION (NOT TO BE TESTED): TERNARY SOLUTION PHASE DIAGRAMS............................................... 14 REFERENCES................................................................................................................................................................................... 16 Reading: W.D. Callister, Jr., “Fundamentals of Materials Science and Engineering,” Ch. 10S Phase Diagrams, pp. S67-S84. Supplementary Reading: Ternary phase diagrams (at end of today’s lecture notes) Lecture 19 – Binary phase diagrams 1 of 16 11/23/05
-
Upload
sudeepta-mondal -
Category
Documents
-
view
88 -
download
6
description
phase diagram of binary alloys
Transcript of binary phase diagram
3.012 Fundamentals of Materials Science Fall 2005
Lecture 19: 11.23.05 Binary phase diagrams
Today:
LAST TIME .........................................................................................................................................................................................2
...........................................................................................................3Eutectic Binary Systems...............................................................................................................................................................2Analyzing phase equilibria on eutectic phase diagrams Example eutectic systems.............................................................................................................................................................4
INVARIANT POINTS IN BINARY SYSTEMS ..........................................................................................................................................5The phase rule and eutectic diagrams: eutectic invariant points .............................................................................................5Other types of invariant points ....................................................................................................................................................6Congruent phase transitions........................................................................................................................................................7
INTERMEDIATE COMPOUNDS IN PHASE DIAGRAMS3 ........................................................................................................................8EXAMPLE BINARY PHASE DIAGRAMS ...............................................................................................................................................9DELINEATING STABLE AND METASTABLE PHASE BOUNDARIES: SPINODALS AND MISCIBILITY GAPS ........................................ 11
Conditions for stability as a function of composition ............................................................................................................. 11SUPPLEMENTARY INFORMATION (NOT TO BE TESTED): TERNARY SOLUTION PHASE DIAGRAMS............................................... 14REFERENCES................................................................................................................................................................................... 16
Reading: W.D. Callister, Jr., “Fundamentals of Materials Science and Engineering,” Ch. 10S Phase Diagrams, pp. S67-S84.
Supplementary Reading: Ternary phase diagrams (at end of today’s lecture notes)
Lecture 19 – Binary phase diagrams 1 of 1611/23/05
3.012 Fundamentals of Materials Science Fall 2005
Last time
Eutectic Binary Systems
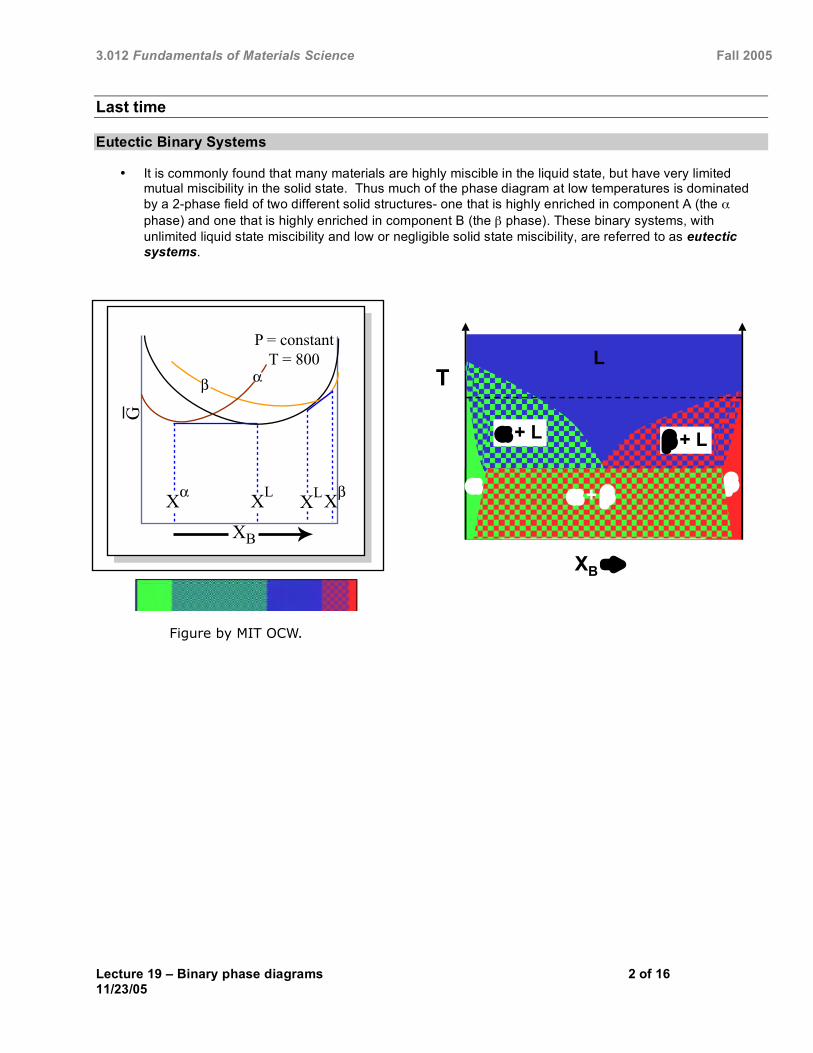
• It is commonly found that many materials are highly miscible in the liquid state, but have very limited mutual miscibility in the solid state. Thus much of the phase diagram at low temperatures is dominated by a 2-phase field of two different solid structures- one that is highly enriched in component A (the α phase) and one that is highly enriched in component B (the β phase). These binary systems, with unlimited liquid state miscibility and low or negligible solid state miscibility, are referred to as eutectic systems.
XB !
T
L
! "! + "
! + L " + L
��
X�X� XL XL
XB
G
P = constant T = 800
Figure by MIT OCW.
Lecture 19 – Binary phase diagrams 2 of 16 11/23/05
3.012 Fundamentals of Materials Science Fall 2005
Analyzing phase equilibria on eutectic phase diagrams
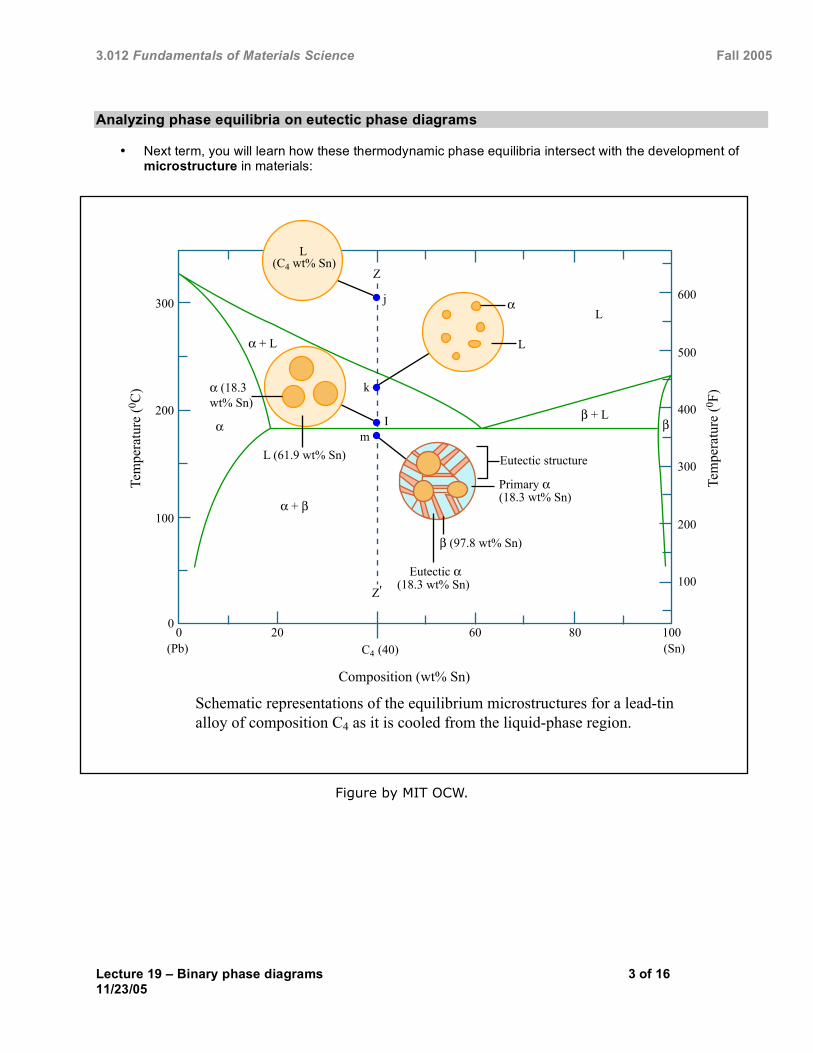
• Next term, you will learn how these thermodynamic phase equilibria intersect with the development of microstructure in materials:
Z
Z'
� + L
� + �
� + L �
L
L �
�
L (C4 wt% Sn)
� (18.3 wt% Sn)
j
k
I m
Eutectic structure
Primary � (18.3 wt% Sn)
� (97.8 wt% Sn)
Eutectic � (18.3 wt% Sn)
300
200
100
0 0 20 60 80
600
500
400
300
200
100
100
0 C)
0 F)
C4 (40)
Composition (wt% Sn)
Schematic representations of the equilibrium microstructures for a lead-tin alloy of composition C4 as it is cooled from the liquid-phase region.
(Pb) (Sn)
L (61.9 wt% Sn)
Tem
pera
ture
(
Tem
pera
ture
(
Figure by MIT OCW.
Lecture 19 – Binary phase diagrams 3 of 16 11/23/05
3.012 Fundamentals of Materials Science Fall 2005
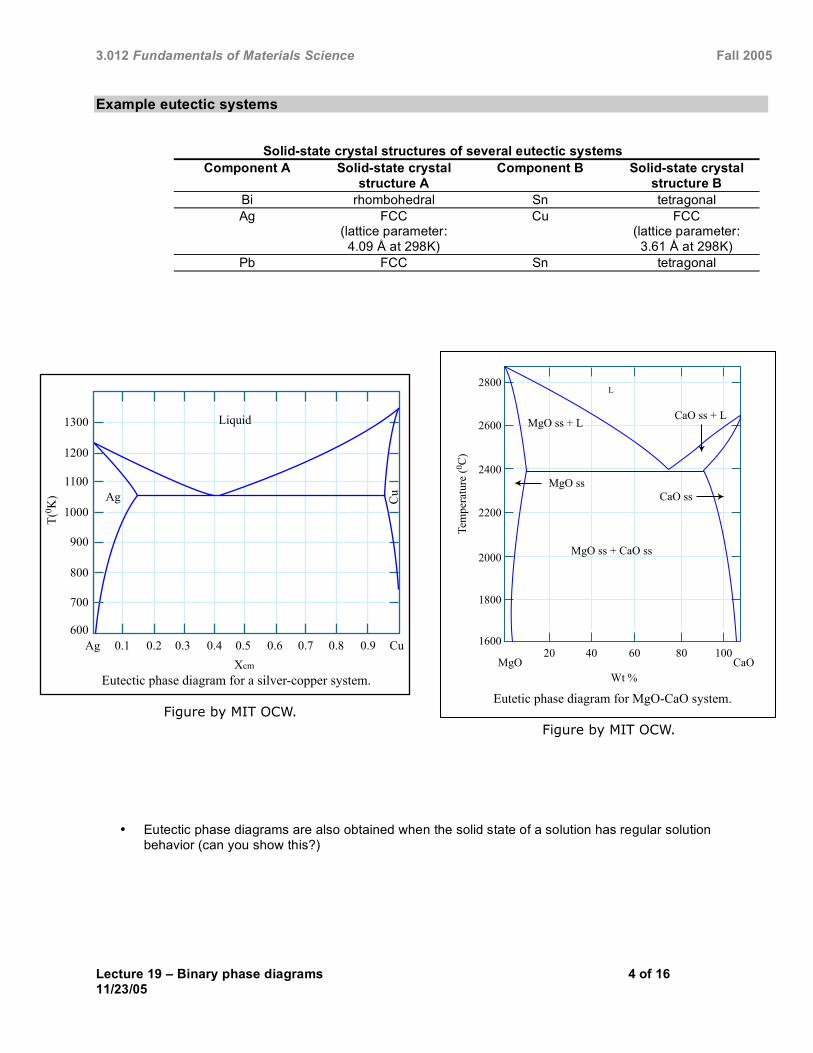
Example eutectic systems
Solid-state crystal structures of several eutectic systems Component A Solid-state crystal Component B Solid-state crystal
structure A structure B Bi rhombohedralAg FCC
(lattice parameter:
Sn tetragonal Cu FCC
(lattice parameter: 4.09 Å at 298K) 3.61 Å at 298K)
Pb FCC Sn tetragonal
Figure by MIT OCW. Figure by MIT OCW.
• Eutectic phase diagrams are also obtained when the solid state of a solution has regular solution behavior (can you show this?)
1300
1200
1000
900
800
700
600 Ag 0.1 0.2 0.3 0.4 0.5 0.6 0.7 0.8 0.9 Cu
Cu
Xcm
T( 0 K
)
Liquid
Ag 1100
Eutectic phase diagram for a silver-copper system.
2800
2600
2400
2200
2000
1800
1600
MgO CaO 20 40 60 80 100
0 C)
L
MgO ss + L
MgO ss
CaO ss + L
CaO ss
MgO ss + CaO ss
Wt %
Eutetic phase diagram for MgO-CaO system.
Tem
pera
ture
(
Lecture 19 – Binary phase diagrams 4 of 16 11/23/05

3.012 Fundamentals of Materials Science Fall 2005
Invariant points in binary systems
The phase rule and eutectic diagrams: eutectic invariant points
• All phase diagrams must obey the phase rule. Does our eutectic diagram obey it?
XB !
TL
! "! + "
! + L " + L
Lecture 19 – Binary phase diagrams 5 of 16 11/23/05

3.012 Fundamentals of Materials Science Fall 2005
Other types of invariant points
• Other transformations that occur in binary systems at a fixed composition and temperature (for constant pressure) are given titles as well:
o Two 2-phase regions join into one 2-phase region:
Eutectic: L <-> (α + β) (upper two region is liquid)
Eutectoid: γ <-> (α + β) (upper region is solid)
o One 2-phase region splits into two 2-phase regions:
Peritectic: (α + L) <-> β (upper two-phase region is solid + liquid)
Peritectoid: (α + γ) <-> β (upper two-phase region is solid + solid)
700
600
500
60 70 80 90
1200
1000
Composition (wt % Zn)
β + L
β + � �
� + L
P 5980C
L
β + α
β
α α + L
� + α5600C
E
0 C)
0 F)
labeled E (5600 0
Tem
pera
ture
(
Tem
pera
ture
(
A region of the copper-zinc phase diagram that has been enlarged to show eutectoid and peritectic invariant points , C, 74 wt% Zn) and P (598 C, 78.6 wt% Zn), respectively.
Figure by MIT OCW.
Note that each single-phase field is separated from other single-phase fields by a two-phase field.
Lecture 19 – Binary phase diagrams 6 of 16 11/23/05
3.012 Fundamentals of Materials Science Fall 2005
Congruent phase transitions
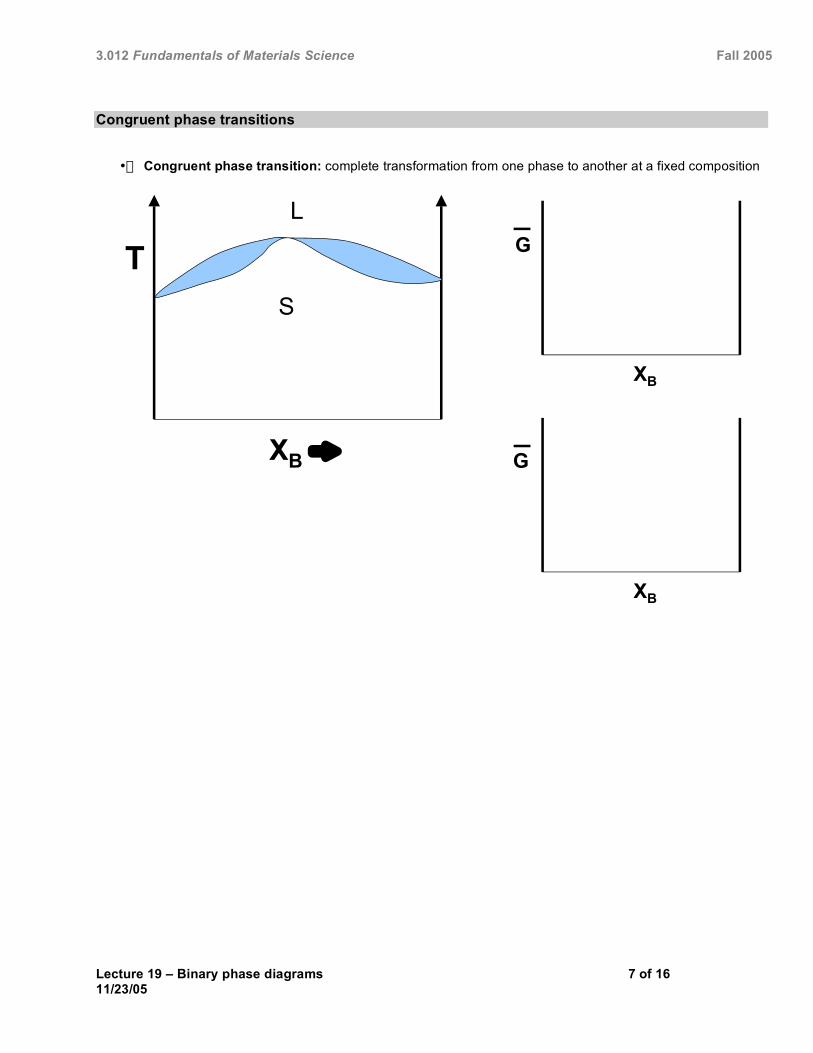
• Congruent phase transition: complete transformation from one phase to another at a fixed composition
XB !
T
S
L
XB
G
XB
G
L
S
Lecture 19 – Binary phase diagrams 7 of 16 11/23/05
3.012 Fundamentals of Materials Science Fall 2005
Intermediate Compounds in phase diagrams3
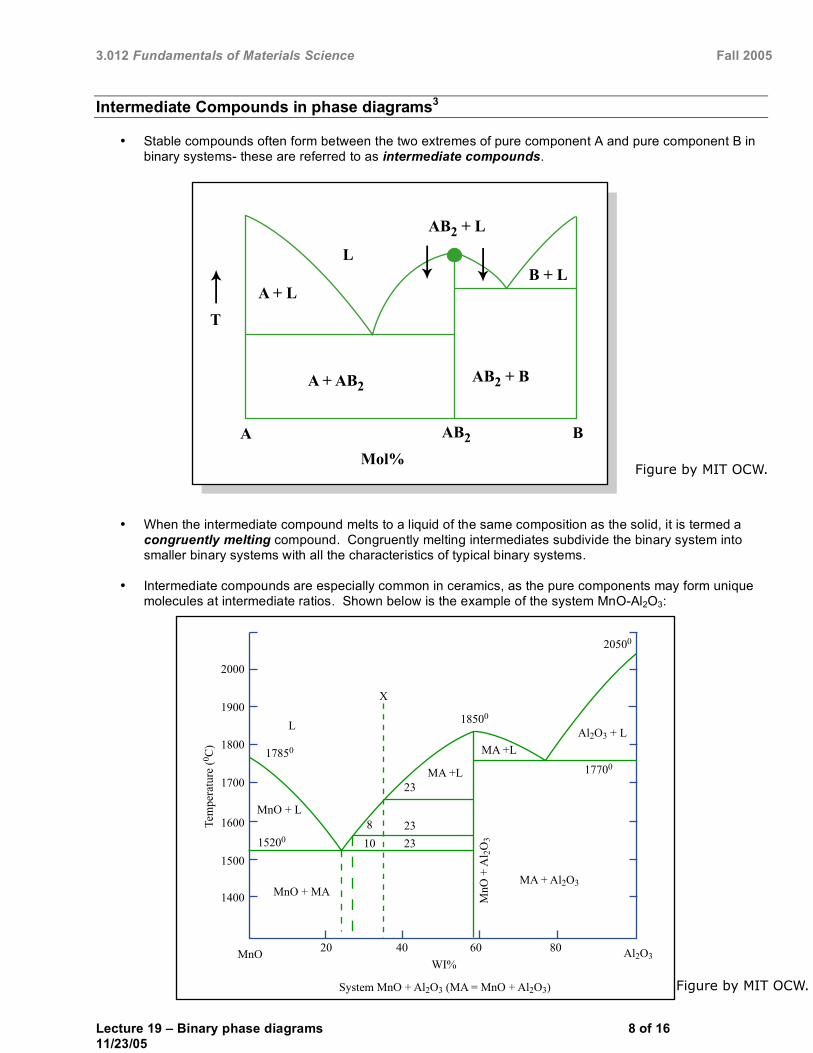
• Stable compounds often form between the two extremes of pure component A and pure component B in binary systems- these are referred to as intermediate compounds.
2
L
AB2 + B
A AB2 B
Mol%
T
B + L
AB2 + L
A + AB
A + L
Figure by MIT OCW.
• When the intermediate compound melts to a liquid of the same composition as the solid, it is termed a congruently melting compound. Congruently melting intermediates subdivide the binary system into smaller binary systems with all the characteristics of typical binary systems.
• Intermediate compounds are especially common in ceramics, as the pure components may form unique molecules at intermediate ratios. Shown below is the example of the system MnO-Al2O3:
2000
1900
1800
1600
1400
1700
1500 15200
17850
18500
17700
20500
X
Al2O3 + L
2O3
2 O3
MnO + MA
MnO + L
L
MnO Al2O3 20 40 60 80
23
23 2310
WI%
0 C)
2O3 2O3)
8
MA + Al
MnO
+ A
l
MA +L
MA +L
Tem
pera
ture
(
System MnO + Al (MA = MnO + Al Figure by MIT OCW.
Lecture 19 – Binary phase diagrams 8 of 16 11/23/05
3.012 Fundamentals of Materials Science Fall 2005
Example binary phase diagrams
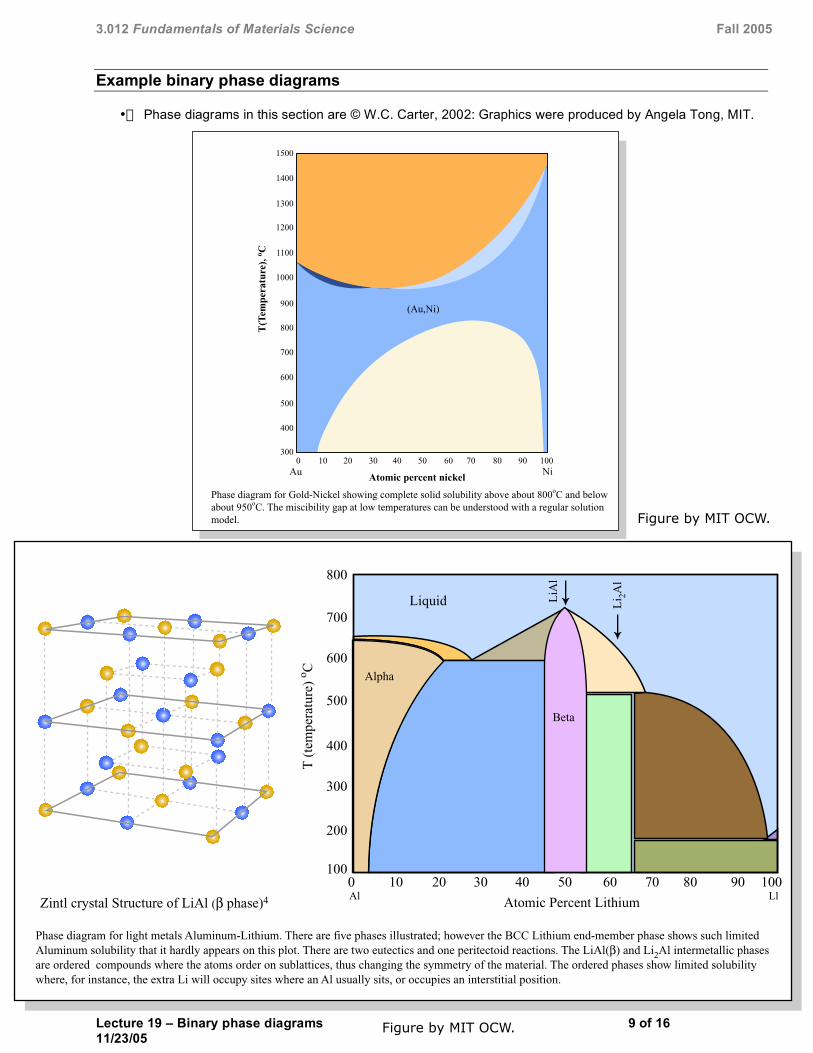
• Phase diagrams in this section are © W.C. Carter, 2002: Graphics were produced by Angela Tong, MIT.
1500
1400
1300
1200
1100
1000
900
800
700
600
500
400
300 0 10 20 30 40 50 60 70 80 90 100
(Au,Ni)
T(T
empe
ratu
re),
o C
Au NiAtomic percent nickel
Phase diagram for Gold-Nickel showing complete solid solubility above about 800oC and below about 950oC. The miscibility gap at low temperatures can be understood with a regular solution model. Figure by MIT OCW.
800
700
600
500
400
300
200
100 0 10 20 30 40 50 60 70 80 90 100
Alpha
Liquid
Beta
Atomic Percent Lithium
T (
tem
pera
ture
) o C
Al Ll
Alpha
Beta
Phase diagram for light metals Aluminum-Lithium. There are five phases illustrated; however the BCC Lithium end-member phase shows such limited Aluminum solubility that it hardly appears on this plot. There are two eutectics and one peritectoid reactions. The LiAl(�) and Li2Al intermetallic phases are ordered compounds where the atoms order on sublattices, thus changing the symmetry of the material. The ordered phases show limited solubility where, for instance, the extra Li will occupy sites where an Al usually sits, or occupies an interstitial position.
LiA
l
Li 2 A
l
Zintl crystal Structure of LiAl (� phase)4
Lecture 19 – Binary phase diagrams Figure by MIT OCW. 9 of 16 11/23/05
3.012 Fundamentals of Materials Science Fall 2005
800
900
1000
700
600
500
400
300
200
1000 10 20 30 40 50 60 70 80 90 100
o C
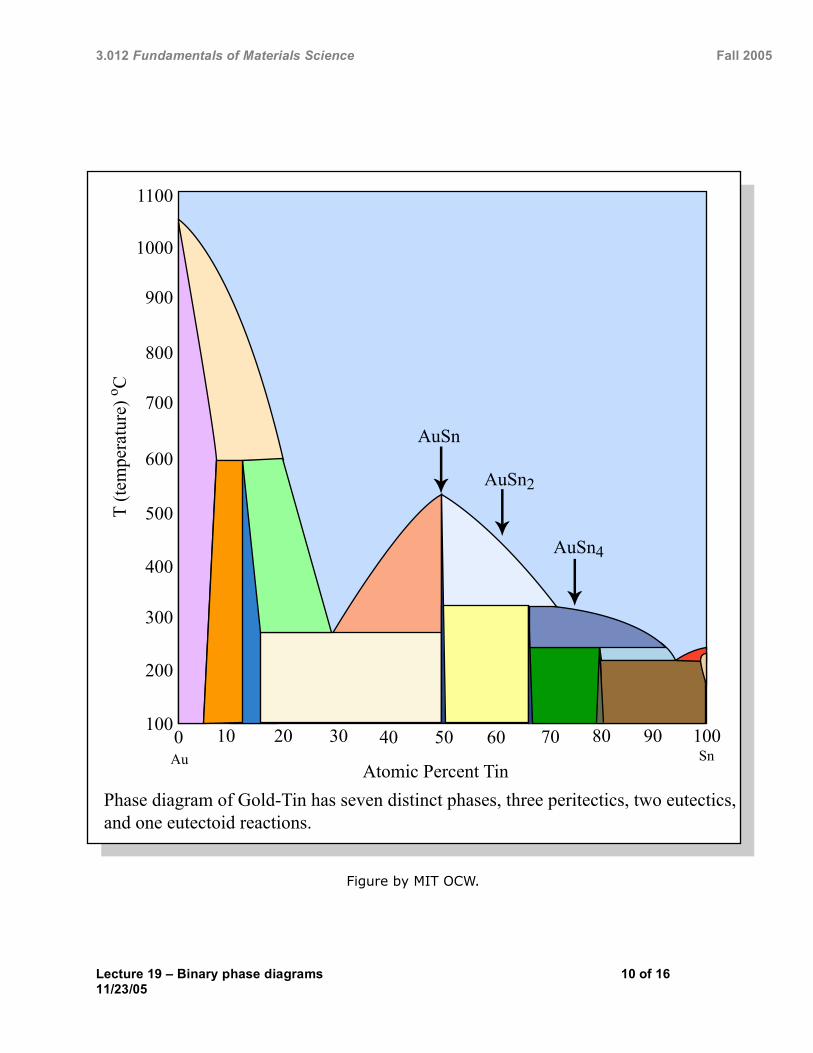
Au Sn
and one eutectoid reactions.
AuSn
AuSn4
AuSn2
1100
Atomic Percent Tin
T (te
mpe
ratu
re)
Phase diagram of Gold-Tin has seven distinct phases, three peritectics, two eutectics,
Figure by MIT OCW.
Lecture 19 – Binary phase diagrams 10 of 1611/23/05
3.012 Fundamentals of Materials Science Fall 2005
Delineating stable and metastable phase boundaries: spinodals and miscibility gaps
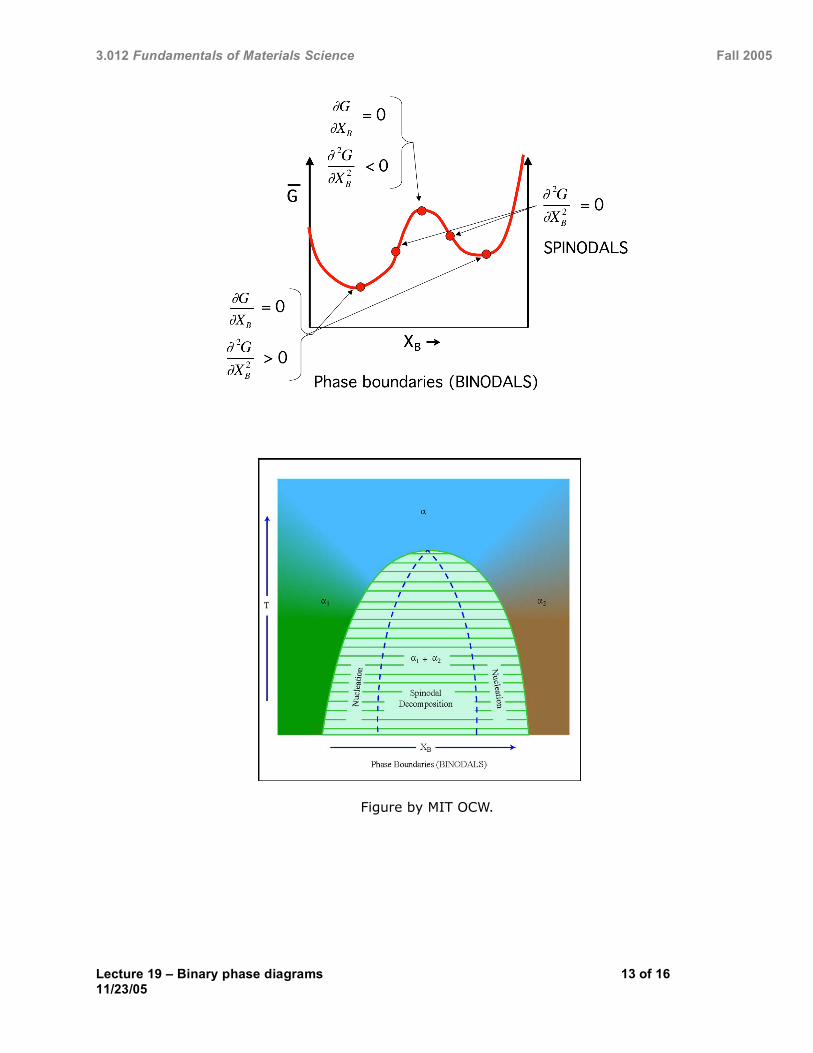
• We saw last time that a homogeneous solution can spontaneously decompose into phase-separated mixtures when interactions between the molecules are unfavorable. The example we started with was the regular solution model for the free energy, where the enthalpy of mixing two components might be positive (i.e., in terms of total free energy, unfavorable).
Conditions for stability as a function of composition
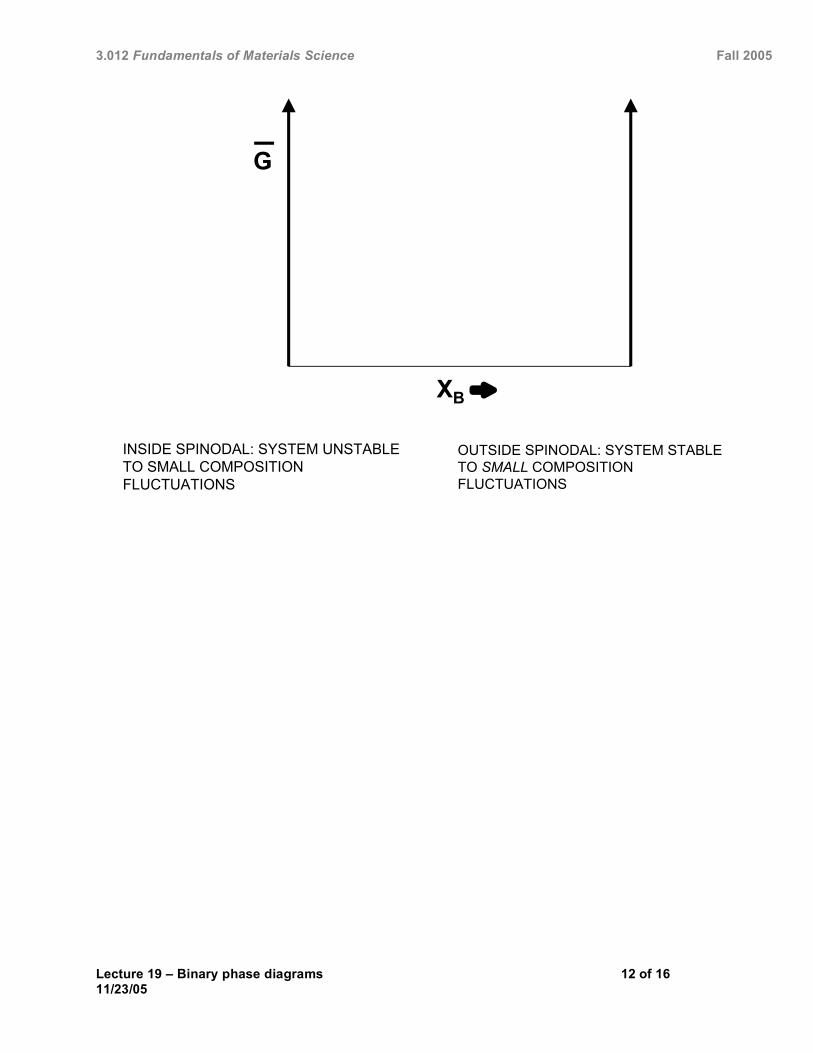
• For closed systems at constant temperature and pressure, the Gibbs free energy is minimized with respect to fluctuations in its other extensive variables. Thus, if we allow the composition of a binary system to vary, the system will move toward the minimum in the free energy vs. XB curve:
• If the system is at the minimum in G, then we can write:
• We can perform a Taylor expansion for a fluctuation in Gibbs free energy, assuming the only variable that can vary is composition (XB):
o If we examine the consequence of a fluctuation in composition near the extremum point of the free energy curve, the first derivative of G is zero. If we assume the third-order (and higher) terms are negligible, then the condition for stable equilibrium is controlled by the value of the second derivative.
Lecture 19 – Binary phase diagrams 11 of 16 11/23/05
3.012 Fundamentals of Materials Science Fall 2005
XB !
G
A
INSIDE SPINODAL: SYSTEM UNSTABLE
TO SMALL COMPOSITION
FLUCTUATIONS
B
OUTSIDE SPINODAL: SYSTEM STABLE
TO SMALL COMPOSITION
FLUCTUATIONS
Lecture 19 – Binary phase diagrams 12 of 1611/23/05
3.012 Fundamentals of Materials Science Fall 2005
Figure by MIT OCW.
Lecture 19 – Binary phase diagrams 13 of 16 11/23/05
3.012 Fundamentals of Materials Science Fall 2005
Supplementary Information (not to be tested): Ternary solution phase diagrams
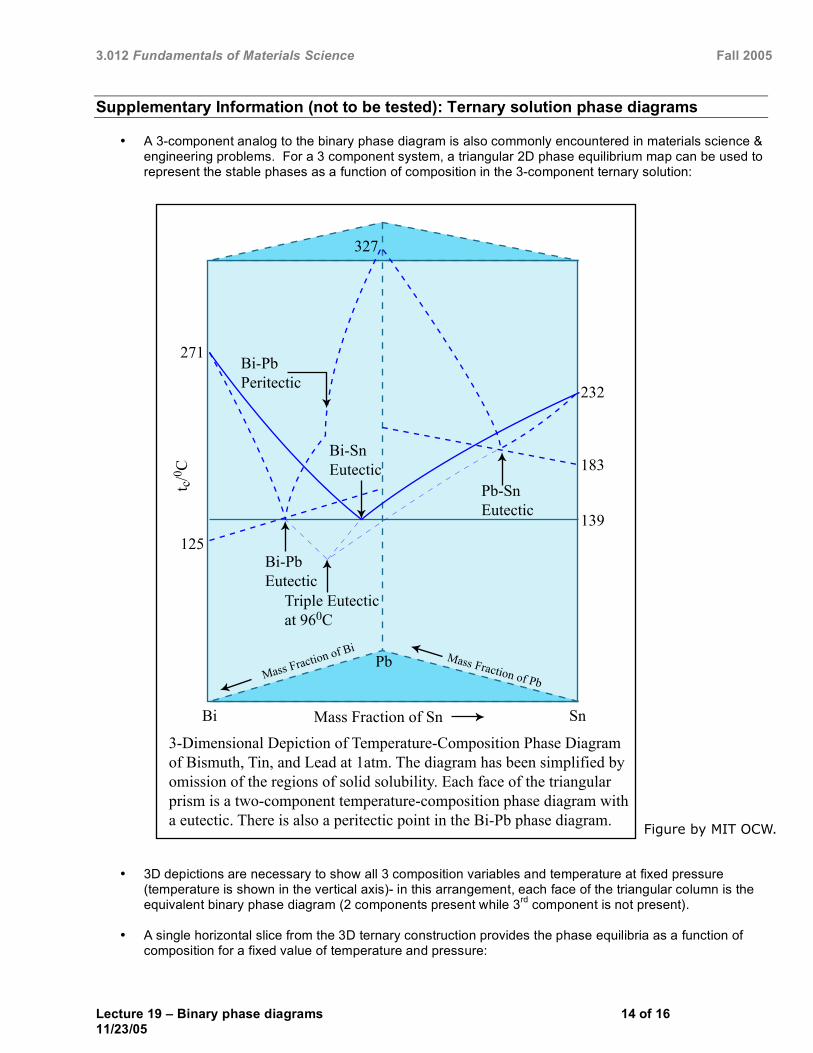
• A 3-component analog to the binary phase diagram is also commonly encountered in materials science & engineering problems. For a 3 component system, a triangular 2D phase equilibrium map can be used to represent the stable phases as a function of composition in the 3-component ternary solution:
327
271
125
232
183
139
Bi-Pb Peritectic
Bi-Pb Eutectic
Bi-Sn Eutectic
Pb-Sn Eutectic
at 960C
Mass Fraction of Bi Mass Fraction of Pb
Bi SnMass Fraction of Sn
t c / 0 C
prism is a two-component temperature-composition phase diagram with
Pb
Triple Eutectic
3-Dimensional Depiction of Temperature-Composition Phase Diagram of Bismuth, Tin, and Lead at 1atm. The diagram has been simplified by omission of the regions of solid solubility. Each face of the triangular
a eutectic. There is also a peritectic point in the Bi-Pb phase diagram. Figure by MIT OCW.
• 3D depictions are necessary to show all 3 composition variables and temperature at fixed pressure (temperature is shown in the vertical axis)- in this arrangement, each face of the triangular column is the equivalent binary phase diagram (2 components present while 3rd component is not present).
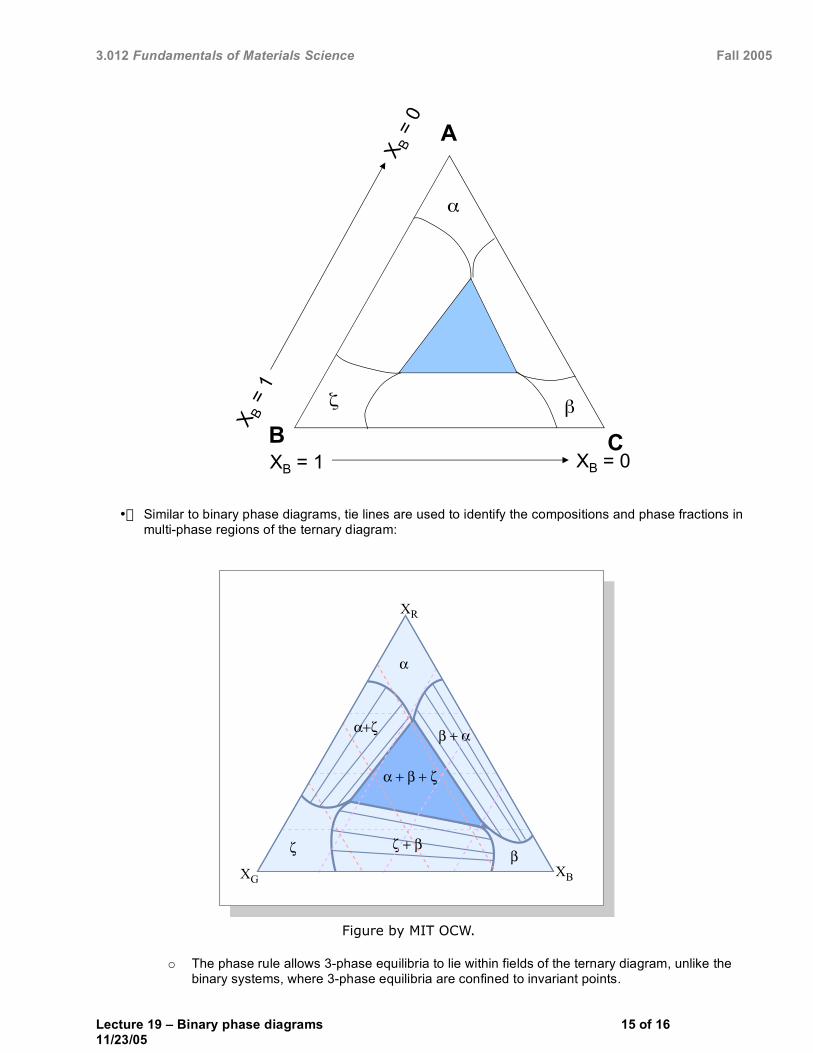
• A single horizontal slice from the 3D ternary construction provides the phase equilibria as a function of composition for a fixed value of temperature and pressure:
Lecture 19 – Binary phase diagrams 14 of 16 11/23/05
3.012 Fundamentals of Materials Science Fall 2005
A
B CX
B = 0X
B = 1
XB =
0
XB =
1
!
" #
• Similar to binary phase diagrams, tie lines are used to identify the compositions and phase fractions in multi-phase regions of the ternary diagram:
Figure by MIT OCW.
�
�+ε
ε ε + � �
� + �
� + � + ε
XG XB
XR
o The phase rule allows 3-phase equilibria to lie within fields of the ternary diagram, unlike the binary systems, where 3-phase equilibria are confined to invariant points.
Lecture 19 – Binary phase diagrams 15 of 16 11/23/05

3.012 Fundamentals of Materials Science Fall 2005
References
1. McCallister, W. D. Materi als Scienc e and Engineering: An I ntroducti on (John Wiley & Sons, Inc., New York, 2003). 2. Lupis, C. H. P. C hemic al T hermodynamics of Materials (Prentice-Hall, New York, 1983). 3. Bergeron, C. G. & Risbud, S. H. I ntroducti on to Phase Equilibria i n C eramics (American Ceramic Society, Westerville, OH, 1984). 4. Lindgren, B. & Ellis, D. E. Molecular Cluster Studies of Lial with Different Vacancy Structures. Journal of Physics F-Met al Phy sics 13,
1471-1481 (1983). 5. Carter, W. C. (2002). 6. Mortimer, R. G. Physical Chemistry (Academic Press, New York, 2000).
Lecture 19 – Binary phase diagrams 16 of 16 11/23/05