
Bimonthly Contractor Report for NAS5-99094 · Bimonthly Contractor Report for NAS5-99094 ... sensor...
15
Bimonthly Contractor Report for NAS5-99094 Period Covered: February though March, 2003 General Discussion Contract NAS5-99094 was initiated on December 1, 1998. The first 1-year option, consisting of Tasks 1 - 5, was completed on November 30, 1999. A second 1-year option, consisting of Tasks 6 - 10, was initiated on December 1, 1999. The third 1-year option, consisting of Tasks 11 - 15, was completed on November 30, 2001. The fourth 1-year option, consisting of Tasks 16 - 20, was completed on November 30,2002. The fifth 1-year option, consisting of Tasks 21 - 25, was initiated on December 1,2003. Tasks 21 - 25 cover specific activities in support of 3 major sensor programs, each with a separate NASA Principal Investigator (PI). Accordingly, the bimonthly narrative is organized such that each of the programs are discussed separately with individual task activities presented within each of the programs. Acronyms are used throughout the report to keep the writing succinct. An attached glossary contains definitions for these acronyms. Airborne Oceanographic Lidar (AOL) (Global Carbon Cycle) Task 21 - Mission Planning and Execution and Sensor Operation and Calibration Mission Planning The memo-of-understanding between NASA GSFC and the NOAA Beaufort Marine Laboratory for cooperative field activities to commence in spring, 2003 that was being considered during the previous reporting period was delayed in the review process by the NOAA legal council. Therefore a MOU between the NOAA Aircraft Operations Center and NASA Wallops Flight Facility was initiated in order to directly pay for the aircraft flight time. The memo-of- understanding provided for approximately 50 hours of surveying. Missions will be primarily conducted in the Chesapeake and Delaware Bays, the Mid Atlantic Bight, and in the New York Bight. The NOAA Beaufort Marine Laboratory made separate arrangements to purchase 20 hours of flight time to cover surveys in the Pamlico and Albemarle Sounds. Sensor Calibration The new calibration laboratory optical set-up was used in testing the ADAS and CDAS systems. Data was analyzed and some differences found between previous year’s calibrations and this new calibration. Analysis will continue after the post flight calibration of both instruments. -1- https://ntrs.nasa.gov/search.jsp?R=20030033057 2018-07-26T04:49:11+00:00Z
Transcript of Bimonthly Contractor Report for NAS5-99094 · Bimonthly Contractor Report for NAS5-99094 ... sensor...

Bimonthly Contractor Report for NAS5-99094
Period Covered: February though March, 2003
General Discussion
Contract NAS5-99094 was initiated on December 1, 1998. The first 1-year option, consisting of Tasks 1 - 5, was completed on November 30, 1999. A second 1-year option, consisting of Tasks 6 - 10, was initiated on December 1, 1999. The third 1-year option, consisting of Tasks 11 - 15, was completed on November 30, 2001. The fourth 1-year option, consisting of Tasks 16 - 20, was completed on November 30,2002. The fifth 1-year option, consisting of Tasks 21 - 25, was initiated on December 1,2003. Tasks 21 - 25 cover specific activities in support of 3 major sensor programs, each with a separate NASA Principal Investigator (PI). Accordingly, the bimonthly narrative is organized such that each of the programs are discussed separately with individual task activities presented within each of the programs. Acronyms are used throughout the report to keep the writing succinct. An attached glossary contains definitions for these acronyms.
Airborne Oceanographic Lidar (AOL) (Global Carbon Cycle)
Task 21 - Mission Planning and Execution and Sensor Operation and Calibration
Mission Planning
The memo-of-understanding between NASA GSFC and the NOAA Beaufort Marine Laboratory for cooperative field activities to commence in spring, 2003 that was being considered during the previous reporting period was delayed in the review process by the NOAA legal council. Therefore a MOU between the NOAA Aircraft Operations Center and NASA Wallops Flight Facility was initiated in order t o directly pay for the aircraft fl ight time. The memo-of- understanding provided for approximately 50 hours of surveying. Missions will be primarily conducted in the Chesapeake and Delaware Bays, the Mid Atlantic Bight, and in the New York Bight. The NOAA Beaufort Marine Laboratory made separate arrangements to purchase 20 hours of flight time to cover surveys in the Pamlico and Albemarle Sounds.
Sensor Calibration
The new calibration laboratory optical set-up was used in testing the ADAS and CDAS systems. Data was analyzed and some differences found between previous year’s calibrations and this new calibration. Analysis will continue after the post flight calibration of both instruments.
-1-
https://ntrs.nasa.gov/search.jsp?R=20030033057 2018-07-26T04:49:11+00:00Z

Field Missions
The NOAA Twin Otter transited from Florida to WFF on March 13. The loading of the AOL instrument suite was initiated on March 14 and completed on March 18. An initial mission to check instrument functionality was flown on March 19. Collaborative flights coordinated with Dr. Jon Sharp of the University of DE were conducted on March 22 and 24. A pair of missions to survey the Pamlico and Albemarle Sounds on March 23 was coordinated with Dr. Pat Tester of the NOAA Beaufort Marine Laboratory. A mission into the Mid Atlantic Bight was flown on March 25. This mission was designed to be flown during the late afternoon such that ambient radiation solar conditions were significantly different between the outbound and inbound passes in order to demonstrate the effects of ambient light saturation on laser-induced chlorophyll fluorescence. Results of this experiment as well as the Delaware Bay and Pamlico and Albemarle Sounds will be reported during the next reporting period. Preliminary results can be found at httt7:llaol.wff.nasa.eov .
Additional Activities
The WFF Aeronet CSPOT sensor is functioning properly. Minore antenna and alignment problems occurred during the reporting period and were fixed after consultations with GSFC. The unit is operational, and data is posted on the website.
Task 22- Data Processing Cataloguing and Archiving
No activity during the reporting period.
Task 23 - Data Analysis Interpretation and Reporting and Laboratory Analytical Support
Ocean Color Satellite Analysis:
Analysis of several standard MODIS chlorophyll products compared to AOL underflight data, lead to the conclusion that all the MODIS chlorophyll products were severely contaminated with CDOM absorption. Web site presentations were set up and teleconferences were initiated with the MODIS science team members responsible for each of the products to discuss the examples displayed on the web presentation sites. After several meetings, it was decided that in-situ chlorophyll data was needed to determine if the results seen with the AOL chlorophyll F/R and CDOM F/R values were consistent with the in-situ data. In-situ chlorophyll data from the Gulf of Maine was acquired from the SeaBASS data base. Results of the analysis of MODIS chlorophyll products with the in-situ data were inconsistent with the AOL analysis.
Global SeaWiFS data from 1997 - 2003 was reprocessed to include information needed to compare global in-situ chlorophyll values with Inherent Optical Properties (IOPs) which are analogous to the AOL F/R values. Software was developed to extract SeaWiFS data that was coincident temporally and spatially with the data points from a global in-situ data set acquired from SeaBASS. Of the -29,000 in-situ chlorophyll values, 1905 data points matched up with pixels in the SeaWiFS global data. A comparison between the chlorophyll and CDOM IOPs and the in-situ chlorophyll values lead to a theory that the CDOM was causing phytoplankton to
-2-
package more chlorophyll per cell to compensate for the presence of CDOM absorption. Several data sets with AOL data matched up to in-situ data were examined to see if inclusion of the CDOM F/R lead to a better agreement between the laser determined chlorophyll biomass estimate and the in-situ chlorophyll, than when only the chlorophyll F/R values were used. The sparsity of the match up data hampers the analysis, but it was found that in general, including the CDOM F/R values leads to a better agreement between in-situ chlorophyll and AOL determined chlorophyll.
Three proposals were prepared for the NASA Research Announcement, NRA-03-OES-02,
AQUA, AND ACRIM SATELLITES", a proposal to study in more detail the effects of Hurricanes and Typhoons on the optical properties of the upper ocean, a proposal to validate several MODIS products using the AOL suite of instruments, and a proposal to maintain and update the phycoerythrin products on MODIS. Most of the remaining time in the 02/03-03/03 period was spent generating figures for and refining these proposals.
"EARTH SYSTEM SCIENCE RESEARCH USING DA,TA AND PRODUCTS FROM TERRA,
An on-camera interview was set up with the American Institute of Physics to discuss the results published in Geophysical Research Letters, on effects of Hurricanes and Typhoons on the optical properties of the upper ocean. The date for the interview has been set for 04/22/03.
Data from the Spring 2003 data missions was rapidly pre-processed to provide collaborators with a qualitative look at the distribution of sea surface temperature, O M , phycoerythrin, and chlorophyll. These preliminary results showed nominal instrument performance. The results were posted to the website and used by oceanographers at University of Delaware and NOAA National Marine Fisheries scientists. Of particular interest is the Atlantic Ocean mission (March 25,2003) where data was taken under changing light conditions, which is being used to examine possible photo-inhibition effects.
The Shipboard Laser Fluorometer was used in the laboratory to investigate the feasibility of measuring the Raman signal for dissolved carbonate ions. At the present time, new instrumentation is being ordered. More testing will occur when an improved spectrometer is received and will be discussed during the next reporting period.
Initial planning was begun for a shipboard laser sensor to measure scattering in the upper oceanic water column.
Task 24 - Network Development and Maintenance
See the Task 14 discussion for the ATM sensor (belowj. Many tasks described in that section apply to the AOL sensor support in this section.
Task 25 - Instrument Maintenance, Engineering and Fabrication
Construction of optical baffle and improved optical rail post was completed and installed in the calibration lab.
The UV spectrometer project is being re-evaluated with Sara Hines of UNC recruited to continue the software development . A meeting is scheduled for May 5 .
-3-

Airborne Topographic Mapper (ATM)
Task 21 - Mission Planning and Execution and Sensor Operation and Calibration
The ATM equipment was installed onboard the NASA P3 aircraft for the Alaska seaice deployment. Missions from Fairbanks AK were successfully completed and the aircraft is now back at WE. The ATM systems remained on the P3 at the end of the reporting period, and will be prepared for the Greenland deployment in late April.
A team of four ATM personnel were deployed to Fairbanks, Alaska to operate the ATM system as part of a sea-ice validation experiment for the AMSR-E satellite. Though the primary instrument for the experiment was the Polarimetric Scanning Radiometer (PSR), we operated the ATM to provide those scientists with useful adjunct data as well as to gather our own data over sea ice for possible ICESat cal/val activities. We also attempted to do one flight for ourselves over the Bering and Malaspina Glaciers in southeastern Alaska, but due to a compressed schedule and poor weather over the target area we were unable to get the mission done.
EG&G also provided mission planning and precise navigation services for the project. Most of the flights involved grid patterns over the sea ice, so the Principal Investigator would typically provide us with a general description of the desired grid the evening before each flight. We then generated waypoints and efficient sequencing of the flight segments to minimize maneuvering time, as well as flight time estimates and other data. During the flights these plans often changed as a result of changing sea ice conditions, so we modified the plans in real-time as needed.
We were able to fly two segments of ICESat orbit, one of them 40 nm long, the other 60 nm. We flew the tracks at 4300', a compromise altitude chosen to help the ATM and PSR coexist. We also were able to work out a procedure for enabling the PSR sensor to get a series of 60-deg bank maneuvers near the end of the missions for calibration purposes, while minimizing GPS tracking problems for the ATM. The PSR simply needed three short 60-deg bank maneuvers with the left wing down and the sensor not pointed at the sun. By examining the sky plot of GPS satellite positions, we were able to select a base course for the maneuvers where raising the right wing would block a minimum number of satellites. Post-flight data analysis showed that the procedure worked well and caused minimal problems with satellite tracking, all of them repairable. This procedure should be very useful for planned future collaborative missions between the ATM and PSR.
Work continued on the Ashtech Eurocard datalogger project. The software was given a name, LinLogger, and an official version, complete with an intuitive graphical user interface, was released and tested on the Alaska flights. We ran the system on the backup navigation computer at the same time the machine was also running the navigation software, and we found that both systems were stable
-4-

Preliminary plans were undertaken to supply two experimenters with GPS equipment for upcoming ATMSindependent missions. Dr. Ken Jezek of Byrd Polar Institute will be working on the Greenland ice cap and Dr. Robert Bindschadler of GSFC, Greenbelt, will be using his equipment in Antarctica.
A cost estimate was prepared for Dr. LaRue Smith covering a series of missions designed to map the Walker River valley in the Carson City, Nevada area. Flight hour calculations were based on user supplied requirements for data coverage in the mountainous terrain. Travel estimates and equipment shipping costs were also considered in the total estimate.
Task 22 - Data Processing Cataloguing and Archiving
Global Carbon Cycle (CO) - No archiving or processing activity f o r this time period.
Topographic Mapping, Ice (TA) - Participated in Sea Ice Mapping experiment in Alaska 3/8- 25/03. Supported ATM2, ATM3, and ATM4 flights on 3/13,15,16,18-20,22103 by manning GPS ground station. Distributed replacement copy of CAMBOT photos from 5/20,23/02. Topographic Mapping, Land (TA) - No archiving or processing activity for this period.
Topographic Mapping, Antarctic (TO) - Completed Level 0' and commenced re-processing of Level l2 and Level 2 of Antarctic Mapping '02 flights from 11/22/02 - 12/14/02. Distributed CAMBOT photos from all missions to various recipients. Also distributed Level 2 data from 12/3 and 12/7/02 flights.
Topographic Mapping, Antarctic (TO) - Commenced re-processing of Level 1 and Level 2 of Antarctic Mapping '02 flights from 11/22/02 - 12/14/02. Distributed CAMBOT photos from all missions to various recipients. Also distributed Level 2 data from 12/3 and 12/7/02 flights.
Topographic Mapping, Beach (TB) - Completed Level 2' re-processing and archiving on West Coast flights 9/22/02 & 9/27 - 10/3/02. Distributed Level 2 data and CAMBOT photos from Gulf Coast 9/28,29/02 flights.
Topographic Mapping, ICESat (GL) - Participated in Sea Ice Mapping experiment in Alaska 3/8 - 25/03. See (TA) report above.
'Level 0 consists of copying the raw data to CDROMS and entering the field notes and file names into computer retrievable information files.
*Level 1 preprocessing the raw data through program newvalT to calibrate the range data and calculate the scan azimuth and timing corrections.
'Level 2 data is combined with differential GPS trajectories and inertial navigation system attitude and heading data to produce individual laser spot elevations.
-5-

Scanning Radar Altimeter (RO) - No archiving or processing activity for this period.
Task 23 - Data Analysis Interpretation and Reporting and Laboratory Analytical Support
Processing and analysis was continued of the December 2002 ATM Chilean campaign. Data was merged from the CARDS ice-penetrating radar and ATM lidar to make profiles showing elevation of the ice surface and ice bottom (bedrock). Ancillary Digital Elevation Models (DEMs) were needed to fill in elevations beyond where ATM data was collected; it was found that one (Bamber/ERS) showed better behavior in the coastal/iceshelf regions of Pine Island Glacier (PIG) and a another (RAMPBEDMAP) worked better on the Antarctic Peninsula. Profiles on Pine Island Glacier were then used for modelling the glacier dynamics. The geoid model of the surveyed regions was investigated to better understand the relationship of the surveyed elevations to sea level, which is significant in the models of glacier flow. All of these results had been based on a rapid processing of ATM data. An improved reprocessing was initiated following several refinements: laser range calibrations were analyzed and a single consolidated calibration was created; the truck survey of the Punta Arenas calibration ramp was processed and the ATM passes over that ramp were combined with those from Vina del Mar to improve the estimate of mounting biases; and phase-solution multi-basestation GPS trajectories were created.
Some ancillary items were addressed from the Chile deployment. Ice profiles measured over Pine Island Glacier were sent to scientists at the British Antarctic Survey for their use in planning underwater surveys of the ice shelf during March-April. Also, some customized “trajectory” files (including GPS position, INS attitude, etc.) were prepared and sent to photogrammetrists at OSU for calibration of the camera they operated on the flights.
The project started to receive and analyze data from the GLAS instrument on the ICESat satellite. Some preparations were undertaken: new disk drives were installed to hold the data; subscriptions were submitted to the project Scientific Computing Facility (SCF) to request data for several regions of interest; and a method was established to automatically transfer data from the SCF to local computers. The GLAS laser was turned on Feb 21 and data became available a couple weeks later. Software was prepared and run to compare satellite measurements against past ATM laser surveys in Greenland, the Mojave desert, Svalbard, and the Antarctic Dry Valleys. A range bias was found, and discussions with the GLAS project led to the discovery of an error in their processing which was then corrected in a revised release of GLAS data. Such analysis will be continuing on a routine basis for the foreseeable future.
The study of the Jakobshavn glacier continued with the purchase of seven Landsat images to track glacier velocity from Spring through Autumn of 2002. The images were sent to collaborators at Ohio State University for coregistration. The coregistered images will then be cross-correlated to determine ice displacement and hence velocities.
-6-

A group was deployed to Alaska during March for mapping sea ice. In addition to the deployment itself, some activities involved mission planning, installation on the NASA P3 (N426) and a checkout flight at WFF.
The Antarctic Dry Valley surveys that were made in December 2001 had been given to USGS who then had OSU perform some further processing and QA. The resulting gridded DEMs were released in March by USGS/OSU.
Work continued on processing precise trajectories for the 2002 Chile deployment. Trajectories for the two relatively short-baseline Patagonia missions were released. Data was also gathered for ground stations at Palmer Station and the Chilean camp at Carvajal and processed. These stations were located much closer to the target areas than the main station at Punta Arenas. Much experimentation was done with multi-station trajectories using combinations of these three ground stations, and we eventually were able to get good agreement (20 cm or better) between solutions using different combinations of these stations. We also had to deal with problems involving shortage of common satellite visibility between the aircraft and ground over the very long baselines involved, which we solved in part by modifying the GITAR analysis software to allow for temporary lowering of the elevation cutoff angle.
GPS data for all the Alaska missions was gathered and preprocessed while still in the field on the project, which should enable precise trajectories to be released with a minimum amount of effort, in the compressed time frame between the Alaska and upcoming Greenland trips.
Quality Assurance (QA) analysis was started for' missions flown in 2002 over Assateague Island, VA and the Tampa Bay, FL areas. QA pointed toward an approximate 20 cm pitch mount bias for two missions flown over Assateague, and showed a very good comparison (10 centimeters or less) for the four Tampa Bay missions. As a result of these findings, the Assateague missions are being reprocessed with an adjusted pitch mount bias. GPS data from the new LinLogger data system and Eurocard GPS was preliminarily processed in the field. The results were encouraging - the system appears to have similar performance to the proven DOS-based systems we hope to retire soon.
Work has begun in the processing of ICESat data taken over Greenland and the Mojave desert calibration/validation site (mapped in 2001 by the ATM system). Laser data from the satellite is differenced from existing ATM datasets as a check on the validity of the satellite processing. This early scrutiny showed a 19 meter vertical bias in the satellite dataset along with a horizontal pointing error of nearly 800 meters. ICESat contact, David Hancock (GSFC Code 972.0) was informed of the biases. The 19 meter bias has been corrected, the 800 meter bias will be addressed with a satellite re-pointing maneuver which was part of original launch schedule. Future processing plans call for extending comparisons to datasets taken in Antarctica and Svalbard.
Quality Assurance (QA) analysis was started for missions flown in 2002 over Assateague Island, VA and the Tampa Bay, FL areas. QA pointed toward an approximate 20 cm pitch mount bias for two missions flown over Assateague, and showed a very good comparison (10 centimeters or less) for the four Tampa Bay missions. As a result of these findings, the Assateague missions are being reprocessed with an adjusted pitch mount bias.
-7-

The Litton LTNlOO 1553 data programs are currently being written and tested. The Litton unit “piggybacked” on the Alaska Seaice missions, and data recorded to compare to the Honeywell unit on the P3. This set of data included both the ARINC 1553 and ARINC 429 data streams, so that the remaining timing issues can be resolved.
Trajectories were estimated for 8 of the missions flown during the 2002 Chilean campaign. To eliminate long trajectory segments having very large PDOPs (sometimes nearly an hour long and with PDOPs greater than lOOO), gitar was modified to allow segments with smaller cutoff angles than were used the normal 12 degrees used for the remainder of the trajectory. In some cases, it was necessary to allow cutoff angles as low as 6 degrees. Fortunately, there do not appear to have been cycle slips down to the low cutoff angles for those periods for which the data was needed. All trajectories were computed using at ‘least 2 ground stations. Most trajectories were computed using the Palmer and Adelaide stations, neglecting the Neil ground station because of the extreme distances to the mission area (sometimes exceeding 2500 km). However, Neil had to be used for one of the trajectories because of unreadable Adelaide data. For some of the Adelaide data, the data rate was less than 2Hz. A program was written to interpolate this data to 2Hz to maximize trajectory accuracy. Special trajectories were computed using the Niel ground station for Niel ramp passes, and using the Vina del Mar ground station for Vina del Mar ramp passes. Mounting biases were estimated using 4 ramp passes for Niel and 4 ramp passes for Vina del Mar. It appeared that range biases varied by 4-5 cm during the mission. In an effort to compensate for any such variations, the value of alpha was allowed to adjust so that the effects of variations were minimi zed.
Task 24 - Network Development and Maintenance
Work continued on network maintenance of the AOUATM data processing network that serves these programs and their data processing laboratory. In addition recently developed software to record the output of a Litton LTN-100 inertial navigation system was flight tested during the survey missions of Tampa Bay in October. The data recording system seemed to work well. Results of the analysis of this data will be reported in the next contract period.
-8-

Task 25 - Instrument Maintenance Engineering and Fabrication
ATM4 development activities continued throughout the reporting period.
Laboratory Activities
This testing included the use of and analysis of data using 3 different digitizers and several different laser repetition rates.
Found that the total data through-put and laser capture rate varied depending on the digitizer setup laser rep rate used. After some software tweaks and bug fixes, it was found that over 99% of waveforms could be captured in a lab setting with a laser rate of 5000Hz. With increased laser rates, the performance decreased to a capture rate of 95% near 7000Hz.
Two main types of digitizers were tested: two PCI types, and two cPCI types. After testing the two types separately, it was found that the cPCI version had data transfer latencies under certain circumstances. The PCI versions of the card did not exhibit this same type of latency, which would be detrimental to the operation of the ATM in future versions.
A Heimann Radiometer was also integrated into the system for temperature recording and real- time display.
Field Activities
Installed ATM2, ATM3, and ATM4 into the NASA P3 in preparation for the missions in Alaska. The first ground test was conducted with ATM4 for preliminary analysis. Test data was compared with ATM3 with positive initial results.
The ATM$ participated in Ice Mapping missions from Fairbanks, Alaska. The ATM2, ATM3, and ATM4 were concurrently operated during 7 flights. Data from the ATM4 was captured for testing and comparison with ATM3 data.
The file output convention was finalized .
The initiation of conversion software that will allow the new data format to be reduced to a file format readable by current processing software was begun.
Other Activities
Generated cad drawings of ATM 3-4 for NCAR to assist in the possible installation of that project on the NCAR C-130 aircraft.
-9-

-10-

Other Mission Support Activities
Task 21 - Mission Planning and Execution and Sensor Operation and Calibration
Task 22 - Data Processing Cataloguing and Archiving
No activity during the current reporting period.
Task 23 - Data Analysis Interpretation and Reporting and Laboratory Analytical Support
Modeling Activities:
Support for the ocean modeling effort was in three directions during February and March. First, with the streamflow data complete for the Atlantic and Gulf coasts, attention was given to the Pacific coast. The Perl streamflow analysis programs have been modified to extend to the Gulf Coast but the ArcView site selection phase has not begun.
Secondly, a comparison of using real-time data instead of historic data in the streamflow analysis was requested. This involved writing Perl programs to download real-time data from the USGS website and selecting the most downstream real-time sites on ArcView. This comparison has been completed. It was determined that with the historic data, 92% of the Atlantic and Gulf coast drainage area is represented. Using real-time sites would reduce this percentage to 22%. The most significant factor in this difference is the absence of a real-time site on the lower Mississippi. Approximately 80% coverage could be achieved if a lower Mississippi real-time site is added to the USGS system.
Thirdly, the water quality analysis which will use the historic streamflow data was resumed. Some changes to the existing water quality analysis programs were necessitated by changes made in the streamflow data format during that phase. Also, a change in the desired water quality parameters meant that the ArcView site selection phase also had to be repeated, since what parameters are sampled varies from site to site. At this point the programs and site selection are complete and the programs are being tested.
Task 24 - Network Development and Maintenance
No activity during reporting period.
Task 25 - Instrument Maintenance Engineering and Fabrication
EAARL Activities:
-1 1-

No activity during reporting period.
Scanning Radar Altimeter (SRA j
Assisted with the repair and up-grade of the system.
Down-Looking Scatterometer (DLS)
No activity during reporting period.
Meteorological Laboratory Support
Assisted on the OZONE project in fabrication of components and in the move of labs and assisted in the set up of testing and calibration equipment.
Tropical Rain Measuring Mission (TRMM)
Assisted on TRMM project with removing and recoating antenna array.
Ocean Biology
Assisted on John Moisan's ocean modeling project with fabrication of some minor parts and research components. This work included the insallation of a data antenna on the roof of N-159.
Assisted on Tiffany Moisan's ocean biology project by making and modifying laboratory components utilized in ongoing experiments and continued development of the ocean instrument cage and the UV micropac spectrometer/adas system.
Other
Continued to move fabrication laboratory to the high bay shop area of N-159.
-12-

ADAS
AGC
AGL
ALACE
AIM
AOC
AOL-3
ASA
ATM
CAMBOT
CDAS
CDOM
CIMEL
CCG
csc
DAAC
DEM
DLS
EAARL
Bimonthly Progress Reports for Contract NAS5-99094 Glossary of Acronyms
<Current as of August 5,2002>
Airborne Diode Array Spectrometer
Automated Gain Control
Altitude Above Ground Level
Airborne Lidar Assessment of Coastal Erosion (joint NASA/NOAA/USGS program to measure changes in coastal morphology)
Arctic Ice Mapping (NASA program to measure the mass balance of arctic ice sheets such as the massive ice sheet covering Greenland)
NOAA Aircraft Operations Center (Macdill AFB, Tampa, FL)
Airborne Oceanographic Lidar (version 3 put into service in March, 1998)
Airborne SeaWiFS Simulator
Airborne Topographic Mapper (Versions 1 and 2 are both in current use)
The high resolution Kodak cameras utilized on ATM missions
Cosine Diode Array Spectrometer
Chromophoric dissolved organic carbon
Automated Sun-tracking photometer
USGS Center for Coastal Geology (St. Petersburg, FL)
NOAA Coastal Services Center (Charleston, SC)
Distributed Active Archive Center
digital elevation model
Down-Looking Scatterometer
Experimental Advanced Airborne Research Lidar sensor

EstHab Estuarine Habitat Project -joint NOAA/NASA initiative to study coastal waters and to evaluate remote sensor performance in these environments.
EEQ Excessive Energy Quenching
FRRF
GAC
GLAS
GPS
GSFC
ICEsat
IOP’S
JGOFS
ICESat
IR
IOP’S
LAC
MAB
MODIS
NEGOM
NOAA
NRC
OSD
PARCA
Fast Repetition Rate Fluorometer (shipboard instrument)
Global Area Coverage (ocean color satellite imagery)
Geodetic Laser Altimeter System
Global Positioning System
Goddard Space Flight Center
Ice Cloud and Land Elevation Satellite
Oceanic Inherent Optical Properties (chl absorption, CDOM absorption and total constituent backscatter)
Joint Global Ocean Flux Studies
Ice, Cloud, and land Elevation Satellite
Infrared
Inherent Optical Properties (of sea water)
Local Area Coverage (ocean color satellite imagery)
Middle Atlantic Bight (of the western North Atlantic Ocean)
- Moderate Resolution Imaging Spectrometer
Northeast Gulf of Mexico (Texas A&M Cruise)
National Ocean and Atmospheric Administration
National Research Council (personnel)
Operations and Safety Directive (required by GSFC Safety for all airborne programs)
NASA Program for Arctic Regional Climate Assessment
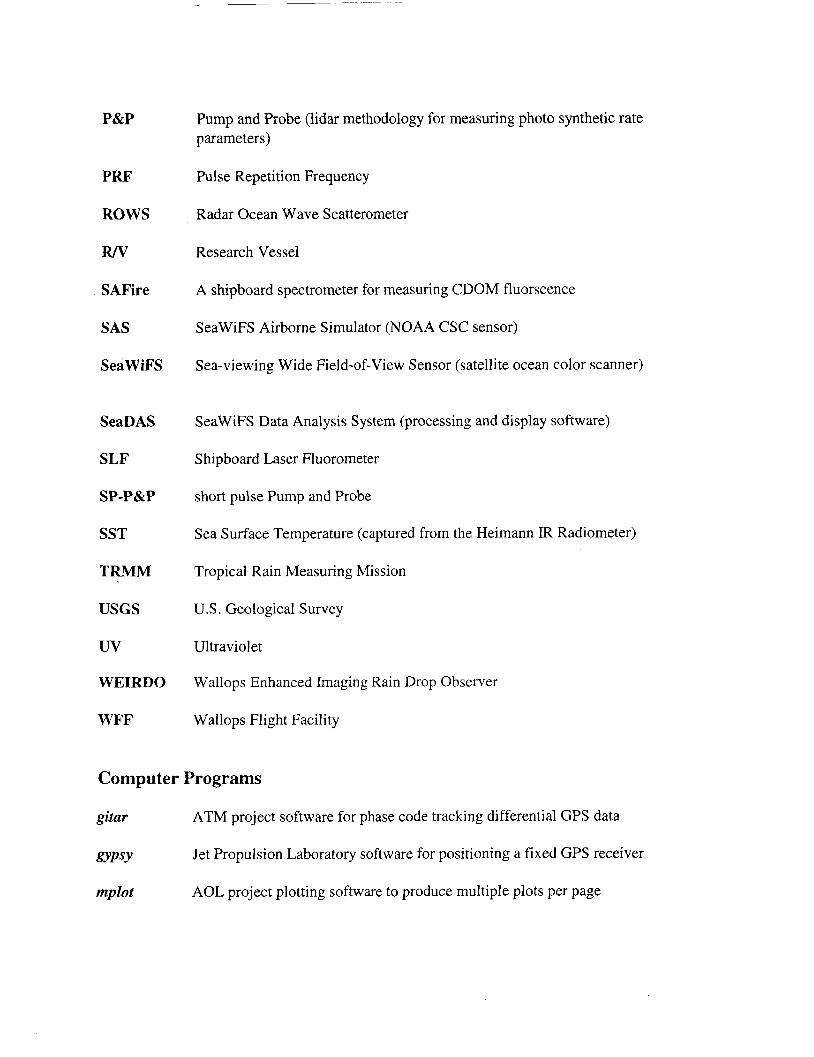
P&P Pump and Probe (lidar methodology for measuring photo synthetic rate parameters)
PRF Pulse Repetition Frequency
ROWS Radar Ocean Wave Scatterometer
R/v Research Vessel
SAFire
SAS
SeaWiFS
A shipboard spectrometer for measuring CDOM fluorscence
SeaWiFS Airborne Simulator (NOAA CSC sensor)
Sea-viewing Wide Field-of-View Sensor (satellite ocean color scanner)
SeaDAS
SLF
SP-P&P
SST
TRMM
USGS
uv WEIRDO
WFF
SeaWiFS Data Analysis System (processing and display software)
Shipboard Laser Fluorometer
short pulse Pump and Probe
Sea Surface Temperature (captured from the Heimann IR Radiometer)
Tropical Rain Measuring Mission
U.S. Geological Survey
Ultraviolet
Wallops Enhanced Imaging Rain Drop Observer
Wallops Flight Facility
Computer Programs
gitat
gypsy
mplot
ATM project software for phase code tracking differential GPS data
Jet Propulsion Laboratory software for positioning a fixed GPS receiver
AOL project plotting software to produce multiple plots per page