BIHAR - IBEF
45
For updated information, please visit www.ibef.org August 2018 BIHAR THE LAND OF BUDDHA TOMB OF SHER SHAH SURI, SASARAM, BIHAR
Transcript of BIHAR - IBEF

For updated information, please visit www.ibef.org August 2018
BIHAR THE LAND OF BUDDHA
TOMB OF SHER SHAH SURI, SASARAM, BIHAR

Table of Content
Executive Summary .…………….…….…....3
Introduction ……..………………………...….4
Economic Snapshot ……………….….…….9
Physical Infrastructure ………..……...........14
Industrial Infrastructure ……..……….........25
Key Sectors ………….………………..…...27
Key Procedures & Policies………………...34
Annexure.………….……..….......................42
Social Infrastructure …..……..……….........22

For updated information, please visit www.ibef.org BIHAR 3
EXECUTIVE SUMMARY
The Gross State Domestic Product (GSDP) of Bihar grew at a CAGR of 12.13 per cent (In Rs) between
2011-12 and 2016-17.
Fastest growing state in
India
Source: Central Statistics Office, Ministry of Statistics and Programme Implementation, Ministry for Integrated Development of Horticulture, NSDP- Net State Domestic Product
Bihar has witnessed strong growth in per capita net state domestic product. At current prices, per capita
NSDP of the state grew at a CAGR of 10.35 per cent (in Rs) per cent during 2011-12 to 2016-17.
Fastest per capita
income growth
Bihar has high agricultural production making it one of the strongest sectors of the state. About 80 per cent
of the state’s population is employed in agriculture, which is much higher as compared to India’s average.
The state has developed as the number one state in the eastern region in terms of agricultural production.
Strong agriculture sector
With 82.75 million mobile subscribers in May 2018, Bihar* accounted for the fourth largest mobile
subscriber base among all Indian states.
Fourth largest mobile
subscriber base
Bihar is the 4th largest producers of vegetables & the 8th largest producer of fruits in India. Leader in the production
of fruits and vegetables
Note: * - includes Jharkhand,

BIHAR
INTRODUCTION

For updated information, please visit www.ibef.org BIHAR 5
BIHAR FACT FILE
Source: Government of Bihar website, Census 2011
Bihar is located in the eastern part of India. The state is surrounded
by Nepal in the north, West Bengal in the east, Uttar Pradesh in the
west & Jharkhand in the south.
The state has a number of rivers; the most important of which is the
Ganges.
Patna, Gaya, Bhagalpur, Muzaffarpur & Darbhanga are some of the
key cities in Bihar.
The most commonly spoken languages in the state are Hindi,
English, Urdu, Bhojpuri, Maithili & Angika.
The 4 agro-climatic seasons and fertile soil of Bihar support
cultivation of a wide range of crops.
Parameters Bihar
Capital Patna
Geographical area (sq km) 94,163
Administrative districts (No) 38
Population density (persons per sq km) 1,106
Total population (million) 104.1
Male population (million) 54.3
Female population (million) 49.8
Sex ratio (females per 1,000 males) 918
Literacy rate (%) 61.8
Source: Maps of India

For updated information, please visit www.ibef.org BIHAR 6
ADVANTAGE: BIHAR
High Economic Growth with flourishing
industries
• The per capita GSDP of Bihar increased at a CAGR of
10.38 per cent (in Rs), between 2011-12 and 2016-17.
Food processing, dairy, sugar, manufacturing &
healthcare are some of the fast growing industries in the
state. The state has planned initiatives for the
development of other sectors such as education &
tourism.
Policy incentives
As per the women empowerment policy, the state is
increasing its focus on women empowerment by
ensuring availability of resources (education &
employment) for women, which would in turn lead to
increased contribution from women in development of
the economy
In May 2017, the state government has given around
3.65 lakh government employees & 6 lakh pensioners
a revised pay scale from the month of May as per the
7th pay scale recommendations
Location advantage
The state enjoys a unique location specific advantage
because of its proximity to the vast markets of eastern
& northern India, access to ports such as Kolkata &
Haldia & to raw material sources & mineral reserves
from the neighbouring states.
Rich labour pool
The state has a large base of cost-effective industrial
labour, making it an ideal destination for a wide range of
industries.
The state has institutes of national importance such as
National Institute of Technology & Indian Institute of
Technology, which provide skilled manpower to
industries.
Advantage
Bihar
GSDP: Gross State Domestic Product NSDP: Net State Domestic Product EBC: Extremely Backward Class

For updated information, please visit www.ibef.org BIHAR 7
BIHAR IN FIGURES
Parameter Bihar India
GSDP as a percentage of all
states’ GSDP 2.88 100.0
GSDP growth rate (%) 14.82 10.82
Per capita GSDP (US$) 598.29 1,788.95
Bihar’s Contribution to Indian Economy (2016-17)
Parameter Bihar India
Installed power capacity (MW) 4,341.47 343,898.39
Wireless subscribers* (No) 82,749,364 1,131,005,994
Internet subscribers (million No) 28.40 493.96
National Highway length (km) 4,839 1,22,432
Airports (No) 2 125
Physical Infrastructure in Bihar
Parameter Bihar India
Literacy rate (%) 61.8 73.0
Birth rate (per 1,000
population) 26.8 20.4
Social Indicators
Parameter Bihar India
PPP projects under
construction (no) 10 448
PPP projects operational (no) 6 715
Industrial Infrastructure
Parameter Bihar India
Cumulative FDI* equity inflows
(US$ million) 113 376,969
Investments (as of March 2018)
Note: * includes Jharkhand, PPP: Public-Private Partnership, SRS: Sample Registration System

For updated information, please visit www.ibef.org BIHAR 8
Knowledge and religious hubs to be built & will
attract 100,000 tourists per year by 2022.
Construct mega religious theme parks
(Buddhism & Jainism).
Eight centres for educational, cultural &
religious tourism planned.
Planned roadmap for improved connectivity;
luxury hotels to be constructed through PPP
mode.
Tourism service centres to be set up.
Build medical institutions, create awareness &
bring about technological advancements.
Introduce radiology & pathology services in
every district.
Government hospitals across 36 districts to be
provided with CT scan services.
All government hospitals likely to commence
dialysis services.
Agriculture to play a significant role with
opportunities in food processing & agro-
based industries.
Use quality seeds & fertilisers & upgraded
technology
Provide institutional credit & crop insurance.
Develop infrastructure with focus on roads &
energy sector.
Achieve zero dropout rate in secondary
education.
Increase spending on building schools and
colleges with easy access and upgraded
infrastructure.
Launch policy initiatives to ensure
compulsory enrolments
Open vocational training institutes.
STATE VISION
Vision 2022
Tourism GSDP Growth
Health Education
Source: Confederation of Indian Industry
BIHAR
ECONOMIC SNAPSHOT

For updated information, please visit www.ibef.org BIHAR 10
ECONOMIC SNAPSHOT – GSDP
Bihar’s per capita GSDP at current prices
The per capita GSDP of Bihar increased from Rs 23,525 (US$
490.62) in 2011-12 to Rs 38,546 (US$ 336.4) in 2016-17.
The per capita GSDP of Bihar increased at a CAGR of 10.38
per cent (in Rs), between 2011-12 and 2016-17. 4
90
.62
48
5.9
3
48
3.4
9
50
9.2
7
30
3.5
33
6.4
23
52
5.0
0
26
45
9.0
0
29
25
1.0
0
31
14
2.0
0
34
10
3.0
0
38
54
6.0
0
0
5,000
10,000
15,000
20,000
25,000
30,000
35,000
40,000
45,000
420.00
440.00
460.00
480.00
500.00
520.00
540.00
560.00
580.00
600.00
201
1-1
2
201
2-1
3
201
3-1
4
201
4-1
5
201
5-1
6
201
6-1
7
US$ Rs
CAGR (In Rs) 10.38%
GSDP of Bihar at current prices
In 2016-17, Bihar’s GSDP at current prices was around Rs 4.38
trillion (US$ 65.29 billion). The GSDP is estimated to be Rs
6.32 trillion (US$ 98.09 billion) in 2017-18.
The state’s GSDP grew at a CAGR (in Rs) of 12.13 per cent
between 2011-12 and 2016-17.
51
.54
51
.86
52
.41
56
.08
58
.28
65
.29
2.4
7
2.8
2
3.1
7
3.4
3
3.8
2 4.3
8
0
0.5
1
1.5
2
2.5
3
3.5
4
4.5
5
0.00
10.00
20.00
30.00
40.00
50.00
60.00
70.00
201
1-1
2
201
2-1
3
201
3-1
4
201
4-1
5
201
5-1
6
201
6-1
7
US$ billion Rs trillion
CAGR (In Rs) 12.13%
Source: Directorate of Economics & Statistics of Bihar, Central Statistics Office
Note: Conversion rate – As per slide 44
For updated information, please visit www.ibef.org BIHAR 11
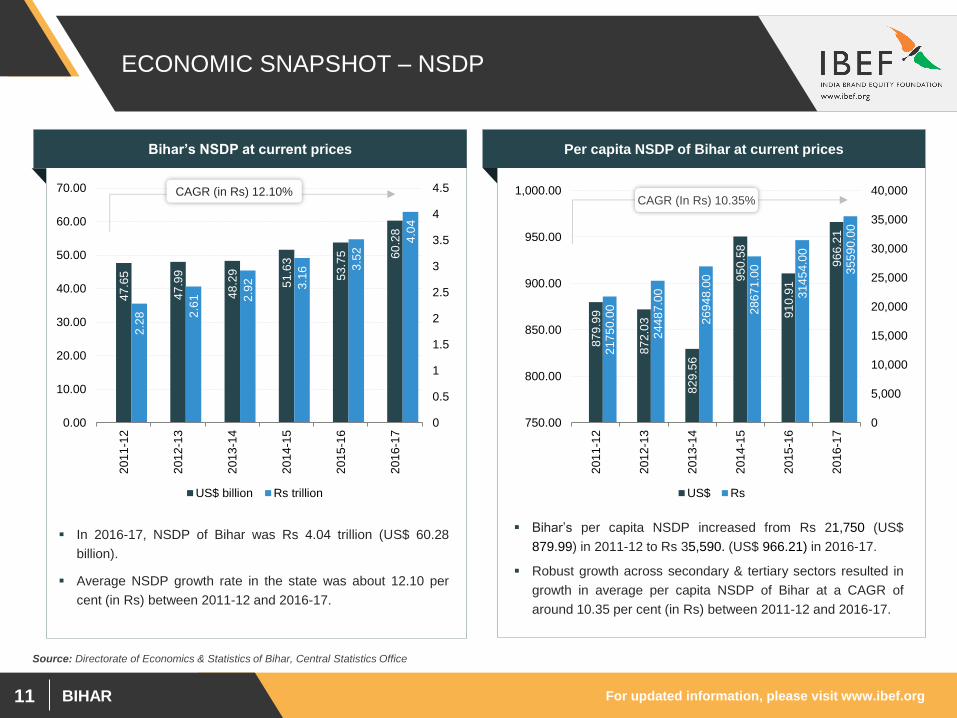
ECONOMIC SNAPSHOT – NSDP
Bihar’s per capita NSDP increased from Rs 21,750 (US$
879.99) in 2011-12 to Rs 35,590. (US$ 966.21) in 2016-17.
Robust growth across secondary & tertiary sectors resulted in
growth in average per capita NSDP of Bihar at a CAGR of
around 10.35 per cent (in Rs) between 2011-12 and 2016-17.
Per capita NSDP of Bihar at current prices
Source: Directorate of Economics & Statistics of Bihar, Central Statistics Office
87
9.9
9
87
2.0
3
82
9.5
6
95
0.5
8
91
0.9
1
96
6.2
1
21
75
0.0
0
24
48
7.0
0
26
94
8.0
0
28
67
1.0
0
31
45
4.0
0
35
59
0.0
0
0
5,000
10,000
15,000
20,000
25,000
30,000
35,000
40,000
750.00
800.00
850.00
900.00
950.00
1,000.00
201
1-1
2
201
2-1
3
201
3-1
4
201
4-1
5
201
5-1
6
201
6-1
7
US$ Rs
CAGR (In Rs) 10.35%
Bihar’s NSDP at current prices
In 2016-17, NSDP of Bihar was Rs 4.04 trillion (US$ 60.28
billion).
Average NSDP growth rate in the state was about 12.10 per
cent (in Rs) between 2011-12 and 2016-17.
47
.65
47
.99
48
.29
51
.63
53
.75
60
.28
2.2
8
2.6
1
2.9
2
3.1
6 3.5
2 4
.04
0
0.5
1
1.5
2
2.5
3
3.5
4
4.5
0.00
10.00
20.00
30.00
40.00
50.00
60.00
70.00
201
1-1
2
201
2-1
3
201
3-1
4
201
4-1
5
201
5-1
6
201
6-1
7
US$ billion Rs trillion
CAGR (in Rs) 12.10%

For updated information, please visit www.ibef.org BIHAR 12
ECONOMIC SNAPSHOT – PERCENTAGE
DISTRIBUTION OF GSVA
The tertiary sector contributed 59.90 per cent to the GSVA of Bihar
(at current prices) in 2016-17, followed by primary sector &
secondary sector contributing 23.09 per cent and 17 per cent,
respectively.
Between 2011-12 and 2016-17, tertiary sector was the fastest
growing sector in the state, witnessing growth at a CAGR of 13.87
per cent, followed by secondary sector, which witnessed growth at a
CAGR of 9.95 per cent, during 2011-12 and 2016-17.
This growth has been supported by various sectors such as
manufacturing, electricity, gas & water supply; construction &
services industries.
In the state of Bihar, the primary sector witnessed growth at a CAGR
of 9.71 per cent, between 2011-12 and 2016-17.
Visakhapatnam port traffic (million tonnes) Percentage distribution of GSVA
25.76% 23.09%
18.76%
17.00%
55.48% 59.90%
0%
10%
20%
30%
40%
50%
60%
70%
80%
90%
100%
2011-12 2016-17
Primary Secondary Tertiary
9.71%
13.87%
9.95%
CAGR
Source: Sector-wise %share of GSVA

For updated information, please visit www.ibef.org BIHAR 13
ECONOMIC SNAPSHOT – FDI INFLOWS &
INVESTMENTS
FDI* inflow in Bihar (US$ million)
Source: Department of Industrial Policy & Promotion, Ministry of Commerce & Industry, Government of India
Total FDI for Bihar & Jharkhand, between April 2000 and March
2018, stood at US$ 113 million.
In 2017 – 18^, the number of investments filed were 1 and the
amount of investments proposed were Rs 28 crore (US$ 4.34
million)
Note: * - Including Jharkhand, IEMs – Industrial Entrepreneur Memoranda, conversion rate: US$ = Rs 64.45, ^ - Upto May 2018
Investment intentions in terms of IEMs filed
Year Number
Proposed
investments
(US$ million)
2016 19 898.99
2017 7 72.77
2018^ 1 4.34
6 24
7
2 11
43
10
10
6
30
37 39
50
93
103
113
0
20
40
60
80
100
120
FY11 FY12 FY13 FY14 FY15 FY16 FY17 FY18
Annual FDI Inflow
Cumulative from April 2000

BIHAR
PHYSICAL
INFRASTRUCTURE

For updated information, please visit www.ibef.org BIHAR 15
PHYSICAL INFRASTRUCTURE – ROADS
Bihar has 4,839 km of national highways & 4,005.6 km of state
highways. Besides, the state has 11,145.3 km of major district roads.
As per Budget 2018-19, Rs 6,889.12 crore (US$ 1.07 million) has
been allocated for road construction in the state.
As of April 2018, work on NH2 in Bihar has been started. Total cost
of the project is estimated as Rs 882 crore (US$ 136.85 million).
Under BSHP – 2, construction of ROB (part of SH 83 - Baghi-
Barbigha Road) is expected to complete in January 2019. total cost
of the project was Rs 32.74 crore (US$ 5.08 million)
Type of road Length (km)
(up to September 2017)
National highways^ 4,839
State highways 4,005.6
Major district roads 11,145.3
Source: Economic & Highways, State Budget 2015-16, Road Construction Dept., Bihar Rajya Pul Nirman Nigam Ltd
Note: ^ - as of February 2018, NH – National Highway, ROB – Road Over Bridges, BSHP – Bihar State Highway Project, conversion rate: US$ = Rs 64.45
Roads in Bihar
For updated information, please visit www.ibef.org BIHAR 16
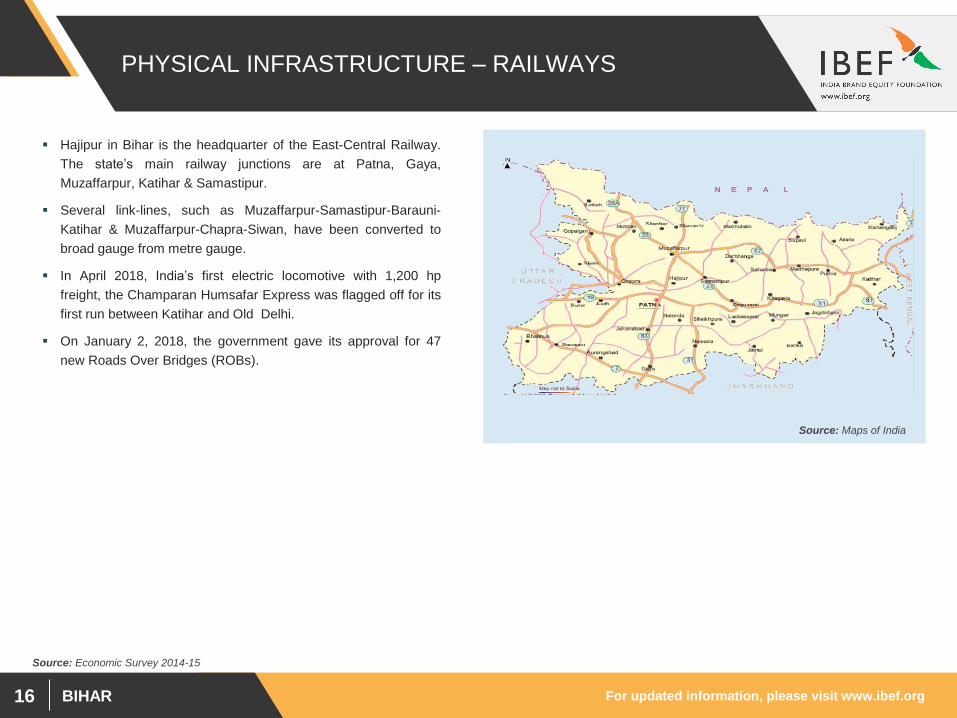
PHYSICAL INFRASTRUCTURE – RAILWAYS
Hajipur in Bihar is the headquarter of the East-Central Railway.
The state’s main railway junctions are at Patna, Gaya,
Muzaffarpur, Katihar & Samastipur.
Several link-lines, such as Muzaffarpur-Samastipur-Barauni-
Katihar & Muzaffarpur-Chapra-Siwan, have been converted to
broad gauge from metre gauge.
In April 2018, India’s first electric locomotive with 1,200 hp
freight, the Champaran Humsafar Express was flagged off for its
first run between Katihar and Old Delhi.
On January 2, 2018, the government gave its approval for 47
new Roads Over Bridges (ROBs).
Source: Economic Survey 2014-15
Source: Maps of India

For updated information, please visit www.ibef.org BIHAR 17
PHYSICAL INFRASTRUCTURE – AIRPORTS
Bihar has 1 domestic airport in Patna & 1 international airport in
Bodh Gaya. Several domestic airlines connect Patna to Delhi,
Kolkata, Mumbai, Lucknow, Bengaluru, Hyderabad & Ranchi.
The airport in Bodh Gaya is used for international connectivity with
Bangkok (Thailand), Colombo (Sri Lanka), Yangon (Myanmar),
Dhaka (Bangladesh), Paro (Bhutan) & Kuala Lumpur (Malaysia
In 2017-18, the total number of aircraft moments in Patna was
21,916. Total number of passenger and freight handled at Patna
airport in 2017-18 were 3,111,273 and 6,879 MT respectively.
During 2018-19*, Patna and Gaya handled 7,070 and 332 aircraft
movements respectively. Patna and Gaya handled 1,017,269 and
22,624 passengers respectively in 2018-19*. Patna airport handled
2,453 MT freight traffic in 2018-19*.
Parameter Patna Gaya
Aircraft movement (nos.) 7,070 332
Passenger traffic (nos.) 1,017,269 22,624
Freight handled (MT) 2,453 0
Airport indicators in 2018-19*
Source: Airport Authority of India
Note: * - Upto June 2018
For updated information, please visit www.ibef.org BIHAR 18
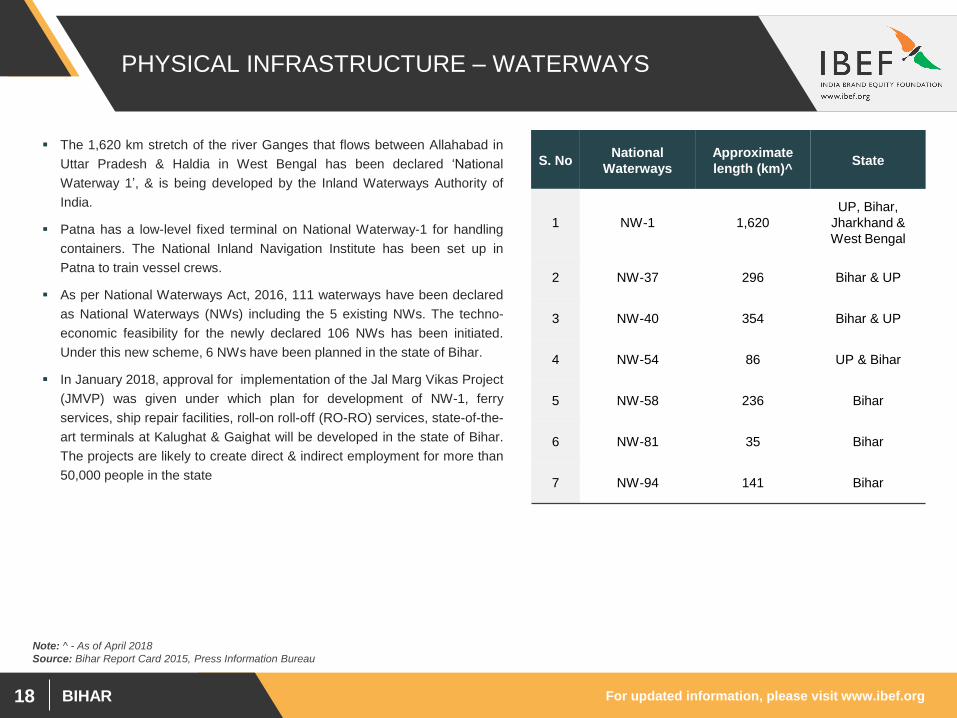
PHYSICAL INFRASTRUCTURE – WATERWAYS
The 1,620 km stretch of the river Ganges that flows between Allahabad in
Uttar Pradesh & Haldia in West Bengal has been declared ‘National
Waterway 1’, & is being developed by the Inland Waterways Authority of
India.
Patna has a low-level fixed terminal on National Waterway-1 for handling
containers. The National Inland Navigation Institute has been set up in
Patna to train vessel crews.
As per National Waterways Act, 2016, 111 waterways have been declared
as National Waterways (NWs) including the 5 existing NWs. The techno-
economic feasibility for the newly declared 106 NWs has been initiated.
Under this new scheme, 6 NWs have been planned in the state of Bihar.
In January 2018, approval for implementation of the Jal Marg Vikas Project
(JMVP) was given under which plan for development of NW-1, ferry
services, ship repair facilities, roll-on roll-off (RO-RO) services, state-of-the-
art terminals at Kalughat & Gaighat will be developed in the state of Bihar.
The projects are likely to create direct & indirect employment for more than
50,000 people in the state
S. No National
Waterways
Approximate
length (km)^ State
1 NW-1 1,620
UP, Bihar,
Jharkhand &
West Bengal
2 NW-37 296 Bihar & UP
3 NW-40 354 Bihar & UP
4 NW-54 86 UP & Bihar
5 NW-58 236 Bihar
6 NW-81 35 Bihar
7 NW-94 141 Bihar
Source: Bihar Report Card 2015, Press Information Bureau
Note: ^ - As of April 2018

For updated information, please visit www.ibef.org BIHAR 19
PHYSICAL INFRASTRUCTURE – POWER
The BSEB is a vertically integrated agency & is responsible for
generation, transmission & distribution of electricity in Bihar
As of June 2018, Bihar had a total installed power generation
capacity of 4,341.47 MW, of which 3,024.32 MW was contributed
by central utilities, 780.70 MW by state utilities & 536.45 MW by
private utilities.
During the same time period, of the total thermal power plant
capacity, coal-based plants accounted for the largest share with
capacity contribution of 3,905.33 MW.
Hydropower plants accounted for a power generation capacity of
110 MW. Besides, 326.15 MW of installed power generation
capacity came from renewable sources.
Installed power capacity (MW)
Source: Central Electricity Authority, Bihar Economic Survey 2017-18
1,8
45
.70
1,9
21
.90
1,8
33
.90
1,8
68
.10
2,1
98
.30
2,7
59
.80
3,0
29
.89
3,6
07
.54
4,3
41
.47
4,3
41
.47
0.00
500.00
1,000.00
1,500.00
2,000.00
2,500.00
3,000.00
3,500.00
4,000.00
4,500.00
5,000.00
200
9-1
0
201
0-1
1
201
1-1
2
201
2-1
3
201
3-1
4
201
4-1
5
201
5-1
6
201
6-1
7
201
7-1
8
201
8-1
9*
Note: BSEB - Bihar State Electricity Board, * - Up to June 2018

For updated information, please visit www.ibef.org BIHAR 20
PHYSICAL INFRASTRUCTURE – TELECOM
The Office of Controller of Communication Accounts (CCA) regulates
and monitors the telecom department in the state.
According to Telecom Regulatory Authority of India (TRAI), Bihar*
had nearly 82.75 million wireless subscribers and 258,450 wire-line
subscribers, as of May 2018.
The tele-density in the state stood at 58.85 per cent, as of May 2018.
By the end of May 2018, 14,482,626 subscribers had submitted
requests for mobile number portability in Bihar*.
Wireless subscribers 82,749,364
Wireline subscribers 258,450
Tele density (in%) 58.85
Internet subscribers^ (million No.)
28.40
No. of GPs in Phase-I 5,202
Pipe laid (km)@ 12,971
Cable laid (km) 14,161
GPs for which cable laid 5,483
Performance status of BharatNet Project
(As of April 2018)
Source: Telecom Regulatory Authority of India
Telecom Infrastructure* (As of May 2018)
Note: * - includes Jharkhand, ^ - March 2018, @ - as of November 2017

For updated information, please visit www.ibef.org BIHAR 21
PHYSICAL INFRASTRUCTURE – URBAN DEVELOPMENT
Non metro markets like Patna & other tier II cities have grown rapidly
in regard to consumption, thus becoming main target markets,
posing a huge potential of transforming themselves into new
business centres in comparison with metro cities.
4 cities of Bihar namely, Bhagalpur, Bihar Sharif, Patna &
Muzaffarpur are to be developed as smart cities and along with the
selected smart cities, 26 cities of Bihar were selected for
infrastructure development under AMRUT scheme.
Scheme Estimated cost US$ million
Solid Waste Management for
Danapur, Khagaul and Phulwari 1.92
Khagaul Water Supply Scheme 2.18
Danapur Water Supply Scheme 11.44
Phulwarisharif Water Supply
Scheme 4.09
Patna Water Supply Scheme 70.83
Solid Waste Management for
Patna 6.13
Purchase of buses for Patna
Urban Transport 6.62
Bodhgaya Water Supply
Scheme 5.56
Bodhgaya Sewerage Scheme 15.92
Purchase of buses for Bodhgaya
Urban Transport 1.12
Urban Infrastructure in Bihar
Source: Department of Urban Development and Housing, GOB , AMRUT - Atal Mission for Rejuvenation and Urban Transformation
Cities Population Area (sq km) Literacy rate
Bhagalpur 412,209 2,569 63.14%
Biharsharif 297,268 23.5 74.80%
Muzaffarpur 396,590 3,172 83.08%
Patna 2,049,156 3202 83.37%
Smart Cities in Bihar
As on April 2018, under the AMRUT scheme, total amount of Rs
2,469.77 crore (US$ 383.21 million) were allocated to the state of
Bihar.
Note: Conversion rate: US$ = Rs 64.45

BIHAR
SOCIAL
INFRASTRUCTURE

For updated information, please visit www.ibef.org BIHAR 23
SOCIAL INFRASTRUCTURE – EDUCATION
The literacy rate of the state was recorded as 61.8 per cent. Male literacy rate in the state is 71.2 per cent and female literacy rate is 51.5 per cent.
The total number of students enrolled in primary & upper primary (up to class VIII) schools rose to 21.6 million in 2014-15 from 17.7 million in 2007-
08. The enrolment of girls in the state is progressing, with the rate of re-enrolment of girls increasing at a faster rate than that of the boys. However,
the dropout rates have witnessed a decline over the past years.
The prestigious IIT was established in Patna in August 2008. The institute offers B.Tech programmes in 3 disciplines: Computer Science &
Engineering, Electrical Engineering & Mechanical Engineering. PhD programmes are offered in Engineering, Science & Humanities & Social
Sciences.The state government is coming up with various initiatives for increasing employment prospects in the state under the Bihar Skill
Development Mission. The scheme has been allotted a budget of US$ 2.9 million.
As per 2018-19 Budget, 1.25 crore children are provided daily mid day meal in 70,371 schools. As of December 2017, Rs 97.88 crore (US$ 151.86
million) have been released for Mid day Meal Scheme.
Source: Economic Survey of Bihar 2015-16, Medical Council of India, University Grants Commission, Bihar Government Budget 2016-17, 2018-19, IIT - Indian Institute of Technology
Reputed technical institutes in Bihar
Indian Institute of Technology, Patna
National Institute of Technology, Patna
National Institute of Fashion Technology, Patna
Reputed medical institutes in Bihar
Indira Gandhi Institute of Medical Sciences, Patna
Jawaharlal Nehru Medical College, Bhagalpur
Patna Medical College, Patna
Indicators Target 2016-17
Gross Enrolment Ratio (GER) of Class 9th 85% for children of
all categories
No. of girls of SC/ST/EBC/minorities passing class
10th
All Girls - 7,15,000
SC Girls - 92,000
ST Girls - 7,000
Gender ratio of candidates appearing in class 10th
Board Exam 52:48
Pupil Teacher Ratio (PTR) - Secondary/higher
secondary (a teacher for every group of 60 students
in each subject)
60:1
Gross Enrolment Ratio (GER) in higher education 30%
Note: Conversion rate: US$ = Rs 64.45
For updated information, please visit www.ibef.org BIHAR 24
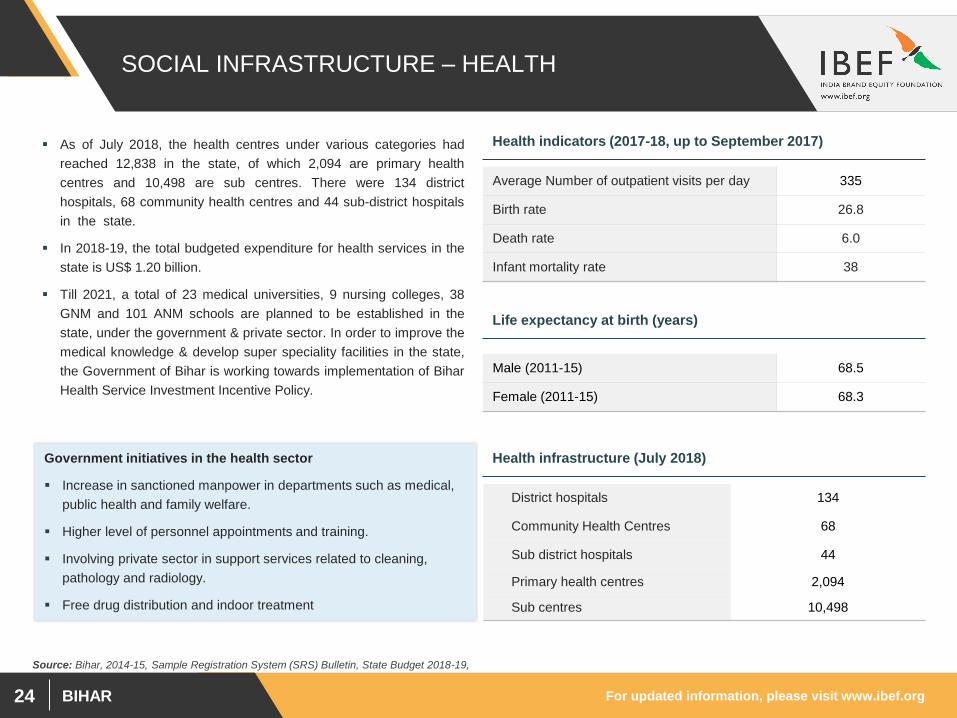
SOCIAL INFRASTRUCTURE – HEALTH
As of July 2018, the health centres under various categories had
reached 12,838 in the state, of which 2,094 are primary health
centres and 10,498 are sub centres. There were 134 district
hospitals, 68 community health centres and 44 sub-district hospitals
in the state.
In 2018-19, the total budgeted expenditure for health services in the
state is US$ 1.20 billion.
Till 2021, a total of 23 medical universities, 9 nursing colleges, 38
GNM and 101 ANM schools are planned to be established in the
state, under the government & private sector. In order to improve the
medical knowledge & develop super speciality facilities in the state,
the Government of Bihar is working towards implementation of Bihar
Health Service Investment Incentive Policy.
District hospitals 134
Community Health Centres 68
Sub district hospitals 44
Primary health centres 2,094
Sub centres 10,498
Health indicators (2017-18, up to September 2017)
Average Number of outpatient visits per day 335
Birth rate
26.8
Death rate
6.0
Infant mortality rate
38
Life expectancy at birth (years)
Male (2011-15) 68.5
Female (2011-15) 68.3
Health infrastructure (July 2018)
Source: Bihar, 2014-15, Sample Registration System (SRS) Bulletin, State Budget 2018-19,
Government initiatives in the health sector
Increase in sanctioned manpower in departments such as medical,
public health and family welfare.
Higher level of personnel appointments and training.
Involving private sector in support services related to cleaning,
pathology and radiology.
Free drug distribution and indoor treatment

BIHAR
INDUSTRIAL
INFRASTRUCTURE

For updated information, please visit www.ibef.org BIHAR 26
INDUSTRIAL INFRASTRUCTURE
The central government of India approved the formation of an
AKICDC (Amritsar-Kolkata Industrial Corridor Development
Corporation), development work of which started in 2014. The
BIADA is responsible for promoting and assisting rapid
development of industries in the industrial areas and estates.
Operations of BIADA are divided into 4 regions – Patna,
Muzaffarpur, Darbhanga, Bhagalpur – to facilitate quick services to
entrepreneurs. The total developed land by BIADA is of 5,184
acres; of which industrial units have been allotted 3,438 acres (66
per cent). BIADA of Patna had attained the maximum share of
3,144.82 acres.
As of June 2018, the Consumer Price Index for industrial workers
was recorded to be 306.
Region Acquired land
(acre)
Land reserved for infrastructure,
administrative block, road etc. (acre)
Allotted land
(acre)
Total vacant land
(acre)
No of running
units
Patna 2700.38 269.86 2294.83 51.59 666
Bhagalpur 1347.29 105.2 374.15 31.8 284
Darbhanga 725.61 156.86 441.79 28.61 292
Muzaffarpur 411.96 55.16 327.23 29.51 364
Source: Economic Survey of Bihar, 2015-16 BIADA - Bihar Industrial Area Development Authority
Centres Industries
Patna
Major agricultural centre of trade, exporting grain,
sugarcane, sesame & medium-grained rice; has also
emerged as a manufacturing hub in Bihar, with the
highest number of industrial units.
Tirhut
Has the 2nd highest number of industrial units in the
state; food/beverage processing & manufacturing units
located here.
Muzaffarpur Important trade centre for cloth; famous for exporting
fruits, particularly mango & litchi.
Barauni
Has major industrial units including those of Indian Oil
Corporation; capacity of the existing thermal power
station has undergone major renovation &
modernisation.
Bhagalpur
Famous globally for tussar silk; trading of agricultural
produce & cloth is an important economic activity; other
major industries include rice, sugar milling & wool
weaving.
Gaya Major weaving centre; important tourist hub.
BIHAR
KEY SECTORS
Agriculture and Allied Sectors
Sugar
Tourism

For updated information, please visit www.ibef.org BIHAR 28
KEY SECTORS – AGRICULTURE AND ALLIED
SECTORS…(1/2)
Bihar is one of the largest producers of vegetables & fruits in the
country, making it a suitable place for setting up units in the food
processing sector. The state is one of the leading producers of fruits
such as banana, mango, guava, litchi & vegetables such as onion,
tomato, potato and eggplant in the country.
The Food Park scheme in Bihar has been declared to be the most
admired scheme by the Ministry of Food Processing Industry in the
history of food processing in India.
Various schemes under which the Directorate of Food Processing is
delivering special assistance to the sector are Integrated
Development project, food park scheme, cold storage scheme,
modernization scheme for established rice mills, etc.
Total horticulture production in the state for 2017-18^ was 18,881.16
thousand MT with 1,176.68 thousand hectares of area under
production
Crop Annual production (‘000 MT)
Rice 7,296.4
Wheat** 5,985.84
Total coarse cereals** 3,874.50
Total pulses 340.9
Onion 1,248.96
Sugarcane (P) 16,511.4
Fruits^ 4,234.62
Vegetables^ 14,520.97
Honey^ 9.09
Potato 6,377.71
Leading districts of crop production
Rice Rohtas, Aurangabad, West Champaran, Gaya
Maize Madhepura, Khagaria, Saharsa, Katihar, Bhagalpur
Wheat Rohtas, East Champaran, Muzaffarpur, Siwan
Pulses Patna, Aurangabad, Bhojpur
Source: Economic Survey of Bihar, 2017-18, Horticulture Database 2017-18, National Horticulture Board, Department of Agriculture Co-operation & Farmers Welfare
Production in Bihar (2017-18)*
Note: * - As per 2nd Advance Estimates, ^ - As per 1st Advance Estimates, P – Provision, ** - Production 2016-17

For updated information, please visit www.ibef.org BIHAR 29
COMPFED is an organised milk processing cooperative which collects milk through district level cooperative
unions, and processes and markets the same.
It supports members with interventions across technology, supply chain, marketing, training, etc.
COMPFED covers five districts directly and 26 districts through six district level cooperative unions.
Around 11,000 women have been already trained under its training management program
In April 2018, the State Government of Bihar inaugurated six plants of Bihar State Milk Cooperative
Federation.
Usher Agro Limited is one of the largest basic food grain (rice and wheat) processing companies in India. The
company established its rice processing mill in Buxar, Bihar in 2003.
The company's product list consists of rice, bran, wheat and husk which are sold under the brand name of ‘Rasoi
Raja’.
Bihar State
Cooperative Milk
Producer’s Federation
(COMPFED)
Usher Agro Ltd
KEY SECTORS – AGRICULTURE AND ALLIED
SECTORS…(2/2)

For updated information, please visit www.ibef.org BIHAR 30
KEY SECTORS – SUGAR ... (1/2)
Sugar, the largest agro-based industry in the state, plays a prominent
role in Bihar’s economy. The northern part of the state is climatically
well suited for producing good quality sugarcane with minimum inputs
as compared to other states.
In order to promote the sugarcane industry, the state government
grants various rebates and concessions, some of which include - VAT
reduction on denatured spirit and ethanol from 12.5 to 4.0 per cent
and eradication of literage fees on liquor and ethanol.
Sugarcane is grown in approximately 6 percent of the total area
under cultivation in Bihar. Sugarcane production in the state for 2017-
18 (P) stood at 16.51 million MT.
During 2017-18*, 438,000 MT sugar was produced in Bihar.
Super variety 4.81
General variety 4.50
Low variety 4.11
Sugarcane prices (US$/quintals) – as of 2017-18
Source: Economic Survey of Bihar, 2016-17, Bihar Report Card, 2015 Sugarcane Industries Department, Government of Bihar
Note: * - Upto February 2018, P - Provisional

For updated information, please visit www.ibef.org BIHAR 31
The company is promoted by the Bajoria family and was incorporated in 1932.
It manufactures molasses and sugar at Gopalganj in Bihar. Vishnu Sugar Mills Ltd
The company belongs to the Dhanuka Group and was incorporated in 1980.
It manufactures ethyl alcohol, molasses and sugar at Sitamarhi. The plant has a crushing capacity of 5,000 tonnes
per day.
Riga Sugar Co Ltd
The company was incorporated in 1964.
It manufactures molasses and sugar at Purba Champaran, in Bihar.
The plant has a crushing capacity of 2,500 tonnes per day. Eastern Sugar &
Industries Ltd
K K Birla Group’s sugar company, Upper Ganges Sugar & Industries Limited (UGSIL), has two units in Bihar:
Bharat Sugar Mills at Sidhwalia [crushing capacity of 5,000 tonnes per day (TPD)] and Hasanpur Sugar Mills at
Hasanpur (crushing capacity of 3,000 TPD).
The Sidhwalia unit has an 18 MW cogeneration power plant.
K. K. Birla Group
KEY SECTORS – SUGAR ... (2/2)

For updated information, please visit www.ibef.org BIHAR 32
KEY SECTORS – TOURISM … (1/2)
The state has a rich cultural heritage as it is associated with
pilgrimages and historical monuments related to religious gurus such
as the Buddha, Mahavir and Guru Gobind Singh. Tourism in the state
revolves around Buddhism (Bodhgaya, Rajgir, Nalanda), Jainism
(Bisram, Mandar hill, Champanagar) and Sufism.
The state government has established the Bihar State Tourism
Development Corporation with the prime objective of developing
hotels, transports, railways, swimming pools, health tourism, etc. and
running them on a commercial basis for the benefit of tourists.
The government has planned two mega religious tourism circuits
(Buddhism & Jainism), two mega theme parks based on the life of
Buddha and Mahavir (to be constructed at Bodh Gaya and Rajgir)
and eight mega centres for educational, cultural and religious tourism
[Bodh Gaya, Rajgir, Patna city, Vaishali, Nalanda, Vikramasila, Ashok
Dham, Yoga Sansthan (Munger)].
The foreign tourist arrivals in Bihar in the year 2017 was around 1.08
million.
Source: Ministry of Tourism, Government of Bihar
Arrival of foreign tourists in Bihar (in ‘000s)
63
5.7
2
97
2.4
9
10
96
.93
76
5.8
4
82
9.5
1
92
3.7
4
10
10
.53
10
83
.00
0.00
200.00
400.00
600.00
800.00
1000.00
1200.00
201
0
201
1
201
2
201
3
201
4
201
5
201
6
201
7

For updated information, please visit www.ibef.org BIHAR 33
KEY SECTORS – TOURISM … (2/2)
Goals and actions set up by the Bihar State Council under the Bihar@2022 vision document for improving the tourism sector are as follows:
Source: Ministry of Tourism, Government of Bihar
Goals to achieve by 2022
Construction of 2 mega religious tourism circuits of Buddhism &
Jainism
Construction of 2 mega theme parks based on the lives of Buddha
and Mahavir at Rajgir & Bodh Gaya
Construction of 8 mega centres for religious, educational & cultural
education at Bodh Gaya, Patna, Rajgir, Vaishali, Ashok Dham,
Nalanda, Vikramasila, Yoga Sansthana & Munger
By 2022, the state is targeting 100 lakh Indian & foreign tourists
every year
Action points
Establishment of schools within a 1 km radius of every habitation in
order to increase access to schools irrespective of the capacity to
pay.
Fast track upgradation of the infrastructure of state schools &
ensuring availability of sufficient teachers
Policy initiatives & awareness campaigns in order to ensure higher
enrolment & zero dropout
Establishment of centres of excellence in all primary schools in rural
areas.
Improvement of hygiene in schools & colleges

BIHAR
KEY PROCEDURES &
POLICIES

For updated information, please visit www.ibef.org BIHAR 35
SINGLE–WINDOW APPROVAL MECHANISM
Bihar Single Window Clearance Act, 2006 & the Bihar Industrial Incentive Policy, 2011, promote industrial growth by giving rapid clearances,
issuing licenses & certificates & providing an overall investor-friendly environment in the state.
The industries department of the state and the DIC act as nodal agencies for investments.
Proposals for investments greater than US$ 21.7 million are routed through the Chief Minister & the cabinet for approval.
Investment handled Body Chairman Nodal agency
US$ 2.17 million to
US$ 21.7 million
State-Level Investment Promotion
Board
Industries Development
Commissioner
Industries Development
(Udyog Mitra)
Below US$ 2.17 million District-Level Committee District Collector DIC
DIC - District Industries Centre

For updated information, please visit www.ibef.org BIHAR 36
KEY INVESTMENT PROMOTION OFFICES … (1/2)
Agency Description Contact information
Industries
Department,
Government of Bihar
It is the state-level nodal body under the single-window regime for investments
of above US$ 2.17 million.
Its primary functions involve coordinating applications from investors,
processing applications & facilitating the process of obtaining clearances from
various departments.
The department, headed by the Principal Secretary, supervises District
Industry Centres (DIC), industrial area development authorities & industrial
premises in the state.
Vikas Bhawan
Bailey Road,
Patna - 800 001, Bihar.
Phone: 91-612-2215 211
Fax: 91-612-2217 991
Website: http://industries.bih.nic.in/
District Industry
Centre (DIC)
This is the district-level nodal agency for investments below US$ 2.17 million.
DIC supports entrepreneurs in identifying local resources, supply of raw
materials & equipment, arrangement of credit facilities, marketing, quality
control, etc.
District Industries Centre, Patna
Phone - 0612-2270865
Fax: 0612-2218900
Bihar Industrial Area
Development
Authority (BIADA)
It was constituted with a mission to promote industrialisation & create
awareness about the state’s Industrial Policy. It supports entrepreneurs in
setting up industries and availing incentives offered by the state government.
The organisation runs under the guidelines & policies of the Board of Directors,
having directors nominated by the State Government under the chairmanship
of the principal secretary, Department of Industries, Government of Bihar.
1st Floor, Udyog Bhawan,
East Gandhi Maidan,
Patna - 800 004, Bihar
Phone: 91-612-2675 991, 2675 002,
2675 352
Fax: 91-612-2675 889
E-mail: [email protected],
Website: http:///www.biadabihar.in/

For updated information, please visit www.ibef.org BIHAR 37
KEY INVESTMENT PROMOTION OFFICES … (2/2)
Agency Description Contact information
Bihar State Finance
Corporation
It is the main state-level institution that provides term lending facilities to
industrial entrepreneurs.
The corporation has entered into an agreement with Small Industries
Development Bank of India (SIDBI), under which joint financing will be done by
SIDBI and BSFC in the proportion of 90:10. Under this scheme, a minimum of
US$ 0.3 million loan can be provided to one unit.
Fraser Road,
Patna - 800 001, Bihar
Phone: 91-612-2332 785
E-mail: [email protected]
Website: http://bsfc.bih.nic.in/
Bihar State
Electricity Board
(BSEB)
The board is responsible for the synchronised development of generation,
transmission and distribution of power in the state.
Vidyut Bhawan,
Bailey Road,
Patna - 800 001, Bihar.
Phone: 91-0612-2504 036
Fax: 91-0612-2504 968
Website: http://bseb.bih.nic.in/
Bihar State Pollution
Control Board
The purpose of the organisation is prevention & control of pollution through
inspection of treatment plants, standards application, research & development
activities, etc.
Headquartered at Patna, the organisation has seven zonal offices.
Beltron Bhawan, Shastri Nagar
Jawahar Lal Nehru Marg,
Patna - 800 023, Bihar
Phone: 91-0612-2281 250
Fax: 91-0612-2281 050
Email: [email protected],
Website: http://bspcb.bih.nic.in/

For updated information, please visit www.ibef.org BIHAR 38
KEY APPROVALS REQUIRED … (1/2)
Approvals and clearances required Departments to be consulted Estimated time
Incorporation of company Registrar of Companies NA
Registration, Industrial Entrepreneurs
Memorandum (IEM), Industrial Licenses Nodal Agency (Industries Department) NA
Allotment of land Bihar Industrial Area Development Authority Seven to 21 days (up to 90 days for
acquisition of non-industrial land)
Permission for land use Revenue and Land Reforms Department,
Government of Bihar
30 days (45 days for conversion of non-
industrial land for use)
Registration under Factories Act and Boilers Act Offices of Inspector of Factories, Inspector of
Boilers Up to 120 days
Site environmental approval, no objection
certificate and consent under Water and Pollution
Control Acts
Bihar State Pollution Control Board and Ministry of
Environment and Forests, Government of Bihar 60 days
Approval of construction activity and building plan Urban Development and Housing Department,
Government of Bihar Seven days
Sanction of power Bihar State Electricity Board Up to 30 days
Sanction of water Water Resources Department, Government of
Bihar Up to 30 days
Fire service clearance State Fire Service Headquarters, Government of
Bihar Up to 15 days
Registration under state’s Sales Tax Act, and
Central and State Excise Act
Sales Tax Department, Central and State Excise
Departments Seven days
NA: Not Available

For updated information, please visit www.ibef.org BIHAR 39
COST OF DOING BUSINESS IN BIHAR
Cost parameter Cost estimate Source
Industrial land (per acre), as of January 2017 US$ 1,715,111 in Patliputra,
US$ 252,222 in Muzaffarpur Bihar Industrial Area Development Authority
Labour (minimum wages per day) US$ 2.3 to US$ 5.7 Ministry of Labour and Employment,
Government of India
Office space rent
(per sq ft per month) US 50 cents to US$ 1.2 Industry sources
Residential rent
(2,000 sq ft per month) US$ 175 to US$ 350 Industry sources
Five-star hotel room (per night) US$ 100-200 Leading hotels in the state
Commercial and industrial electricity (per kwh) Industrial: US 10.3 cents to US 11.1 cents
Commercial: US 9.8 cents to US 11.2 cents Bihar State Electricity Board

For updated information, please visit www.ibef.org BIHAR 40
STATE ACTS, POLICIES & INCENTIVES … (1/2)
Objectives
Bihar State Hydro-Power
Policy – 2012
To enhance the overall generation capacity of the state, including hydro power.
To obtain optimal thermal-hydro generation mix in a 60:40 ratio.
To encourage participation of independent power producers by offering them the best policy framework and
support. Read more
To promote balanced industrial development and enable industries to contribute towards the social and economic
development of the state.
Bihar Industrial Incentive
Policy – 2011 Read more
Bihar Policy for
Promotion of New and
Renewable Energy
Sources 2011
To develop all forms of new and renewable energy sources, including biomass- and biogas-based projects,
cogeneration projects, mini/micro/small hydro projects (up to 25 MW), wind power projects, solar projects,
municipal solid waste-based projects, and other renewable resources-based projects. Read more
Information and
Communication
Technology Policy 2011
To create world-class IT infrastructure in the state.
To promote investment in the IT/ITeS/Electronic Hardware Manufacturing (EHM) units by private industry to
accelerate the pace of IT enablement in the state. Read more
Bihar Women
Empowerment Policy
2015
As per the women empowerment policy, the state is increasing its focus on women empowerment by ensuring
availability of resources (education and employment) for women, which would in turn lead to increased contribution
from women in development of the economy. Read more

For updated information, please visit www.ibef.org BIHAR 41
STATE ACTS, POLICIES & INCENTIVES … (2/2)
Incentives for NRIs
Bihar Foundation organized a two-day global meet of Non-Resident Bihari's on 18–19 February 2012 with an aim
to attract NRBs from across the world so that they can share their views on the state and its development. NRIs
from Bihar who have been successful in their respective fields were invited to the event to share their experiences.
To promote balanced industrial development and enable industries to contribute towards the social and economic
development of the state.
Bihar Industrial Incentive
Policy – 2011 Read more
The state government has offered incentive packages in the form of various tax concessions, capital and interest
subsidies, reduced power tariffs, etc. to attract foreign funds in the region.
Investment subsidies for
NRIs
The government is taking steps to provide adequate facilities to enable NRIs to start small scale industries in the
state.
Availability of finance for
NRIs
Incentives for new
investments in plant and
machinery
Companies investing US$ 18.7 million or more in plant and machinery during the period from 1 April 2013 to 31
March 2015 would be entitled to deduct an investment allowance of 15 per cent of the investment.
Incentives to semiconductor wafer fabrication manufacturing facilities including zero customs duty for plant and
machinery.
Incentives for waste to
energy projects
The Government would provide low interest-bearing fund from the National Clean Energy Fund to IREDA to lend to
viable renewable energy projects. ‘Generation-based incentive’ has been reintroduced for wind energy projects and
a sum of US$ 150 million has been allocated for this purpose.
Food Processing Policy
To address the infrastructure, technology, skills & marketing constraints being faced by the food processing units
for rice, maize, pulses, honey, makhana, fruits & vegetables & others by facilitating the setting up of new food
processing units.
To aid the expansion and upgradation of the existing units. Read more

BIHAR
ANNEXURE

For updated information, please visit www.ibef.org BIHAR 43
ANNEXURE…(1/2) - SOURCES
Data Sources
GSDP (state) Directorate of Economics & Statistics of Bihar, Central Statistics Office
Per capita GSDP figures Directorate of Economics & Statistics of Bihar, Central Statistics Office
GSDP (India) Directorate of Economics & Statistics of Bihar, Central Statistics Office
Installed power capacity (MW) Central Electricity Authority, as of June 2018
Wireless subscribers (No) Telecom Regulatory Authority of India, as of May 2018
Internet subscribers (Mn) Telecom Regulatory Authority of India, as of March 2018
National highway length (km) NHAI & Roads and Building Department, as of February 2018
Airports (No) Airports Authority of India
Literacy rate (%) Census 2011
Birth rate (per 1,000 population) SRS Bulletin
Cumulative FDI equity inflows (US$ billion) Department of Industrial Policy & Promotion, April 2000 to March 2018
Operational PPP projects (No) DEA, Ministry of Finance, Government of India
PPP projects under construction (no) DEA, Ministry of Finance, Government of India

For updated information, please visit www.ibef.org BIHAR 44
ANNEXURE…(2/2) - EXCHANGE RATES
Exchange Rates (Fiscal Year) Exchange Rates (Calendar Year)
Year INR INR Equivalent of one US$
2004–05 44.95
2005–06 44.28
2006–07 45.29
2007–08 40.24
2008–09 45.91
2009–10 47.42
2010–11 45.58
2011–12 47.95
2012–13 54.45
2013–14 60.50
2014-15 61.15
2015-16 65.46
2016-17 67.09
2017-18 64.45
Q1 2018-19 67.04
Year INR Equivalent of one US$
2005 44.11
2006 45.33
2007 41.29
2008 43.42
2009 48.35
2010 45.74
2011 46.67
2012 53.49
2013 58.63
2014 61.03
2015 64.15
2016 67.21
2017 65.12
Source: Reserve Bank of India, Average for the year

For updated information, please visit www.ibef.org BIHAR 45
DISCLAIMER
India Brand Equity Foundation (IBEF) engaged Aranca to prepare this presentation and the same has been prepared by Aranca in consultation with
IBEF.
All rights reserved. All copyright in this presentation and related works is solely and exclusively owned by IBEF. The same may not be reproduced,
wholly or in part in any material form (including photocopying or storing it in any medium by electronic means and whether or not transiently or
incidentally to some other use of this presentation), modified or in any manner communicated to any third party except with the written approval of
IBEF.
This presentation is for information purposes only. While due care has been taken during the compilation of this presentation to ensure that the
information is accurate to the best of Aranca and IBEF’s knowledge and belief, the content is not to be construed in any manner whatsoever as a
substitute for professional advice.
Aranca and IBEF neither recommend nor endorse any specific products or services that may have been mentioned in this presentation and nor do
they assume any liability or responsibility for the outcome of decisions taken as a result of any reliance placed on this presentation.
Neither Aranca nor IBEF shall be liable for any direct or indirect damages that may arise due to any act or omission on the part of the user due to any
reliance placed or guidance taken from any portion of this presentation.
![Agartala10 Jharkhand Bihar Bihar[1]](https://static.fdocuments.net/doc/165x107/557d1b01d8b42a4f498b4d72/agartala10-jharkhand-bihar-bihar1.jpg)