
Bigger Tides, Less Flooding: Effects of Dredging on ...
17
Portland State University Portland State University PDXScholar PDXScholar Civil and Environmental Engineering Faculty Publications and Presentations Civil and Environmental Engineering 1-2019 Bigger Tides, Less Flooding: Effects of Dredging on Bigger Tides, Less Flooding: Effects of Dredging on Barotropic Dynamics in a Highly Modified Estuary Barotropic Dynamics in a Highly Modified Estuary David K. Ralston Woods Hole Oceanographic Institution Stefan Talke Portland State University, [email protected] W. Rockwell Geyer Woods Hole Oceanographic Institution Hussein A. M. Al-Zubaidi Portland State University, [email protected] Christopher K. Sommerfield University of Delaware Follow this and additional works at: https://pdxscholar.library.pdx.edu/cengin_fac Part of the Environmental Engineering Commons, and the Hydrology Commons Let us know how access to this document benefits you. Citation Details Citation Details Ralston, D. K., Talke, S., Geyer, W. R., Al‐Zubaidi, H. A., & Sommerfield, C. K. (2019). Bigger Tides, Less Flooding: Effects of Dredging on Barotropic Dynamics in a Highly Modified Estuary. Journal of Geophysical Research: Oceans, 124(1), 196-211. This Article is brought to you for free and open access. It has been accepted for inclusion in Civil and Environmental Engineering Faculty Publications and Presentations by an authorized administrator of PDXScholar. Please contact us if we can make this document more accessible: [email protected].
Transcript of Bigger Tides, Less Flooding: Effects of Dredging on ...

Portland State University Portland State University
PDXScholar PDXScholar
Civil and Environmental Engineering Faculty Publications and Presentations Civil and Environmental Engineering
1-2019
Bigger Tides, Less Flooding: Effects of Dredging on Bigger Tides, Less Flooding: Effects of Dredging on
Barotropic Dynamics in a Highly Modified Estuary Barotropic Dynamics in a Highly Modified Estuary
David K. Ralston Woods Hole Oceanographic Institution
Stefan Talke Portland State University, [email protected]
W. Rockwell Geyer Woods Hole Oceanographic Institution
Hussein A. M. Al-Zubaidi Portland State University, [email protected]
Christopher K. Sommerfield University of Delaware
Follow this and additional works at: https://pdxscholar.library.pdx.edu/cengin_fac
Part of the Environmental Engineering Commons, and the Hydrology Commons
Let us know how access to this document benefits you.
Citation Details Citation Details Ralston, D. K., Talke, S., Geyer, W. R., Al‐Zubaidi, H. A., & Sommerfield, C. K. (2019). Bigger Tides, Less Flooding: Effects of Dredging on Barotropic Dynamics in a Highly Modified Estuary. Journal of Geophysical Research: Oceans, 124(1), 196-211.
This Article is brought to you for free and open access. It has been accepted for inclusion in Civil and Environmental Engineering Faculty Publications and Presentations by an authorized administrator of PDXScholar. Please contact us if we can make this document more accessible: [email protected].

Bigger Tides, Less Flooding: Effects of Dredging on BarotropicDynamics in a Highly Modified EstuaryDavid K. Ralston1 , Stefan Talke2 , W. Rockwell Geyer1 , Hussein A. M. Al-Zubaidi2 ,and Christopher K. Sommerfield3
1Woods Hole Oceanographic Institution, Woods Hole, MA, USA, 2Portland State University, Portland, OR, USA, 3University ofDelaware, Lewes, DE, USA
Abstract Since the late nineteenth century, channel depths have more than doubled in parts of New YorkHarbor and the tidal Hudson River, wetlands have been reclaimed and navigational channels widened, andriver flow has been regulated. To quantify the effects of these modifications, observations and numericalsimulations using historical andmodern bathymetry are used to analyze changes in the barotropic dynamics.Model results and water level records for Albany (1868 to present) and New York Harbor (1844 to present)recovered from archives show that the tidal amplitude has more than doubled near the head of tides,whereas increases in the lower estuary have been slight (<10%). Channel deepening has reduced theeffective drag in the upper tidal river, shifting the system from hyposynchronous (tide decaying landward) tohypersynchronous (tide amplifying). Similarly, modeling shows that coastal storm effects propagate fartherlandward, with a 20% increase in amplitude for a major event. In contrast, the decrease in friction withchannel deepening has lowered the tidally averaged water level during discharge events, more thancompensating for increased surge amplitude. Combined with river regulation that reduced peak discharges,the overall risk of extreme water levels in the upper tidal river decreased after channel construction,reducing the water level for the 10-year recurrence interval event by almost 3 m. Mean water level decreasedsharply with channel modifications around 1930, and subsequent decadal variability has depended both onriver discharge and sea level rise. Channel construction has only slightly altered tidal and storm surgeamplitudes in the lower estuary.
Plain Language Summary Dredging for navigation has deepened harbors and estuaries aroundthe world, altering circulation patterns and tidal water levels. In the Hudson River estuary, channelconstruction for ports in New York Harbor and Albany more than doubled channel depths in some regions.Major dredging began in the late 1800s, so to characterize associated changes in the hydrodynamicconditions, we analyzed archival water level records and navigational charts back to that period. Water levelrecords from Albany show that channel construction reduced the effects of friction such that the tide nowamplifies in the upper estuary, more than doubling the tidal amplitude compared with before dredging.The lower friction also allows storm surge from the coast to travel farther landward. However, major floodingin the upper tidal river historically was mainly due to river discharge events, and the deeper channelallows for more effective conveyance of flood waves. Thus, despite the increases in tides and storm surge, therisk of flooding in the upper estuary decreased with construction of the navigational channel. The Hudsonprovides a well-documented example of how multiple anthropogenic factors can significantly influencephysical processes in extensively modified estuaries.
1. Introduction
Estuaries and tidal rivers enable economic development by facilitating efficient maritime transportation andaccess to natural resources. Development of cities around estuaries has greatly modified their physical envir-onment, including filling of intertidal and shallow subtidal waters, hardening of shorelines, and construction ofnavigational channels by dredging. These bathymetric alterations can significantly modify the hydrodynamicsof an estuary, leading to changes in physical characteristics including the tidal amplitude, salinity distribution,stratification, and sediment transport. Altered physical processes can also impact estuarine ecosystems, forexample, by changing residence times and nutrient retention, reducing the vertical exchange of oxygen(Talke et al., 2009), or altering wetland inundation (Jay et al., 2015). In many cases, these ecological impactshave detrimental consequences for the beneficial uses that initially spurred development around the estuary.
RALSTON ET AL. 196
Journal of Geophysical Research: Oceans
RESEARCH ARTICLE10.1029/2018JC014313
Key Points:• Archival records over the past
150 years show that the tidalamplitude has more than doubled inthe upper Hudson River estuary
• Channel deepening for navigationreduced the effective friction,thereby amplifying the tide andstorm surge along the estuary
• Channel deepening also increasedconveyance of river discharge in thetidal river, such that the overall risk offlooding decreased
Correspondence to:D. K. Ralston,[email protected]
Citation:Ralston, D. K., Talke, S., Geyer, W. R.,Al-Zubaidi, H. A. M., & Sommerfield, C. K.(2019). Bigger tides, less flooding:Effects of dredging on barotropicdynamics in a highly modified estuary.Journal of Geophysical Research: Oceans,124, 196–211. https://doi.org/10.1029/2018JC014313
Received 26 JUN 2018Accepted 9 DEC 2018Accepted article online 11 DEC 2018Published online 9 JAN 2019
©2018. American Geophysical Union.All Rights Reserved.

Isolating the effects of dredging on estuarine processes is challenging because individual deepening pro-jects increase the depth by a small percentage and the morphological and ecological response timescales can be years to decades. Evaluation of estuarine conditions at the century time scale is oftenrequired to quantify significant changes due to bathymetric modification, but a paucity of quantitativedata over this period is limiting in many systems (Talke & Jay, 2013). In the U.S., large-scale modificationsof navigational channels began in the late nineteenth century (Familkhalili & Talke, 2016; Marmer, 1935)and has continued incrementally to the present (e.g., Chant et al., 2018). Many ports have planned orcompleted deepening projects to accommodate the larger container ships designed to pass throughthe expanded Panama Canal, including deepening projects to 50 ft (15 m) for the ports of New Yorkand New Jersey, Baltimore, Norfolk, Charleston, and Miami, and to 45 ft (14 m) for numerous other U.S. ports.In many locations including New York Harbor, the controlling depth in the navigational channel has morethan doubled since the late nineteenth century (Familkhalili & Talke, 2016).
Depth increases and maintenance dredging represent major perturbation to estuarine hydrodynamics,where shear stress at the bed is the major source of friction and is the source of turbulence and asso-ciated vertical mixing. Increases in water depth reduce the effects of bottom friction and reduce turbu-lent mixing of salinity or temperature stratification, potentially leading to changes in tidal processes,response to storm surge, the length of the salinity intrusion, and exchange with the coastal ocean. Fortidal dynamics, a reduction in the effective drag due to deepening often corresponds with an increasein tidal amplitude and a change in phase with increased wave speed. Increases in tidal amplitude asso-ciated with dredging have been observed in many estuaries, including in the Thames (Amin, 1983),Rhine-Meuse (Vellinga et al., 2014), Elbe, Ems, and Loire (Winterwerp et al., 2013), Delaware (DiLorenzoet al., 1993), Columbia (Jay et al., 2011), Cape Fear River (Familkhalili & Talke, 2016), and Modaomen(Cai et al., 2012). Similarly, increased water levels during extreme events due to storm surge(Familkhalili & Talke, 2016) or river discharge (Vellinga et al., 2014) have been linked to bathymetric mod-ification. The changes in the tide can be large, for example, with a doubling of tidal range in portions ofthe Delaware (DiLorenzo et al., 1993), the Ems (Talke & Jay, 2013), and Cape Fear estuaries (Familkhalili &Talke, 2016). Tidal range in the Garonne River of the Gironde Estuary has doubled due to gravel miningthat increased depth and decreased roughness (Jalón-Rojas et al., 2018). In the Ems (de Jonge et al., 2014;Talke et al., 2009) and Loire (Jalón-Rojas et al., 2016), increases in tidal amplitude corresponded with asignificant increases in suspended sediment concentration and landward shifts in the estuarine turbiditymaxima. At high sediment concentrations fluid mud introduces a feedback that additionally reduces theeffective drag on the flow, amplifies the tides, and leads to greater sediment trapping and a regime shiftto hyperturbid conditions (Winterwerp, 2011). The balance of factors that control such regime shiftsremains hard to predict or reproduce in realistic process-based models (Burchard et al., 2018).
The Hudson River adjacent to New York City provides an example of an estuary that has been signifi-cantly modified by the urbanization of its surrounding region, including infilling and hardening of theshoreline and dredging navigation channels (Chant et al., 2018; Panuzio, 1965). Previous research hasbuilt a solid understanding of the dynamics of the present-day estuary, but to understand how the sys-tem may have been modified by channel construction, we (a) recover, digitize, and analyze archival waterlevel data back to the 1850s; (b) build and evaluate a retrospective numerical model using nineteenthcentury bathymetry; and (c) compare historical simulations with a validated numerical model of the mod-ern estuary. Results from the observational and model analyses are framed with respect to theory for thebarotropic dynamics, including an evaluation of the extent to which channel deepening by dredging inthe Hudson has led to regime shifts in the tidal dynamics or response to extreme events.
2. Background2.1. Hudson River Estuary
The Hudson River is a partially mixed estuary that discharges to New York Bight in the Atlantic Ocean(Figure 1), with New York City (NY, USA) located at its mouth. By convention and for comparison with previousstudies, along-estuary distances in this study are referenced to The Battery at the southern tip of Manhattan,but the estuarine waters extend seaward another 25 km to themouth of New York Harbor. Tides at themouthhave a mean range of about 1.5 m, and the influence of the tides extends 240 km landward of The Battery to
10.1029/2018JC014313Journal of Geophysical Research: Oceans
RALSTON ET AL. 197

the dam at Troy (NY). The Upper Hudson and Mohawk Rivers converge there to supply a mean annualdischarge of about 400 m3/s, and numerous smaller tributaries discharge directly to the tidal Hudson andincrease the flow by 30%–40% (Wall et al., 2008). The salinity intrusion varies with river discharge and thespring-neap cycle of tides, typically extending landward from The Battery by 40–120 km (Abood, 1974;Bowen & Geyer, 2003; Ralston et al., 2008). Tidal influence extends landward of the salinity intrusion, aregion Hoitink and Jay (2016) define as the tidal freshwater zone. Under high discharge conditions, theriver input can modify the tide in the upper ~40 km of the Hudson such that the lowest water levels occurduring neap rather than spring tides (Ralston & Geyer, 2018), which is the tidal river definition in Hoitinkand Jay (2016).
The population of metropolitan area of New York City is currently more than 20 million, but humanoccupation of the region has been modifying the Hudson River estuary for centuries. Dutch settlers filledin marsh along lower Manhattan to create landings for commercial vessels, and this narrowing of theEast River caused the adjacent Buttermilk Channel in Upper New York Bay to deepen from a few metersin the early 1700s to more than 12 m in 1807 (Steinberg, 2014). Active dredging to facilitate the growingports in New York and New Jersey began in the late 1800s, when a 30-ft (9-m) channel was cut throughthe ebb-delta at the mouth of Lower New York Bay to allow passage of the newest class of steamships.Shortly thereafter, the Ambrose Channel was authorized (1899) and completed as a 40-ft (12-m) channelby 1914 (Steinberg, 2014). With the growth of the railroads the primary ports shifted from Brooklyn toNewark Bay (NJ), requiring dredging and maintenance of a navigational channel that is now 16-m deepin an embayment that had an average depth of 3 m prior to development (Chant et al., 2018).
In addition to the ports of New York and New Jersey in the lower estuary, a navigational channel with aminimum depth of 32 ft (10 m) is maintained to the Port of Albany, which is about 230 km upstreamfrom New York Harbor and near the limit of tidal influence (Figure 2). Dredging of the upper Hudsonbegan in the late 1860s with a 9–11-ft (3-m) channel, but the navigational channel was significantly
Figure 1. Hudson bathymetry. (a) Model domain, from New York Bight to the tidal limit of the Hudson River, (b) modernbathymetry in New York Harbor and the Lower Hudson Estuary, and (c) predredging (1860s) bathymetry in the sameregion.
10.1029/2018JC014313Journal of Geophysical Research: Oceans
RALSTON ET AL. 198

deepened and widened in the late 1920s (Schureman, 1934). Inaddition to dredging, other major bathymetric alterations haveoccurred due to development along the estuary, including narrow-ing and deepening of the lower Hudson with expansion and hard-ening of the Manhattan shoreline (Klingbeil & Sommerfield, 2005)and infilling with dredge spoils of large areas of shallow subtidalin Upper New York Bay and the deep hole near the GeorgeWashington Bridge (18 km landward from The Battery;Panuzio, 1965).
The barotropic dynamics of the Hudson depend both on changingbathymetry in the estuary and on changes in the forcing from off-shore. Near the mouth (Sandy Hook, NJ), the tidal range increasedat a rate of 76 mm/century from 1932 to 2003, with similar trends atnearby stations (Flick et al., 2003). On the other hand, archival recordsshow that the M2 tide decreased at Sandy Hook and The Batterybetween the 1870s and 1930 (Talke et al., 2014). Storm surge eventshave increased in amplitude over the observational record in NewYork Harbor, with a 0.28-m increase in the level of the once-in-10-yearevent since 1856 on top of the 0.44-m increase in local sea level overthat period (Talke et al., 2014). Notably, the storm surge of 3.4 mabove mean sea level (MSL) due to Hurricane Sandy in 2012 was thelargest since at least 1821 (Orton et al., 2016) and caused significantloss of life and damage to infrastructure in New York City. The causesof these storm surge changes remain uncertain. Here we assess howbathymetric modifications over a similar period may have influencedthe magnitude of the tide, storm surge, and flood hazard alongthe estuary.
2.2. Methods and Data Sources2.2.1. BathymetryHistorical navigational charts for the Hudson River and New York Harbor were obtained from the Officeof Coast Survey (https://historicalcharts.noaa.gov/) at the National Oceanographic and AtmosphericAdministration (NOAA). A comprehensive, predredging bathymetry from the New York Bight to the headof tides in Troy (NY) was constructed from charts published between 1861 and 1870. The charts arebased primarily on a hydrographic survey of the entire river in the summer of 1856 (and some measure-ments in 1858) and an associated leveling survey from 1856 to 1858. The tidal Hudson River is a glaciallyformed, relatively deep river in a narrow valley with limited floodplain. Predredging, the upper ~60 kmof the tidal river likely had a more active floodplain with multiple shallow, braided channels aroundislands (Collins & Miller, 2012). The model does not account for wetting and drying of floodplain andinstead focuses on the effects of changes in channel depth and width. Charts published from the1860s to the present were obtained from the Office of Coast Survey to determine the changes innavigational channel depth through time. Charts for the upper tidal Hudson River (Coxsackie to Troy,currently chart #12348) and for Lower New York Bay (currently chart #12327) were used to determinethe controlling depths for the navigational channel to Albany and for Ambrose Channel at the mouthof New York Harbor.
The modern bathymetry is compiled from multiple sources. In the Hudson and New York Harbor, the pri-mary source was survey data collected between 1998 and 2004 by the Benthic Mapping Project by theNew York State Department of Environmental Conservation. In Lower New York Bay the primary sourceswere digital elevation models from NOAA’s National Center for Environmental Information and theFederal Emergency Management Agency’s Region 2 coastal storm surge model. Bathymetric survey datacollected for the U.S. Army Corps of Engineers after the deepening of the major navigational channels ofNew York Harbor and Newark Bay was completed (2013–2014) were also incorporated into themodern bathymetry.
Figure 2. Along-channel depth and tidal amplitude. (a) Thalweg (solid lines) andaverage (dashed lines) depth from Ambrose Bar to the tidal limit in the HudsonRiver, comparing modern and historical conditions. (b) Mean tidal range along thesame transect with model results (solid lines) and observations (square markers).Modern tidal ranges are from NOAA tidal prediction stations, and historical tidalranges are from notations on historical charts.
10.1029/2018JC014313Journal of Geophysical Research: Oceans
RALSTON ET AL. 199
2.2.2. Observed Water Level and DischargeWater level observations back to the midnineteenth century were compiled from multiple sources to pro-duce tidal records that span the length of the tidal Hudson from the Atlantic Ocean to the head of tides. InNew York Harbor hourly tide records (1860 to present) and high/low tide records (1844 to present) were com-piled (Talke et al., 2014), including tide records from The Battery (NOAA #8518750; 1920–1921, 1927 to pre-sent) and Sandy Hook (NJ) (#8531680, 1910–1918, 1932 to present) and recently digitized tide records fromthe U.S. National Archives including Governors Island (1844–1879; 1885; located 2 km from The Battery), FortHamilton (1893–1930, located 15 km seaward of The Battery), and Sandy Hook (1855–1857 and 1875–1893).Additional information on historical measurement techniques and data, as well as quality assurance meth-ods, is provided by Talke and Jay (2013, 2017).
Water level records from Albany (NY) near the limit of tidal influence were digitized from multiple sourcesspanning the period from 1868 to present. Pictures of twice daily High/Low Water tabulations for 1868,1875–76, 1894–1899, 1906–1909, and 1914–1939 were made from paper records of the United StatesArmy Corps of Engineers (USACE) at the Federal Records Center in Lee’s Summit, MO, and additionalUSACE records for 1899–1904 and 1914–1940 were found in Coast and Geodetic Survey records at the U.S.National Archives in College Park, MD. A copy of these records was found in the EV2 database at theNational Center for Environmental Information, along with a superseded station summary, tabulations ofextremes, and other documents associated with the Schureman (1934) report. High/Low records from1943 to 1982 were obtained from the regional USACE office in Albany, NY. The High/Low records were digi-tized into spreadsheets along with hourly records for 1903, 1904, 1914, 1922, 1928, 1934, and 1940. Qualityassurance was applied as described by Talke and Jay (2017).
The archival USACE measurements from Albany (1868–1982) were combined with modern digital records toproduce a partial tide record from 1868 to 1913 and a nearly continuous record from 1914 to 2017. Hourlytide records were obtained from NOAA (#8518995) from October 1981 to July 1987, and unpublished digitaltide records were obtained from the U.S. Geological Survey (USGS, #01359139) at 15-min resolution for theperiod October 1983 to March 2002. Officially verified High/Low data were obtained from the USGS for1999–2017, along with additional 15-min resolution data since 2002.
Tide records were reduced to the National Geodetic Vertical Datum of 1929 (NGVD-29), the datum for theUSGS records. For 1914–1950 and 1951–1972, USACE tabulations were referenced to a datum 2 and2.09 ft, respectively, below NGVD-29. Perhaps reflecting a gauge change, the offsets to NGVD-29 between1973–1975 and 1976–1982 were noted as 10 and 0 ft, respectively. Measurements from 1868 to 1914 weretabulated relative to a local datum (anywhere from 75 to 80 ft below the staff zero) but were also referredto the Gristmill benchmark at the ferry dock in Greenbush (NY), across the river from Albany. The Gristmillbenchmark, cut into a stone cellar in 1857 by the U.S. Coast Survey, was described as 13.86 ft above thesea level datum (i.e., NGVD-29) in archival documents dated between 1910 and 1932, allowing the USACEdata from 1868 to 1982 to be converted to NGVD-29 based on the staff zero relative to theGristmill benchmark.
The USACE data in NGVD-29 were combined with modern USGS and NOAA data, using periods of overlapbetween the sources used to ensure datum consistency. The USGS datum was 10 ft below NGVD-29 from1983 to 2002 and 0 ft offset for 2002 to present, and the NOAA datum was 9.91 ft below NGVD from 1981to 1987. Based on comparisons between data sets, we assign an uncertainty of 0.03 m to the datum from1914 to present, noting that (a) it is unclear why a 0.09-ft datum shift (0.027 m) occurred in USACE data inthe 1950s or exactly when it occurred and (b) it is unclear whether NOAA, USGS, and USACEmaintained sepa-rate gauges in the 1980s or reported the same data relative to a slightly different datum. Earlier measure-ments may have somewhat larger datum error, due to lack of documentation and discrepancies in theestimate of the Gristmill benchmark height relative to mean sea level at Sandy Hook from 1876 to 1882.However, our estimates of mean tide level agree well with the Schureman (1934) compilations and are con-sistent with expectations for the effect of dredging (see section 3). Therefore, we conclude that any datumerrors are slight relative to the observed changes in mean tide level over time.
We use the Albany (1868–2017) water level data to obtain a record of the 400 largest recorded events, as wellas a time series of the annual maximum water level. Data are filtered such that the gap between successiveevents is at least 6 days, to avoid double counting individual storm events. Nonetheless, it is likely that many
10.1029/2018JC014313Journal of Geophysical Research: Oceans
RALSTON ET AL. 200
extreme events before 1914 were missed because tide records were only collected during nonwinter (ice-free) periods, typically between March/April and October/November. Fortunately, high water marks weretabulated both in Coast and Geodetic Survey records and in Schureman (1934), enabling a nearly continuousrecord of annual extreme water levels for 1893 to the present. Water levels during extreme freshets back to1839 were also documented in Schureman (1934), allowing comparison between nineteenth century andmodern extremes.
A generalized Pareto Distribution (GPD; Kotz & Nadarajah, 2000) was used to evaluate the flood hazard from1893 to 1929 (i.e., before major dredging in the upper river) and the modern flood hazard since 1960. Such apeak-over threshold analysis allows inclusion of multiple events from a single year. By only analyzing the tailof the extreme value distribution, the GPD analysis also deals with gaps in the record in which it is known thatno large freshets over the chosen threshold occurred (e.g., 1911–1912). Due to a large downward shift inextreme water levels (see section 3), different thresholds were required for different periods. Prior to 1930,only water level data greater than 3.5 m above NGVD-29 were used; after 1960, a smaller threshold of2.5 m was applied. These thresholds were selected to represent the tails of the probability distributionsand yet retain enough data to minimize uncertainty. Parameters in the fit were obtained using a MaximumLikelihood Estimate (MLE) method in MATLAB. Parameter confidence intervals from the MLE were used togenerate parameter distributions that were then randomly sampled in a Monte Carlo approach to generatea suite of recurrence interval curves (n = 104). Confidence intervals shown for the recurrence interval curveswere based on this Monte Carlo sampling.
Along with the detailed water level time series from near the mouth and head of tides, we use tidal rangeestimates based on shorter-term records at multiple locations to evaluate changes along the estuary.Charts from the 1860s included notation on tidal ranges at several locations (Sandy Hook, NJ; Governor’sIsland, Dobb’s Ferry, Tarrytown, Verplank’s Point, West Point, Poughkeepsie, Tivoli, Stuyvesant, Castleton,and Albany, NY), and these were used for comparison with the predredging model results. These tide rangeestimates were confirmed using the original, short-period tide records used for the bathymetry survey of1856–1858 and recovered from the U.S. National Archives. For modern conditions, we use NOAA tidal predic-tions along the estuary for harmonic stations (Sandy Hook, NJ; USCG Station, The Battery, Dyckman Street,Haverstraw Bay, Beacon, Hyde Park, and Albany, NY) and subordinate stations (Alpine, NJ; Peekskill,Poughkeepsie, Kingston, Tivoli, and Castleton, NY).
The largest tributaries discharging into the tidal Hudson are the Upper Hudson and Mohawk Rivers, whichconverge just upstream of the head of tides. USGS gauging records on the Upper Hudson at Waterford(#01335754) are available from 1887 to present and on the Mohawk at Cohoes (#01357500) from 1917 to pre-sent. The Green Island gauge (#01358000) is downstream of the convergence and operated seasonally backto 1946. A combined observational time series of discharge is created from these sources for the period1917–2017. To estimate discharge in the Mohawk for 1887–1917, we use observations from Waterford andmultiply by the slope of the regression (0.78) between the Upper Hudson and Mohawk during the periodof overlapping observations. This is similar to the ratio (0.75) of the long-term average discharges for theUpper Hudson (224 m3/s) and Mohawk (167 m3/s).
In addition to themodifications by dredging, conditions in the Hudson have beenmodified by changes in thefluvial inputs due to dams built for flow regulation. One of the largest flow control structures in the watershedis the Conklingville Dam, which was built on the fluvial Upper Hudson River more than 100 km upstream ofAlbany in response to a discharge event and severe flooding that occurred in March 1913. The dam becameoperational in 1930, approximately the same time that the upper tidal river was significantly deepened. Toassess the effects of flow regulation on the discharge regime, we calculate recurrence intervals based onobservations of annual maximum discharge on the Upper Hudson at Waterford before and after the damcame online. The recurrence intervals are based on a Generalized Extreme Value distribution fit (Kotz &Nadarajah, 2000), similar to the GPD fit used for water level. Confidence intervals are calculated using theparameter fit uncertainty from the MLE and Monte Carlo sampling, as above.2.2.3. Hydrodynamic ModelA numerical model of the Hudson River and surrounding region that has previously been developed andevaluated against observations was adapted to assess effects of changes in bathymetry since the 1800s.The model uses the Regional Ocean Modeling System (Haidvogel et al., 2008; Warner et al., 2010), and the
10.1029/2018JC014313Journal of Geophysical Research: Oceans
RALSTON ET AL. 201
domain extends from New York Bight to the tidal limit of the Hudsonincluding New York Harbor and its principal subembayments (Figure 1).Grid resolution is 100 to 500 m in the along-channel direction and 20–60 m across channel and consists of 16 evenly distributed sigma layersin the vertical. Water level open boundary conditions are applied inWestern Long Island Sound and in New York Bight using nine tidal consti-tuents plus observed low-pass-filtered water levels from NOAA stations atSandy Hook, NJ, and Kings Point, NY. Observed river discharge is inputfrom the Upper Hudson and Mohawk Rivers and 10 smaller tributaries thatflow into the tidal Hudson and the lower bays.
The circulation model is run using the two bathymetric configurations:predredging bathymetry based on the 1860s era charts and modernbathymetry (Figures 1 and 2). The model grid and forcing configurationis the same for both cases, and only the bathymetry is changed.Idealized, constant discharge scenarios were run with simplified tidal for-cing (M2, S2, and N2 components) to represent spring-neap variability fora range of discharge conditions: 150, 300, 600, 2,000, and 5,000 m3/s(Ralston & Geyer, 2018). Constant discharge simulations were run untilreaching periodic equilibrium with the tidal variability, up to 6 monthsfor the low discharge cases. The idealized forcing cases are used here toquantify changes in the tides and river slope over the typical range of dis-charge conditions. Realistic forcing simulations also were run for TropicalStorms Irene and Lee in 2011 (Ralston et al., 2013) and Hurricane Sandyin 2012. Those realistic simulations are used to examine the response ofthe estuary to major discharge events and storm surge.
To evaluate the effects of changing bathymetry, the constant dischargeand realistic forcing cases were run with the predredging bathymetry.Model boundary conditions, bottom roughness, and grid discretizationwere the same as for the modern bathymetry cases, such that intermodelcomparisons reflect only the effect of bathymetric changes. Note that thesimulations were run without wetting and drying, and shallow regionswere set to have a minimum depth of 2 m relative to MSL. The Hudsonhas limited intertidal area, but under high river discharge the inundationof floodplains of the upper tidal river may be underestimated. Bottomroughness height (z0) was set uniformly equal to 5 mm based on previouscalibrations of the modern model (Ralston et al., 2012).
3. Results and Interpretation3.1. Tidal Amplitude
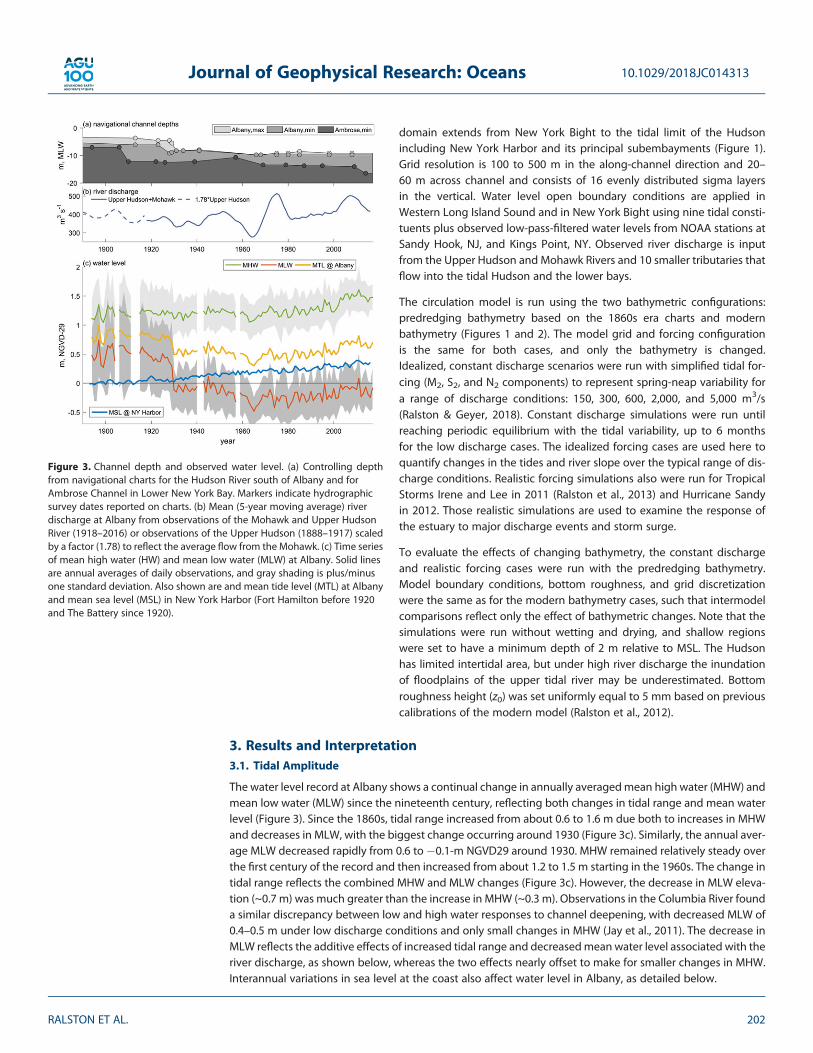
The water level record at Albany shows a continual change in annually averagedmean high water (MHW) andmean low water (MLW) since the nineteenth century, reflecting both changes in tidal range and mean waterlevel (Figure 3). Since the 1860s, tidal range increased from about 0.6 to 1.6 m due both to increases in MHWand decreases in MLW, with the biggest change occurring around 1930 (Figure 3c). Similarly, the annual aver-age MLW decreased rapidly from 0.6 to �0.1-m NGVD29 around 1930. MHW remained relatively steady overthe first century of the record and then increased from about 1.2 to 1.5 m starting in the 1960s. The change intidal range reflects the combined MHW and MLW changes (Figure 3c). However, the decrease in MLW eleva-tion (~0.7 m) was much greater than the increase in MHW (~0.3 m). Observations in the Columbia River founda similar discrepancy between low and high water responses to channel deepening, with decreased MLW of0.4–0.5 m under low discharge conditions and only small changes in MHW (Jay et al., 2011). The decrease inMLW reflects the additive effects of increased tidal range and decreasedmeanwater level associated with theriver discharge, as shown below, whereas the two effects nearly offset to make for smaller changes in MHW.Interannual variations in sea level at the coast also affect water level in Albany, as detailed below.
Figure 3. Channel depth and observed water level. (a) Controlling depthfrom navigational charts for the Hudson River south of Albany and forAmbrose Channel in Lower New York Bay. Markers indicate hydrographicsurvey dates reported on charts. (b) Mean (5-year moving average) riverdischarge at Albany from observations of the Mohawk and Upper HudsonRiver (1918–2016) or observations of the Upper Hudson (1888–1917) scaledby a factor (1.78) to reflect the average flow from the Mohawk. (c) Time seriesof mean high water (HW) and mean low water (MLW) at Albany. Solid linesare annual averages of daily observations, and gray shading is plus/minusone standard deviation. Also shown are and mean tide level (MTL) at Albanyand mean sea level (MSL) in New York Harbor (Fort Hamilton before 1920and The Battery since 1920).
10.1029/2018JC014313Journal of Geophysical Research: Oceans
RALSTON ET AL. 202

The sharp decrease in MLW coincided with the deepening of the navigational channel to Albany in thelate 1920s (Figure 3a). Prior to modification, this region was a shallow, braided river with multiple chan-nels flowing around numerous islands, and dredging converted it to a deeper, single-threaded channel(Collins & Miller, 2012). In bathymetric surveys in 1928 and 1929, thalweg depths in the upper 60 kmof the river ranged from 4.5 to 9.1 m, compared with thalweg depths of 3.7 to 6.1 m in 1913. By 1931the controlling depth along the entire upper 40 km of the river was 8.2 m, as found in a 1941 survey.Additional dredging increased the controlling depth to 9.8 m between 1941 and 1966, which corre-sponded with a further 0.3-m decrease in MLW. The maximum depth was maintained at 9.8 m through2008, although some sections of the channel were slightly shallower (8.5–9.3 m) based on surveys from1975 and after. Collectively, the bathymetric modifications in the upper river have increased the thalwegand average depths by a factor of about 2.5 (Figure 2a), and large areas of shoals and secondary channelshave been filled by dredge spoils. The timing of the changes in the navigational channel are concordantwith the changes in the tides at Albany, where there was a major decrease in MLW at the initial dredgingin the late 1920s (Figure 3c). Another factor potentially affecting the tides in the upper river is construc-tion of the Federal Dam at Troy in 1915, built to improve navigation in the fluvial river upstream. The riverwas shallow and sinuous in this region prior to dam construction, and near the limit of tidal influence. Noobvious change in Albany tide MLW, MHW, or tide range is observed around 1915, suggesting noimmediate effect of dam construction at that location (Figure 3c). However, deepening in the late1920s may have allowed wave reflection and contributed to the increase in tide range, similar to reflec-tion off a weir and increased tidal amplitude in the Ems River Estuary (Talke & Jay, 2013).
Both MLW and MHW have increased steadily since about 1965 and in part due to sea level rise at thecoast. The rate of increase of mean water level at Albany over this period was 5.4 ± 1.4 mm/yr, about50% greater than the rate of sea level rise at The Battery of 3.3 ± 0.7 mm/yr over the same period(Figure 3c). However, the rate of change of mean water level at Albany varies more at decadal time scalesthan at The Battery. Over the period since 1945, the average rate of increase at Albany was 2.7 ± 1.1 mm/yr, compared with 3.0 ± 0.4 mm/yr at The Battery over the same period. As examined in greater detail inthe next section, both mean and tidal water level in the upper tidal river depend not only on the forcingfrom the seaward boundary but also the river discharge, which varies at decadal time scales (Figure 3b).The 1960s were a period of drought in the Hudson watershed and corresponded with decreased meanwater levels, whereas recent decades have been comparatively wet and resulted in higher average waterlevels. Long-term variations in tidal and mean water level at Albany therefore reflect both climatic forcingfactors, like sea level rise and precipitation trends, and anthropogenic modifications like channel construc-tion and discharge regulation.
We assess the spatial pattern of changing tides using the sparse historical measurements between TheBattery and Albany and the numerical simulations (Figure 2b). Historical measurements suggest that tidalrange decreased from about 1.4 m near the mouth to 0.8 m at 80 km (West Point), increased to about1.2 m from 150 km (Tivoli) to 200 km (Stuyvesant), and decreased thereafter to 0.7 m at 230 km(Albany). Model results with predredging bathymetry demonstrate similar along-estuary variability in tidalamplitude, with a local minimum around 100 km, an amplification to about 200 km, and a sharp decreaselandward to the head of tides. In contrast, mean tidal ranges according to both modern NOAA harmonicsand the model with modern bathymetry continue to increase in the upper 40 km, reaching an amplitudegreater than at the mouth (Figure 2b). The greatest differences between the predredging and modernbathymetry model results are in the upper tidal river, and the modeled increase in the tidal range atAlbany from 0.7 to 1.6 m is consistent with the water level time series (Figure 3c). The modeled tidalamplitude in the Harbor and lower estuary is slightly greater with the modern bathymetry than predred-ging, but the increase is less than 10%.
In the upper 40 km of the Hudson, average channel depth has increased by a factor of 2.5 since 1860,while the modeled tidal range increased by a factor of 2.2 (Figure 2b). While dredging has increasedthe depth of the main channel, dredge spoil disposal greatly reduced the extent of secondary channelsand shoals (Collins & Miller, 2012). According to theory, both deepening and the narrowing wouldincrease tidal amplitude in a frictional estuary (Friedrichs, 2010; Friedrichs & Aubrey, 1994; Jay, 1991). Ina convergent estuary, frictional damping tends to reduce the tidal amplitude, while width convergence
10.1029/2018JC014313Journal of Geophysical Research: Oceans
RALSTON ET AL. 203

has the opposite effect. To evaluate the relative strengths of these com-peting effects, the exponential convergence length scale (Lw) can becompared with the frictional length scale (c/r), where c = ω/k is the tidalwave speed, equal to the tidal frequency ω divided by the wave num-ber k, and r is a linearized friction factor. Considering only the dominantM2 constituent, the linearized friction factor incorporates the tidal velo-city amplitude U and the tidally averaged depth H as follows:
r ¼ 83π
CdUH
(1)
where Cd is the drag coefficient (Friedrichs & Aubrey, 1994). If Lw is muchless than c/r, then the tide is amplified due to tidal energy flux conver-gence, whereas if c/r is much less than Lw, then the tide decays exponen-tially due to friction. Convergence in depth can also amplify the tide, butdredging has reduced the depth convergence (or increased the depthconvergence length scale) in the upper tidal Hudson, which would havethe opposite effect on the tides than was observed.
We calculate the convergence length scale as Lw = W/(∂W/∂x), where W isthe channel width and x is the along-river distance. The friction factor iscalculated assuming Cd = 3 × 10�3, U = 0.7 m/s, and the thalweg depth
for H. The shallow water wave speed isffiffiffiffiffiffi
gHp
. Note that the shallow waterspeed is slightly modified by friction, which we ignore to first order (Jay,1991). Comparing the predredging and modern bathymetries, changesin channel width increased Lw only slightly. Averaged over the upper tidalriver (>180 km), Lw was 58 km for the predredging bathymetry and 61 km
for the modern bathymetry. In contrast, the increase in average channel depth in this region more thandoubled the average c/r, from 28 to 71 km. Greater intertidal area in the predredging conditions would sug-gest an even lower value for c/r.
Prior to dredging c/r < Lw, which is consistent with the observed frictional damping of the tide in this regionand is termed hyposynchronous (Nichols & Biggs, 1985). In the modern estuary, the opposite condition holdsand Lw< c/r. Hence, convergence amplifies the tide and the estuary is termed hypersynchronous. In additionto the depth change, dredging tends to reduce the effective roughness of the channel by removing sandwaves and reducing channel sinuosity (Jay et al., 2011). Hardening of the banks and loss of wetland covermight also reduce the effective friction. These changes in channel roughness would reduce the effectiveCd and also lead to increased tidal amplitude. Note that themodel did not incorporate any changes in bottomroughness or intertidal area that might be associated with dredging, so the simulations reflect primarily thedecrease in effective drag due to increased depth.
In contrast to the secular changes in tides in the upper estuary, the effects of dredging on tides in the lowerestuary have been small. The modeled tidal range at The Battery increased by 0.1 m (7%) between predred-ging and modern conditions, and the M2 amplitude increased by 0.04 m (7%), similar to the 0.03 m (5%)increase in the measured M2 since the 1920s (Talke et al., 2014). Hence, the channel deepening in NewYork Harbor accounted for roughly 5% of the observed increase in tidal range in Albany. Prior to major dred-ging operations, tidal amplitude in the lower estuary actually decreased slightly, as measurements at bothSandy Hook and Governors Island indicate that M2 decreased by 0.02 to 0.03 m between 1860 and 1920(Talke et al., 2014). Since deepening in the estuary slightly increased tidal amplitudes, the model results sug-gest that the late nineteenth century decrease was caused by altered oceanic tidal conditions.
3.2. Water Level Dependence on River Discharge
Seasonal changes in the hydrograph in the upper Hudson River over the past century have been consistentwith a shift toward a more rain-fed-, rather than snowmelt, driven system (Hayhoe et al., 2007; Figure 4a). Theaverage flow from October to February has increased by 34%, from 311 to 418 m3/s, while the magnitude ofthe snowmelt-driven spring freshet from mid-March to mid-May has decreased by 17%. On an annualized
Figure 4. Observed river discharge and water level at Albany. (a) Annual var-iation in river discharge at Albany (Mohawk River + Upper Hudson River),with daily averages for the periods before 1930 and after 1980. Gray shadingis plus/minus one standard deviation. (b) Annual variation in mean tidelrange at Albany. (c) Annual variation in mean high water. (d) Annual variationin mean low water.
10.1029/2018JC014313Journal of Geophysical Research: Oceans
RALSTON ET AL. 204

basis the changes are smaller, with the mean discharge for the recent per-iod (417 m3/s) about 9% greater than the earlier period (384 m3/s). A com-parison of the Upper Hudson alone for the two periods yields a similarincrease of 12%, from 214 to 240 m3/s.
Seasonally, the variations in MLW, MHW, and tidal range correspond withthe variations in discharge (Figure 4). Generally, the tidal range decreaseswith increased river discharge due to increased frictional damping of thetide wave (Godin, 1991, 1999; Kukulka & Jay, 2003). At Albany before1930, the average tidal range during the spring freshet was 0.4 m com-pared with about 0.9 m during summer low flow conditions (Figure 4b).In contrast, the mean water level (not shown) increased seasonally withdischarge. The increase in MWL and reduction in tidal amplitude with dis-charge determines the seasonal cycle of MLW andMHW. During high flow,MLW increased due both to the increase in river discharge and thereduced tidal range (Figures 4c and 4d). By contrast, reduced tide rangeduring high river flow tends to lower HW, counteracting to some extentthe effect of increased MWL with the river discharge. Prior to 1930, bothMLW and MHW increased on average by about 1 m during the spring fre-shet compared with the rest of the year. The seasonal correspondence ofwater level and discharge was much weaker for the period after 1980, withMHW varying seasonally by only ~0.4 m and MLW by less than 0.2 m.During the summer low discharge period, the average MHW in the mod-ern estuary has increased by ~0.2 m and average MLW has decreased by0.6m compared to the predredging period. In addition to the seasonal var-iation in river discharge, damping of the tide by ice coverage (Georgas,2011) also contributes to the annual variability. For example, in the mod-ern estuary the annual minimum in tide range occurs prior to the maxi-mum discharge during the spring freshet and instead during the wintermonths when ice coverage is a factor.
MWL, MHW, MLW, or any other tidal datum (TD) at Albany can be represented as a function of oceanic for-cing, river flow, and frictional effects due to the tide:
TDAlbany ¼ a0 þ a1�MSLBattery tð Þ︸
|fflfflfflfflfflfflfflfflfflfflfflffl{zfflfflfflfflfflfflfflfflfflfflfflffl}
SeaLeveleffect
þ a2Qbr ︸
|fflffl{zfflffl}
RiverFlowEffect
þ a3TRBATTERY2
Qnr ︸
|fflfflfflfflfflfflfflfflffl{zfflfflfflfflfflfflfflfflffl}
TideContribution
(2)
where a1, a2, a3, b, and n are empirically derived coefficients and a0 is an offset to a geodetic datum (Jay et al.,2011; Kukulka & Jay, 2003). When river flow is large, it dominates and the effect of the tides is small or neg-ligible. The relationship with discharge is often assumed to be linear, or b = 1, as is in the Columbia River(Kukulka & Jay, 2003). The similar long-term rates of MTL between The Battery and Albany increase suggeststhat a1 is also close to 1 here. In the limit of low river flow, tidal forcing becomes increasingly important insetting the mean water level thru frictional effects and in setting MHW and MLW with an increasing tidalrange.
Plotting MLW as a function Qr, a distinct change in the relationship between water level at Albany and riverdischarge occurred around the time of dredging of the upper river in the late 1920s (Figure 5). For both thepredredging and modern conditions the assumption is reasonable that the rating curve for MLW is approxi-mately linear with discharge, or b = 1 in equation (2), but the two periods have distinctly different slopes.Before 1930, each additional 1,000 m3/s of river flow increased MLW by 1.6 m, while in the modern estuarythe corresponding increase in MLW was 0.9 m. At low discharge, MLW varied more with the tidal amplitude,but at higher discharges the tides were damped in the upper river and the dependence of water level on dis-charge was more direct. The change in water level with discharge reflects the fundamental result that theriver slope for any given discharge has decreased over time, as explained below.
Figure 5. Observed daily mean low water (MLW) at Albany versus river dis-charge (Qr). Data are colored according to date shown in colorbar.Reference lines differ by a factor of 1.7, the ratio of the average depths in themodern and historical bathymetry landward of 180 km (6.3 and 3.7 m,respectively).
10.1029/2018JC014313Journal of Geophysical Research: Oceans
RALSTON ET AL. 205

The water level data indicate a weaker response of water level to dischargein the modern estuary (Figure 5), with changes in seasonal discharge pat-terns (Figure 4) and sea level rise as secondary factors (Figure 3). The tidallyaveraged momentum equation for the river can be reduced to a balancebetween pressure gradient and friction (Buschman et al., 2009; Hoitink &Jay, 2016), or
g∂η∂x
¼ CdU2
H(3)
where ∂η/∂x is the water surface slope, Cd is a drag coefficient, U is the rivervelocity, and H is the water depth. In this balance, an increase in channeldepth decreases the mean water surface slope for a given river discharge,lowering the water level at the landward end. Thus, the reduction in fric-tion by dredging modifies the relationship between river flow and waterlevel (equation (2)), as well as increasing tidal range (equation (1)). Tidalcurrents and the mean river flow effectively increase the drag due to thequadratic dependence and introduce asymmetries between MLW andMHW (Godin, 1999; Kukulka & Jay, 2003). Increased tidal range and velocitymay enhance this frictional interaction, increasing the effective drag andpartially offsetting the effect of increased depth. In the Hudson River, asalso shown in the Columbia River (Jay et al., 2011) and in the Ems River(Jensen et al., 2003), the reduction in friction due to depth increases out-weighed any increase in Cd. In the MLW observations from Albany, the
change in slope was consistent with an inverse dependence on water depth in equation (3), although wenote that changes in U may also contribute. The average depths in the upper 60 km increased from 3.7 to6.3 m, similar to the ratio of the slopes of the linear relationships before and after dredging. For a dischargeof 500 m3/s this corresponded with a reduction in water level of 0.8 m, whereas for high discharge event of2,500 m3/s the difference in water level was 2.1 m. Similarly, analysis of water levels in the upper Columbiafound that since 1902 mean water level dropped by 0.3–1.5 m, depending on discharge (Jay et al., 2011).
The response of the tide and mean water level to changes in depth with dredging varied with distance alongthe estuary. From the model, tidal amplitude on average increased moderately (20%–25%) over much of thelower estuary but was most pronounced in the upper 40 km of the tidal river, where tides more than doubled(Figure 6). At low discharge, MHW increased along the estuary because the tidal amplification effect wasgreater than the reduction in mean river slope. At high discharge, the reverse was true, as MHW decreasedcompared to the predredging case due to the increased hydraulic efficiency and decreased slope for themean flow. The effects were additive for mean low water, such that water level decreased everywhere forlow discharge, but the decreases were greatest in the upper tidal river during high dischargeconditions (Figure 6).
3.3. Extreme Events
As with tides, channel deepening may reduce the damping of a surge wave produced at the ocean boundary(Familkhalili & Talke, 2016). Storm surge in the estuary also depends on its magnitude at the ocean boundary,and analysis of water level at The Battery from 1844 to 2013 suggests that storm surge amplitudes in NewYork Harbor are increasing faster than sea level rise (Talke et al., 2014). To assess directly how bathymetricchanges have affected water level during extreme events, themodel was run with bothmodern and predred-ging bathymetries for recent major storms: Hurricane Sandy in 2012 and Tropical Storms Irene and Lee in2011 (Figure 7).
During Hurricane Sandy, the maximum water level at The Battery was about 3.4 m above MSL, 2.8 m greaterthan the predicted high tide and the largest storm surge tide (defined as total water level minus annual meanwater level) since at least 1700 (Orton et al., 2016). The simulation with modern bathymetry produced a max-imum water level during Sandy that was 0.5 m less than observed (Figure 7c), an underprediction similar toother simulations of the event (Orton et al., 2016). The underpredictionmay be due to errors in the water levelat the open boundary or the wind field or in the parameterization of the surface friction coefficient. The same
Figure 6. Modeled changes in the tide with distance along the estuary andas a function of discharge. (a) Relative change in mean tidal rangebetween predredging and modern bathymetry, as a fraction of predredgingrange, (b) absolute difference in mean high water (MHW), and (c) absolutedifference in mean low water (MLW).
10.1029/2018JC014313Journal of Geophysical Research: Oceans
RALSTON ET AL. 206

forcing was used for both bathymetric configurations, and the results show that differences in water levelswere small at The Battery between the modern and predredging bathymetry for the Hurricane Sandycases. With the predredging bathymetry, the water level was a few centimeters lower at The Battery andthe arrival was about 0.5 hr later than with the modern bathymetry. The change in storm surge wasmodest despite the large changes in channel depth near the mouth and is consistent with the observationthat the change in tidal amplitude was also small. Analysis of water level records in back-barrier bays alsoshowed that the storm surge response before and after Hurricane Sandy was unchanged despite largechanges in inlet morphology (Aretxabaleta et al., 2014). The low-frequency variability and shortpropagation distance between the ocean and The Battery allows for little frictional transformation of thecoastal setup. Moreover, Sandy was a relatively slow moving storm, such that the effects of altered depthon frictional damping were less pronounced than in a fast-moving storm (see Orton et al., 2015).
Model results showed a large change in the total water levels in the upper river for the storm surge of Sandy.The total water level (combining tides, meteorologically forced surge, and river flow) in the modern case was0.4 m higher and 1.5 hr earlier than with the predredging bathymetry (Figure 7b). The 0.4-m increase in themaximum water level was a combination of competing effects—mean water level before the storm waslower with the modern bathymetry due to the reduction in river slope, but the predicted high tide wasgreater. Sandy brought little precipitation, so river discharge had a negligible effect on water level(Figure 7a). The differences between the model cases therefore reflect the reduction in friction, whichallowed the surge wave to propagate up the tidal river with less dissipation than in thepredredging bathymetry.
In contrast to Sandy, Tropical Storms Irene and Lee in 2011 produced extremely high river discharge butsmaller storm surge. The combined discharge of the Upper Hudson and Mohawk was nearly 5,000 m3/s
Figure 7. Discharge from the Upper Hudson and Mohawk Rivers (a, d) and water level at Albany (b, e) and The Battery (c, f)during and after major storm events, from observations and model results using predredging and modern bathymetries.(a–c) Hurricane Sandy in 2012 had a record coastal storm surge, while (d–f) Tropical Storms Irene and Lee in 2011 broughthigh river discharge.
10.1029/2018JC014313Journal of Geophysical Research: Oceans
RALSTON ET AL. 207

due to Irene, the second largest since 1918, and Lee followed 2 weekslater with over 3,000 m3/s (Figure 7d). As in the Sandy simulations, theeffect of changing bathymetry on total water level (storm surge andtides) at The Battery due to Irene was negligible (Figure 7e).However, the effect of these storms on water levels in Albany wasopposite that of Sandy, as water levels for Irene and Lee were 0.7and 1.2 m larger with the historical grid than the modern (Figure 7f).During the peak of the Irene and Lee flood waves, the tidal rangeand coastal surge wave nearly disappeared, and water levels were pri-marily forced by river discharge. The increased hydraulic efficiency inthe modern system was able to transport flood waters more effec-tively than the historic system, reducing extreme water levels. AtThe Battery, the discharge flood waves were more diffuse and the dif-ferences in water elevation were much smaller, with the tidally filteredwater level in the predredging case about 10 cm higher than themodern case.
The model results therefore indicate that channel deepening has onlymarginally changed the total water level caused by storm surge andtides in New York Harbor but has significantly altered the responseto storm events in the upper tidal river. When discharge is low, thereduction in effective drag with a deeper channel allows greater pro-pagation of storm surge to Albany from the coast. However, the waterlevel associated with a major storm surge event like Sandy remains farbelow the water level observed during both historical and modernriver discharge events (Figure 8). When discharge is high, the tide
and surge from the ocean are damped and the water level in the upper tidal river is primarily driven bythe river slope. The more efficient conveyance of river flow after channel deepening has reduced the riverslope, reducing water levels during discharge events.
The combined impact of channel deepening and flow regulation on flood hazard in Albany is quantified bycalculating recurrence intervals for predredging (1888–1929) and modern (1977–2017) water level data(Figure 8). In both the time series of annual maximum and in the statistical model of exceedance probability,anthropogenic modification of the system has been concordant with a major reduction in the occurrence ofhigh water events. The magnitudes of the 10 and 100-year recurrence interval events are now 2.6 and 2.0 mless, respectively, than historically. Moreover, the slope of the exceedance curve has been reduced, such thatthe difference between historical and modern water levels increases for smaller probability (longer returnperiod) events. Historically, the 10-year event was more than 2 m above the annual event (6.2 m versus3.9 m), compared with about 1-m difference in the modern system (3.6 m versus 2.5 m).
The changes in extreme water level recurrence depend on shifts in the river discharge patterns and theincrease in channel depth. Several of the highest water level events historically were caused by ice dams dur-ing the spring melt (Schureman, 1934), but spring freshet flows have been reduced in recent decades com-pared to pre-1930 by flow regulation, climate change, and shifts in precipitation patterns (Figure 4). Before1930, only two of the top 50 measured water levels (Schureman, 1934; our data) were due to hurricanes,whereas Irene, Lee, and Sandy brought three major tropical storm events in the past decade. This qualitativeobservation is consistent with an increase in the risk of compound flooding caused by combined storm surgeand precipitation in the Eastern United States over the last century (Wahl et al., 2015). Hence, the increasedrelative importance of coastal storm events stems from a combination of the altered hydrograph, reducedriver slope, and reduced damping of tides and storm surge.
The flooding event of record at Albany occurred in March 1913 due to excessive rainfall, snowmelt, and satu-rated or frozen ground, resulting in peak discharges in the Mohawk and Upper Hudson that exceeded the100 year return period flood (Lumia & Murray, 1993). Extensive damage caused by the flooding spurred con-struction of the Conklingville Dam on the Upper Hudson, which became operational in 1930. To isolate thecontributions of altered discharge and channel deepening on flooding, we calculate discharge recurrence
Figure 8. Observed flood frequency at Albany. (a) Annual maximum water level.(b) Water level return period based on a generalized Pareto distribution analysisof periods prior to dredging (1893–1928) and after (1960–2016). The shadedregion gives the 95% confidence interval, and the diamond markers are unbiasedreturn periods based on rank-ordered data (e.g., Makkonen, 2006). Observedmaximum water levels during storms Irene (2011) and Sandy (2012) are noted forreference with black diamonds.
10.1029/2018JC014313Journal of Geophysical Research: Oceans
RALSTON ET AL. 208

intervals for the Upper Hudson before and after dam construction(Figure 9). A distinct difference in flow magnitudes is observed betweenthe historical and modern periods. For the 10-year event, regulated flowin the Upper Hudson is now about 300 m3/s less than prior to dam con-struction, and for the 100-year event the reduction is about 800 m3/s.The calculated recurrence intervals were similar to previously publishedanalyses of the predam discharge record (Lumia et al., 2006; Figure 9).Using the relationship between discharge and water level observed priorto 1930 of 1.6 m per 1,000 m3/s (Figure 5), the decrease in flow for the10-year event corresponded to a decrease in water level of 0.5 m, andthe 100-year flow event water level decreased by 1.3 m. The totaldecreases in water level for the 10 and 100-year water levels at Albany(2.6 and 2.0 m, Figure 8) were greater than these decreases due to flowregime alone, indicating that the net reduction in flood risk is due bothto flow regulation and channel deepening in the estuary.
4. Summary and Discussion
Our study investigates how channel deepening by dredging has alteredthe barotropic hydrodynamics of the Hudson River estuary over the past150 years. Results show that the water level wasmost affected in the upper40 km of the tidal river, which dredging transformed from a shallow,braided, island-filled river into a single, deeper channel (Collins & Miller,2012). In this region tidal amplitude more than doubled and the landwardconveyance of coastal storm surge increased, increasing the likelihoodthat annual maxima in water level are driven by marine processes.However, the overall risk of flooding has decreased for several reasons.During river discharge events water levels decreased due to the reduction
in effective drag and the greater hydraulic conveyance caused by the deeper navigational channel, reducingthe tidally averaged water surface slope between Albany and the ocean. The reduction in friction also pro-duced an asymmetric response in the tidal water level, with mean low water decreasing more than theincrease in mean high water. This introduces potential hazards for navigation, because increased depthdue to dredging is offset by lower low water levels. The Columbia River had a similar response of decreasinglow waters after dredging and potential impacts on navigation (Jay et al., 2011).
The amplification of tides and decreased mean water levels has ecological implications for estuarine and flu-vial habitat. Mean water level changes in combination with seasonal changes in the hydrograph alter wetlandinundation patterns and influence ecological zonation (Jay et al., 2015). The decrease in extreme water levelsmeans that some elevations that formerly were inundated occasionally are rarely or never under water today.The type of inundation has also changed. Whereas inundation formerly occurred over long periods in earlyspring due to seasonal river flow, inundation today is more likely to be episodic due to the amplified tidesand storm surge from the ocean. While major changes to the barotropic dynamics and flood hazard in theupper Hudson have been driven by channel modifications and altered river flow, our results suggest anincreasing effect of sea level rise onmean water level over the past 50 years more than 250 km from the coast(Figure 3). Recent estimates suggest that sea level in New York Harbor will rise 0.73m (range of 0.28 to 1.32m)by the year 2100 using the business as usual RCP 4.5 scenario (Kopp et al., 2017). Our results suggest that anincrease in mean water level of this magnitude, while still small compared to the historical doubling of depthnear Albany, is large enough to further amplify tides and storm surge magnitudes in the upper Hudson, whilereducing river slope (see also Orton et al., 2018).
ReferencesAbood, K. A. (1974). Circulation in the Hudson Estuary. Annals of the New York Academy of Sciences, 250(1), 39–111. https://doi.org/10.1111/
j.1749-6632.1974.tb43895.xAmin, M. (1983). On perturbations of harmonic constants in the Thames Estuary. Geophysical Journal International, 73(3), 587–603. https://
doi.org/10.1111/j.1365-246X.1983.tb03334.x
Figure 9. Observed discharge event frequency for the Upper Hudson atWaterford. (a) Annual maximum discharge. (b) Discharge return intervalbased on a Generalized Extreme Value distribution analysis of the periodprior to major discharge regulation (1888–1929) and a similar time spanrecently (1977–2017). The diamond markers are unbiased return intervalsbased on rank-ordered data (e.g., Makkonen, 2006). Return intervals calcu-lated by the USGS for the same data prior to discharge regulation but usinglog-Pearson type III and regional regression analyses (Lumia et al., 2006) areshown for reference.
10.1029/2018JC014313Journal of Geophysical Research: Oceans
RALSTON ET AL. 209
AcknowledgmentsFunding for D. K. R., W. R. G., and C. K. S.was provided by NSF Coastal SEESawards OCE-1325136 and OCE-1325102. Funding for S.T. and H. Z. wasprovided by the U.S. Army Corps ofEngineers (award W1927 N-14-2-0015),and NSF (Career Award 1455350). Datasupporting this study are posted toZenodo (https://doi.org/10.5281/zenodo.1298636).

Aretxabaleta, A. L., Butman, B., & Ganju, N. K. (2014). Water level response in back-barrier bays unchanged following Hurricane Sandy.Geophysical Research Letters, 41, 3163–3171. https://doi.org/10.1002/2014GL059957
Bowen, M. M., & Geyer, W. R. (2003). Salt transport and the time-dependent salt balance of a partially stratified estuary. Journal of GeophysicalResearch, 108(C5), 3158. https://doi.org/10.1029/2001JC001231
Burchard, H., Schuttelaars, H. M., & Ralston, D. K. (2018). Sediment trapping in estuaries. Annual Review of Marine Science, 10(1), 371–395.https://doi.org/10.1146/annurev-marine-010816-060535
Buschman, F. A., Hoitink, A. J. F., van der Vegt, M., & Hoekstra, P. (2009). Subtidal water level variation controlled by river flow and tides.WaterResources Research, 45, W10420. https://doi.org/10.1029/2009WR008167
Cai, H., Savenije, H. H. G., Yang, Q., Suying, O., & Yaping, L. (2012). Influence of river discharge and dredging on tidal wave propagation:Modaomen Estuary case. Journal of Hydraulic Engineering, 138(10), 885–896. https://doi.org/10.1061/(ASCE)HY.1943-7900.0000594
Chant, R. J., Sommerfield, C. K., & Talke, S. A. (2018). Impact of channel deepening on tidal and gravitational circulation in a highly engineeredEstuarine Basin. Estuaries and Coasts, 41(6), 1587–1600. https://doi.org/10.1007/s12237-018-0379-6
Collins, M. J., & Miller, D. (2012). Upper Hudson River Estuary (USA) floodplain change over the 20th century. River Research and Applications,28(8), 1246–1253. https://doi.org/10.1002/rra.1509
de Jonge, V. N., Schuttelaars, H. M., van Beusekom, J. E. E., Talke, S. A., & de Swart, H. E. (2014). The influence of channel deepening onestuarine turbidity levels and dynamics, as exemplified by the Ems estuary. Estuarine, Coastal and Shelf Science, 139, 46–59. https://doi.org/10.1016/j.ecss.2013.12.030
DiLorenzo, J. L., Huang, P., Thatcher, M. L., & Najarian, T. O. (1993). Dredging impacts of Delaware estuary tides. In Proc. 3rd Int. Conf. Sponsoredby the Waterway, Port, Coastal and Ocean Division, ASCE (pp. 86–104). Oak Brook, IL.
Familkhalili, R., & Talke, S. A. (2016). The effect of channel deepening on tides and storm surge: A case study of Wilmington, NC. GeophysicalResearch Letters, 43, 9138–9147. https://doi.org/10.1002/2016GL069494
Flick, R. E., Murray, J. F., & Ewing, L. C. (2003). Trends in United States tidal datum statistics and tide range. Journal of Waterway, Port, Coastal,and Ocean Engineering, 129(4), 155–164. https://doi.org/10.1061/(ASCE)0733-950X(2003)129:4(155)
Friedrichs, C. T. (2010). Barotropic tides in channelized estuaries. In Contemporary issues in estuarine physics (pp. 27–61). https://doi.org/10.1017/CBO9780511676567.004
Friedrichs, C. T., & Aubrey, D. G. (1994). Tidal propagation in strongly convergent channels. Journal of Geophysical Research, 99(C2),3321–3336. https://doi.org/10.1029/93JC03219
Georgas, N. (2011). Large seasonal modulation of tides due to ice cover friction in a midlatitude estuary. Journal of Physical Oceanography,42(3), 352–369. https://doi.org/10.1175/JPO-D-11-063.1
Godin, G. (1991). Frictional effects in river tides. In B. Parker (Ed.), Progress in tidal hydrodynamics (pp. 379–402). New York: John Wiley.Godin, G. (1999). The propagation of tides up rivers with special considerations on the Upper Saint Lawrence River. Estuarine, Coastal and
Shelf Science, 48(3), 307–324. https://doi.org/10.1006/ecss.1998.0422Haidvogel, D. B., Arango, H., Budgell, W. P., Cornuelle, B. D., Curchitser, E., di Lorenzo, E., Fennel, K., et al. (2008). Ocean forecasting in terrain-
following coordinates: Formulation and skill assessment of the Regional OceanModeling System. Journal of Computational Physics, 227(7),3595–3624. https://doi.org/10.1016/j.jcp.2007.06.016
Hayhoe, K., Wake, C. P., Huntington, T. G., Luo, L., Schwartz, M. D., Sheffield, J., Wood, E., et al. (2007). Past and future changes in climate andhydrological indicators in the US Northeast. Climate Dynamics, 28(4), 381–407. https://doi.org/10.1007/s00382-006-0187-8
Hoitink, A. J. F., & Jay, D. A. (2016). Tidal river dynamics: Implications for deltas. Reviews of Geophysics, 54, 240–272. https://doi.org/10.1002/2015RG000507
Jalón-Rojas, I., Schmidt, S., Sottolichio, A., & Bertier, C. (2016). Tracking the turbidity maximum zone in the Loire Estuary (France) based on along-term, high-resolution and high-frequency monitoring network. Continental Shelf Research, 117, 1–11. https://doi.org/10.1016/j.csr.2016.01.017
Jalón-Rojas, I., Sottolichio, A., Hanquiez, V., Fort, A., & Schmidt, S. (2018). To what extent multidecadal changes in morphology and fluvialdischarge impact tide in a convergent (turbid) tidal river. Journal of Geophysical Research: Oceans, 123, 3241–3258. https://doi.org/10.1002/2017JC013466
Jay, D. A. (1991). Green’s law revisited: Tidal long-wave propagation in channels with strong topography. Journal of Geophysical Research,96(C11), 20,585–20,598. https://doi.org/10.1029/91JC01633
Jay, D. A., Leffler, K., & Degens, S. (2011). Long-term evolution of Columbia River tides. Journal of Waterway, Port, Coastal, and OceanEngineering, 137(4), 182–191. https://doi.org/10.1061/(ASCE)WW.1943-5460.0000082
Jay, D. A., Leffler, K., Diefenderfer, H. L., & Borde, A. B. (2015). Tidal-fluvial and estuarine processes in the lower Columbia River: I. Along-channel water level variations, Pacific Ocean to Bonneville Dam. Estuaries and Coasts, 38(2), 415–433. https://doi.org/10.1007/s12237-014-9819-0
Jensen, J., Mudersbach, C., & Blasi, C. (2003). Hydrological changes in tidal estuaries due to natural and anthropogenic effects. In 6thInternational MEDCOAST 2003 Conference. Ravenna, Italy.
Klingbeil, A. D., & Sommerfield, C. K. (2005). Latest Holocene evolution and human disturbance of a channel segment in the Hudson RiverEstuary. Marine Geology, 218(1–4), 135–153. https://doi.org/10.1016/j.margeo.2005.02.026
Kopp, R. E., DeConto, R. M., Bader, D. A., Hay, C. C., Horton, R. M., Kulp, S., Oppenheimer, M., et al. (2017). Evolving understanding of Antarcticice-sheet physics and ambiguity in probabilistic sea-level projections. Earth’s Future, 5(12), 1217–1233. https://doi.org/10.1002/2017EF000663
Kotz, S., & Nadarajah, S. (2000). Extreme value distributions: Theory and applications. London: Imperial College Press, World Scientific.https://doi.org/10.1142/p191
Kukulka, T., & Jay, D. A. (2003). Impacts of Columbia River discharge on salmonid habitat: 1. A nonstationary fluvial tide model. Journal ofGeophysical Research, 108(C9), 3293. https://doi.org/10.1029/2002JC001382
Lumia, R., Freehafer, D. A., & Smith, M. J. (2006). Magnitude and frequency of floods in New York. U.S. Geological Survey.Lumia, R., & Murray, P. M. (1993). Maximum known stages and discharges of New York streams, 1865-1989, with descriptions of five selected
floods, 1913-85 (Water-Resources Investigation Report No. 92–4042) (p. 123). Albany, New York: U.S. Geological Survey.Makkonen, L. (2006). Plotting positions in extreme value analysis. Journal of Applied Meteorology and Climatology, 45(2), 334–340. https://doi.
org/10.1175/JAM2349.1Marmer, H. A. (1935). Tides and currents in New York Harbor (Vol. 4). Washington, DC: U.S. Government Printing Office.Nichols, M. M., & Biggs, R. B. (1985). Estuaries. In R. A. Davis (Ed.), Coastal Sedimentary Environments (pp. 77–186). New York: Springer.Orton, P. M., Conticello, F. R., Cioffi, F., Hall, T. M., Georgas, N., Lall, U., Blumberg, A. F., et al. (2018). Flood hazard assessment from storm tides,
rain and sea level rise for a tidal river estuary. Natural Hazards. https://doi.org/10.1007/s11069-018-3251-x
10.1029/2018JC014313Journal of Geophysical Research: Oceans
RALSTON ET AL. 210
Orton, P. M., Hall, T. M., Talke, S. A., Blumberg, A. F., Georgas, N., & Vinogradov, S. (2016). A validated tropical-extratropical flood hazardassessment for New York Harbor. Journal of Geophysical Research: Oceans, 121, 8904–8929. https://doi.org/10.1002/2016JC011679
Orton, P. M., Talke, S. A., Jay, D. A., Yin, L., Blumberg, A. F., Georgas, N., et al. (2015). Channel shallowing as mitigation of coastal flooding.Journal of Marine Science and Engineering, 3(3), 654–673.
Panuzio, F. L. (1965). Lower Hudson River siltation. In Proceedings of the 2nd Federal Interagency Sedimentation Conference (pp. 512–550).Jackson, MS: Agricultural Research Service.
Ralston, D. K., & Geyer, W. R. (2018). Sediment transport time scales and trapping efficiency in a tidal river. Journal of Geophysical Research:Earth Surface, 122, 2042–2063. https://doi.org/10.1002/2017JF004337
Ralston, D. K., Geyer, W. R., & Lerczak, J. A. (2008). Subtidal salinity and velocity in the Hudson River Estuary: Observations and modeling.Journal of Physical Oceanography, 38(4), 753–770. https://doi.org/10.1175/2007JPO3808.1
Ralston, D. K., Geyer, W. R., & Warner, J. C. (2012). Bathymetric controls on sediment transport in the Hudson River estuary: Lateral asymmetryand frontal trapping. Journal of Geophysical Research, 117, C10013. https://doi.org/10.1029/2012JC008124
Ralston, D. K., Warner, J. C., Geyer, W. R., & Wall, G. R. (2013). Sediment transport due to extreme events: The Hudson River estuary aftertropical storms Irene and Lee. Geophysical Research Letters, 40, 5451–5455. https://doi.org/10.1002/2013GL057906
Schureman, P. (1934). Tides and currents in Hudson River (Vol. 180). Washington, DC: United States Government Printing Office.Steinberg, T. (2014). Gotham unbound: The ecological history of greater. New York: Simon and Schuster.Talke, S. A., de Swart, H. E., & De Jonge, V. N. (2009). An idealized model and systematic process study of oxygen depletion in highly turbid
estuaries. Estuaries and Coasts, 32(4), 602–620. https://doi.org/10.1007/s12237-009-9171-yTalke, S. A., de Swart, H. E., & Schuttelaars, H. M. (2009). Feedback between residual circulations and sediment distribution in highly turbid
estuaries: An analytical model. Continental Shelf Research, 29(1), 119–135. https://doi.org/10.1016/j.csr.2007.09.002Talke, S. A., & Jay, D. A. (2013). Nineteenth century North American and Pacific tidal data: Lost or just forgotten? Journal of Coastal Research,
29(6a), 118–127.Talke, S. A., & Jay, D. A. (2017). Archival water-level measurements: Recovering historical data to help design for the future. In Civil and
Environmental Engineering Faculty Publications and Presentations 412. Retrieved from https://pdxscholar.library.pdx.edu/cengin_fac/412Talke, S. A., Orton, P., & Jay, D. A. (2014). Increasing storm tides in New York Harbor, 1844–2013. Geophysical Research Letters, 41, 3149–3155.
https://doi.org/10.1002/2014GL059574Vellinga, N. E., Hoitink, A. J. F., van der Vegt, M., Zhang, W., & Hoekstra, P. (2014). Human impacts on tides overwhelm the effect of sea level
rise on extreme water levels in the Rhine–Meuse delta. Coastal Engineering, 90(Supplement C), 40–50. https://doi.org/10.1016/j.coastaleng.2014.04.005
Wahl, T., Jain, S., Bender, J., Meyers, S. D., & Luther, M. E. (2015). Increasing risk of compound flooding from storm surge and rainfall for majorUS cities. Nature Climate Change, 5(12), 1093–1097. https://doi.org/10.1038/nclimate2736
Wall, G., Nystrom, E., & Litten, S. (2008). Suspended sediment transport in the freshwater reach of the Hudson River Estuary in eastern NewYork. Estuaries and Coasts, 31(3), 542–553. https://doi.org/10.1007/s12237-008-9050-y
Warner, J. C., Armstrong, B., He, R., & Zambon, J. B. (2010). Development of a Coupled Ocean–Atmosphere–Wave–Sediment Transport(COAWST) modeling system. Ocean Modelling, 35(3), 230–244. https://doi.org/10.1016/j.ocemod.2010.07.010
Winterwerp, J. C. (2011). Fine sediment transport by tidal asymmetry in the high-concentrated Ems River: Indications for a regime shift inresponse to channel deepening. Ocean Dynamics, 61(2-3), 203–215. https://doi.org/10.1007/s10236-010-0332-0
Winterwerp, J. C., Wang, Z. B., van Braeckel, A., van Holland, G., & Kösters, F. (2013). Man-induced regime shifts in small estuaries—II: Acomparison of rivers. Ocean Dynamics, 63(11–12), 1293–1306. https://doi.org/10.1007/s10236-013-0663-8
10.1029/2018JC014313Journal of Geophysical Research: Oceans
RALSTON ET AL. 211