Big Data And The Well-Being Nexus: Tracking Google Search ...
10
Cleveland State University Cleveland State University EngagedScholarship@CSU EngagedScholarship@CSU Business Faculty Publications Monte Ahuja College of Business 5-1-2015 Big Data And The Well-Being Nexus: Tracking Google Search Big Data And The Well-Being Nexus: Tracking Google Search Activity By State IQ Activity By State IQ Michael A. McDaniel Virginia Commonwealth University, [email protected] Bryan J. Pesta Cleveland State University, [email protected] Allison S. Gabriel Virginia Commonwealth University Follow this and additional works at: https://engagedscholarship.csuohio.edu/bus_facpub Part of the Cognitive Psychology Commons How does access to this work benefit you? Let us know! How does access to this work benefit you? Let us know! Publisher's Statement NOTICE: this is the author’s version of a work that was accepted for publication in Intelligence. Changes resulting from the publishing process, such as peer review, editing, corrections, structural formatting, and other quality control mechanisms may not be reflected in this document. Changes may have been made to this work since it was submitted for publication. A definitive version was subsequently published in Intelligence, 50, 1, 05-01-2015, 10.1016/ j.intell.2015.01.001. Original Published Citation Original Published Citation McDaniel, M.A., Pesta, B.J., & Gabriel, A.S. (2015). Big data and the well-being nexus: Tracking Google search activity by state IQ. Intelligence, 50, 21-29. doi: 10.1016/j.intell.2015.01.001 This Article is brought to you for free and open access by the Monte Ahuja College of Business at EngagedScholarship@CSU. It has been accepted for inclusion in Business Faculty Publications by an authorized administrator of EngagedScholarship@CSU. For more information, please contact [email protected].
Transcript of Big Data And The Well-Being Nexus: Tracking Google Search ...

Cleveland State University Cleveland State University
EngagedScholarship@CSU EngagedScholarship@CSU
Business Faculty Publications Monte Ahuja College of Business
5-1-2015
Big Data And The Well-Being Nexus: Tracking Google Search Big Data And The Well-Being Nexus: Tracking Google Search
Activity By State IQ Activity By State IQ
Michael A. McDaniel Virginia Commonwealth University, [email protected]
Bryan J. Pesta Cleveland State University, [email protected]
Allison S. Gabriel Virginia Commonwealth University
Follow this and additional works at: https://engagedscholarship.csuohio.edu/bus_facpub
Part of the Cognitive Psychology Commons
How does access to this work benefit you? Let us know! How does access to this work benefit you? Let us know!
Publisher's Statement NOTICE: this is the author’s version of a work that was accepted for publication in Intelligence.
Changes resulting from the publishing process, such as peer review, editing, corrections,
structural formatting, and other quality control mechanisms may not be reflected in this
document. Changes may have been made to this work since it was submitted for publication. A
definitive version was subsequently published in Intelligence, 50, 1, 05-01-2015, 10.1016/
j.intell.2015.01.001.
Original Published Citation Original Published Citation McDaniel, M.A., Pesta, B.J., & Gabriel, A.S. (2015). Big data and the well-being nexus: Tracking Google search activity by state IQ. Intelligence, 50, 21-29. doi: 10.1016/j.intell.2015.01.001
This Article is brought to you for free and open access by the Monte Ahuja College of Business at EngagedScholarship@CSU. It has been accepted for inclusion in Business Faculty Publications by an authorized administrator of EngagedScholarship@CSU. For more information, please contact [email protected].

explained most of the variance in the component variables, andpredicted other important social and political state-level out-comes (Pesta, Bertsch, McDaniel, Mahoney, & Poznanski, 2012;Pesta &McDaniel, 2014; Pesta et al., 2010). Like the g nexus (see,Jensen, 1998), thewell-being nexus hypothetically contains both
vertical and horizontal components. Postulated causes of groupdifferences in well-being comprise the vertical dimension, whilethe consequences that follow from these differences comprisethe horizontal dimension. IQ, itself, is a central node in the well-being nexus.
Table 1Search term composites.
Composite name Number of search terms Alpha reliability Search terms included Comments
Food 22 .99 How much turkey, tortellini, dry pasta, how to hardboil an egg, calories in pumpkin, Clif Bars, overnightfrench toast, turkey per person, cooking corn on thecob, panini recipes, fat banana, crock pot applesauce,summer salad, banana chocolate chip, low fat bananabread, baked french toast, make ahead, summerpasta, meatballs, summer drinks, free snacks,best apples
Food, drinks, and cooking
Reading 7 .97 Books of 2010, year in review, kids book, SandraBoynton, American Girl magazine, club books, club book
Reading including reading foradults, children and achildren's book author(Sandra Boynton)
House preservation 21 .99 Decking reviews, foundation wall, foundation walls,custom woodworking, furnace cost, furnace price,Timbertech decking, basement insulation, entrywaystorage, window prices, direct vent gas fireplace,bench with storage, basement window, furnaceprices, wood cleaner, coat tree, coat hook, coathooks, cordless blinds, radon level, radon test
House preservation, houseaccessories (e.g., coat tree),and house safety (e.g., radonlevel)
Snow 14 .99 Snow shovels, snow shovel, amount of snow,aggressive alpine skiing, car snow, Sears snow blowers,snow blowers, electric snow blower, used snow plows,how much snow, blowers, H727, Optimo H727,Hankook Optimo H727
Quantities of snow, snowremoval (e.g., snow shovels),driving in snow, automobiletires for snow (e.g., H727)
Healthy 3 .93 Going off the pill, hip flexor, calories burned running Contraception, anatomyrelated to exercise (e.g., hipflexor), calorie burning
Lawn and garden 6 .97 Mow lawn, lamium, barberry, spring lawn, asters, liatris Lawn, garden plantsBabies 6 .96 Sleep sacks, sleep sack, most popular names, crib
safety, safety gate, halo sleepBaby-related products andpopular names
Games 3 .90 Cricket rules, Stratego, ladder ball GamesAsanti rims 3 .97 Asanti wheels, Asanti, Asanti.rims Asanti brand automobile
wheelsBeauty 6 .96 Eyeshadow tutorial, eyeshadow, cut hair, MAC makeup,
Retin-A cream, braces before and afterMake-up, hair, braces
Fighting 4 .96 School fights, high school fights, real fight, fights videos Fighting, school fightsJob seeking 15 .98 Clerk job description, clerk job, become a pharmacist,
to become a pharmacist, become a registered nurse,resume for a job, jobs application, ASVAB fordummies, clerk duties, objective for resume, join theairforce, learn how to type, free fax cover, coversheet, how to write an essay
Job information, job skills(e.g., typing, essay writing)
Hello Kitty 16 .99 Hello Kitty shoes, Hello Kitty stuff, Hello Kitty cake, HelloKitty case, Hello Kitty games, Hello Kitty clothes,hellokitty.com, Hello Kitty phone, Hello Kitty backpack,Hello Kitty birthday, Hello Kitty cases, Hello Kitty purse,Hello Kitty purses, Hello Kitty shirts, Hello Kitty nails,Hello Kitty iPod
Products related to HelloKitty™ (see http://www.sanrio.com/).Searches referencing “kitty”but lacking the word “hello”are not included.
Social media 14 .98 www.my.space.com, free.layouts.com,hot.free.layouts.com, hotfreelayouts, cherrybam.com,myspace.com, myspace. com, symbols for myspace,facebook search, layouts.com, photo a day,photo a day challenge, www.photobucket.com,muzy.com
Websites associated withsocial media includingphotograph-related sharingsites
Thuggish RuggishBone
3 1.00a Thuggish, thuggish ruggish, ruggish Terms related to a rap songby the artists “Bone Thugs-n-Harmony”
a The actual alpha reliability is 0.9979694.

Generating further empirical support for the con-struct validity of the nexus can be achieved by identifyingnew variables that correlate (or fail to correlate) with IQ/well-being in ways that make theoretical sense. An exampleof convergent validity comes from correlations betweenwell-being and measures of liberalism and conservatism(Pesta & McDaniel, 2014; Pesta et al., 2010). An example ofdivergent validity comes by the relative lack of relation-ship between state personality and either IQ or well-being (Pesta et al., 2010). In sum, the robustness of thewell-being nexus is measured by the scope of state-levelvariables it subsumes.
The present study is therefore descriptive. We show that IQand well-being covary with an activity ubiquitous in manypeople's lives—conducting Google searches on the internet.Billions of Google searches are performedper day (Internet LiveStats, 2014). These searches provide snapshots of interestinghuman behavior. Moreover, many state well-being variablesare derived from self-report data (e.g., religious belief data,census survey data) that may be influenced by impressionmanagement and self-deception (Paulhus, 1991), in addition topotentially being affected by accuracy of memory and inatten-tive responding. In contrast, the current study employs novelmeasurement methods (massive archival records of internetsearches) that are not affected by typical problems inherentin self-report data. Our data are therefore both unobstrusiveand non-reactive (Webb, Campbell, Schwartz, & Sechrest,2000). Here, for example, we report that some specificsearch terms (e.g., Hello Kitty™; crock pot applesauce) co-vary in frequency with each state's relative level of IQ andwell-being. We make sense of these correlations by usingrational clustering, and by referencing extant literature toexplain why the derived clusters might fall within the well-being nexus.
We note that there is some precedent for using searchterm queries as variables in social science research.Recently, Neville (2012) showed that academically dishonestsearches (e.g., students seeking to buy term papers) were morefrequent in stateswith higher levels of income inequality. As such,the present study sought to deepen our understanding of the
factors thatmay (ormay not) relate to the IQ/well-being of the 50U.S. states.
2. Method
Similar to pastwork (e.g.,McDaniel, 2006; Pesta et al., 2010),the unit of analysiswas stateswithin theUSA (n=50).Weusedstate well-being data from Pesta et al. (2010), who created sixsub-domains of global well-being: IQ, religiosity, crime,education, health, and income. IQ was estimated from publicschool achievement test scores (see McDaniel, 2006).Religiosity was derived from state-level survey dataassessing fundamentalist religious beliefs (e.g., “My holybook is literally true;” “Mine is the one true faith”). Crimewas created from various violence statistics, includingburglary, murder, rape, violent crimes, and the number ofinmates per capita. Education included the percentage ofresidents with (a) college degrees and (b) jobs in science,technology, engineering, or mathematics. Health includedinfant mortality and the incidence of obesity, smoking, andheart disease. Finally, income included income per capita,disposable income per capita, percent of families inpoverty, and percent of individuals in poverty. An estimatewas made for each variable within each state. Religiosityand crime were reverse coded such that higher scoresrepresented lower levels of each.
We used the Google Correlate algorithm (Google Correlate,2014; program available at http://www.google.com/trends/correlate) to explore how well-being relates to differences insearch-term frequencies by U.S. state. Google Correlate can beused in two ways. One way seeks to identify terms thatcorrespond to a trend across time (weekly or monthly); theother way seeks to identify terms that correspond to the 50U.S. states. Given our paper's focus, we used the latter approach.The algorithm compiles lists of search terms that “bestmimic thedata” provided by the user (Mohebbi et al., 2011; p. 1).Specifically, the algorithm generates 100 terms that maximizethe magnitude of a correlation with a vector of user provideddata for each state. The vectorweprovidedwas state IQ; thus,wesought search terms that covary strongly with state IQ. The
Table 2Inter-correlations of Google search-term composites related to state IQ.
1. 2. 3. 4. 5. 6. 7. 8. 9. 10. 11. 12. 13. 14.
1. Food2. Reading .943. House preservation .95 .924. Snow .94 .88 .965. Healthy .94 .91 .90 .886. Lawn & garden .92 .91 .94 .89 .897. Babies .94 .92 .95 .92 .93 .918. Games .96 .93 .95 .93 .94 .92 .949. Asanti rims − .84 − .83 − .86 − .81 − .77 − .82 − .82 − .8110. Beauty − .86 − .84 − .88 − .80 − .81 − .86 − .85 − .87 .8611. Fighting − .86 − .84 − .84 − .80 − .82 − .78 − .86 − .86 .82 .9112. Job seeking − .88 − .86 − .88 − .82 − .86 − .84 − .88 − .89 .86 .93 .9513. Hello Kitty − .87 − .84 − .88 − .84 − .79 − .82 − .87 − .86 .86 .91 .91 .9014. Social media − .90 − .87 − .88 − .84 − .87 − .85 − .89 − .90 .87 .93 .94 .93 .9215. Thuggish Ruggish Bone − .79 − .77 − .80 − .78 − .72 − .73 − .77 − .77 .81 .80 .83 .79 .85 .81
Note. All correlations are significant at p b .001.

algorithm returned the top 100 search terms that correlatedmost strongly and positively with IQ. Next, we provided thealgorithm with state IQ multiplied by -1 in order to yield thetop 100 terms that correlated most strongly and negative-ly with state IQ. Numeric values for each state representthe search term's relative frequency as a number with amean of zero and a standard deviation of one (Mohebbiet al., 2011). Higher magnitude positive (negative) num-bers indicate that the search term is more (less) frequentfor that state given its IQ. Values were derived from allGoogle searches conducted in the USA between January2003 and the day we ran the algorithm (August 19, 2014for positive covariates; August 20, 2014 for negativecovariates).
Given that the Google algorithm selected only thosesearch terms highly correlated with state IQ, the resultingsearch terms were extremely correlated with each other,despite the fact that the content of the searches variedwidely. As such, and considering our two lists of searchterms (i.e., those positively or negatively correlatedwith stateIQ), the terms themselves were positively correlated withinlists, and negatively correlated across lists. Because of thesehigh intercorrelations, we were precluded from empiricallyclustering the search terms. Instead, we clustered searchterms rationally. We required a minimum of three searchterms per cluster, and that the terms comprising each clustermust come from either the positive or the negative list ofIQ covariates, but not from both lists. Next, we derivedtentative search term clusters based on similarity of concept.The search terms that were included in a cluster werefinalized via discussion and consensus among the authors.Specifically, each author went through all derived searchterms and placed each into an appropriate category; anydiscrepancies (e.g., not including an item in a particularcategory, including an item that another author did notinclude) were discussed until a unanimous conclusion wasreached.
As an illustrative example of our categorization process,two of the authors did not see the connection between thefollowing set of search terms: “thuggish”, “thuggish ruggish”,
and “ruggish.” However, another author recognized that theterms were part of a song entitled Thuggish Ruggish Bone. Afteridentifying this commonality, the terms were assigned to theirown category. As a second illustrative example, we did notinitially know the meaning of the terms lamium and liatris.Through research, we discovered that these search termswere plant names, and the plants are sold in nurseries for usein gardens. Therefore, we added these two terms to the lawnand garden category. It is important to note that not allsearch terms were placed in a cluster; only search terms inAppendix Tables A-1 and A-2 that are marked with anasterisk were assigned to a cluster. For example, the searchterm “Irish phrases” had little in common, to the best of ourjudgment, with any other search term, and so it was notincluded in a cluster.
As a final step, we derived composite scores for eachcluster by state. These comprised the mean of all searchterm frequencies within clusters. Our analytic strategy wasto correlate the cluster composite scores (derived from stateIQ) with all other well-being variables, including the globalmeasure.
3. Results and discussion
Table 1 shows the search term composites. The firstcolumn lists the composite name, the second column liststhe number of search terms in the composite, and the thirdcolumn provides the alpha reliability of the composite.1 Thesearch terms forming each composite are listed in the fourthcolumn. Comments on the composites appear in the last
1 Whereas the search terms were selected to mimic state IQ, the alphareliabilities of our rationally constructed scales will always be high. Themagnitude of the reliability is not evidence for the merit of the scale. Anyrandomly selected set of terms from the positive list will show a high alphareliability. Likewise, any randomly selected set of terms from the negative listwill show a high alpha reliability.
Table 3Correlations between Google search composites, state IQ, and other well-being variables.
State IQ Religiosity Crime Education Health Income Well-being
1. Food .88 .63 .77 .35 .74 .52 .802. Reading .86 .53 .73 .40 .73 .51 .773. House preservation .88 .58 .77 .28 .66 .49 .754. Snow .85 .63 .76 .31 .66 .55 .775. Healthy .83 .58 .73 .38 .71 .52 .776. Lawn & garden .86 .40 .72 .20 .62 .37 .657. Babies .86 .58 .76 .40 .72 .53 .798. Games .90 .62 .72 .37 .70 .54 .799. Asanti rims − .83 − .54 − .77 − .35 − .72 − .38 − .7410. Beauty − .90 − .56 − .71 − .32 − .66 − .47 − .7511. Fighting − .88 − .72 − .75 − .52 − .83 − .61 − .8812. Job seeking − .92 − .67 − .78 − .48 − .79 − .52 − .8513. Hello Kitty − .89 − .58 − .70 − .39 − .66 − .50 − .7614. Social media − .90 − .62 − .75 − .44 − .77 − .58 − .8415. Thuggish Ruggish Bone − .81 − .53 − .73 − .34 − .67 − .48 − .73
Note. All correlations are significant at p b .001.

column. In total, eight composites were built from 82search terms that positively correlated with state IQ, andseven composites were built from 61 search terms thatnegatively correlated with state IQ. All search terms andtheir correlations with IQ are presented in AppendixTables A-1 and A-2. Appendix Table A-3 shows the relativefrequencies of the cluster composites by state.
Table 2 shows the inter-correlations of the search-termcomposites. The first eight composites correlate positivelywith themselves because their search terms came fromthe positive list of IQ covariates. Likewise, the last sevencomposites correlate positively with themselves becausetheir search terms came from the negative list of IQcovariates. Note then that the first eight composites musttherefore correlate negatively with the last seven.
Table 3 shows the inter-correlations of state IQ andother well-being variables with the 15 search composites.Noticeable trends emerged between the state IQ/well-being variables and the search terms. Higher IQ states areassociated with Google searches related to food, reading,house preservation, snow, health, lawn and garden, babies,and games. Higher IQ states tend to be colder and many arelocated in the Northeastern United States (see Pesta &Poznanski, 2014); as such, Google searches related to snowmake sense, as do searches regarding house preservation(e.g., furnace prices, basement insulation). Additionally,the remaining Google search-term composites are sugges-tive of the relative importance high-IQ states place onmaintaining healthy lifestyles (e.g., calories burned run-ning, low fat banana bread, playing outdoor games),starting a family (e.g., sleep sack, kids' books), and pursuingintellectual hobbies (e.g., books of 2010).
We do note that there are some anomalies within theclusters for high-IQ states. For instance, within the foodcategory, although many of the search terms reflecthealthy food choices (e.g., calories in pumpkin, summersalad), some reflect choices that would be higher in caloricintake (e.g., baked french toast, tortellini). Nonetheless, weview the emphasis on food (and cooking as implied bymany of the searches) to reflect an overall concern ofhealth.
The Google search terms for states with lower IQ andwell-being were quite different in content. Here searchterms related to Assanti™ automobile rims, beauty, fighting,job seeking, Hello Kitty products, social media, and a rapsong titled Thuggish Ruggish Bone. These results suggest thatlower IQ states place relatively greater emphasis on hobbiesrelated to maintaining an online presence (e.g., Facebooksearch, photo a day challenge), music, and cars (e.g., Assantirims).Moreover, the results highlight the efforts that residents oflower IQ statesmade toward obtaining a job via searches relatedto general job seeking advice (e.g., objective for resume) andactual career paths (e.g., become a registered nurse; become apharmacist).
The current study sought to build upon past workexpanding the nomological network around state-level IQand well-being (e.g., Pesta & McDaniel, 2014; Pesta et al.,2010). We did this by exploring whether salient trendsemerged via Google search terms, relative to each state'slevel of IQ and well-being. Our results suggest fairly clearpatterns: individuals residing in states with higher IQ
and well-being tended to search for things related to homeownership, growing a family, and outdoor activities (includinggardening, games, and physical fitness [running]). Conversely,individuals living in states with lower IQ and well-beingfocused their searches more on popular culture (e.g., rapmusic, Hello Kitty), shopping in general (e.g., beauty products,car accessories), and obtaining employment.
Our clusters of Google search terms seem to fit rationallywith the sub-domains comprising state well-being (i.e., IQ,education, income, religiosity, health, and crime; Pesta et al.,2010). For instance, past research has shown that states inthe southern United States, which tend to have lower levelsof IQ and well-being (i.e., higher crime rates; Pesta et al.,2010), experience higher levels of violence (Nisbett, 1993).These states also have lower levels of overall health (Pesta et al.,2012).Mapping these findings on to relative Google search-termfrequencies, states with higher IQ and well-being tend to pursue(as inferred by their Google search behaviors) healthier andmore intellectual lifestyles (e.g., our Health and Readingclusters), as opposed to placing emphasis on things likeviolence (e.g., our Fighting cluster) or social media(e.g., our Social Media cluster). Engaging in the latteractivity may also potentially minimize opportunities forphysical activity (e.g., Iannotti, Kogan, Janssen, & Boyce,2009). Moreover, given that states with lower IQ and well-being tend to experience greater economic problems, therelative frequency with which low-IQ state residents conductsearches related to pursuing various job opportunities seemsrational.
Of particular note is the anomaly that residents of lowerIQ states more frequently searched for terms related toHello Kitty. It is difficult to determine why Hello Kittysearches would be more prevalent in these states. HelloKitty is enormously popular in Asian cultures (Mcveigh,2000), but to our knowledge, no state-specific trends havebeen noted in the United States. Thus, although we find thiscluster inherently interesting due to its unexpected emer-gence, we also do not perceive it to fit within the well-beingnexus.
3.1. Limitations and directions for future research
Given that users conduct billions of Google searches per day(Internet Live Stats, 2014), the search terms generated by thealgorithm were likely relatively stable, and not meaningfullyaffected by random sampling error. A limitation of thesedata, however, is that the search terms derived for eachstate come only from state residents who actually useGoogle. Our results are somewhat non-representativewithin states, as not all residents use computers, and notall internet searches are conducted with Google (Mohebbiet al., 2011). Thus, the search terms may not reflect theinterests of those too poor to have a computer or internetaccess, or older adults who may lack computer skills. Anadditional limitation of these data is that the Google searchalgorithm outputs only 200 search terms (100 each for thenegative and positive covariate lists). We would likely havebeen able to identify more search clusters that co-vary withIQ if the Google Correlate service would provide more than100 terms per search inquiry.
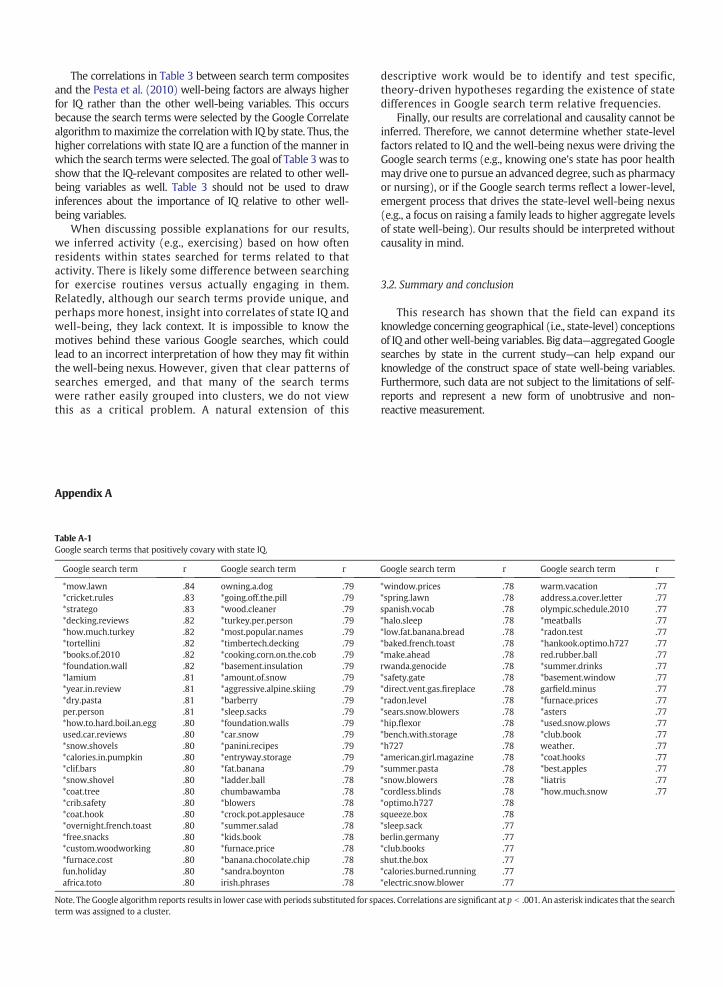
The correlations in Table 3 between search term compositesand the Pesta et al. (2010) well-being factors are always higherfor IQ rather than the other well-being variables. This occursbecause the search terms were selected by the Google Correlatealgorithm tomaximize the correlationwith IQ by state. Thus, thehigher correlations with state IQ are a function of the manner inwhich the search termswere selected. The goal of Table 3was toshow that the IQ-relevant composites are related to other well-being variables as well. Table 3 should not be used to drawinferences about the importance of IQ relative to other well-being variables.
When discussing possible explanations for our results,we inferred activity (e.g., exercising) based on how oftenresidents within states searched for terms related to thatactivity. There is likely some difference between searchingfor exercise routines versus actually engaging in them.Relatedly, although our search terms provide unique, andperhaps more honest, insight into correlates of state IQ andwell-being, they lack context. It is impossible to know themotives behind these various Google searches, which couldlead to an incorrect interpretation of how they may fit withinthe well-being nexus. However, given that clear patterns ofsearches emerged, and that many of the search termswere rather easily grouped into clusters, we do not viewthis as a critical problem. A natural extension of this
descriptive work would be to identify and test specific,theory-driven hypotheses regarding the existence of statedifferences in Google search term relative frequencies.
Finally, our results are correlational and causality cannot beinferred. Therefore, we cannot determine whether state-levelfactors related to IQ and the well-being nexus were driving theGoogle search terms (e.g., knowing one's state has poor healthmay drive one to pursue an advanced degree, such as pharmacyor nursing), or if the Google search terms reflect a lower-level,emergent process that drives the state-level well-being nexus(e.g., a focus on raising a family leads to higher aggregate levelsof state well-being). Our results should be interpreted withoutcausality in mind.
3.2. Summary and conclusion
This research has shown that the field can expand itsknowledge concerning geographical (i.e., state-level) conceptionsof IQ and otherwell-being variables. Big data—aggregated Googlesearches by state in the current study—can help expand ourknowledge of the construct space of state well-being variables.Furthermore, such data are not subject to the limitations of self-reports and represent a new form of unobtrusive and non-reactive measurement.
Table A-1Google search terms that positively covary with state IQ.
Google search term r Google search term r Google search term r Google search term r
*mow.lawn .84 owning.a.dog .79 *window.prices .78 warm.vacation .77*cricket.rules .83 *going.off.the.pill .79 *spring.lawn .78 address.a.cover.letter .77*stratego .83 *wood.cleaner .79 spanish.vocab .78 olympic.schedule.2010 .77*decking.reviews .82 *turkey.per.person .79 *halo.sleep .78 *meatballs .77*how.much.turkey .82 *most.popular.names .79 *low.fat.banana.bread .78 *radon.test .77*tortellini .82 *timbertech.decking .79 *baked.french.toast .78 *hankook.optimo.h727 .77*books.of.2010 .82 *cooking.corn.on.the.cob .79 *make.ahead .78 red.rubber.ball .77*foundation.wall .82 *basement.insulation .79 rwanda.genocide .78 *summer.drinks .77*lamium .81 *amount.of.snow .79 *safety.gate .78 *basement.window .77*year.in.review .81 *aggressive.alpine.skiing .79 *direct.vent.gas.fireplace .78 garfield.minus .77*dry.pasta .81 *barberry .79 *radon.level .78 *furnace.prices .77per.person .81 *sleep.sacks .79 *sears.snow.blowers .78 *asters .77*how.to.hard.boil.an.egg .80 *foundation.walls .79 *hip.flexor .78 *used.snow.plows .77used.car.reviews .80 *car.snow .79 *bench.with.storage .78 *club.book .77*snow.shovels .80 *panini.recipes .79 *h727 .78 weather. .77*calories.in.pumpkin .80 *entryway.storage .79 *american.girl.magazine .78 *coat.hooks .77*clif.bars .80 *fat.banana .79 *summer.pasta .78 *best.apples .77*snow.shovel .80 *ladder.ball .78 *snow.blowers .78 *liatris .77*coat.tree .80 chumbawamba .78 *cordless.blinds .78 *how.much.snow .77*crib.safety .80 *blowers .78 *optimo.h727 .78*coat.hook .80 *crock.pot.applesauce .78 squeeze.box .78*overnight.french.toast .80 *summer.salad .78 *sleep.sack .77*free.snacks .80 *kids.book .78 berlin.germany .77*custom.woodworking .80 *furnace.price .78 *club.books .77*furnace.cost .80 *banana.chocolate.chip .78 shut.the.box .77fun.holiday .80 *sandra.boynton .78 *calories.burned.running .77africa.toto .80 irish.phrases .78 *electric.snow.blower .77
Note. The Google algorithm reports results in lower casewith periods substituted for spaces. Correlations are significant at p b .001. An asterisk indicates that the searchterm was assigned to a cluster.
Appendix A
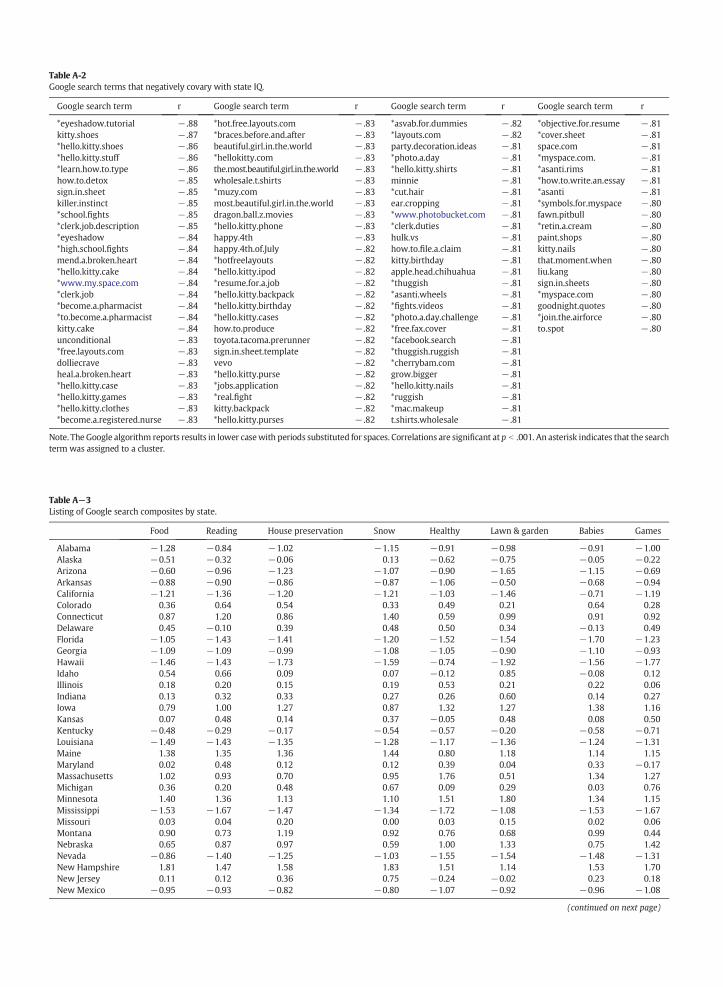
Table A-2Google search terms that negatively covary with state IQ.
Google search term r Google search term r Google search term r Google search term r
*eyeshadow.tutorial − .88 *hot.free.layouts.com − .83 *asvab.for.dummies − .82 *objective.for.resume − .81kitty.shoes − .87 *braces.before.and.after − .83 *layouts.com − .82 *cover.sheet − .81*hello.kitty.shoes − .86 beautiful.girl.in.the.world − .83 party.decoration.ideas − .81 space.com − .81*hello.kitty.stuff − .86 *hellokitty.com − .83 *photo.a.day − .81 *myspace.com. − .81*learn.how.to.type − .86 the.most.beautiful.girl.in.the.world − .83 *hello.kitty.shirts − .81 *asanti.rims − .81how.to.detox − .85 wholesale.t.shirts − .83 minnie − .81 *how.to.write.an.essay − .81sign.in.sheet − .85 *muzy.com − .83 *cut.hair − .81 *asanti − .81killer.instinct − .85 most.beautiful.girl.in.the.world − .83 ear.cropping − .81 *symbols.for.myspace − .80*school.fights − .85 dragon.ball.z.movies − .83 *www.photobucket.com − .81 fawn.pitbull − .80*clerk.job.description − .85 *hello.kitty.phone − .83 *clerk.duties − .81 *retin.a.cream − .80*eyeshadow − .84 happy.4th − .83 hulk.vs − .81 paint.shops − .80*high.school.fights − .84 happy.4th.of.July − .82 how.to.file.a.claim − .81 kitty.nails − .80mend.a.broken.heart − .84 *hotfreelayouts − .82 kitty.birthday − .81 that.moment.when − .80*hello.kitty.cake − .84 *hello.kitty.ipod − .82 apple.head.chihuahua − .81 liu.kang − .80*www.my.space.com − .84 *resume.for.a.job − .82 *thuggish − .81 sign.in.sheets − .80*clerk.job − .84 *hello.kitty.backpack − .82 *asanti.wheels − .81 *myspace.com − .80*become.a.pharmacist − .84 *hello.kitty.birthday − .82 *fights.videos − .81 goodnight.quotes − .80*to.become.a.pharmacist − .84 *hello.kitty.cases − .82 *photo.a.day.challenge − .81 *join.the.airforce − .80kitty.cake − .84 how.to.produce − .82 *free.fax.cover − .81 to.spot − .80unconditional − .83 toyota.tacoma.prerunner − .82 *facebook.search − .81*free.layouts.com − .83 sign.in.sheet.template − .82 *thuggish.ruggish − .81dolliecrave − .83 vevo − .82 *cherrybam.com − .81heal.a.broken.heart − .83 *hello.kitty.purse − .82 grow.bigger − .81*hello.kitty.case − .83 *jobs.application − .82 *hello.kitty.nails − .81*hello.kitty.games − .83 *real.fight − .82 *ruggish − .81*hello.kitty.clothes − .83 kitty.backpack − .82 *mac.makeup − .81*become.a.registered.nurse − .83 *hello.kitty.purses − .82 t.shirts.wholesale − .81
Note. The Google algorithm reports results in lower casewith periods substituted for spaces. Correlations are significant at p b .001. An asterisk indicates that the searchterm was assigned to a cluster.
Table A−3Listing of Google search composites by state.
Food Reading House preservation Snow Healthy Lawn & garden Babies Games
Alabama −1.28 −0.84 −1.02 −1.15 −0.91 −0.98 −0.91 −1.00Alaska −0.51 −0.32 −0.06 0.13 −0.62 −0.75 −0.05 −0.22Arizona −0.60 −0.96 −1.23 −1.07 −0.90 −1.65 −1.15 −0.69Arkansas −0.88 −0.90 −0.86 −0.87 −1.06 −0.50 −0.68 −0.94California −1.21 −1.36 −1.20 −1.21 −1.03 −1.46 −0.71 −1.19Colorado 0.36 0.64 0.54 0.33 0.49 0.21 0.64 0.28Connecticut 0.87 1.20 0.86 1.40 0.59 0.99 0.91 0.92Delaware 0.45 −0.10 0.39 0.48 0.50 0.34 −0.13 0.49Florida −1.05 −1.43 −1.41 −1.20 −1.52 −1.54 −1.70 −1.23Georgia −1.09 −1.09 −0.99 −1.08 −1.05 −0.90 −1.10 −0.93Hawaii −1.46 −1.43 −1.73 −1.59 −0.74 −1.92 −1.56 −1.77Idaho 0.54 0.66 0.09 0.07 −0.12 0.85 −0.08 0.12Illinois 0.18 0.20 0.15 0.19 0.53 0.21 0.22 0.06Indiana 0.13 0.32 0.33 0.27 0.26 0.60 0.14 0.27Iowa 0.79 1.00 1.27 0.87 1.32 1.27 1.38 1.16Kansas 0.07 0.48 0.14 0.37 −0.05 0.48 0.08 0.50Kentucky −0.48 −0.29 −0.17 −0.54 −0.57 −0.20 −0.58 −0.71Louisiana −1.49 −1.43 −1.35 −1.28 −1.17 −1.36 −1.24 −1.31Maine 1.38 1.35 1.36 1.44 0.80 1.18 1.14 1.15Maryland 0.02 0.48 0.12 0.12 0.39 0.04 0.33 −0.17Massachusetts 1.02 0.93 0.70 0.95 1.76 0.51 1.34 1.27Michigan 0.36 0.20 0.48 0.67 0.09 0.29 0.03 0.76Minnesota 1.40 1.36 1.13 1.10 1.51 1.80 1.34 1.15Mississippi −1.53 −1.67 −1.47 −1.34 −1.72 −1.08 −1.53 −1.67Missouri 0.03 0.04 0.20 0.00 0.03 0.15 0.02 0.06Montana 0.90 0.73 1.19 0.92 0.76 0.68 0.99 0.44Nebraska 0.65 0.87 0.97 0.59 1.00 1.33 0.75 1.42Nevada −0.86 −1.40 −1.25 −1.03 −1.55 −1.54 −1.48 −1.31New Hampshire 1.81 1.47 1.58 1.83 1.51 1.14 1.53 1.70New Jersey 0.11 0.12 0.36 0.75 −0.24 −0.02 0.23 0.18New Mexico −0.95 −0.93 −0.82 −0.80 −1.07 −0.92 −0.96 −1.08
(continued on next page)

Table A−3 (continued)
Food Reading House preservation Snow Healthy Lawn & garden Babies Games
New York −0.18 −0.14 −0.18 0.11 −0.20 −0.49 −0.18 −0.28North Carolina −0.35 −0.16 −0.54 −0.76 −0.09 −0.16 −0.28 −0.26North Dakota 1.37 0.50 1.34 1.71 1.40 1.21 1.79 1.21Ohio 0.29 0.51 0.47 0.28 0.23 0.35 −0.22 0.34Oklahoma −0.73 −0.60 −0.89 −0.73 −0.67 −0.37 −0.74 −0.73Oregon −0.13 −0.37 −0.19 −0.83 −0.49 −0.16 −0.16 −0.26Pennsylvania 0.70 0.38 0.65 0.81 0.78 0.28 0.17 0.79Rhode Island 0.82 0.47 0.61 0.83 0.64 0.44 0.72 0.54South Carolina −0.58 −0.24 −0.81 −1.04 −0.64 −0.54 −0.48 −0.63South Dakota 1.04 0.50 1.14 1.10 1.14 1.52 1.24 0.75Tennessee −0.71 −0.51 −0.61 −0.89 −0.64 −0.48 −0.48 −0.67Texas −1.27 −1.38 −1.28 −1.21 −1.13 −0.89 −1.18 −1.03Utah 0.35 1.19 0.01 0.03 0.13 0.14 0.34 −0.04Vermont 1.51 1.61 1.01 0.91 1.93 1.14 1.28 1.72Virginia −0.82 −0.87 −0.60 −0.57 −0.82 −0.53 −0.72 −0.66Washington 0.28 0.16 0.00 −0.57 0.12 0.03 0.47 0.40West Virginia −0.55 −0.78 0.07 0.10 −0.69 −0.15 −0.61 −0.60Wisconsin 1.41 1.15 1.03 1.23 1.39 1.57 0.93 0.94Wyoming 0.37 0.38 0.92 0.58 −0.25 0.17 0.82 0.47
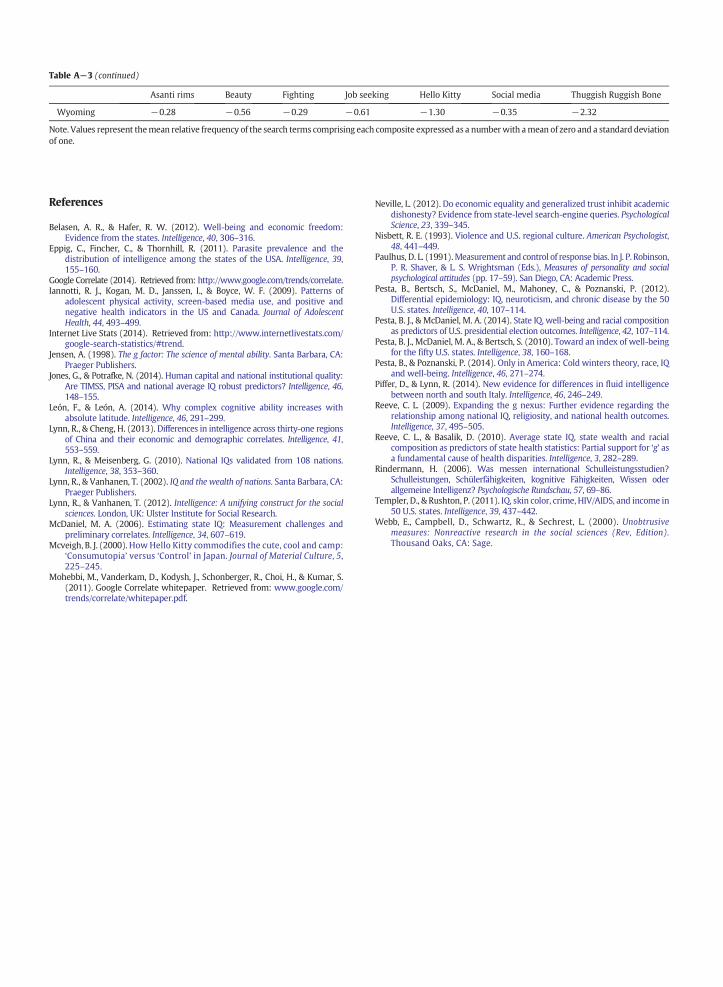
Asanti rims Beauty Fighting Job seeking Hello Kitty Social media Thuggish Ruggish Bone
Alabama 1.60 0.93 1.67 1.50 1.25 1.48 3.82Alaska −0.04 −0.03 −0.52 0.39 −0.28 0.05 −1.86Arizona 0.63 0.83 0.71 0.88 0.66 0.85 4.62Arkansas 0.54 0.59 1.08 1.12 0.52 0.82 1.95California 1.06 1.10 0.14 0.46 1.15 0.66 4.22Colorado −0.40 −0.28 −0.35 −0.58 −0.29 −0.26 −0.38Connecticut −0.62 −0.46 −0.66 −0.55 −0.52 −0.24 −3.52Delaware −0.20 0.08 0.41 0.31 −0.36 −0.58 −2.44Florida 1.90 0.97 0.60 1.11 0.67 0.81 1.02Georgia 1.75 0.49 0.79 0.95 0.91 0.63 2.94Hawaii 1.34 2.12 1.67 1.53 2.59 1.56 3.93Idaho −1.14 −0.25 −0.68 −0.24 −0.53 −0.23 −3.12Illinois 0.05 −0.23 −0.23 −0.39 0.13 −0.39 1.56Indiana −0.39 −0.55 −0.10 −0.27 −0.16 −0.03 0.57Iowa −0.88 −1.11 −1.08 −0.91 −0.52 −1.01 −2.87Kansas −0.27 −0.14 −0.05 −0.35 0.08 −0.40 2.02Kentucky −0.22 0.18 0.63 0.19 0.44 0.86 0.44Louisiana 3.05 2.14 1.34 1.30 1.50 2.20 4.37Maine −1.36 −1.19 −1.07 −1.18 −1.11 −1.01 −3.71Maryland −0.09 0.20 −0.02 0.50 −0.33 −0.41 1.89Massachusetts −0.63 −0.68 −1.04 −1.13 −0.70 −0.97 −3.43Michigan −0.02 −0.38 −0.12 −0.27 −0.05 −0.44 −0.05Minnesota −0.53 −0.93 −1.10 −1.05 −0.67 −1.25 −2.07Mississippi 1.89 2.00 2.87 2.54 2.25 2.04 7.40Missouri −0.30 −0.43 0.01 −0.24 −0.07 −0.32 0.13Montana −1.23 −0.96 −0.82 −0.74 −1.35 −0.75 −4.55Nebraska −0.55 −0.79 −0.57 −0.68 −0.53 −0.55 −0.69Nevada 1.78 1.53 1.12 1.51 1.61 1.35 6.27New Hampshire −1.10 −1.27 −1.09 −1.17 −1.02 −1.07 −4.57New Jersey −0.01 0.27 −0.22 0.09 −0.37 0.01 −2.75New Mexico 0.15 1.61 1.69 0.85 1.06 1.38 5.13New York −0.28 −0.16 −0.49 −0.29 −0.40 −0.41 −2.96North Carolina 0.36 0.08 0.46 0.44 0.30 0.35 −0.67North Dakota −1.04 −0.74 −1.04 −1.04 −1.37 −1.44 −2.33Ohio −0.50 −0.73 −0.38 −0.45 −0.25 −0.03 2.52Oklahoma 0.36 0.72 0.84 0.44 0.01 0.66 2.10Oregon −0.80 −0.87 −0.98 −1.05 −0.67 −0.63 −2.29Pennsylvania −0.59 −0.19 −0.39 −0.41 −0.55 −0.32 −2.43Rhode Island −0.40 −0.24 −0.61 −0.49 −0.47 −0.20 −2.01South Carolina 0.72 0.56 0.94 1.05 0.76 0.87 0.03South Dakota −0.93 −1.02 −0.86 −0.80 −1.17 −1.04 −0.73Tennessee 0.65 0.39 0.69 0.67 0.95 0.46 0.84Texas 1.26 1.12 1.37 0.67 1.37 1.20 4.47Utah −0.72 0.15 −0.56 −0.24 −0.44 −0.71 −1.87Vermont −1.21 −1.41 −1.58 −1.73 −1.52 −1.74 −3.47Virginia −0.40 −1.10 −0.55 −0.53 −0.54 −0.48 −1.26Washington −0.37 −0.10 −0.62 −0.49 −0.23 −0.36 0.13West Virginia −0.77 0.69 0.68 0.64 0.66 0.51 −2.50Wisconsin −0.81 −1.13 −0.81 −0.92 −0.51 −0.85 −2.25
References
Belasen, A. R., & Hafer, R. W. (2012). Well-being and economic freedom:Evidence from the states. Intelligence, 40, 306–316.
Eppig, C., Fincher, C., & Thornhill, R. (2011). Parasite prevalence and thedistribution of intelligence among the states of the USA. Intelligence, 39,155–160.
Google Correlate (2014). Retrieved from: http://www.google.com/trends/correlate.Iannotti, R. J., Kogan, M. D., Janssen, I., & Boyce, W. F. (2009). Patterns of
adolescent physical activity, screen-based media use, and positive andnegative health indicators in the US and Canada. Journal of AdolescentHealth, 44, 493–499.
Internet Live Stats (2014). Retrieved from: http://www.internetlivestats.com/google-search-statistics/#trend.
Jensen, A. (1998). The g factor: The science of mental ability. Santa Barbara, CA:Praeger Publishers.
Jones, G., & Potrafke, N. (2014). Human capital and national institutional quality:Are TIMSS, PISA and national average IQ robust predictors? Intelligence, 46,148–155.
León, F., & León, A. (2014). Why complex cognitive ability increases withabsolute latitude. Intelligence, 46, 291–299.
Lynn, R., & Cheng, H. (2013). Differences in intelligence across thirty-one regionsof China and their economic and demographic correlates. Intelligence, 41,553–559.
Lynn, R., & Meisenberg, G. (2010). National IQs validated from 108 nations.Intelligence, 38, 353–360.
Lynn, R., & Vanhanen, T. (2002). IQ and the wealth of nations. Santa Barbara, CA:Praeger Publishers.
Lynn, R., & Vanhanen, T. (2012). Intelligence: A unifying construct for the socialsciences. London, UK: Ulster Institute for Social Research.
McDaniel, M. A. (2006). Estimating state IQ: Measurement challenges andpreliminary correlates. Intelligence, 34, 607–619.
Mcveigh, B. J. (2000). How Hello Kitty commodifies the cute, cool and camp:‘Consumutopia’ versus ‘Control’ in Japan. Journal of Material Culture, 5,225–245.
Mohebbi, M., Vanderkam, D., Kodysh, J., Schonberger, R., Choi, H., & Kumar, S.(2011). Google Correlate whitepaper. Retrieved from: www.google.com/trends/correlate/whitepaper.pdf.
Neville, L. (2012). Do economic equality and generalized trust inhibit academicdishonesty? Evidence from state-level search-engine queries. PsychologicalScience, 23, 339–345.
Nisbett, R. E. (1993). Violence and U.S. regional culture. American Psychologist,48, 441–449.
Paulhus, D. L. (1991).Measurement and control of response bias. In J. P. Robinson,P. R. Shaver, & L. S. Wrightsman (Eds.), Measures of personality and socialpsychological attitudes (pp. 17–59). San Diego, CA: Academic Press.
Pesta, B., Bertsch, S., McDaniel, M., Mahoney, C., & Poznanski, P. (2012).Differential epidemiology: IQ, neuroticism, and chronic disease by the 50U.S. states. Intelligence, 40, 107–114.
Pesta, B. J., & McDaniel, M. A. (2014). State IQ, well-being and racial compositionas predictors of U.S. presidential election outcomes. Intelligence, 42, 107–114.
Pesta, B. J., McDaniel, M. A., & Bertsch, S. (2010). Toward an index of well-beingfor the fifty U.S. states. Intelligence, 38, 160–168.
Pesta, B., & Poznanski, P. (2014). Only in America: Cold winters theory, race, IQand well-being. Intelligence, 46, 271–274.
Piffer, D., & Lynn, R. (2014). New evidence for differences in fluid intelligencebetween north and south Italy. Intelligence, 46, 246–249.
Reeve, C. L. (2009). Expanding the g nexus: Further evidence regarding therelationship among national IQ, religiosity, and national health outcomes.Intelligence, 37, 495–505.
Reeve, C. L., & Basalik, D. (2010). Average state IQ, state wealth and racialcomposition as predictors of state health statistics: Partial support for ‘g’ asa fundamental cause of health disparities. Intelligence, 3, 282–289.
Rindermann, H. (2006). Was messen international Schulleistungsstudien?Schulleistungen, Schülerfähigkeiten, kognitive Fähigkeiten, Wissen oderallgemeine Intelligenz? Psychologische Rundschau, 57, 69–86.
Templer, D., & Rushton, P. (2011). IQ, skin color, crime, HIV/AIDS, and income in50 U.S. states. Intelligence, 39, 437–442.
Webb, E., Campbell, D., Schwartz, R., & Sechrest, L. (2000). Unobtrusivemeasures: Nonreactive research in the social sciences (Rev, Edition).Thousand Oaks, CA: Sage.
Table A−3 (continued)
Asanti rims Beauty Fighting Job seeking Hello Kitty Social media Thuggish Ruggish Bone
Wyoming −0.28 −0.56 −0.29 −0.61 −1.30 −0.35 −2.32
Note. Values represent themean relative frequency of the search terms comprising each composite expressed as a numberwith amean of zero and a standarddeviationof one.
libuser
Typewritten Text
libuser
Text Box
Post-print standardized by MSL Academic Endeavors, the imprint of the Michael Schwartz Library at Cleveland State University, 2016