Analyzing the Workload Dynamics of a Mobile Phone Network in Large Scale Events

PERSPECTIVE OPEN
Best practices for analyzing large-scale health data fromwearables and smartphone appsJennifer L. Hicks1, Tim Althoff2, Rok Sosic3, Peter Kuhar 4, Bojan Bostjancic4, Abby C. King5,6, Jure Leskovec3,7 and Scott L. Delp1,8
Smartphone apps and wearable devices for tracking physical activity and other health behaviors have become popular in recentyears and provide a largely untapped source of data about health behaviors in the free-living environment. The data are large inscale, collected at low cost in the “wild”, and often recorded in an automatic fashion, providing a powerful complement totraditional surveillance studies and controlled trials. These data are helping to reveal, for example, new insights aboutenvironmental and social influences on physical activity. The observational nature of the datasets and collection via commercialdevices and apps pose challenges, however, including the potential for measurement, population, and/or selection bias, as well asmissing data. In this article, we review insights gleaned from these datasets and propose best practices for addressing thelimitations of large-scale data from apps and wearables. Our goal is to enable researchers to effectively harness the data fromsmartphone apps and wearable devices to better understand what drives physical activity and other health behaviors.
npj Digital Medicine (2019) 2:45 ; https://doi.org/10.1038/s41746-019-0121-1
INTRODUCTIONCommercial wearable devices and smartphone apps for monitor-ing health-related behaviors have proliferated rapidly. In 2013,69% of U.S. adults reported tracking one or more health indicators,such as weight or exercise, and 21% of those used technology,such as an app or device,1 while others monitored these healthindicators “in their heads” or on paper. The mobile health marketis projected to grow to $500 billion worldwide by 2025.2 Apps anddevices are available to monitor a wide range of health behaviorsand indicators, such as physical activity, sedentary behavior,weight, diet, heart rate, blood pressure, and sleep. Data can becollected via self-report in the app, through integrated sensors(e.g., accelerometers), or through integration with other devices,like digital scales and blood pressure cuffs.Analyzing the data generated by commercial wearables and
apps has the potential to alter how we study human behavior andhow we intervene to improve health. These datasets are orders ofmagnitude larger than traditional research studies and can beaccessed by researchers at relatively low cost. Since much of thedata are collected automatically, they can reveal behavior in thenatural environment and reach individuals who do not typicallyenroll in research studies and who have not altered their behaviorbecause they are being monitored in a research study. Modifiablehealth behaviors like physical activity,3 sedentary behavior,4 andsleep5 have a significant impact on many aspects of cardiovas-cular, musculoskeletal, and mental health, but until the advent ofmodern wearables we have had limited tools to study theseinterrelated behaviors at scale. Changing health behaviors hasbeen challenging,6 but the large-scale data from apps andwearables can help uncover the environmental, social, and
personal factors that motivate healthy behaviors and identifynew ways to promote sustained behavior change.In spite of the promise of mobile apps and devices and the
massive amounts of data they are collecting, analysis has beenlimited by several challenges. Effectively analyzing these datarequires expertise in both data science and health behaviors, andfew researchers are dually trained, often making collaboration andcommunication between disciplines difficult. A lack of trust alsopresents a major challenge: consumers question if privacy will beprotected, researchers question if results are valid, and companiesquestion how academic partnerships will affect their business.These challenges motivate this article. Our goal is to foster
confidence in using large-scale datasets from consumer apps andwearables to better understand the relationships among physicalactivity and other health behaviors and health outcomes. We hopethis article encourages data sharing between academia andindustry by highlighting productive examples. We also hope tobridge the divide between health researchers and data scientistsby establishing a common knowledge base. We first highlightseveral example studies that have used observational data fromconsumer apps and wearable devices to study human health.From these studies, we identify both novel insights and commonchallenges. We outline best practices for analyzing data fromconsumer apps and wearables and conclude with a summary ofareas where additional research is needed.This article focuses on studies that have analyzed large-scale
data (e.g., thousands of individuals) collected through routine useof commercial wearables and smartphone apps by consumers. Weinclude apps and devices that monitor health behaviors andindicators, including physical activity, weight, diet, sleep, seden-tary behavior, blood pressure, and heart rate. There is excellent
Received: 8 February 2019 Accepted: 7 May 2019
1Department of Bioengineering, Stanford University, Stanford, CA, USA; 2Paul G. Allen School of Computer Science & Engineering, University of Washington, Seattle, WA, USA;3Computer Science Department, Stanford University, Stanford, CA, USA; 4Azumio, Inc., Redwood City, CA, USA; 5Department of Health Research and Policy, Stanford UniversitySchool of Medicine, Stanford, CA, USA; 6Stanford Prevention Research Center, Department of Medicine, Stanford University School of Medicine, Stanford, CA, USA; 7ChanZuckerberg Biohub, San Francisco, CA, USA and 8Department of Mechanical Engineering, Stanford University, Stanford, CA, USACorrespondence: Jennifer L. Hicks ([email protected])
www.nature.com/npjdigitalmed
Scripps Research Translational Institute

research using commercial devices in small scale studies7,8 andstudies that have focused on validating the use of these devices ina variety of populations.9,10 This work is valuable but is not thefocus of the present article.
HIGHLIGHTS FROM THE LITERATURE: INSIGHTS ANDCHALLENGESSeveral studies have used data from commercial apps andwearables to characterize health behaviors and their potentialinfluence on health indicators, like weight and cognitiveperformance. For example, our group has analyzed data fromover 700,000 users of a smartphone app (Argus, Azumio, Inc.) fortracking physical activity.11 We analyzed minute by minute stepcounts estimated automatically using the smartphone’s onboardinertial measurement unit (IMU) in individuals from over 100different countries. This analysis revealed that inequality in howphysical activity is distributed between individuals in a country(i.e., the Gini coefficient12 applied to step counts) is a strongerpredictor of obesity rates than average activity levels in a country(Fig. 1). By connecting activity tracking results to a database of citywalkability scores, we also showed that higher walkability scoresare associated with lower activity inequality in U.S. cities.Sleep is another important and modifiable health behavior.
Walch and colleagues13 analyzed sleep schedule, light exposure,and other data from 8000 users of a free sleep-trackingsmartphone app. They used these data to help untangle howsocial factors, light exposure, and the circadian rhythm influencesleep, demonstrating that social pressures delay bedtime,attenuating or overriding biological pressure for sleep. Althoffet al.14 connected wearable-determined sleep metrics withperformance measured through the individual’s interaction witha search engine (e.g., keystroke time and time to click on aresulting page), showing that two consecutive nights with lessthan 6 h of sleep is associated with decreased performance for aperiod of 6 days.
Variability in blood pressure is predictive of future cardiovas-cular disease and morbidity, but has been challenging tocharacterize with traditional studies, particularly in real-worldsettings (as opposed to clinical settings which can influence vitalsigns). Kim et al.15 analyzed blood pressure readings from over50,000 individuals (with 17 million measurements) using a wirelessblood pressure monitor. They characterized blood pressurevariability and how it changes with season of the year, day ofthe week, and time of day, for example, showing that variability ishigher during weekdays, particularly for females. Researchers alsohave quantified how holidays affect weight gain using data fromdigital scales16 and examined how factors like geographic locationand body mass index (BMI) are related to the taste profile (salty,sweet, etc.) of the meal an individual selects and reports in a diettracking app.17
Many apps include features like a social network, challenges, orcompetitions, which are intended to motivate healthy behaviorand usage of the app or device. Researchers have used large-scaleapp data to understand how these features influence physicalactivity and other behaviors. Aral and Nicolaides18 analyzedexercise patterns in a global social network of 1.1 million runners,demonstrating “contagion” of exercise that varies based ongender and relative levels of activity. For example, they foundthat both men and women influence the activity levels of men,but only women influence other women. Althoff et al.19 used thedataset from the Argus smartphone app to identify a naturalexperiment and show that forming new social connections in theapp increases daily step count by an average of ~400 stepsper day. In this dataset, women receiving friendship requests fromother women recorded greater increases in activity than womenwho received requests from men or men who received requestsfrom either gender. The Argus app also includes games wheregroups of people compete to record the greatest number of stepsover a specified period of time; these competitions were found toincrease physical activity by 23% during the time of thecompetition.20 The success of the competition varied accordingto the composition of the group. Competitions where teams had
Fig. 1 Datasets from apps and wearables are helping researchers identify novel worldwide trends in activity and health. Our team hasanalyzed data from 717,527 users of the Argus app for tracking physical activity and other health metrics.11 This analysis revealed worldwideinequality in levels of physical activity that varied from country to country. In the map, country area is scaled by the country’s obesity rate, ascalculated from the app-reported BMI of users. The countries are shaded according to activity inequality, where warm colors (reds andoranges) indicate high levels of activity inequality (some people are very active and some people are minimally active) and cool colors (blues)indicate low levels of activity inequality (individuals within the country get similar levels of activity). Countries with larger than normal areas(indicative of high obesity) also tend to be shaded with warm colors (indicative of high activity inequality). The map was generated using theScape Toad software63 and the world borders dataset from the Thematic Mapping API64
J.L. Hicks et al.
2
npj Digital Medicine (2019) 45 Scripps Research Translational Institute
1234567890():,;
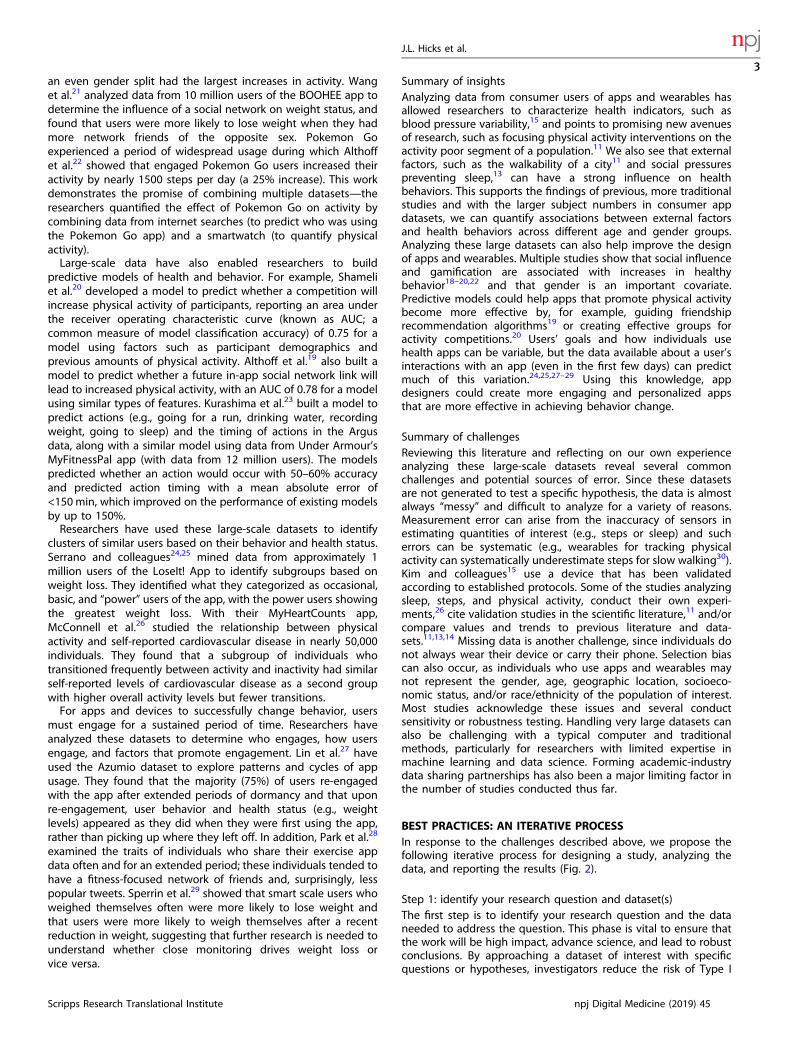
an even gender split had the largest increases in activity. Wanget al.21 analyzed data from 10 million users of the BOOHEE app todetermine the influence of a social network on weight status, andfound that users were more likely to lose weight when they hadmore network friends of the opposite sex. Pokemon Goexperienced a period of widespread usage during which Althoffet al.22 showed that engaged Pokemon Go users increased theiractivity by nearly 1500 steps per day (a 25% increase). This workdemonstrates the promise of combining multiple datasets—theresearchers quantified the effect of Pokemon Go on activity bycombining data from internet searches (to predict who was usingthe Pokemon Go app) and a smartwatch (to quantify physicalactivity).Large-scale data have also enabled researchers to build
predictive models of health and behavior. For example, Shameliet al.20 developed a model to predict whether a competition willincrease physical activity of participants, reporting an area underthe receiver operating characteristic curve (known as AUC; acommon measure of model classification accuracy) of 0.75 for amodel using factors such as participant demographics andprevious amounts of physical activity. Althoff et al.19 also built amodel to predict whether a future in-app social network link willlead to increased physical activity, with an AUC of 0.78 for a modelusing similar types of features. Kurashima et al.23 built a model topredict actions (e.g., going for a run, drinking water, recordingweight, going to sleep) and the timing of actions in the Argusdata, along with a similar model using data from Under Armour’sMyFitnessPal app (with data from 12 million users). The modelspredicted whether an action would occur with 50–60% accuracyand predicted action timing with a mean absolute error of<150min, which improved on the performance of existing modelsby up to 150%.Researchers have used these large-scale datasets to identify
clusters of similar users based on their behavior and health status.Serrano and colleagues24,25 mined data from approximately 1million users of the LoseIt! App to identify subgroups based onweight loss. They identified what they categorized as occasional,basic, and “power” users of the app, with the power users showingthe greatest weight loss. With their MyHeartCounts app,McConnell et al.26 studied the relationship between physicalactivity and self-reported cardiovascular disease in nearly 50,000individuals. They found that a subgroup of individuals whotransitioned frequently between activity and inactivity had similarself-reported levels of cardiovascular disease as a second groupwith higher overall activity levels but fewer transitions.For apps and devices to successfully change behavior, users
must engage for a sustained period of time. Researchers haveanalyzed these datasets to determine who engages, how usersengage, and factors that promote engagement. Lin et al.27 haveused the Azumio dataset to explore patterns and cycles of appusage. They found that the majority (75%) of users re-engagedwith the app after extended periods of dormancy and that uponre-engagement, user behavior and health status (e.g., weightlevels) appeared as they did when they were first using the app,rather than picking up where they left off. In addition, Park et al.28
examined the traits of individuals who share their exercise appdata often and for an extended period; these individuals tended tohave a fitness-focused network of friends and, surprisingly, lesspopular tweets. Sperrin et al.29 showed that smart scale users whoweighed themselves often were more likely to lose weight andthat users were more likely to weigh themselves after a recentreduction in weight, suggesting that further research is needed tounderstand whether close monitoring drives weight loss orvice versa.
Summary of insightsAnalyzing data from consumer users of apps and wearables hasallowed researchers to characterize health indicators, such asblood pressure variability,15 and points to promising new avenuesof research, such as focusing physical activity interventions on theactivity poor segment of a population.11 We also see that externalfactors, such as the walkability of a city11 and social pressurespreventing sleep,13 can have a strong influence on healthbehaviors. This supports the findings of previous, more traditionalstudies and with the larger subject numbers in consumer appdatasets, we can quantify associations between external factorsand health behaviors across different age and gender groups.Analyzing these large datasets can also help improve the designof apps and wearables. Multiple studies show that social influenceand gamification are associated with increases in healthybehavior18–20,22 and that gender is an important covariate.Predictive models could help apps that promote physical activitybecome more effective by, for example, guiding friendshiprecommendation algorithms19 or creating effective groups foractivity competitions.20 Users’ goals and how individuals usehealth apps can be variable, but the data available about a user’sinteractions with an app (even in the first few days) can predictmuch of this variation.24,25,27–29 Using this knowledge, appdesigners could create more engaging and personalized appsthat are more effective in achieving behavior change.
Summary of challengesReviewing this literature and reflecting on our own experienceanalyzing these large-scale datasets reveal several commonchallenges and potential sources of error. Since these datasetsare not generated to test a specific hypothesis, the data is almostalways “messy” and difficult to analyze for a variety of reasons.Measurement error can arise from the inaccuracy of sensors inestimating quantities of interest (e.g., steps or sleep) and sucherrors can be systematic (e.g., wearables for tracking physicalactivity can systematically underestimate steps for slow walking30).Kim and colleagues15 use a device that has been validatedaccording to established protocols. Some of the studies analyzingsleep, steps, and physical activity, conduct their own experi-ments,26 cite validation studies in the scientific literature,11 and/orcompare values and trends to previous literature and data-sets.11,13,14 Missing data is another challenge, since individuals donot always wear their device or carry their phone. Selection biascan also occur, as individuals who use apps and wearables maynot represent the gender, age, geographic location, socioeco-nomic status, and/or race/ethnicity of the population of interest.Most studies acknowledge these issues and several conductsensitivity or robustness testing. Handling very large datasets canalso be challenging with a typical computer and traditionalmethods, particularly for researchers with limited expertise inmachine learning and data science. Forming academic-industrydata sharing partnerships has also been a major limiting factor inthe number of studies conducted thus far.
BEST PRACTICES: AN ITERATIVE PROCESSIn response to the challenges described above, we propose thefollowing iterative process for designing a study, analyzing thedata, and reporting the results (Fig. 2).
Step 1: identify your research question and dataset(s)The first step is to identify your research question and the dataneeded to address the question. This phase is vital to ensure thatthe work will be high impact, advance science, and lead to robustconclusions. By approaching a dataset of interest with specificquestions or hypotheses, investigators reduce the risk of Type I
J.L. Hicks et al.
3
Scripps Research Translational Institute npj Digital Medicine (2019) 45

(false positive) errors. Combining expertise from data science andhealth research can help researchers navigate the planning phasesuccessfully.You should begin by identifying a question that will have an
impact on health, based on gaps in knowledge. For example,some of the key needs include quantifying geographic differencesand the role of environmental factors in health behaviors anddelineating the relationships between multiple health behaviors(e.g., physical activity, sedentary behavior, and sleep). A “naïve”data mining approach (i.e., searching for correlations, clusters, etc.without a specific research question in mind) is almost neveruseful. Without a research question to frame the analysis, it ischallenging to identify interesting and high-impact correlations.This approach also lacks an experimental design to establishinternal and external validity (see Step 5).For observational datasets, establishing irrefutable causal
relationships is typically not possible; however, the data oftencontain natural experiments that allow for causal analysis.Correlational analysis of observational data has helped transformscience and medicine, for example, linking tobacco usage withlung cancer.9 It is equally important, however, to appreciate thatobservational data can also produce results that are refuted whenexperimental trials are conducted subsequently (e.g., hormone-replacement therapy trials showing increased cardiovasculardisease risk in postmenopausal women counter to previousobservational data analysis31). Many of the most powerful
observational studies capitalize on natural experiments in thedata (see Step 4), and the large size of commercial app datasetsoften increases the chance that they include the necessaryexogenous variation (e.g., weather18 or delays in friendshipacceptance in an app19) to allow for natural experiments. Anothergoal of analyzing observational datasets is to generate hypothesesto test with rigorous experimental approaches where causalrelationships can be established. For example, the observationalwork of Shameli et al.20 suggests that the gender makeup ofparticipants in an online physical activity competition predictshow motivating the competition will be. A randomized controlledtrial could subsequently test whether individuals assigned tocompetitions where participant gender is evenly split see greaterincreases in physical activity than those assigned to groups whereall participants are of the same gender.The researcher must next identify and gain access to the
necessary dataset(s). Forming research-focused partnerships withindustry is a valuable source of data for academic researchers. Inestablishing industry collaborations, we begin by talking with thepotential partner to identify research goals that are of mutualinterest. Another important aspect is a data sharing agreement,which spells out the rights and responsibilities of both parties. Wehave found that having a template for the data sharing agreementhelps advance the collaboration. For example, our templateincludes a clause to allow for open publication of results, withattribution of the industry partner based on their preference, andwe have found that companies generally accept this. Table 1includes additional elements of our data sharing template. Thepartner must also ensure that the app’s or device’s terms ofservice permit data sharing for research, and the researcher mustacquire any necessary institutional review board approvals. Ethicalconcerns should also be considered. For example, GPS or otherlocation information should be obscured when possible (e.g.,Strava heat maps came under fire recently for accidentallyrevealing the location of secret military bases abroad32).In many cases it is helpful to combine multiple datasets. For
example, by combining data from Azumio’s activity tracking appwith the World Bank’s database of life expectancy by gender incountries around the world, we were able to show that whenwomen’s physical activity is reduced compared to men, their lifeexpectancy is also reduced compared to men in the same country(Fig. 3). In this analysis we could not link the data individually, butin some cases this linking is possible. For example, if the locationof an individual is known, you can link with weather databases toquantify how weather patterns affect an individual’s physicalactivity.18 Thus, new insights can be drawn by adding context tomeasurements from wearables (e.g., location information). Datacollected through more traditional research studies can alsocomplement datasets from commercial apps and wearables byhelping to demonstrate that a phenomenon of interest is presentacross multiple populations and measurement modalities. Thereare a number of publicly available datasets describing physicalactivity, other health behaviors, and health status indicators of
Table 1. Elements of a data sharing agreement with an app or wearable company
Data ownership The partner owns the dataset; the act of data sharing does not transfer that ownership to the researcher.
Scope of data use The researcher will use the dataset only for non-commercial research and education purposes.
Data access Access to the data within the researcher’s organization will be granted only on a need-to-have basis.
User anonymity The researcher will not use the data to try and identify and contact the users.
Publications The researcher has the right to publish the results with an attribution or not, as preferred by the partner, provided that the datacannot be reconstructed from the publication and that no partner’s commercial secrets are disclosed.
Licensing of results The partner has non-exclusive, royalty-free license to any results obtained from the data
Our data sharing agreement template typically includes some or all of the following elements. You should review your data sharing agreement with theappropriate officials at your institution
Fig. 2 Overview of best practices for analyzing large-scale physicalactivity and health behavior datasets from commercial smartphoneapps and wearable devices. The process is highly iterative, asindicated by the arrows flowing in both directions. By sharingresults, along with data and software tools, your work can helpinspire new research, completing the circle
J.L. Hicks et al.
4
npj Digital Medicine (2019) 45 Scripps Research Translational Institute

interest like disease status, weight, etc. We have compiled many ofthese.33
Before proceeding with your analysis, you should considerwhether your research question will be answerable given thelimitations of available data. In Steps 2–5, we will discussapproaches to assess and account for confounding, missing data,and selection bias, common challenges in analyzing data fromwearables. But before proceeding, you should make sure yourquestion and the challenges of the dataset do not set you up forfailure. For example, if sensor measurements are known to beimperfect, trends are often easier to study and gain confidence inthan absolute differences. Individuals from developing countriesand individuals with low socioeconomic status are underrepre-sented in many datasets; thus, questions focused on these groupsmay thus be better addressed with a different type of study.
Step 2: prepare the data for analysisThe next step is to prepare your data for analysis, defining andimplementing strategies to handle issues such as inaccuracies inthe sensor data, missing data, or outliers. The process of preparingyour data typically comprises several steps.Characterize the accuracy and precision of sensors and determine
if appropriate for your research question(s). You can use literaturethat describes sensor accuracy to determine if any wearables orapps used in the dataset have been previously validated.10,34,35 Ifexisting literature is insufficient, you should conduct independentexperiments to test accuracy. For example, you might need to testthe app or device in a new population of interest (e.g., individualswith osteoarthritis) or for a new health behavior/activity ofinterest. In some cases, if sensor accuracy is low, precision maybe sufficient (e.g., if trends are most important to your researchquestion).Define the population of interest and determine if the population
is sufficiently represented. The population you study is driven byyour research question (e.g., are you focusing on elderlyindividuals or obese individuals?). While, in relative terms, aparticular demographic subgroup may be underrepresented in adataset, in absolute terms the actual sample size of that subgroupmay be more than sufficient to answer useful questions of interest.For example, older adults may be underrepresented compared to
the general population, but if the sample size is still large (Fig. 4),this does not preclude you from researching relationships in thisgroup. If the goal is to answer a question about the generalpopulation, you may wish to resample to match the population ofinterest (e.g., to achieve a known gender ratio or distribution ofages). Alternate strategies to resampling are discussed in Step 5.Clean the data to remove outliers and erroneous values. Begin by
inspecting the data, examining the range of each value todetermine a definition for outliers. This is typically done at thediscretion of the researcher based on expected values (e.g., whatis a reasonable maximum body weight or steps taken in a day foran adult?) or by defining a threshold based on standard deviationsfrom the mean. Similarly, Helander et al.16 created thresholds forweight change between measurements to eliminate cases wheremultiple individuals used the same scale or the user weighed theirsuitcase. You should also examine the distribution of data, sincepeaks and discontinuities can reveal problems. For example,people might not change default values for height and weight inthe app. You should also ensure that all the data are in the sameunits and that the dataset does not include duplicate entries (e.g.,as performed in the work of Serrano et al.24,25).Characterize missing data, create thresholds for inclusion, and
define approaches for handling missing data. Data can be missingfor a variety of reasons; for instance, a day could be missing
Fig. 3 Difference in life expectancy as a function of the difference inactivity volume between females and males. When the gap in stepsbetween females and males gets smaller (i.e., less negative), femalesoutlive males by more years (using World Bank data65; grey line isLOESS fit; R2= 0.20). These results indicate that the reduced activitylevels recorded by women in countries with high activity inequalitymay have significant implications for health. (Plot shows countrieswith more than 1000 subjects from the Argus dataset described inour previous work.11)
Fig. 4 Comparison of demographics of U.S. users of a smartphoneand data from traditional surveillance studies. a Body Mass Index(BMI) distribution of users of the Argus app (blue) vs. the U.S.population as measured in the National Health and NutritionExamination Survey66 (NHANES; red). b Age distribution of users ofthe Argus app vs. NHANES. The counts for the NHANES sample areweighted according to the NHANES-provided sample weights, thusthe distributions approximate the general U.S. population and thetotal of the weighted counts in the histogram matches the numberof individuals in the 2011–2012 NHANES study year. While there aredifferences between the distributions, the app dataset, due to itsmassive size, has large coverage of users between the ages of 15and 70 and BMIs from 20 to 40. For example, the dataset includes32,000 individuals in the U.S. over age 60 and 113,000 individuals inthe U.S. whose BMI classifies them as obese
J.L. Hicks et al.
5
Scripps Research Translational Institute npj Digital Medicine (2019) 45

because the individual forgot her smartphone at home or an hourof recording could be missing because an individual did not wantto wear his activity tracker to a formal event. Users of apps canalso neglect to enter demographic information of interest, such asheight or weight.As a researcher, you should define thresholds for how much
health behavior data (e.g., activity or sleep) is required for a day orrecording session to be included for analysis, a user to beincluded, and a group of interest to be included. In some cases,the thresholds can be informed by the literature (e.g., manyaccelerometer studies of physical activity only use subjects with atleast three days of recordings based on an analysis by Tudor-Locke et al.36). If the literature does not provide guidance, youshould choose reasonable thresholds and ensure you reproduceknown trends (see Step 3) and conclusions are robust to decisionsmade (see Step 5). For example, in our study of activityinequality,11 we chose to include countries with at least 1000users, but found that moderate increases or decreases in thisthreshold did not affect the main conclusions of our work.We commonly want to examine health behavior data along
with demographics or other covariates. If your dataset issufficiently large and you can demonstrate that individuals withmissing demographic and other covariate data are the “same” asindividuals without missing data, you might require completecases for analysis. One approach for demonstrating two popula-tions are sufficiently similar in a set of relevant variables is to usestandardized mean difference (SMD). The SMD is defined as thedifference in the means of treated and control groups (in this case,missing and not missing data) divided by the overall standarddeviation.37 Covariates with absolute SMD lower than 0.25 areconsidered balanced. Note that SMD is preferred over hypothesistests and p-values as a measure of balance since the latter conflatechanges in balance with changes in statistical power. If there aredifferences between individuals or days with and without missingdata or the dataset is not large enough to support a complete caseanalysis, imputation can be used.38,39 Another approach isdescriptive analysis of the selection effect (i.e., quantifying thatsubjects with data were X much younger and Y more active thansubjects that were excluded for missing data).
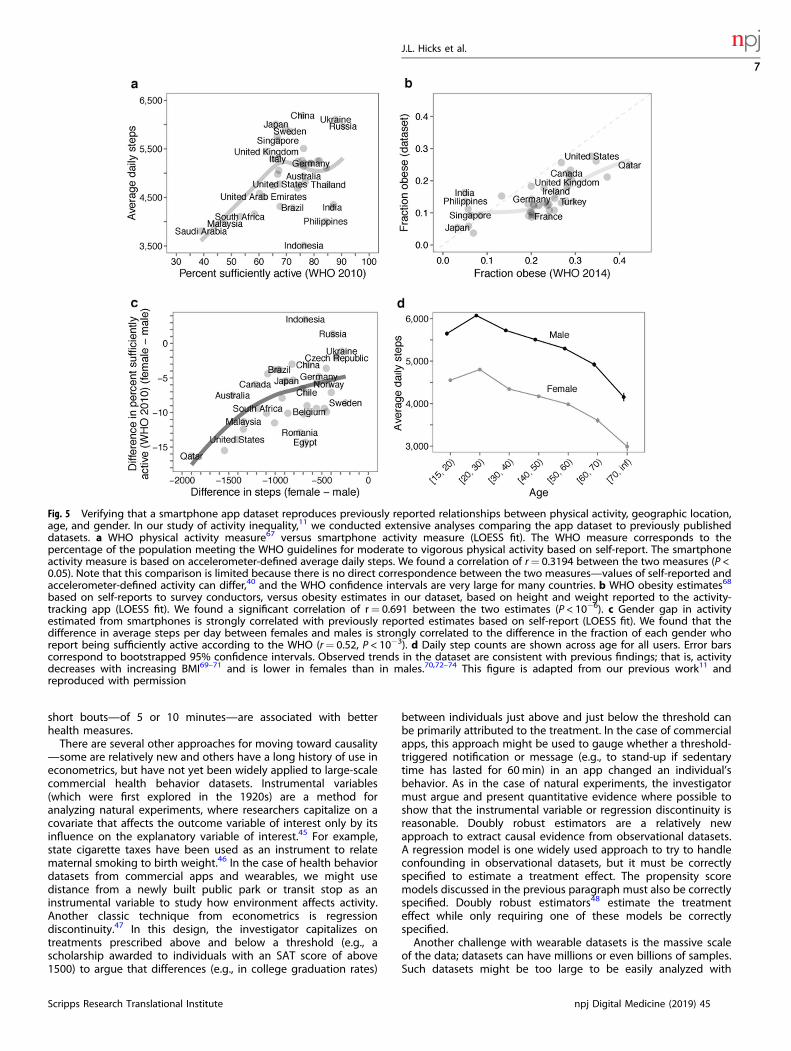
Step 3: verify that the datasets reproduce previously publisheddatasets and analysesNext, you must verify that your new dataset(s) are able toreproduce previous results. The aim here is to establishconvergent construct validity: are you measuring what you thinkyou’re measuring? You should review similar literature andpublicly available datasets that overlap with your dataset. If theliterature or analysis of gold-standard datasets point to consistentconclusions (e.g., about the relationships between gender andactivity and sleep), you should determine if your dataset producesthese same relationships. If this analysis identifies conflict, theremay be reasonable explanations for the difference. For example,traditional surveillance studies have their own limitations, such asbias due to self report,40 so comparing activity levels acrossdifferent age groups might show different magnitudes, but similartrends (Fig. 5). If comparison with previous results revealsdifferences, you may also need to reassess the parameters andthresholds determined in Step 2. You will also conduct sensitivityand robustness analysis after analyzing the data to answer yourresearch question of interest (Step 5).An orthogonal and equally important approach is showing
discriminant construct validity, where the aim is to demonstratethat your sensor or dataset does not measure things it shouldn’t.For example, in our analysis of the dataset from Azumio, weshowed that there was no correlation between the averagenumber of daily steps within a country and the average estimated
weartime.11 Thus our steps count was not erroneously measuringsimply how much individuals were using their phones.
Step 4: analyze the data to answer your (new) research questionThe focus of this paper is analyzing data that have already beencollected (i.e., observational data) and the topic of observationalstudy design has been reviewed (e.g.,41,42). Thus, we will highlightareas of relevance to health app and device datasets.One common goal and challenge in observational data analysis
(and all of science!) is moving beyond correlations and establish-ing causal relationships. In observational datasets collected fromcommercial apps and wearables, individuals are not assigned todifferent treatments (e.g., living in a city with high or lowwalkability) at random, as in randomized controlled trials. Instead,someone who is more motivated to be active may choose to livein a city that is more walkable. One approach to counter theconfounding this can create is to identify natural experiments inthe available data. In a natural experiment, the researcher finds acase or cases in the dataset where exposure to the treatment ofinterest is governed by circumstances that have not beenmanipulated by the researcher but can be argued to be random.While these natural experiments are rare and can be hard toidentify, the datasets from commercial apps and wearables arelarge enough that these “rare” occurrences happen in sufficientnumbers. For example, Althoff et al.19 used a delay in theacceptance of a friend request in a health app’s social networkfeature to separate the effects of increased intrinsic motivation tobe active from the boost in activity resulting from a new friendship(Fig. 6). Similarly, Aral and Nicolaides18 capitalized on globalweather variation and geographically distinct friendships to showthat exercise is contagious and the level of contagion varies basedon gender and relative levels of activity. Other natural experi-ments we might capitalize on are geographic relocation (e.g.,between cities with higher or lower walkability), transit strikes, orsudden changes in air quality. You must argue and present asmuch evidence as possible that your natural experimentapproximates random assignment. For example, in the study byAlthoff et al.19 they showed that 22 variables (e.g., age, BMI, andprevious activity levels) were balanced (SMD < 0.25) between thegroups with and without a delayed friend acceptance.Another approach to address the fact that exposure to different
“treatments” (e.g., levels of physical activity) is not assigned atrandom in observational datasets is to build and apply a modelthat estimates the propensity of an individual to receive treatmentbased on measured covariates. These propensity scores can beused for matching, stratification, weighting, or covariate adjust-ment.43 Propensity scoring is well-established in the case of binarytreatments (e.g., they match individuals in the “treatment”population to comparable individuals in the control population)and several papers review the topic.42–44 There is evidence that aweighting approach reduces bias when estimating treatmenteffects; however, along with covariate adjustment, weighting maybe more sensitive to whether the propensity model is correctlyspecified.43 In all cases, it is vital to assess whether the propensitymodel adequately achieves balance (e.g., using SMD) betweencovariates for the treated and untreated conditions.43 We havealso explored approaches for propensity weighting in the casewhere the treatment of interest comes in varying doses. Inparticular, we were interested in using data for the Argussmartphone app to understand how varying activity levels wererelated to BMI and other health indicators. Since app users whotake more and less steps are generally different in other ways thatmay also affect our outcome variables of interest, we extendedinverse probability of treatment weighting to estimate a dose-response relationship while controlling for these confoundingfactors (Fig. 7). With this analysis we found that longer bouts ofactivity are associated with lower BMI and that even relatively
J.L. Hicks et al.
6
npj Digital Medicine (2019) 45 Scripps Research Translational Institute
short bouts—of 5 or 10 minutes—are associated with betterhealth measures.There are several other approaches for moving toward causality
—some are relatively new and others have a long history of use ineconometrics, but have not yet been widely applied to large-scalecommercial health behavior datasets. Instrumental variables(which were first explored in the 1920s) are a method foranalyzing natural experiments, where researchers capitalize on acovariate that affects the outcome variable of interest only by itsinfluence on the explanatory variable of interest.45 For example,state cigarette taxes have been used as an instrument to relatematernal smoking to birth weight.46 In the case of health behaviordatasets from commercial apps and wearables, we might usedistance from a newly built public park or transit stop as aninstrumental variable to study how environment affects activity.Another classic technique from econometrics is regressiondiscontinuity.47 In this design, the investigator capitalizes ontreatments prescribed above and below a threshold (e.g., ascholarship awarded to individuals with an SAT score of above1500) to argue that differences (e.g., in college graduation rates)
between individuals just above and just below the threshold canbe primarily attributed to the treatment. In the case of commercialapps, this approach might be used to gauge whether a threshold-triggered notification or message (e.g., to stand-up if sedentarytime has lasted for 60min) in an app changed an individual’sbehavior. As in the case of natural experiments, the investigatormust argue and present quantitative evidence where possible toshow that the instrumental variable or regression discontinuity isreasonable. Doubly robust estimators are a relatively newapproach to extract causal evidence from observational datasets.A regression model is one widely used approach to try to handleconfounding in observational datasets, but it must be correctlyspecified to estimate a treatment effect. The propensity scoremodels discussed in the previous paragraph must also be correctlyspecified. Doubly robust estimators48 estimate the treatmenteffect while only requiring one of these models be correctlyspecified.Another challenge with wearable datasets is the massive scale
of the data; datasets can have millions or even billions of samples.Such datasets might be too large to be easily analyzed with
Fig. 5 Verifying that a smartphone app dataset reproduces previously reported relationships between physical activity, geographic location,age, and gender. In our study of activity inequality,11 we conducted extensive analyses comparing the app dataset to previously publisheddatasets. a WHO physical activity measure67 versus smartphone activity measure (LOESS fit). The WHO measure corresponds to thepercentage of the population meeting the WHO guidelines for moderate to vigorous physical activity based on self-report. The smartphoneactivity measure is based on accelerometer-defined average daily steps. We found a correlation of r= 0.3194 between the two measures (P <0.05). Note that this comparison is limited because there is no direct correspondence between the two measures—values of self-reported andaccelerometer-defined activity can differ,40 and the WHO confidence intervals are very large for many countries. b WHO obesity estimates68
based on self-reports to survey conductors, versus obesity estimates in our dataset, based on height and weight reported to the activity-tracking app (LOESS fit). We found a significant correlation of r= 0.691 between the two estimates (P < 10−6). c Gender gap in activityestimated from smartphones is strongly correlated with previously reported estimates based on self-report (LOESS fit). We found that thedifference in average steps per day between females and males is strongly correlated to the difference in the fraction of each gender whoreport being sufficiently active according to the WHO (r= 0.52, P < 10−3). d Daily step counts are shown across age for all users. Error barscorrespond to bootstrapped 95% confidence intervals. Observed trends in the dataset are consistent with previous findings; that is, activitydecreases with increasing BMI69–71 and is lower in females than in males.70,72–74 This figure is adapted from our previous work11 andreproduced with permission
J.L. Hicks et al.
7
Scripps Research Translational Institute npj Digital Medicine (2019) 45

standard desktop or laptop computers. Often, only a subset ofinput fields are relevant for the study. In those cases, the data canbe preprocessed with only the relevant fields being extracted,which can yield a significantly smaller dataset. If the resultingdataset is still too large for a personal computer, the next option isa large memory compute server. These computers offer similarcomputing environments and analysis tools (e.g., Python or R) aspersonal computers, and they can provide orders of magnitudemore main memory than personal computers. While an in-houselarge memory compute server might be prohibitively expensive,all major cloud providers offer on-demand machines with severalterabytes (TBs) of main memory, which is sufficient for all but thelargest datasets. If the dataset size exceeds even the capabilities ofthe large memory servers, then a distributed approach is needed,where multiple machines work together on a single task.Distributed approaches can be scaled up by adding more
machines to accommodate the size of the dataset being analyzed.These approaches require modifications to the analysis scripts andprograms to take advantage of the distributed capabilities.Common environments for distributed analysis are Hadoop49,50
and Spark,51,52 available as open source or commercial offeringsand supported by major cloud providers.
Step 5: check robustness of conclusionsYou must now determine whether your conclusions are robust.The goal in this step is to try to prove yourself wrong. You shouldidentify all the potential limitations and shortcomings of yourdataset and approach and test whether your conclusions are stillvalid. The essential tests should establish internal validity (i.e., areyour research design and methods sound?) and external validity(i.e., can your findings be generalized to other people and/or
Fig. 7 Example of propensity scoring to isolate the effects of a treatment that comes in different doses (physical activity) from otherconfounding factors. The Argus smartphone app (Azumio, Inc.) collects minute by minute step counts. a For each user, we can construct a plotof activity bout length (X) vs. the average number of minutes per day spent in activity of at least X minutes. We call the area under this curvean individual’s activity persistence. In the figure we include users with at least 10 days of step tracking data. b We next want to understandhow activity persistence influences quantities like BMI. Since individuals with higher or lower activity persistence may be different in otherways that influence BMI (such as age and gender), we used inverse probability of treatment weighting (IPTW) to isolate the effects of activity.The grey curve shows the BMI of individuals in each decile of activity persistence (where higher deciles indicate more bouts of longerduration), without any weighting. The green curve shows the relationship after we have used IPTW to minimize the influence of other factorslike age and gender on the estimated BMI for each decile of activity persistence. Error bars correspond to bootstrapped 95% confidenceintervals
Fig. 6 Example of a natural experiment using observational data from a smartphone app for tracking activity. The Argus smartphone app(Azumio, Inc.), includes a social network that users can opt to join. Althoff and colleagues19 sought to uncover if and how forming socialconnections affects social activity. Since users who join and are active in the social network may be more intrinsically motivated to increasetheir activity, they used a natural experiment to isolate the effects of social influence from other factors that could influence activity. Inparticular, they compared the change in activity between a individuals who sent out a friend request (question mark) that was immediatelyaccepted (check mark) and b individuals whose friend request was not accepted for more than 7 days. Note the curves in a and b are forillustrative purposes and do not represent actual subjects. Once a friendship is accepted, the user receives notifications of their connections’activities (e.g., going for a run), and can comment on their connections’ activity posts (denoted by the heart, text box, and notification bell ina and b). Since the two groups were similar in all aspects except whether their friend request was accepted within 7 days, the additionalincrease in activity of the direct acceptance group can be attributed to social influence. c This social influence resulted in users taking 400more steps per day on average. Error bars indicate bootstrapped 95% confidence intervals
J.L. Hicks et al.
8
npj Digital Medicine (2019) 45 Scripps Research Translational Institute

situations?). To establish internal validity, several questions mustbe addressed.Have you accounted for selection bias and confounding? If your
analysis aimed to establish a causal relationship, your study design(Step 4) should account for potential confounders, and anypotential unmeasured confounders should be acknowledged. Ifyour analysis involved mining the data for new clusters andcorrelations, it is vital to identify potential confounders anddetermine how they may have influenced the results. Forexample, say you find clusters of less engaged and highlyengaged app users and the highly engaged users show greaterweight loss. If the highly engaged users tend to be younger,without further analysis you cannot infer that engagement withthe app leads to weight loss.Have you accounted for any multiple hypothesis testing? Testing
multiple hypotheses increases the risk of Type I (false positive)errors and you must use an appropriate technique to account forthis. A simple approach is the Bonferroni correction, which adjuststhe study-wide significance level based on the number ofhypotheses tested. Benjamini and Hochberg53 also provide amethod for selecting a subset of rejected null hypotheses thatachieves a desired false discovery rate (where the false discoveryrate is the ratio of false positives to all positives). The secondapproach has greater power, but may increase the rate of falsepositives.54
Are any distributional or parametric assumptions valid? Para-metric statistical tests and many statistical models rely ondistributional or other assumptions. In some cases, theseassumptions are justified. In the app data we have analyzed, wehave found, for example, that steps per day tends to be similar toa normal distribution (with some truncation since steps per daycan’t be negative) and the number of connections in a socialnetwork to follow a power law distribution. If assumed distribu-tions do not hold in your data, you should choose non-parametrictests or be able to argue why your choice of test or model is stillreasonable (e.g., drawing on previous literature that shows non-normality is acceptable if sample sizes are large).Are your findings robust to analysis choices you made in Steps 2
and 5? In Step 2, you chose an approach to handle missing dataand outliers. You should verify that your conclusions are similar ifyou use another valid approach. For example, you could compareanalyses using complete case analysis to an imputation approach.You should also examine how removing and including outliersand varying thresholds for outliers affect your results.If conclusions are sensitive to an analysis choice or limitation of
your dataset, you may need to revisit your research questionbecause the limitations of the dataset may prevent answering it. Ifyou test new hypotheses, as pointed out above, you must takeprecautions against false discovery and p-hacking.55 Anotheroption is to find or collect additional data (e.g., you could collect asmall, targeted set of data prospectively).Alternately, if the sensitivity is minor or explainable, you can
report the sensitivity as a limitation when publishing results. Manyscientists are skeptical about using commercial app datasets andthis skepticism is merited. However, if sensitivities and limitationshave been thoroughly examined and documented, the inherent“messiness” of such datasets should not preclude their publica-tion. Traditional surveillance and experimental studies of healthbehaviors have limitations (e.g., small sample sizes and bias due toself-report), and consumer wearable and app data can comple-ment traditional approaches to move the field forward.To establish external validity, you must identify the populations
and situations to which your findings apply. Given the nature ofthe data from consumer wearables and apps, missing data iscommon, and since the population is typically a conveniencesample, it may not be a match to the population of interest. Forexample, one challenge of analyzing data from apps and
wearables is that the population of users is likely skewed towardsindividuals of higher socioeconomic status than the generalpopulation. In our study of activity inequality, we found thatwalkability was a key predictor of low activity inequality. We hadno way to measure the socioeconomic status of users; however,we were able to show that high city walkability was associatedwith low activity inequality across U.S. cities with a range ofmedian income levels (Fig. 8).Another useful technique for assessing the robustness and
usefulness of your results is to compare any models you have builtto a simple or null model. This comparison will help you assesswhether model predictive power is meaningful beyond simplerexplanations that are encoded in a null model. For example, in thecase of network analysis, the null model is a graph that is random,but maintains the structural features of your network. In a socialnetwork, where edges represent friendships, the edges can berewired randomly while preserving the degree of each node andthus the number of friends of each person.56 Comparing yourmodel to this null model will help you to assess whether modelpredictive power is meaningful or just a property of any similarrandom network.Examining p-values is a common approach in biomedical
research, but in very large datasets many relationships arestatistically significant. Even a relationship with a small effect sizecan have very low p-values in large samples. Thus, we find that“practical significance” often matters more. Even if a relationship isstatistically significant, is the effect size still large and meaningful?How much variance in the data is explained by a particularrelationship? These quantities should be reported in addition to,or even instead of, p-values. In the case where you are building apredictive model, cross-validation or other approaches to testingthe model on a reserved test or hold-out dataset (not used to trainthe model) should show, for example, sensitivity and specificityvalues that indicate the model will be useful in practice. Testing amodel on an entirely different dataset is rarely done but isvaluable for evaluating a model’s generalizability.
Fig. 8 Relationship between walkability and activity inequalityholds within cities in the USA of similar income. We found thatwalkability was associated with lower levels of activity inequality. Tohelp account for potential confounding due to socioeconomicfactors, we grouped the 69 cities in our analysis into quartiles basedon median household income (data from the 2015 AmericanCommunity Survey75). We found that walkable environments wereassociated with lower levels of activity inequality for all four groups(LOESS fit). The effect appears to be attenuated for cities in thelowest median household income quartile. These results suggestthat our main result—activity inequality predicts obesity and ismediated by factors of the physical environment—is independentof potential socioeconomic bias in our sample. This figure is adaptedfrom our previous work11 and reproduced with permission
J.L. Hicks et al.
9
Scripps Research Translational Institute npj Digital Medicine (2019) 45

Step 6: share resultsIn the final step, you should document the dataset, methods, andresults for publication, with the goal of adding to our knowledgeabout health behaviors and inspiring new research. You should beas transparent as possible, documenting limitations of youranalysis and describing all the analyses in Steps 2–5 to draw yourconclusions and establish their validity. In conjunction withpublication, we encourage researchers to share their models,software, datasets, and other digital resources wherever possible.You must consider what data is ethical to share publicly while stillprotecting the identity of users; in some cases, sharing aggregateddata is safest. Taking the extra time to fully document and shareyour approach, results, and code allows others to reproduce andextend your results, completing the circle of Fig. 2 and increasingthe impact of your research.
FUTURE RESEARCH: CHALLENGES AND OPPORTUNITIESAccess to data remains a significant barrier to research. Vastamounts of data have been and are being collected bysmartphones and wearables, but they are largely siloed atindividual companies. A few strategies might unlock more ofthese data for analysis by researchers to uncover new ways tomonitor and improve health. We encourage users to releaseanonymized data to advance research and, at minimum, thereshould be better means for users to download their own data anddonate it for research, if they wish to do so. Going a step further,researchers can also leverage the growing movement towardcitizen science, where researchers engage individuals in theprocess of collecting and analyzing data and then employing theresults to effect changes in their community.57 For example,Rodriguez and colleagues58 recently showed that using a citizenscience mobile app called the Discovery Tool (which allowsparticipants to take geo-coded photos and describe barriers toand enablers of healthy living in their local environments)increased engagement in a safe routes to school program alongwith rates of walking and biking to school. To protect user privacy,we need better standards and algorithms for anonymizing activitydata. Government, health care, academic, and industry partner-ships and consortiums around app and wearable data sharing andanalysis are also needed.The research community needs more gold-standard population
level data against which to compare. Initiatives like the UKBiobank59 have conducted large cohort studies that provide avaluable resource, including wearable data, along with medicalrecords, imaging, genome, and other measures. Another area ofinterest is identifying the relationships between activity, sedentarytime, and sleep over the full 24-hour day. Data from commercialapps and wearables could provide insights into these relation-ships, but better algorithms and sensors are needed to accuratelydifferentiate between these activities. Additionally, the researchcommunity needs transparency. Understanding how algorithmsare computing quantities of interest—like steps or activity counts—is vital for researchers to understand sensitivities and limitationsof their datasets. We encourage companies to share the details oftheir algorithms with researchers when possible.To both increase trust and continue to advance our knowledge,
we also need new methods for working with large-scaleobservational datasets. For example, natural experiments, instru-mental variables, and regression discontinuities are powerfulapproaches for helping establish causality, but their discoverylargely relies on the ingenuity of the research team. Approaches toautomatically identify these natural experiments60 could help usdiscover more insights about the many factors drive physicalactivity and health. We also need better tools to analyze andcommunicate uncertainty. For example, automated tools to screen
for potential confounding would be highly valuable. And in mostdatasets, there are many, or even infinite, choices for thresholds,tuning parameters, combinations of features, removing outliers,etc. These choices collectively span a “multiverse” of analyses61
and reflect “researcher degrees of freedom”.62 We need bettertools to quantify, communicate, and visualize this uncertainty.We hope there will continue to be new collaborations between
biomedical researchers and data scientists, where cross-disciplinary expertise is needed to tackle some key challenges.For example, “just-in-time” interventions, developed with insightsfrom health behavior change and data science experts, couldoptimize prompts and nudges for health behavior change at theindividual, group, and population levels. Collaboratively tacklingthese and other challenges will help commercial apps and deviceshave a sustained, positive impact on public health.
ACKNOWLEDGEMENTSWe thank Betsy Hicks and Lukasz Kidzinski for their assistance in creating Figs. 1 and4, respectively and Rachel Jackson for her helpful feedback on the manuscript. T.A., R.S., J.L.H., A.C.K., S.L.D. and J.L. were supported by a National Institutes of Health (NIH)grant (U54 EB020405, Mobilize Center, NIH Big Data to Knowledge Center ofExcellence). T.A. was supported by the SAP Stanford Graduate Fellowship. J.L.H. and S.L.D. were supported by grant P2C HD065690 (NIH National Center for Simulation inRehabilitation Research) and a grant from the Stanford Catalyst for CollaborativeSolutions Initiative. J.L. and R.S. were supported by the Stanford Data ScienceInitiative. J.L. is a Chan Zuckerberg Biohub investigator. A.C.K. was supported in partby The Robert Wood Johnson Foundation Grant ID#7334, National Cancer Institutegrants 5R01CA211048 and P20CA217199, National Institute of Diabetes and Digestiveand Kidney Diseases grant 5R01DK102016, the Nutrilite Health Institute WellnessFund provided by Amway to the Stanford Prevention Research Center, Silicon ValleyCommunity Foundation award #101518, a grant from the Discovery Innovation Fundin Basic Biomedical Sciences from Stanford University, and US Public Health ServiceGrant 1U54MD010724 (PI: M. Cullen).
AUTHOR CONTRIBUTIONSAll authors developed the concepts and issues presented in this paper. All authorsedited and reviewed the final manuscript; J.LH. prepared the manuscript.
ADDITIONAL INFORMATIONCompeting interests: P.K. and B.B. are co-founders, employees, and partial owners ofAzumio, Inc, a smartphone app for tracking activity and health. They donated data forindependent analysis and contributed to the article, as described above. J.L. is on thescientific advisory board of Azumio, Inc. The remaining authors declare no competinginterests.
Publisher’s note: Springer Nature remains neutral with regard to jurisdictional claimsin published maps and institutional affiliations.
REFERENCES1. Fox, S. Duggan, M. Tracking for health. Pew Research Internet Project (2013).
http://www.pewinternet.org/2013/01/28/tracking-for-health.2. Digital Health Market by Growth Prospects, Trends, Share, Growth, Forecast by
2017−2025. https://www.transparencymarketresearch.com/digital-health-market.html. Accessed 31 Oct 2018.
3. World Health Organization. Global recommendations on physical activity forhealth. (WHO, 2010).
4. Biswas, A. et al. Sedentary time and its association with risk for disease incidence,mortality, and hospitalization in adults: a systematic review and meta-analysis.Ann. Intern. Med. 162, 123–132 (2015).
5. St-Onge, M.-P. et al. Sleep duration and quality: impact on lifestyle behaviors andcardiometabolic health: a scientific statement from the american heart associa-tion. Circulation 134, e367–e386 (2016).
6. United Nations Secretary General. Prevention and control of non-communicablediseases. (United Nations, 2011).
7. Cadmus-Bertram, L. A., Marcus, B. H., Patterson, R. E., Parker, B. A. & Morey, B. L.Randomized trial of a Fitbit-based physical activity intervention for women. Am. J.Prev. Med. 49, 414–418 (2015).
J.L. Hicks et al.
10
npj Digital Medicine (2019) 45 Scripps Research Translational Institute

8. Wharton, C. M., Johnston, C. S., Cunningham, B. K. & Sterner, D. Dietary self-monitoring, but not dietary quality, improves with use of smartphone apptechnology in an 8-week weight loss trial. J. Nutr. Educ. Behav. 46, 440–444 (2014).
9. Bunn, J. A., Navalta, J. W., Fountaine, C. J. & Reece, J. D. Current state of com-mercial wearable technology in physical activity monitoring 2015–2017. Int. J.Exerc. Sci. 11, 503–515 (2018).
10. Evenson, K. R., Goto, M. M. & Furberg, R. D. Systematic review of the validity andreliability of consumer-wearable activity trackers. Int. J. Behav. Nutr. Phys. Act. 12,159 (2015).
11. Althoff, T. et al. Large-scale physical activity data reveal worldwide activityinequality. Nature 547, 336–339 (2017).
12. Atkinson, A. B. On the measurement of inequality. J. Econ. Theory 2, 244–263(1970).
13. Walch, O. J., Cochran, A. & Forger, D. B. A global quantification of “normal” sleepschedules using smartphone data. Sci. Adv. 2, e1501705 (2016).
14. Althoff, T., Horvitz, E., White, R. W. & Zeitzer, J. Harnessing the Web for Population-Scale Physiological Sensing: A Case Study of Sleep and Performance. In Proc. ofthe 26th International Conference on World Wide Web, 113–122 (InternationalWorld Wide Web Conferences Steering Committee, Perth, Australia, 2017).
15. Kim, K.-I. et al. Real world home blood pressure variability in over 56,000 indi-viduals with nearly 17 million measurements. Am. J. Hypertens. 31, 566–573(2018).
16. Helander, E. E., Wansink, B. & Chieh, A. Weight gain over the holidays in threecountries. N. Engl. J. Med. 375, 1200–1202 (2016).
17. Howell, P. D. et al. Analyzing Taste Preferences From Crowdsourced Food Entries.In Proc. of the 6th International Conference on Digital Health, 131–140 (ACM,Montreal, Quebec, Canada, 2016).
18. Aral, S. & Nicolaides, C. Exercise contagion in a global social network. Nat.Commun. 8, 14753 (2017).
19. Althoff, T., Jindal, P. & Leskovec, J. Online actions with offline impact: how onlinesocial networks influence online and offline user behavior. In Proc. Tenth ACMInternational Conference on Web Search and Data Mining, 537–546 (ACM, Cam-bridge, United Kingdom, 2017).
20. Shameli, A., Althoff, T., Saberi, A. & Leskovec, J. How Gamification Affects PhysicalActivity: Large-scale Analysis of Walking Challenges in a Mobile Application.In Proc. of the 26th International Conference on World Wide Web, 455–463(International World Wide Web Conferences Steering Committee, Perth, Australia,2017).
21. Wang, Z., Derr, T., Yin, D. & Tang, J. Understanding and Predicting Weight Losswith Mobile Social Networking Data. In Proc. of the 2017 ACM on Conference onInformation and Knowledge Management, 1269–1278 (ACM, Singapore, 2017).
22. Althoff, T., White, R. W. & Horvitz, E. Influence of Pokémon Go on physical activity:study and implications. J. Med. Internet Res. 18, e315 (2016).
23. Kurashima, T., Althoff, T. & Leskovec, J. Modeling Interdependent and periodicreal-world action sequences. In Proc. 2018 World Wide Web Conference, 803–812(International World Wide Web Conferences Steering Committee, Lyon, France,2018).
24. Serrano, K. J., Yu, M., Coa, K. I., Collins, L. M. & Atienza, A. A. Mining health appdata to find more and less successful weight loss subgroups. J. Med. Internet Res.18, e154 (2016).
25. Serrano, K. J., Coa, K. I., Yu, M., Wolff-Hughes, D. L. & Atienza, A. A. Characterizinguser engagement with health app data: a data mining approach. Transl. Behav.Med. 7, 277–285 (2017).
26. McConnell, M. V. et al. Feasibility of obtaining measures of lifestyle from asmartphone app: The MyHeart Counts Cardiovascular Health Study. JAMA Cardiol.2, 67–76 (2017).
27. Lin, Z., Althoff, T. & Leskovec, J. I’ll Be Back: On the Multiple Lives of Users of aMobile Activity Tracking Application. In Proc. 2018 World Wide Web Conference,1501–1511 (International World Wide Web Conferences Steering Committee,Lyon, France, 2018).
28. Park, K., Weber, I., Cha, M. & Lee, C. Persistent Sharing of Fitness App Status onTwitter. In Proc. 19th ACM Conference on Computer-Supported Cooperative Work &Social Computing, 184–194 (ACM, San Francisco, California, USA, 2016).
29. Sperrin, M. et al. Who self-weighs and what do they gain from it? A retrospectivecomparison between smart scale users and the general population in England. J.Med. Internet Res. 18, e17 (2016).
30. Nelson, M. B., Kaminsky, L. A., Dickin, D. C. & Montoye, A. H. K. Validity ofconsumer-based physical activity monitors for specific activity types. Med. Sci.Sports Exerc. 48, 1619–1628 (2016).
31. Rossouw, J. E. et al. Risks and benefits of estrogen plus progestin in healthypostmenopausal women: principal results from the women’s health initiativerandomized controlled trial. JAMA 288, 321–333 (2002).
32. Kwai, I. What he did on his summer break: exposed a global security flaw. TheNew York Times (2018). https://www.nytimes.com/2018/01/30/world/australia/strava-heat-map-student.html.
33. Mobilize Center. Data Sources, http://mobilize.stanford.edu/data-sources/.(Accessed 31 Oct 2018).
34. Case, M. A., Burwick, H. A., Volpp, K. G. & Patel, M. S. Accuracy of smartphoneapplications and wearable devices for tracking physical activity data. JAMA 313,625–626 (2015).
35. Shcherbina, A. et al. Accuracy in wrist-worn, sensor-based measurements of heartrate and energy expenditure in a diverse cohort. J. Pers. Med. 7, pii: E3 (2017).
36. Tudor-Locke, C. et al. How many days of pedometer monitoring predict weeklyphysical activity in adults? Prev. Med. 40, 293–298 (2005).
37. Stuart, E. A. Matching methods for causal inference: a review and a look forward.Stat. Sci. 25, 1–21 (2010).
38. Rubin, D. B. Multiple Imputation for Nonresponse in Surveys (Wiley, New York,1987).
39. Sterne, J. A. C. et al. Multiple imputation for missing data in epidemiological andclinical research: potential and pitfalls. BMJ 338, b2393 (2009).
40. Prince, S. A. et al. A comparison of direct versus self-report measures for assessingphysical activity in adults: a systematic review. Int. J. Behav. Nutr. Phys. Act. 5, 56(2008).
41. Rosenbaum, P. R. Observational Studies. (Springer, New York, 2002).42. Rosenbaum, P. R. & Rubin, D. B. The central role of the propensity score in
observational studies for causal effects. Biometrika 70, 41–55 (1983).43. Austin, P. C. An Introduction to propensity score methods for reducing the effects
of confounding in observational studies. Multivar. Behav. Res. 46, 399–424 (2011).44. Austin, P. C. & Stuart, E. A. Moving towards best practice when using inverse
probability of treatment weighting (IPTW) using the propensity score to estimatecausal treatment effects in observational studies. Stat. Med. 34, 3661–3679(2015).
45. Angrist, J. D. & Krueger, A. B. Instrumental variables and the search for identifi-cation: from supply and demand to natural experiments. J. Econ. Perspect. 15,69–85 (2001).
46. Permutt, T. & Hebel, J. R. Simultaneous-equation estimation in a clinical trial ofthe effect of smoking on birth weight. Biometrics 45, 619–622 (1989).
47. Imbens, G. W. & Lemieux, T. Regression discontinuity designs: a guide to practice.J. Econom. 142, 615–635 (2008).
48. Bang, H. & Robins, J. M. Doubly robust estimation in missing data and causalinference models. Biometrics 61, 962–973 (2005).
49. Apache Hadoop. Welcome to Apache Hadoop, https://hadoop.apache.org/. (2016).50. Shvachko, K., Kuang, H., Radia, S. & Chansler, R. The Hadoop Distributed File
System. In IEEE 26th Symposium on Mass Storage Systems and Technologies, 1–10(IEEE, Incline Village, Nevada, USA, 2010).
51. Apache Spark™ - Unified Analytics Engine for Big Data, https://spark.apache.org/.(Accessed 22 Oct 2018).
52. Zaharia, M. et al. Apache spark: a unified engine for big data processing. Com-mun. ACM 59, 56–65 (2016).
53. Benjamini, Y. & Hochberg, Y. Controlling the false discovery rate: a practical andpowerful approach to multiple testing. J. R. Stat. Soc. Ser. B Stat. Methodol. 57,289–300 (1995).
54. Shaffer, J. P. Multiple hypothesis testing. Annu. Rev. Psychol. 46, 561–584 (1995).55. Head, M. L., Holman, L., Lanfear, R., Kahn, A. T. & Jennions, M. D. The extent and
consequences of p-hacking in science. PLoS Biol. 13, e1002106 (2015).56. Newman, M. E. J. & Girvan, M. Finding and evaluating community structure in
networks. Phys. Rev. E Stat. Nonlin. Soft Matter Phys. 69, 026113 (2004).57. King, A. C., Winter, S. J., Chrisinger, B. W., Hua, J. & Banchoff, A. W. Maximizing the
promise of citizen science to advance health and prevent disease. Prev. Med. 119,44 (2018).
58. Rodriguez, N. M. et al. Enhancing safe routes to school programs throughcommunity-engaged citizen science: two pilot investigations in lower densityareas of Santa Clara County, California, USA. BMC Public Health 19, 256 (2019).
59. Sudlow, C. et al. UK biobank: an open access resource for identifying the causesof a wide range of complex diseases of middle and old age. PLoS Med. 12,e1001779 (2015).
60. Sharma, A., Hofman, J. M. & Watts, D. J. Split-door criterion: Identification of causaleffects through auxiliary outcomes. Ann. Appl. Stat. 12, 2699–2733 (2018).
61. Steegen, S., Tuerlinckx, F., Gelman, A. & Vanpaemel, W. Increasing transparencythrough a multiverse analysis. Perspect. Psychol. Sci. 11, 702–712 (2016).
62. Simmons, J. P., Nelson, L. D. & Simonsohn, U. False-positive psychology: undi-sclosed flexibility in data collection and analysis allows presenting anything assignificant. Psychol. Sci. 22, 1359–1366 (2011).
63. Choros Laboratory. ScapeToad—cartogram software, https://scapetoad.choros.ch.(Accessed 10 May 2017).
64. Sandvik, B. Thematic Mapping API World Borders Dataset, http://thematicmapping.org/downloads/world_borders.php. (Accessed 10 May 2017).
65. World Bank. Life expectancy at birth, male/female (years). http://data.worldbank.org/indicator/SP.DYN.LE00.MA.IN and http://data.worldbank.org/indicator/SP.DYN.LE00.FE.IN. (Accessed 10 May 2017).
J.L. Hicks et al.
11
Scripps Research Translational Institute npj Digital Medicine (2019) 45
66. Centers for Disease Control and Prevention (CDC). National Center for HealthStatistics (NCHS). National Health and Nutrition Examination Survey Data, https://wwwn.cdc.gov/nchs/nhanes/continuousnhanes/default.aspx?BeginYear=2011.(2011–2012).
67. World Health Organization. Prevalence of Insufficient Physical Activity amongAdults: Data by Country, http://apps.who.int/gho/data/node.main.A893?lang=en.(Accessed 19 May 2016).
68. World Health Organization. Obesity (Body Mass Index≥30) (Age-StandardizedEstimate): Estimates by Country., http://apps.who.int/gho/data/node.main.A900A?lang=en. (Accessed 19 May 2016).
69. Bassett, D. R. Jr., Wyatt, H. R., Thompson, H., Peters, J. C. & Hill, J. O. Pedometer-measured physical activity and health behaviors in U.S. adults. Med. Sci. SportsExerc. 42, 1819–1825 (2010).
70. Bauman, A. E. et al. Correlates of physical activity: why are some people physicallyactive and others not? Lancet 380, 258–271 (2012).
71. Van Dyck, D. et al. International study of objectively measured physical activityand sedentary time with body mass index and obesity: IPEN adult study. Int. J.Obes. 39, 199–207 (2015).
72. Hallal, P. C. et al. Global physical activity levels: surveillance progress, pitfalls, andprospects. Lancet 380, 247–257 (2012).
73. Troiano, R. P. et al. Physical activity in the United States measured by accel-erometer. Med. Sci. Sports Exerc. 40, 181–188 (2008).
74. Tudor-Locke, C., Johnson, W. D. & Katzmarzyk, P. T. Accelerometer-determinedsteps per day in US adults. Med. Sci. Sports Exerc. 41, 1384–1391 (2009).
75. United States Census Bureau. American Community Survey, http://www.census.gov/programs-surveys/acs/. (Accessed 5 Oct 2016).
Open Access This article is licensed under a Creative CommonsAttribution 4.0 International License, which permits use, sharing,
adaptation, distribution and reproduction in anymedium or format, as long as you giveappropriate credit to the original author(s) and the source, provide a link to the CreativeCommons license, and indicate if changes were made. The images or other third partymaterial in this article are included in the article’s Creative Commons license, unlessindicated otherwise in a credit line to the material. If material is not included in thearticle’s Creative Commons license and your intended use is not permitted by statutoryregulation or exceeds the permitted use, you will need to obtain permission directlyfrom the copyright holder. To view a copy of this license, visit http://creativecommons.org/licenses/by/4.0/.
© The Author(s) 2019
J.L. Hicks et al.
12
npj Digital Medicine (2019) 45 Scripps Research Translational Institute