STUDY ON MICRO-SCALE LANDFORM ANALYZING METHHOD BY USING ... · STUDY ON MICRO-SCALE LANDFORM...
5
STUDY ON MICRO-SCALE LANDFORM ANALYZING METHHOD BY USING LARGE-SCALE DEM DERIVED FROM AIRBORNE LIDAR DATA Habura Borjigin a , Haisheng Fan a , shintaro Goto a a Graduate School of Geo-environmental Science Rissho University , 1700 Magechi ,Kumagaya City,Saitama- [email protected] Commission VIII, WG VIII/8 KEY WORDS: Micro-scale landform, Large-scale DEM, LIDAR data, Terrain analysis ABSTRACT: This study proposed a method for micro-scale landform analysis using large-scale digital terrain model (DEM), which was derived from airborne LIDAR data. Other than common topography and watershed analysis using DEM, new method of cross-section curve analysis was developed and tested in this study, which aims to extract convex break and concave break points on the surface of large- scale of DEM. With extracted convex slope break lines and concave slope break lines, micro-scale landform units of study area, including crest slope, the upper side-slope, lower side-slope, head hollow, foot slope and channel-way, etc., were identified and classified successfully, which proved adaptation of the proposed method for micro-scale landform analysis over a large extent. 1. INTRODUCTION In the field of nature regeneration research, analysis on the relations among various geographical factors and local environmental factors is important. Up to now, in the field of micro-scale landform research, field survey and measurement method have been used to classify and identify micro-scale landform units (Ronald.Z 1965,Tamura 1969). Due to the lack of the large scale DEM, very limited achievements have been made in the quantitative and automatic analysis in this field. As new technique of remote sensing, the airborne laser imaging detection and ranging (LIDAR) technology provides a revolutionizing way to acquire large-scale DEM by allowing rapid and inexpensive measurements of topography over a large area (Sato, H.P2002, Mckean.J.,2004 , Mio.KASAI, Fan 2010). In this study, with aim of developing automatic interpretation model for the mountainous area, quantitative analysis method of micro-scale landform identification was discussed, which used large-scale DEM data divided from airborne LIDAR data. 2. STUDY AREA AND DATA 2.1 STUDY AREA This paper’s study area is located in undulating hill (HIKI Hill) covered by second-growth forest, which is mainly composed of Quercus serrata (deciduous broad-leaf), Pinus densiflora (conifer). Within the study area, terrain slope varies between 0~60 degrees, with elevation variation up to 75.51 meters. In this study, watershed area was selected as test site, which is shown in Figure 1. 2.2 LIDAR DATA The LIDAR data of study area was collected by an airborne LIDAR mapping system mounted to a Cessna 404 aircraft at December 25, 2006. Collected LIDAR data includes two returns for each laser pulse, which were assigned with name of “first pulse” and “last pulse” according to reception sequence. Each measurement contains attributes of its 3D location (x, y, z). Sample of LIDAR data is shown in Figure 2. Figure 1. Overview of study area (Iwadono Forest Park, Higashi-matsuyama City, Saitama Pref.) Figure2. Cross-section sample of LIDAR data * Composition of Terrain Map and IKONOS colour Image Legend Study area Cross-section line Height (m) Dist. On Line (m) a a' a a' International Archives of the Photogrammetry, Remote Sensing and Spatial Information Science, Volume XXXVIII, Part 8, Kyoto Japan 2010 893
Transcript of STUDY ON MICRO-SCALE LANDFORM ANALYZING METHHOD BY USING ... · STUDY ON MICRO-SCALE LANDFORM...

STUDY ON MICRO-SCALE LANDFORM ANALYZING METHHOD BY USING LARGE-SCALE DEM DERIVED FROM AIRBORNE LIDAR DATA
Habura Borjigin a, Haisheng Fana, shintaro Goto a
a Graduate School of Geo-environmental Science Rissho University , 1700 Magechi ,Kumagaya City,Saitama-
Commission VIII, WG VIII/8
KEY WORDS: Micro-scale landform, Large-scale DEM, LIDAR data, Terrain analysis ABSTRACT: This study proposed a method for micro-scale landform analysis using large-scale digital terrain model (DEM), which was derived from airborne LIDAR data. Other than common topography and watershed analysis using DEM, new method of cross-section curve analysis was developed and tested in this study, which aims to extract convex break and concave break points on the surface of large-scale of DEM. With extracted convex slope break lines and concave slope break lines, micro-scale landform units of study area, including crest slope, the upper side-slope, lower side-slope, head hollow, foot slope and channel-way, etc., were identified and classified successfully, which proved adaptation of the proposed method for micro-scale landform analysis over a large extent.
1. INTRODUCTION
In the field of nature regeneration research, analysis on the relations among various geographical factors and local environmental factors is important. Up to now, in the field of micro-scale landform research, field survey and measurement method have been used to classify and identify micro-scale landform units (Ronald.Z 1965,Tamura 1969). Due to the lack of the large scale DEM, very limited achievements have been made in the quantitative and automatic analysis in this field.
As new technique of remote sensing, the airborne laser imaging detection and ranging (LIDAR) technology provides a revolutionizing way to acquire large-scale DEM by allowing rapid and inexpensive measurements of topography over a large area (Sato, H.P2002, Mckean.J.,2004 , Mio.KASAI, Fan 2010).
In this study, with aim of developing automatic interpretation model for the mountainous area, quantitative analysis method of micro-scale landform identification was discussed, which used large-scale DEM data divided from airborne LIDAR data.
2. STUDY AREA AND DATA
2.1 STUDY AREA
This paper’s study area is located in undulating hill (HIKI Hill) covered by second-growth forest, which is mainly composed of Quercus serrata (deciduous broad-leaf), Pinus densiflora (conifer). Within the study area, terrain slope varies between 0~60 degrees, with elevation variation up to 75.51 meters. In this study, watershed area was selected as test site, which is shown in Figure 1. 2.2 LIDAR DATA
The LIDAR data of study area was collected by an airborne LIDAR mapping system mounted to a Cessna 404 aircraft at December 25, 2006. Collected LIDAR data includes two returns for each laser pulse, which were assigned with name of “first pulse” and “last pulse” according to reception sequence. Each measurement contains attributes of its 3D location (x, y, z). Sample of LIDAR data is shown in Figure 2.
Figure 1. Overview of study area (Iwadono Forest Park, Higashi-matsuyama City, Saitama Pref.)
Figure2. Cross-section sample of LIDAR data
* Composition of Terrain Map and IKONOS colour Image Legend Study area Cross-section line
Height (m)
Dist. On Line (m)
a
a'
a
a'
International Archives of the Photogrammetry, Remote Sensing and Spatial Information Science, Volume XXXVIII, Part 8, Kyoto Japan 2010
893

2.3 TS measurement
In this study, total station (TS) was used to collect reference data for assessing the accuracy of the LIDAR-derived DEM. Collected terrain survey data (587 points) is shown in Figure 3.
Figure 3. Distribution of TS measurements
2.4 DEM derived from LIDAR data
By using TS measurement (587 points) as reference data, (altitude) error of DEM (grid size = 1m), which was generated from LIDAR data, was summarized. The error histogram is shown in Figure 9.
With RMSE(Z) of 0.413m and STD(Z) of 0.396m, derived DEM can meet the requirements of national cartography standard on large-scale terrain mapping. For example, the national standard for terrain map with scale of 1/2500 is
]66.0,66.0[ mmSTDZ �� , which means that it is possible to generate DEM with large scale (up to 1/2500) by using airborne LIDAR data. And such large-scale DEM can meet requirements for micro-scale landform analysis.
*Grid size of DEM: 1m
*Using TS measurement as check points *Diff. = ZLIDAR-ZTS
Figure 4. Error Histogram of DEM
3. METHOD OF MICRO-SCALE LANDFORM ANALYSIS
Flow-chart of micro-scale landform analysis using DEM is shown in Figure 5. Key procedures of data processing are as follows.
(1) Generation of intersection curves of terrain elements, which include elevation, slope angle and moving-slope-difference (MSD, discussed in more detail later in this paper). (2) Detection of topographic changing points.
(3) Identification of micro-scale landform.
Figure 5. Flow-chart of data processing The details of the main processing steps shown in Figure 5 are described as follows. 3.1 Generation of section lines
Firstly, by utilizing GIS software’s hydrological analysis function, channel ways within target area were generated. Secondly, radial section lines were drawn with channel ways as central lines (see Figure 6), with the range from the bottom of the valley to the ridge.
Figure 6. Section lines along slope’s inclining direction 3.2 Intersection curves of terrain elements
As shown in Figure 7, intersection lines of various terrain elements, which include elevations, slopes and MSD, were derived along the above defined section lines upon terrain surface.
TS points (within woods) TS points (within park)
RMSE= 0.413m STD = 0.396m Mean =-0.117m
Num. Of Check points
Diff. (m)
DEM
Detection of topographic changing points
Generation of convex slope break lines and concave slope break lines
Terrain Analysis Hydrological Analysis
Map of Slope
Hydrographic map
Intersection curve generation of various terrain elements
Section lines
Curve of Height Curve of Slope Curve of MSD
Identification & Classification of micro-scale landform units
International Archives of the Photogrammetry, Remote Sensing and Spatial Information Science, Volume XXXVIII, Part 8, Kyoto Japan 2010
894

(a) Section line
(b) Intersection curves along section line
Figure 7. Intersection lines of elevation, slope and MSD
Concerning the definition of “moving-slope-difference
(MSD)”, description on this terrain parameter is as follows. MSD is calculated as the difference between maximum slope
and minimum slope within certain range along section line. Formula of MSD is as below.
)()(iii RRR SMinSMaxD �� (1)
Range Ri in above formula is defined in Figure 8. In each
range, Max(SRi) and Min(SRi), which stand for maximum and minimum slope within range Ri respectively, are derived for calculating DRi , the maximum difference of slope within range Ri. sample of derived MSD curve is shown In Figure 7. * Length of range (L): 3-6 meters
Figure 8. Definition of moving range along section line
3.3 Detection of topographic changing point
In this study, as a key step toward micro-scale landform classification, topographic changing points along each section line, which include convex points and concave points, were identified by referring to intersection curves of previously defined terrain elements (including elevation, slope and MSD, see Figure 7).
The convex points are the locations between the mountain ridge and the mountain root, where slope changes remarkably. On the other hand, those locations with near-zero curvature are taken as concave points.
In this study, following methods are proposed for extracting topographic changing points along section line.
(a) Method for identifying topographic changing points First of all, topographic changing points are extracted by
following conditions.
MSDP TMSC �
By applying above condition, locations with their MSD value more than specified threshold value (TMSD) are extracted as topographic changing points (PTC), which will be further classified as follows.
(b) Method for identifying convex points Topographic changing points (PTC) which meet below
conditions are identified as convex points.
min__max__ convexslopePconvexslope TSlopeT ��
(c) Method for identifying concave points
On the other hand, topographic changing points (PTC) which meet below conditions are labelled with concave points.
concaveslopeP TSlope _�
Sample of extracted convex points and concave points is shown in Figure 9. 3.4 Convex break line and concave break line
By joining convex points and concave points (see Figure 9) within same elevation zone respectively, convex break lines and concave break lines in study area were generated. See Figure 12.
Convex point concave point
Figure 9. convex points and concave points on the section lines
With the aid of above convex break line and concave break
line, which were derived from large-scale DEM, it is possible to classify and identify micro-scale landform units in study area.
Distance along section line (m)
International Archives of the Photogrammetry, Remote Sensing and Spatial Information Science, Volume XXXVIII, Part 8, Kyoto Japan 2010
895
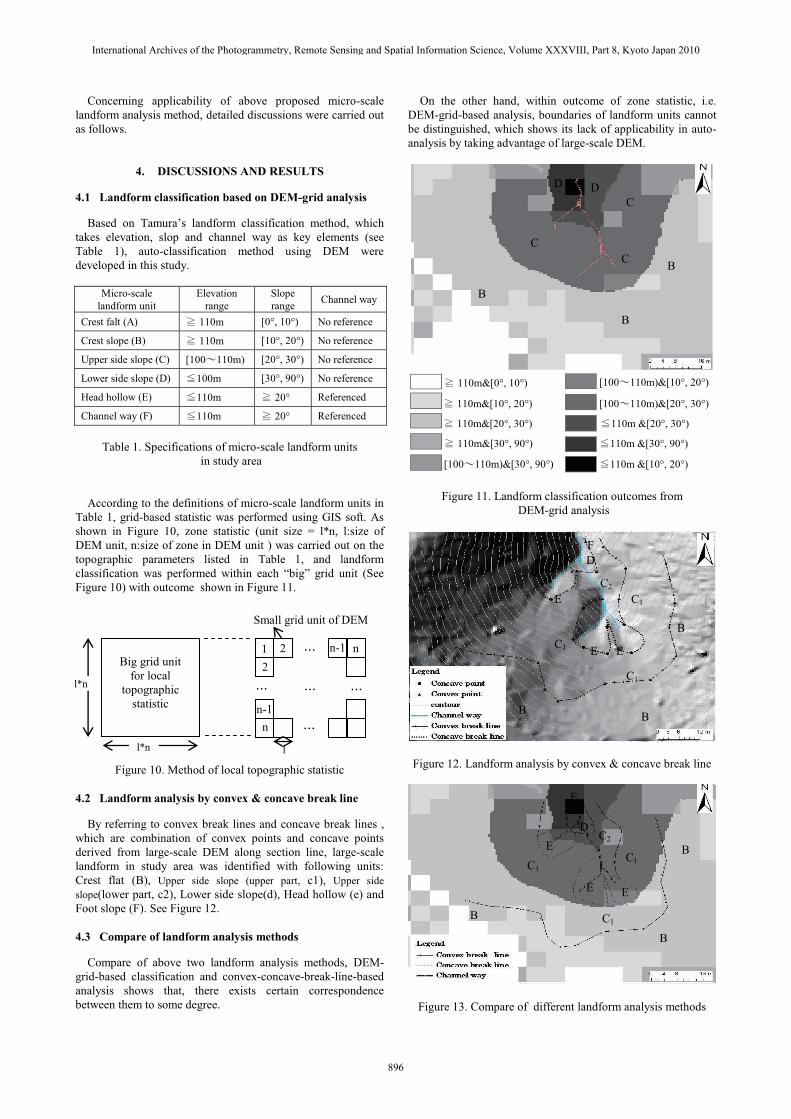
Concerning applicability of above proposed micro-scale landform analysis method, detailed discussions were carried out as follows.
4. DISCUSSIONS AND RESULTS
4.1 Landform classification based on DEM-grid analysis
Based on Tamura’s landform classification method, which takes elevation, slop and channel way as key elements (see Table 1), auto-classification method using DEM were developed in this study.
Micro-scale
landform unit Elevation
range Slope range Channel way
Crest falt (A) 110m [0°, 10°) No reference
Crest slope (B) 110m [10°, 20°) No reference
Upper side slope (C) [100 110m) [20°, 30°) No reference
Lower side slope (D) 100m [30°, 90°) No reference
Head hollow (E) 110m 20° Referenced
Channel way (F) 110m 20° Referenced
Table 1. Specifications of micro-scale landform units in study area
According to the definitions of micro-scale landform units in Table 1, grid-based statistic was performed using GIS soft. As shown in Figure 10, zone statistic (unit size = l*n, l:size of DEM unit, n:size of zone in DEM unit ) was carried out on the topographic parameters listed in Table 1, and landform classification was performed within each “big” grid unit (See Figure 10) with outcome shown in Figure 11.
Figure 10. Method of local topographic statistic 4.2 Landform analysis by convex & concave break line
By referring to convex break lines and concave break lines , which are combination of convex points and concave points derived from large-scale DEM along section line, large-scale landform in study area was identified with following units: Crest flat (B), Upper side slope (upper part, c1), Upper side slope(lower part, c2), Lower side slope(d), Head hollow (e) and Foot slope (F). See Figure 12. 4.3 Compare of landform analysis methods
Compare of above two landform analysis methods, DEM-grid-based classification and convex-concave-break-line-based analysis shows that, there exists certain correspondence between them to some degree.
On the other hand, within outcome of zone statistic, i.e. DEM-grid-based analysis, boundaries of landform units cannot be distinguished, which shows its lack of applicability in auto-analysis by taking advantage of large-scale DEM.
Figure 11. Landform classification outcomes from DEM-grid analysis
Figure 12. Landform analysis by convex & concave break line
Figure 13. Compare of different landform analysis methods
...
...
... ... ...
Big grid unit
for local topographic
statistic
Small grid unit of DEM
l*n
l*n
1 2 n-1 n 2
n-1 n
l
B B
B C1
C1
C1
C2
D
E E
E
F
B
B
B
C
C
C
D D
B
B
B C1
C1
C1
C2 D
E E
E
F
110m&[0°, 10°)
110m&[10°, 20°)
110m&[20°, 30°)
110m&[30°, 90°)
[100 110m)&[30°, 90°)
[100 110m)&[10°, 20°)
[100 110m)&[20°, 30°)
110m &[20°, 30°)
110m &[30°, 90°)
110m &[10°, 20°)
International Archives of the Photogrammetry, Remote Sensing and Spatial Information Science, Volume XXXVIII, Part 8, Kyoto Japan 2010
896

5. SUMMARY
In this study, large-scale DEM derived from airborne LIDAR data was firstly used for micro-scale landform analysis, with the aim to developing auto-analyzing algorithm and processing model for micro-landform survey. And, new method for extracting convex & concave break lines, the key topographic features for micro-scale landform, were developed by taking advantage of large-scale DEM.
By comparing outcomes from DEM-grid-based classification, which adopted conventional field-survey algorithm, and convex-concave-break-line-based analyzing method proposed in this paper, good possibility was verified for its application in micro-scale landform analysis over a large extent.
ACKNOWLEDGMENTS
This research was supported by the “Regional Use of Geo-Informatics and its application to the environmental education” (FY2002-FY2009, Project leader: Prof. Shintaro Goto, Rissho University) of the “Open Research Center” Project of Ministry of Education, Culture, Sports, Science and Technology (MEXT).
REFERENCS
Ronald.Z.,WHIPKEY,1965,Subsurface stormflow from forested slopes(1), Hydrological Sciences Journal,10(2):74-85
Tamura ,T. ,1969.A series of micro-landform units composing valley heads in the hills near Sendai, Sci.Rep.Tohoku Univ,Ser, 7 (19): 111-127·
Tamura ,T.,Takeuchi.K,1980.Land characteristics of the hills of Japan and their modification by man-with special reference to a few cases in the Tama Hill,west of Tokyo,Geogr.Rep.Tokyo Metropol.Univ,14(15):223-242
Sato, H.P., Hasegawa, H., Okamatsu, K., Masaharu, H.,2002, Landslide topography measurement by airborne laser scanning. Proceedings of International Symposium on Landslide Risk Mi-tigation and Protection of Cultural and Natural Herit-age,UNESCO and Kyoto University, Kyoto, Japan, 375-383.
Mckean.J.,Roering.J.,2004 Objective landslide detection and surface morphology mapping using high-resolution airborne laser altimetry, Geomorphology,57,331-351
Mio.Kasai,Manabu.Ikeda,Kazunori.Fisawa,Masayuki.Msatsuda,Yusuke.Suzuki,2008,Observation of the landslide development process by analysis of LiDAR-derived DEMs,Journal of the Japan Landslide Society ,45(2):118-124
Haisheng.Fan,Jianqiao.Li, Habura.Borjigin,Shintaro.Goto,2010, Determination of large-scale digital elevation model in wooded area with airborne LiDAR data by applying adaptive quadtree-based iterative filtering method, Bulletin of geo-environmental science, Bulletin of geo-environmental science, Rissho University
International Archives of the Photogrammetry, Remote Sensing and Spatial Information Science, Volume XXXVIII, Part 8, Kyoto Japan 2010
897