Benefits of CMMI Within the Defense Industry · Purpose of Presentation Present new evidence about...
25
Benefits of CMMI Within the Defense Industry © 2010 Carnegie Mellon University Software Engineering Institute Carnegie Mellon University Pittsburgh, PA 15213 May 2010
Transcript of Benefits of CMMI Within the Defense Industry · Purpose of Presentation Present new evidence about...

Benefits of CMMI Within the Defense Industry
© 2010 Carnegie Mellon University
Industry
Software Engineering InstituteCarnegie Mellon UniversityPittsburgh, PA 15213
May 2010

This work was created in the performance of Federal Government Contract Number FA8721-05-C-0003 with Carnegie Mellon University for the operation of the Software Engineering Institute, a federally funded research and development center. The Government of the United States has a royalty-free government-purpose license to use, duplicate, or disclose the work, in whole or in part and in any manner, and to have or permit others to do so, for government purposes pursuant to the copyright license under the clause at 252.227-7013.
This Presentation may be reproduced in its entirety, without modification, and freely distributed in written or electronic form without requesting formal permission. Permission is required for any other use. Requests for permission should be directed to the Software Engineering Institute at [email protected].
2© 2010 Carnegie Mellon University
NO WARRANTY
THIS MATERIAL OF CARNEGIE MELLON UNIVERSITY AND ITS SOFTWARE ENGINEERING INSTITUTE IS FURNISHED ON AN “AS-IS" BASIS. CARNEGIE MELLON UNIVERSITY MAKES NO WARRANTIES OF ANY KIND, EITHER EXPRESSED OR IMPLIED, AS TO ANY MATTER INCLUDING, BUT NOT LIMITED TO, WARRANTY OF FITNESS FOR PURPOSE OR MERCHANTABILITY, EXCLUSIVITY, OR RESULTS OBTAINED FROM USE OF THE MATERIAL. CARNEGIE MELLON UNIVERSITY DOES NOT MAKE ANY WARRANTY OF ANY KIND WITH RESPECT TO FREEDOM FROM PATENT, TRADEMARK, OR COPYRIGHT INFRINGEMENT.

Outline
• Introduction
• Benefits of CMMI Implementation
– Quantitative
– Qualitative
• Looking Ahead
• Summary
3© 2010 Carnegie Mellon University
This report was created with the cooperation of the Systems Engineering Division (SED) of the National Defense Industrial Association (NDIA) and their member companies and DoD organizations.

Purpose of Presentation
Present new evidence about effective implementations of CMMI
• Examples are provided by the defense industrial base and DoD organizations.
• New examples are based upon the measures that practicing organizations use to track value to their businesses.
• Examples are provided by organizations that have tracked and measured performance improvements from using CMMI over many years.
4© 2010 Carnegie Mellon University
• Many of the organizations emphasize high maturity results and show that they enabled superior performance.
• Their data indicate why CMMI is important to the DoD & its suppliers.
The new data presented in this report demonstrates that effective implementation of good practices aided by use of CMMI can improve cost, schedule, and quality performance.

CMMI: Major Benefits to DoD
“Does CMMI work?” We asked our nation’s defense contractors, as well as government agencies, to share results from their performance improvement efforts using CMMI. The results spoke for themselves: “Yes, CMMI works!”
The following slides include information from six defense organizations that responded.*
5© 2010 Carnegie Mellon University
*Results reported in this presentation are not attributed to protect confidentiality.

Background on the Data for this PresentationOrganizational and project leaders decided which measures were most useful to them when tracking the results of CMMI-based improvements.
A common thread was their interest in measuring the effect CMMI had on schedule, effort and cost, and quality.
The summarized results demonstrate the wide scope of business values
6© 2010 Carnegie Mellon University
The summarized results demonstrate the wide scope of business values and goals of the participating organizations.
The source studies in this presentation used current data as follows:
• 2010: Organizations 1, 2A, 3, & 6
• 2009: Organizations 5 & 7
• 2008: Organization 2B

Quantitative Measures: SchedulePerformance Results Summary
We all do!
Measure Used By The Organization Performance Result
On-time deliverables (Organization 2a)
On-time deliverable increase of 4.9% (organization went from 95% to 99.9% of projects delivered on time)
Earlier Defect Detection and Repair (Organization 1)
6.35 times less defect discovery and repair hours after start of system testing; potential savings of 5 – 6.5 months in schedule delay after system tests begin
7© 2010 Carnegie Mellon University
We all do!schedule delay after system tests begin for average sized project
Schedule performance index (Organization 7)
Increased from .78 to .93 over three years (a 19.2% improvement in estimation and execution of schedule)

Quantitative Measures: Effort (Rework) and Cost Performance Results Summary
We all do!
Measure Used By The Organization Performance Result
Total hours for defect repair (Organization 1) 58% fewer hours needed to repair defects for ML5 versus ML3; Result: a potential cost savings of $1.9 to $2.3 M per average-sized project (defined as 233 KESLOC [Kilo Equivalent Source Lines of Code])
Hours per KLOC to find and fix defects for CMMI ML5 relative to the SW-CMMI ML3 baseline (Organization 6)
Defect find and fix cost down 22%
8© 2010 Carnegie Mellon University
We all do!Effort hours needed to repair high severity defects in integration and test phases (Organization 4)
24% reduction in effort hours per defect
Cost performance index (Organization 4) Increased from .88 to .96 over two years
Overhead rates for CMMI ML5 relative to the SW-CMMI ML3 baseline (Organization 6)
Reduced by 7.3%
Software development cost for CMMI ML5 relative to the SW-CMMI ML3 baseline (Organization 6)
Reduced by 28%

Selected Results: High Maturity ReducesCosts for Repair (Organization 1)
High Maturity Projects Discover defects earlier
Early detection and repair lowers Costs
57.7% fewer hours for ML5 projects expended to repair defects versus ML3
10
5.1
18
2.5
120
140
160
180
200
Average Hours per Defect per Phase
Maturity Level 3
Maturity Level 5
57.7% Fewer Hours
Overall for ML 5
88.6 fewer
hours in
9© 2010 Carnegie Mellon University
defects versus ML3
105.3 fewer hours per defect • 88.6 fewer hours during
Testing alone• When largest risk to
schedule occurs
7.9
47
.3
22
.1
9.3
35
.7
16
.5
15
.7
77
.2
-
20
40
60
80
100
Req & Design Code & UT Sys & Acpt Test Post Delivery Total Hours
Saves 105.3
hours per
defect
hours in
Testing
9

24,496
42,519
25,000
30,000
35,000
40,000
45,000
Hours to Repair Defects (by Phase)
(233 KESLOC Avg Project)
Maturity Level 3
Maturity Level 5
57.7% fewer hours (24,527)
expended for ML 5
6.35 times (20,641 hrs) less
Selected Results: Effort to Repair Defectsby Phase (Organization 1)
10© 2010 Carnegie Mellon University
1,846
11,022
5,155
2,177
8,309
3,855 3,651
17,992
-
5,000
10,000
15,000
20,000
Req & Design Code & UT Sys & Acpt Test Post Delivery Total Hours
risk of Cost or Schedule
impact late in program
Potential Cost Savings From $ 1.9 M to $2.3 M per average sized program

Quantitative Measures: Quality Performance Results Summary
We all do!
Measure Used By The Organization Performance Result
Defect density by severity, ML5 compared to ML3 (Organization 1)
62.5% fewer high-severity defects with ML5 projects
Defect density in circuit board design (Organization 2a)
65% improvement
Defect containment by phase(Organization 3)
The fix of defects within the phase they were injected increased by 240%
11© 2010 Carnegie Mellon University
We all do!(Organization 3) they were injected increased by 240%
Defect containment, ML5 compared to ML3, by phase per KLOC (thousands of lines of code) (Organization 2b)
Defect containment improved 13%
User acceptance test defects per KLOC (Organization 7)
Less than 0.15 defects per KLOC
% of defects removed prior to system test (Organization 7)
>85%
Selected Results: Quality Performance (Organization 3)
12© 2010 Carnegie Mellon University

Quantitative Measures: Productivity Results Summary
We all do!
Measure Used By The Organization Performance Result
Productivity Gain with ML5 (Organization 1)
42% gain with ML5 organizational practices over 9 years
Organizational productivity vs. Galorath SEER SEM Estimation Model (Organization 1)
Production hours reduction: 33.0% at ML3; 37.4% at ML5
Productivity for CMMI ML5 relative to the Productivity up 25.2%
13© 2010 Carnegie Mellon University
We all do!Productivity for CMMI ML5 relative to theSW-CMM ML3 baseline (Organization 6)
Productivity up 25.2%

0.80
1.00
1.20
1.40
1.60
Productivity Gain with Long Term ML 5
42% Gain with ML 5
Organizational Practices
Average project size was 233 KESLOC
Largest = 1,360 KESLOCSmallest = 29 KESLOC
Selected Results: Software Productivity(Organization 1)
14© 2010 Carnegie Mellon University
0.00
0.20
0.40
0.60
0.80
9 Year ML5 Org Other Projects
Average customer project savings due to increased productivity • Equivalent of 406 work months per project (33.8 work years)

Quantitative Measures: Customer Satisfaction Results Summary
We all do!
Measure Used By The Organization Performance Result
Award fee (used as an indicator of customer satisfaction) for CMMI ML5 relative to the SW-CMM ML2 baseline (Organization 6)
50% of potential additional award fee achieved
Cost savings to customer in a cost-plus Rose from 5.7 M to 7.1 M (25%)
15© 2010 Carnegie Mellon University
We all do!Cost savings to customer in a cost-plus contract (Organization 1)
Rose from 5.7 M to 7.1 M (25%)

Selected Results: Award Fee (Organization 6)
Potential Additional Award Fee Available
50% of Potential Additional Award FeeAchieved
16© 2010 Carnegie Mellon University
Customer Satisfaction Continues to ImproveCustomer Satisfaction Continues to Improve
SW CMM L2 SW CMM L3 SW CMM L4 SW CMM L5 CMMI L5 CMMI L5
Percent
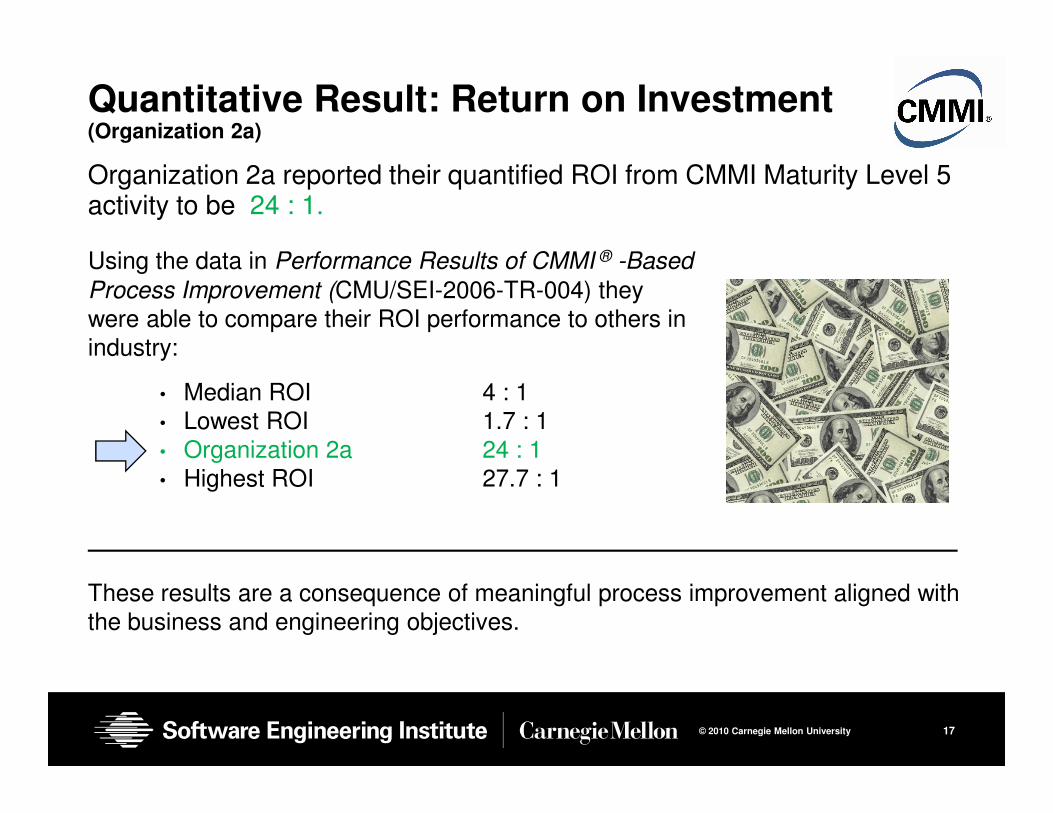
Quantitative Result: Return on Investment (Organization 2a)
Organization 2a reported their quantified ROI from CMMI Maturity Level 5 activity to be 24 : 1.
Using the data in Performance Results of CMMI ® -Based
Process Improvement (CMU/SEI-2006-TR-004) they were able to compare their ROI performance to others in industry:
• Median ROI 4 : 1
17© 2010 Carnegie Mellon University
These results are a consequence of meaningful process improvement aligned with the business and engineering objectives.
• Lowest ROI 1.7 : 1• Organization 2a 24 : 1• Highest ROI 27.7 : 1

• Reduced overtime and less intense pressure
• Clear roles and responsibilities for
CMMI Provides Many QualitativeBenefits as Well*
Organizations also gathered various qualitative measures to compliment their quantitative measurements. They found qualitative benefits such as:
• Improved program insight,control, and tracking
• Reduced training: process
18© 2010 Carnegie Mellon University
• Clear roles and responsibilities for business execution
• Common language (i.e., defined processes, measures) across business units
• Decrease in replanning
• Products with lower levels of defects and lower risk; one organization offers a lifetime warranty on products
• Reduced training: process documentation enables knowledge transfer to new generation of workers
• Process transformation (via consistency, integration, coordination)
• Personnel retention and job satisfaction
*based on published benefits from a wide variety of organizations

The Bottom Line
Why improve processes? - Because processes are the foundation for all other business improvements, and critical for
• lasting improvements• successful technology insertion
If a performance management system is not in use, leadership is unaware of what is and is not working.
19© 2010 Carnegie Mellon University
CMMI is a proven approach to performance management – with more than a decade of results showing it does work.
Organizations have provided data that shows CMMI
• enables the delivery of lower-defect products, with predictable cost, schedule, and quality
• improves business performance
• serves as competitive discriminator

Results Depend on Implementation
Simply deciding to “do CMMI” is not enough to achieve benefits.
Defining good processes, using them, measuring the results, and making improvements based on what you learn are all key to reaping the benefits described in this presentation.
The CMMI models are a foundational part of a comprehensive approach
20© 2010 Carnegie Mellon University
The CMMI models are a foundational part of a comprehensive approach to process improvement that helps organizations understand
• why they should improve
• what frameworks and tools would best fit their needs
• how to implement them

Recent Research on CMMI: Just the Tipof the Iceberg!
21© 2010 Carnegie Mellon University

CMMI Research - References
Bibliographic information cited in this presentation:
•Gibson, Diane; Goldenson, Dennis R.; and Kost, Keith.Performance Results of CMMI-Based Process Improvement (CMU/SEI-2006-TR-004). Pittsburgh, PA: Software Engineering Institute, Carnegie Mellon University, August 2006.
Journal Issue: “Performance Results from Process Improvement.” SoftwareTech News. Vol. 10, Number 1. March 2007.
Goldenson, Dennis R. and Gibson, Diane L. Demonstrating the Impact and Benefits of CMMI®: An Update and Preliminary Results. (CMU/SEI-2003-SR-009). Pittsburgh, PA: Software Engineering Institute, Carnegie Mellon University, October 2003.
Journal Issue: “CMMI: Getting a Handle on Process.” CrossTalk. Vol. 23, Number 1. Jan/Feb 2010.
22© 2010 Carnegie Mellon University
Herbsleb, James D.; Carleton, Anita; Rozum, James A.; Siegel, Jane; and Zubrow, David. Benefits of CMM-Based Software Process Improvement: Initial Results* (CMU/SEI-94-TR-013). Pittsburgh, PA: Software Engineering Institute, Carnegie Mellon University, August 1994. (*Also see SEI Special Report: Benefits of CMM-Based Software Process Improvement: Executive Summary of Initial Results, CMU/SEI-94-SR-013)
Stoddard II, Robert W. and Goldenson, Dennis R. Approaches to Process Performance Modeling: A Summary from the SEI Series of Workshops on CMMI High Maturity Measurement and Analysis (CMU/SEI-2009-TR-021). Pittsburgh, PA: Software Engineering Institute, Carnegie Mellon University, January 2010.
Jones, Capers. Assessment and Control of Software Risks. Upper Saddle River, NJ: Prentice-Hall, 1994 (ISBN 0-13-741406-4).
Website about CMMI at the Software Engineering Institute: <http://www.sei.cmu.edu/cmmi/index.cfm>
Looking AheadThe road ahead for CMMI implementation
• A continued focus on high maturity
More and more organizations are striving for and achieving high maturity – and are collecting data demonstrating the benefits. Once at ML 4 or 5, organizations must maintain their focus on good implementation practices for continuous improvement.
• Implementation of CMMI for Services (CMMI-SVC)
CMMI-SVC extends the benefits of CMMI to a new audience. Service providers can use the model concept that has proven useful in the development community to specifically address their interests and concerns.
• Implementation of CMMI for Acquisition (CMMI-ACQ)
23© 2010 Carnegie Mellon University
• Implementation of CMMI for Acquisition (CMMI-ACQ)
CMMI-ACQ helps organizations improve relationships with their suppliers and improve acquisition processes. The model can enable increased control of projects, better management of global sourcing of products and services, and more successful acquisition solutions.
• Integration with other improvement paradigms (TSP, ISO, Lean Six Sigma)
Organizations are finding that integrated improvement initiatives can produce outstanding results. Choosing CMMI doesn’t mean discontinuing improvement efforts already in place or avoiding new ones that show promise.

Summary
• Many stakeholders are involved in the development and maintenance of CMMI models, with participants from commercial industry, government, and the DoD. Broad adoption has occurred worldwide. Adopters range from small and midsize organizations (these are the majority) to large and very large organizations.
• Organizations that provide products and services to the DoD use CMMI to improve programs, systems, product and service management, systems and software engineering, work processes, and training solutions.
24© 2010 Carnegie Mellon University
• Quantitative and qualitative results have been documented by defense contractors and others, as shown in this report. There is a great deal of additional data showing the benefits of CMMI from a broad range of industries, including banking and finance, manufacturing, medical, and others.
• CMMI enables performance improvement focused on business objectives, but the level of success depends on the implementation.

Who Benefits from CMMI Today?
We all do!
25© 2010 Carnegie Mellon University
We all do!