
Behavior-Aware Decision Support Systems LDRD Final...
85
SANDIA REPORT SAND2007-7665 Unlimited Release Printed November 2007 Behavior-Aware Decision Support Systems LDRD Final Report George A. Backus, David R. Strip, Brooke N. Chenoweth, Gary B. Hirsch (Consultant), Jack Homer (Consultant) Prepared by Sandia National Laboratories Albuquerque, New Mexico 87185 and Livermore, California 94550 Sandia is a multiprogram laboratory operated by Sandia Corporation, a Lockheed Martin Company, for the United States Department of Energy’s National Nuclear Security Administration under Contract DE-AC04-94AL85000. Approved for public release; further dissemination unlimited.
Transcript of Behavior-Aware Decision Support Systems LDRD Final...

SANDIA REPORT SAND2007-7665 Unlimited Release Printed November 2007
Behavior-Aware Decision Support Systems
LDRD Final Report George A. Backus, David R. Strip, Brooke N. Chenoweth, Gary B. Hirsch (Consultant), Jack Homer (Consultant) Prepared by Sandia National Laboratories Albuquerque, New Mexico 87185 and Livermore, California 94550 Sandia is a multiprogram laboratory operated by Sandia Corporation, a Lockheed Martin Company, for the United States Department of Energy’s National Nuclear Security Administration under Contract DE-AC04-94AL85000. Approved for public release; further dissemination unlimited.
2
Issued by Sandia National Laboratories, operated for the United States Department of Energy by Sandia Corporation. NOTICE: This report was prepared as an account of work sponsored by an agency of the United States Government. Neither the United States Government, nor any agency thereof, nor any of their employees, nor any of their contractors, subcontractors, or their employees, make any warranty, express or implied, or assume any legal liability or responsibility for the accuracy, completeness, or usefulness of any information, apparatus, product, or process disclosed, or represent that its use would not infringe privately owned rights. Reference herein to any specific commercial product, process, or service by trade name, trademark, manufacturer, or otherwise, does not necessarily constitute or imply its endorsement, recommendation, or favoring by the United States Government, any agency thereof, or any of their contractors or subcontractors. The views and opinions expressed herein do not necessarily state or reflect those of the United States Government, any agency thereof, or any of their contractors. Printed in the United States of America. This report has been reproduced directly from the best available copy. Available to DOE and DOE contractors from U.S. Department of Energy Office of Scientific and Technical Information P.O. Box 62 Oak Ridge, TN 37831 Telephone: (865) 576-8401 Facsimile: (865) 576-5728 E-Mail: [email protected] Online ordering: http://www.osti.gov/bridge Available to the public from U.S. Department of Commerce National Technical Information Service 5285 Port Royal Rd. Springfield, VA 22161 Telephone: (800) 553-6847 Facsimile: (703) 605-6900 E-Mail: [email protected] Online order: http://www.ntis.gov/help/ordermethods.asp?loc=7-4-0#online

3
SAND2007-7665 Unlimited Release
Printed November 2007
Behavior-Aware Decision Support Systems
LDRD Final Report
George A. Backus, Brooke N. Chenoweth Exploratory Simulation Technologies Department
David R. Strip
Discrete Math and Complex Systems
Gary B. Hirsch (Consultant) CI Modeling and Simulation II Department
Sandia National Laboratories
PO Box 5800 Albuquerque, NM 87185-0370
Jack Homer (Consultant)
Homer Consulting http://www.angelfire.com/biz2/HomerConsulting/
Abstract As Sandia National Laboratories serves its mission to provide support for the security-related interests of the United States, it is faced with considering the behavioral responses that drive problems, mitigate interventions, or lead to unintended consequences. The effort described here expands earlier works in using healthcare simulation to develop behavior-aware decision support systems. This report focuses on using qualitative choice techniques and enhancing two analysis models developed in a sister project.

4

5
Table of Contents
Abstract ....................................................................................................................... 3 Chapter 1: Introduction ............................................................................................... 7 Chapter 2: Analysis of Behavioral Choices ............................................................... 9 Chapter 3: Cardiovascular Disease Population Model Description (Version 1.1) .. 17 Chapter 4: Summary ................................................................................................. 29 References................................................................................................................. 31 Appendix A: A Data Sources and Analysis for Calibration of Cardiovascular Disease Population Model ........................................................................................ 33 Appendix B: CVD Model Equations (VENSIM Format)......................................... 45
Figures Figure 2.1 Technology Choice.................................................................................. 10 Figure 2.2 Participation and Occurrence .................................................................. 10 Figure 2.3 Intervention Relationships....................................................................... 10 Figure 2.4 Intervention Pushback Dynamics ............................................................ 11 Figure 2.5 Participation Relationships...................................................................... 11 Figure 2.6 Healthcare Information Flows................................................................. 12 Figure 2.7 Participation Tests ................................................................................... 14 Figure 3.1 Stock and flow structure differentiating population by disease status .... 15 Figure 3.2 Model Information and Patient Flows..................................................... 16 Figure 3.3 Acute Attacks under Policy Interventions............................................... 23 Figure 3.4 Deaths from Accute Attacks under Policy Interventions ........................ 24

6

7
Chapter 1: Introduction Agent-based simulations of behavior may be useful to various national security planning scenarios, such as, the dynamics of evacuations, the growth of insurgencies, and the behavior of terrorists. Individual software agents could represent the behavior of individuals, companies, governments, and so on, capturing complex dynamics. For example, it could be used to simulate intervention dynamics that might mitigate (or make worse) the growth in insurgency activities. We have used recently developed, but established, methods in economics that capture decisions based on preferences, in addition to those associated with financial rewards. In this context, economic decision making produces the most fundamental actions that underlie large-scale population dynamics. These methods, when converted to algorithms, are implemented in our existing OMEGA-SIM application platform that has the capability to accommodate these agent-based simulation innovations and system dynamics. The economic behavior integrates the qualitative choice theory of Daniel McFadden (McFadden 1974, 1982, 2000), the asymmetric risk work of J. Stiglitz (1986) and the cointegration work of Clive Granger (Granger 1987, 1991). We proposed to develop, implement, and test a complex interdependent economic application using system dynamics and agent-based techniques. To test this capability, we needed to use unclassified, but extensive, data sets that detail physical conditions, economic options, and the realized decisions. We wanted the test case to allow for the creation of generalized algorithms that will broadly apply to many national-security, policy-analysis decisions. The U.S. healthcare system has all the required qualities and provides the best available, unclassified data set for ensuring the statistical rigor and validation within the model development process. Joint efforts at SNL with the University Of Texas LBJ School Of Public Policy and the University of Pennsylvania Leonard David Institute indicate the possibility for developing a Policy Consequence Evaluation (simulation) system for assisting decision-making. The system would include the cascading affects of policy across geographical regimes, as driven by physical constraints, financial/economic markets, and human behavior. The generalized system should have wide applicability to national assessment and security analyses. Issues of importance to national security, whether they relate to terrorism or healthcare, need to consider the behavioral and societal impacts of interventions. Without including behavioral responses, it is impossible to determine the future cost or consequence of policy initiatives. Decision makers in government, industry, NGOs, or as individuals must be able to anticipate the outcomes of competing proposals such that they can weigh the costs and benefits of the available alternatives and select the option that best meets the decision criteria.

8
A sister project notes the initial model development (Backus 2007a). This part of the study uses actual SNL employee data to estimate and test Qualitative Choice Theory methods within a policy assessment framework.1 The detail of that analysis is described in Backus 2007b. The utilization of that information within the policy testing model noted in Backus 2007a is described in Chapter 2. In this work, the CVD model noted in Backus 2007a was also enhanced to more fully capture the impacts of CVD interventions. That work is described here in Chapter 3.
1 The use of the data and the analysis process were reviewed and approved by the Human Studies Board.

9
Chapter 2: Analysis of Behavioral Choices The policy testing model described in Backus 2007a simulates the demographic, health, and economic impacts of the U.S. national population. Part of the simulation focuses on the choice to participate in programs, such as those associated with prevention, if the government (or employer) subsidized the medical cost. To a large extent, this is the same logic that would apply to insurance coverage. For this specific effort, the anonymized SNL employee data on health plan selection were used to develop parameters for the model. The results indicate how an actual representative population makes healthcare choices. As part of the study reported in Backus 2007b, this information may be useful to SNL and the Lockheed Martin Corporation management as they design the health plans of the future. The decision within and among agents are based on the newly developed methods of qualitative choice theory (QCT) - that realistically capture the filtering of information and the stochastic character of human decision making (Ben-Akiva 1985, McFadden 2000, Train 1986). Cointegration, like QCT, can use historical data to determine universally valid structures and processes within systems, while delineating those responses that appear to have unpredictable variation. Cointegration (along with subject matter experts) defines the relationships within the system. QCT and expectation formation define the responses those relationships cause. (These methods are more fully described in Backus 2006). In simulations that use data for which the underlying laws (such as physical laws) are unknown, cointegration helps define the causality and determines the state variables that reflect the system dynamics within the model. All mathematical integrations inherently represent cointegration processes. (Granger 1991; Engle 1987; Hendry 1993, 1995) QCT helps recognize the probabilistic, imperfect, and uncertain nature of decision making that reflect the current understanding of economic processes. (Stiglitz 1986) The basis of QCT is the called the Random Utility Model (RUM). It asserts that all entities make the best perceived choice -- rational or irrational -- given current perceptions. As such QCT representations and results are intuitively understandable with real-world correspondence, and can include beliefs, preferences, and filtering of facts. More importantly, the equations and parameters are as appropriate for representing individuals (using a probabilistic interpretation) as that they are for representing groups (using a fractional share interpretation). As a consequence, QCT is useful for describing interacting individual, group, and societal responses. Starting with a generalized extreme-value distribution, the resulting integration over all possible choice generates the equation below:
∑=J
jninin UUP1
)exp(/)exp(

10
Where “P” is the probability of an individual (n) selecting a specific choice (i), among a set of choices (J), based on perceived Utility (U). Figure 2.1 provides an example set of distributions for three choices (that in this case are only a function of Price). The distribution represents the perceptions that any one individual may have for the prices of the three choices. Visually, most individuals would select the first technology (Blue). A small share would select the second technology where the overlap could cause it to be perceived as less expensive than the first technology. This area is bounded by the left-hand red and blue curves. Lastly, the area bound by the blue and green curve denotes that area where a few individuals would perceive the third technology as the best choice.
Figure 2.1 Technology Choice. While there are formal methods to determine the functional form of the ordinal utility (Keeney 1993), analysis and experimentation determined that the form shown below accurately captures the information available within the data set.
∑+=k
ikikiin XBAU1
Where “A” and “B” are estimated constants and the “X” are a set “k” of information metrics that might influence the decision. The “B” are a function of the distribution variance (Fig. 2.1), where a wider variance means a reduced (in this example) price sensitivity. Figure 2.2 depicts the model’s process, whereby interventions and nature act to affect medical conditions. For preventative interventions (or simply the utilization of

11
insurance programs), participation is the choice of the individual. For the analysis here, that choice is simply assumed to be the consequence of cost and (static) non-cost factors.
Figure 2.2 Participation and Occurrence. The initiation of an intervention generally causes the reallocation of resources and suffers from start-up problems. The resulting dynamics are reflected as change-pushback -- that may have both physical and behavior components. Figure 2.3 illustrates the relationships that affect the dynamic responses. The noted delays occur through integrative filtering as prescribed by cointegration methods.
Figure 2.3 Intervention Relationships.
Occurrence of Condition
Participation Impact
Natural Risk
Income
Standard Care
Enhanced Intervention (Policy)
Probability of Condition
Occurrence of Condition
Probability of Condition: Technical Policy
Potential Impact
Resources Technical Impact
Indicated Impact
Delay
Change Pushback
Change Resistance
Impact on Probability of Outcome
Delay
12
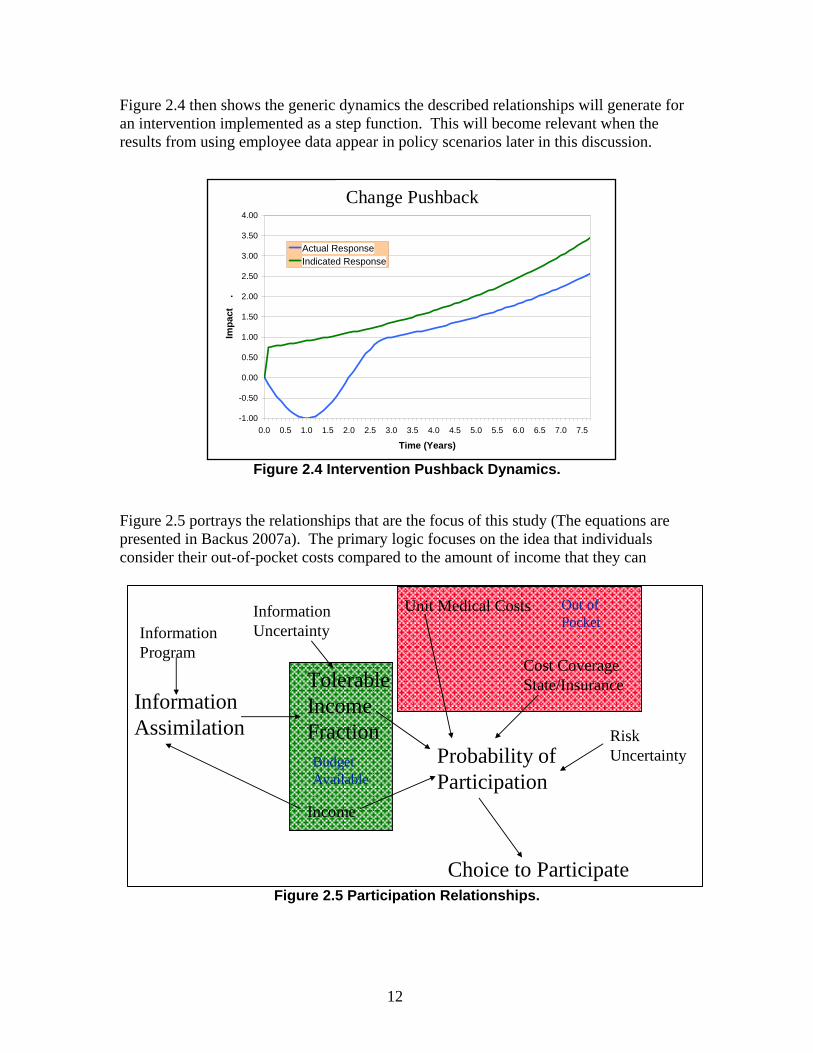
Figure 2.4 then shows the generic dynamics the described relationships will generate for an intervention implemented as a step function. This will become relevant when the results from using employee data appear in policy scenarios later in this discussion.
Figure 2.4 Intervention Pushback Dynamics.
Figure 2.5 portrays the relationships that are the focus of this study (The equations are presented in Backus 2007a). The primary logic focuses on the idea that individuals consider their out-of-pocket costs compared to the amount of income that they can
Figure 2.5 Participation Relationships.
Tolerable Income Fraction
Income
Information Program
Information Assimilation
Probability of Participation
Choice to Participate
Unit Medical Costs
Cost Coverage State/Insurance
Risk Uncertainty
Information Uncertainty
Out of Pocket
Budget Available
Change Impacts
-1.00
-0.50
0.00
0.50
1.00
1.50
2.00
2.50
3.00
3.50
4.00
0.0 0.5 1.0 1.5 2.0 2.5 3.0 3.5 4.0 4.5 5.0 5.5 6.0 6.5 7.0 7.5
Time (Years)
Impa
ct
.
Actual ResponseIndicated Response
Change Pushback

13
allocate to a budget item (in this instance, medical expenses). If the government or insurance interventions reduced the apparent out-of-pocket costs, it is hypothesized that more people would participate in prevention (or insurance) programs. To test this hypothesis, to simulate the impact of intervention, and to utilize a realistic parameterization, data from SNL employee healthcare decisions acted as a representative population from which to derive the information. Figure 2.6 shows the actual flow of information associated with the specific healthcare choice of interest in this study.
Figure 2.6 Healthcare Information Flows.
The solid lines indicate actual information flows for which data exist. The dashed lines reflect feedback flows that are important in the long-term and for the general population, but that are not part of this analysis. Data exist for nearly 15,000 employees, retirees, and survivors currently covered by SNL insurance programs. The employee data available for every participant included information on:
• Plan type (including waiver of coverage) • Coverage (Single, dual, children, family) • Category (Employee, retiree, survivor) • Union status • Salary tier • Regular/Temporary status • Age and Gender • 2006 plan-choice • Marital/Partner status • Zip code • Health expenses (Rx/Med/Total) for each employee and dependents • Plan costs • Deductibles per plan • Maximum Out-of-pocket cost per plan
Choice and Probability Of Insurance
Drug Co-pay Options
MedicalCo-pay Options
Insurance Options Premiums
Probability of Insurance
Expected Ins. Costs
Income
Selected Insurance
Healthcare
Employer
Uncertainty/ Preferences

14
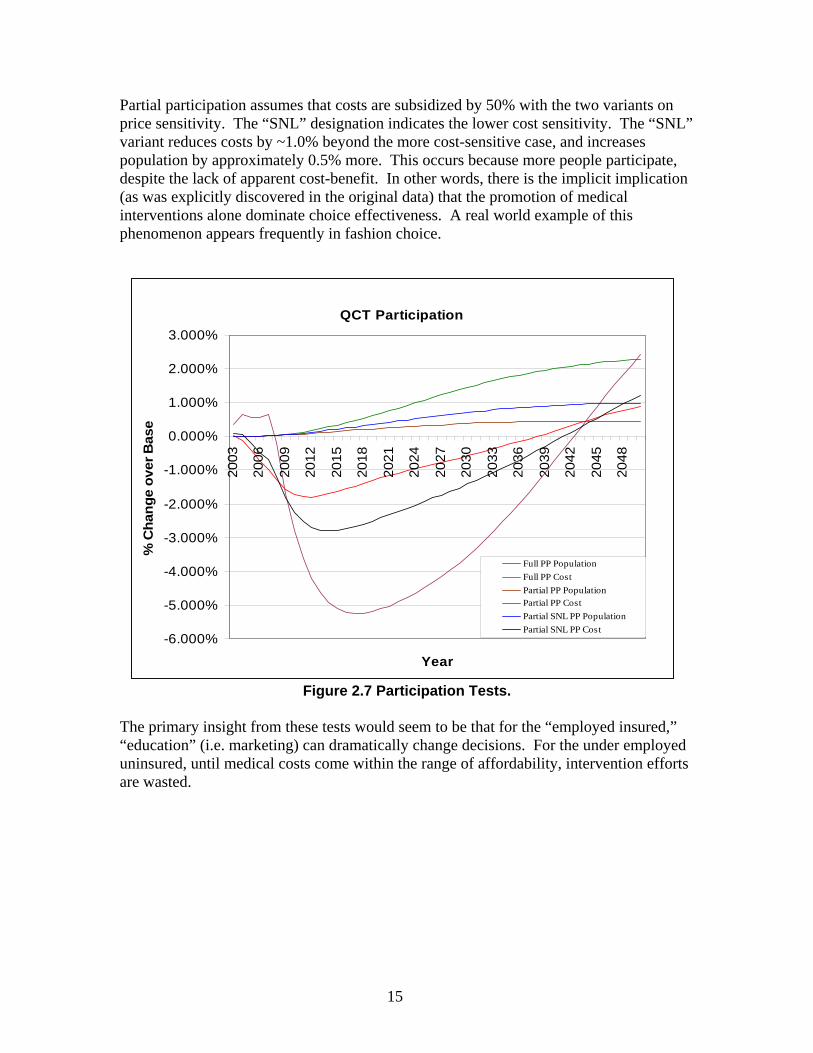
The results of the data incontrovertibly showed that only the rationalization of previous decisions for renewing employees, and the perceived choices of associates for new employees, drove over 95% of the decision process (possibly as much as 99% of it). Costs, age, gender, nor anything else had any significant affect -- other than for minor nuances of narrowly defend choices. (Because the specific plan-choices are irrelevant to this discussion, details are not provided here, but are contained in Backus 2007b.2) This phenomena is often the consequence of decisions when cost information does not provide a clear-cut distinction for decision options. (Salganik 2006) The implications are that insurance is currently a function of having a job that provides subsidized insurance. Without an “insured” job, insurance often becomes a non-option. In this study, however, the concern is over the cost implication for participation intervention. The estimated parameters from the data do indicate that price sensitivity does exist, but is extremely weak. A default economic assumption would be that of a mid-distribution unity-elasticity (B=2.0). This would imply that for every added $ spent on one item, an equivalent $ must be reduced from the aggregate of all other purchases. In most decision domains, the elasticity is much higher because individuals can readily shift to an alternative choice (For example, a few hundred dollars can change which $30,000 car one buys.) The estimate of the price sensitivity for SNL employees relative to health care is B=0.35, or a mid-distribution elasticity of only -0.17.3 We tested the impact of participation policy using this variance (B=0.35), compared to, for example, an idealized default value (B=2.0). These results are shown in Figure 2.7. All results are compared to the base-case that assumes no participation (i.e., no subsidization of prevention or insurance). Prevention reduces illness and death rates in a population. Prevention initially reduces total medical costs, but in the long term, the population rises and causes costs to again increase -- even to levels beyond those in the base case. In all cases, the maximum implementation of prevention is assumed to reduce the incidence of chronic illness and other diseases by 20% plus consistent with an increase of average lifetime by 5 years. Two tests contained an assumption of 100% participation (individuals paid no costs). Independent of the price sensitivity (as long as it is non-zero), one obtains maximum actual participation.4 Therefore, only one full participation (PP) run is shown in Figure 2.7. Note that, given the assumption above, full participation in prevention reduces costs a maximum of ~5.25% and increase population by ~2.3% over the basecase. (It also shows change-pushback as discussed earlier.)
2 Because individual employee information is involved, as well as strict Human Studies Board procedures, the noted document is under limited distribution constraints. 3 In a Multinomial Logit as used here, the elasticity changes as decisions moved off the mean to the tails of the distribution. 4 Friction loses (other constraints prevent participation) prevent full participation, but only cost is considered here.
15
Partial participation assumes that costs are subsidized by 50% with the two variants on price sensitivity. The “SNL” designation indicates the lower cost sensitivity. The “SNL” variant reduces costs by ~1.0% beyond the more cost-sensitive case, and increases population by approximately 0.5% more. This occurs because more people participate, despite the lack of apparent cost-benefit. In other words, there is the implicit implication (as was explicitly discovered in the original data) that the promotion of medical interventions alone dominate choice effectiveness. A real world example of this phenomenon appears frequently in fashion choice.
Figure 2.7 Participation Tests. The primary insight from these tests would seem to be that for the “employed insured,” “education” (i.e. marketing) can dramatically change decisions. For the under employed uninsured, until medical costs come within the range of affordability, intervention efforts are wasted.
QCT Participation
-6.000%
-5.000%
-4.000%
-3.000%
-2.000%
-1.000%
0.000%
1.000%
2.000%
3.000%
2003
2006
2009
2012
2015
2018
2021
2024
2027
2030
2033
2036
2039
2042
2045
2048
Year
% C
hang
e ov
er B
ase
Full PP Population
Full PP Cost
Partial PP Population
Partial PP Cost
Partial SNL PP Population
Partial SNL PP Cost

16

17
Chapter 3: Cardiovascular Disease Population Model Description (Version 1.1)
(By Gary Hirsch http://garybhirsch.com/ and Jack Homer http://www.angelfire.com/biz2/HomerConsulting/ )
3. Model Structure
3.1 Population Stocks and Flows
The model divides (arrays) the entire adult (age 21 and above) population into 4 risk classes (RC) which differentiate the asymptomatic population in terms of their risk of symptoms onset and acute attacks from cardiovascular disease (CVD): RC1: Low risk RC2a: Intermediate risk for whom screening would indicate no significant CVD
RC2b: Intermediate risk for whom screening would indicate significant CVD RC3: High risk As shown in Figure 1, the population is further differentiated by their disease status, as represented by three stock variables: Asymptomatic, Subacute, and Postacute.
Figure 3.1 Stock and flow structure differentiating population by disease status. The subacute and postacute stocks together make up the symptomatic CVD population. The subacute population has symptoms of atherosclerotic disease, including those of the heart (angina pectoris, or chest pain) or the brain (transient ischemic attacks, or TIA’s), but has not been hospitalized for a major event. The postacute population has been
Subacutepopn by risk
class
Postacutepopn by risk
classOnset of subacutesymptoms by RC Subacute surviving
acute attack by RC
Asympto survivingacute attack by RC
Subacute deaths fromacute attack by RC
Subacute nonCVDdeaths by RC
Postacute nonCVDdeaths by RC
Postacute deaths fromrecurrent attack by RC
Asymptomaticpopn by risk
classAsympto popninflow by RC
Asympto deaths fromacute attack by RC
Asympto nonCVDdeaths by RC

18
hospitalized for a major acute event or attack, including myocardial infarction, unstable angina pectoris, or stroke. Acute attacks may affect the asymptomatic, the subacute, or the postacute (i.e., recurrent attacks), and in some fraction of cases these attacks will prove fatal. Much attack fatality may be characterized as sudden death, meaning that the patient dies before reaching the hospital. Other patients may die during hospitalization following an acute attack. People enter the adult population by aging into the asymptomatic stock. (In the model, all people under age 21 are asymptomatic.) From there, they may (1) flow into the subacute stock through the onset of symptoms, (2) flow into the postacute stock by surviving an acute attack, (3) die from an acute attack, or (4) die from non-CVD-related causes. From the subacute stock, people may (1) flow into the postacute stock by surviving an acute attack, (2) die from an acute attack, or (3) die from non-CVD-related causes. From the postacute stock, people may (1) die from a recurrent attack, or (2) die from non-CVD-related causes. A postacute patient who has a recurrent attack and survives remains in the postacute stock. Figure 1 dipicts a more complete view of the interactions.
Figure 3.2 Model Information and Patient Flows.
Subacute popnby risk class
Postacute popnby risk classOnset of
subacutesymptoms by RC
Subacute survivingacute attack by RC
Asympto survivingacute attack by RC
Subacute deaths fromacute attack by RC
Subacute nonCVDdeaths by RC
Postacute nonCVDdeaths by RC
Adult popn death rateif no CVD attack
deaths
Postacute deaths fromrecurrent attack by RC
<Fatal fraction ofacute attacks><Asympto popn
acute attack rate>
<Subacute popnacute attack rate>
<Postacute popnacute attack rate>
Asympto popnacute attacks by
RC
Subacute popnacute attacks by RC
Postacute popnrecurrent attacks by
RC
<Asympto popnsymptoms onset
rate>
Symptomatic popnby risk class
Adult popn by riskclass initial
Postacute popnsurviving recurrent
attack by RC
Adult popnmillions initial
Fraction of adultpopn by risk class
Postacutepopn
Subacutepopn
Symptomaticpopn
Asymptomaticpopn
Asymptomaticpopn by risk
classAsympto popninflow by RC
Asympto deaths fromacute attack by RC
Asympto nonCVDdeaths by RC
Adult popn byrisk class
Adult popn
<Adult deaths byRC initial>
Symptomaticpopn prevalence
Postacute popnprevalence
Subacute popnprevalence
Postacute fractionof symptomatic
Extent to which CVDattack deaths increase
total deaths

19
3.2 How Interventions Affect Flows
Five types of interventions are modeled which may affect population flows as follows:
• Acute attack treatment: For those acute attacks that do not result in sudden death, intensive treatment can reduce the risk of death in the hospital. It is assumed that acute attacks have the same fatality rate, and that intervention has the same effect, regardless of whether the patient was asymptomatic, subacute, or postacute prior to the attack.
• Postacute disease management: Intensive disease management for the postacute
population can reduce their rate of recurrent attacks. Such management consists of frequent monitoring plus medication and lifestyle change to control symptoms and risk factors.
• Subacute disease management: Intensive disease management for the subacute
population can reduce their rate of acute attacks. This includes a comprehensive assessment at the time of initial symptoms onset, plus ongoing monitoring, medication, and lifestyle change as with the postacute population.
• Asymptomatic risk management: Intensive management of cardiovascular risk
factors (including hypertension, high cholesterol, diabetes/hyperglycemia, obesity, and smoking) for high-risk asymptomatic individuals can reduce their rate of acute attacks and their rate of subacute symptoms onset. Such management consists of frequent monitoring plus medication and lifestyle change to control risk factors. Intensive risk management is considered appropriate for those in RC3 (high risk), and for those in RC2 (intermediate risk) who are confirmed by screening as RC2b (significant CVD present).
• Screening of asymptomatic RC2 population: A stock variable tracks the number
of people in the RC2 population who have been screened. After entering that stock through a first-time screening, individuals continue to be re-screened every several years, until they either develop symptoms or have an attack or die for other causes. Available resources for screening go first to re-screening of those previously screened as indicated; the remaining resources are used to screen additional individuals not previously screened.
For each type of adverse event in the model—acute attack (by subpopulation category), symptoms onset, and attack fatality—two rate or fractional constants are specified: one that pertains when there is zero intervention, and one that pertains when there is maximum intervention. The event rate or fraction at any given time is determined by interpolating between those two constants according to the extent of intervention; namely, the ratio of (a) resources, expressed in dollars, devoted to the particular type of intervention, to (b) the resources required to achieve maximum effect. The resources

20
required for maximum effect, in turn, are determined by the number of patients who are candidates for the intervention, multiplied by the per-capita resource requirement for maximum effect for that particular type of intervention.
3.3 How Resources Are Set and Allocated
The model is initialized in a steady-state that requires assuming, for each type of intervention, some baseline extent of intervention. The current baseline estimates for extent of intervention are 70% for acute attack treatment, 50% for postacute disease management, 33% for subacute disease management, 20% for asymptomatic risk management, and 0% for RC2 screening. (The model allows the first 4 of these baseline assumptions to be modified.) Given the (a) baseline extent of intervention, (b) the per-capita resource requirement for maximum effect, and (c) the initial number of individuals eligible for each type of intervention, the model calculates the initial resource expenditure for each type of intervention. In addition to intervention-related resources, the total expenditure on CVD also includes resources required for EMT/ambulance services and post-mortem procedures at the hospital. The model allows for additional intervention resources to be made available beyond the initial amounts. These additional resources are specified as a lump sum (which starts at zero but may increase over time, according to an input time series), and then allocated among the five types of intervention. The allocation of the additional resources is done using the William T. Wood algorithm as implemented in Vensim’s “Allocate by Priority” function. (See Vensim Reference Manual, Appendix E.5) This function specifies (a) the total additional resources to be allocated, (b) the additional resources that would be required to achieve maximum effect for each intervention type, (c) the relative priority or attractiveness of each intervention type, and (d) a “width” parameter describing (in the words of the Vensim manual, p. 398): “the difference in attractiveness it takes to achieve exclusive first rights over a competitor.” After experimentation with with some different values of these parameters in the CVD model, a width parameter of 10 and intervention priority values in the range of 8 to 10 produce results mosst consistent with available data. With a width parameter significantly larger than the range of priority values, the model allocates some additional resources to each of the 5 intervention types, but does show preference based on relative priorities. The model also contains an additional option for crafting strategies. This option can be "switched in" instead of the allocation scheme described above. (That allocation scheme for the "umbrella budget" is still the default mechanism for applying resources.) The new option allows the user to specify fractions of "requested" resources to be applied for each intervention type. These "requests" are based on the calculated additional need for each intervention which is the maximum number who could get the intervention minus the
5 http://www.vensim.com/documentation.html

21
number initially receiving the intervention. This mechanism is implemented in the model with “sliders” for setting the fractions of requested resources allocated. It enables the user to specify strategies with a single focus (e.g., disease management only) or particular combinations rather than allocating a fixed global budget across a broad set of alternatives based on priorities as described above. It also allows model users to see the effect of open-ended investments based on potential need rather than simply allocating a fixed amount. Appendix B contains a listing of the model equations.
3.4 Model Behavior
3.4.1 Steady-State Output Values versus Data
The Appendix A describes the calibration of the model’s event rates and fractions based on available data. The estimates are uncertain to some degree, sometimes because of inconsistencies in the data. For example, some data sources cover both heart disease and strokes, while others cover only heart disease. Also, the model assumes a CVD population in steady-state, whereas the actual CVD population has changed over time. Given these sources of inaccuracy, it is inevitable that the model’s calculated steady state (e.g., sizes of subacute and postacute populations) should not perfectly reproduce available data. Nonetheless, the model has proved capable of doing a reasonably good job of such reproduction, with only minimal adjustments being made to a priori estimates. (For the one case of such model tuning, see Appendix A in regard to estimates for attack rates for the asymptomatic population.) The following are the model’s steady-state calculated values compared with corresponding estimates from the American Heart Association (AHA: Heart Disease and Stroke Statistics: 2006 Update): Variable Model AHA Data Subacute population 10.8M 11M Postacute population 14.3M 12M Newly symptomatic/yr. 578K 500K Acute attacks/yr. 1.9M 1.9M - In asymptomatic popn. 678K 800K - In subacute popn. 388K 400K - In postacute popn. 830K 700K Deaths from attacks/yr. 888K 900K Also of interest are the model’s steady-state values of resource expenditures for the five types of interventions. Data do not exist on resource expenditures for CVD broken down in this way, but the model’s steady-state values are as follows: Attack Postacute Subacute Risk RC2 Treatment Dis. Mgmt. Dis. Mgmt. Mgmt. Screening Total Resources ($) Expended per year 32B 29.5B 14.5B 7B 0 83B Resources Required (Initially*) for Max Effect 45B 59B 44B 35.5B 32B 215.5B

22
3.4.2 Impacts of Additional Resources and Alternative Priorities
The model was used to perform simulations varying (a) the amount of additional resources provided, and (b) the relative priorities assigned to the 5 intervention types for allocation of those additional resources. Results of four of those runs are presented below. In the Base Run, no additional resources are provided, and so the priorities are irrelevant. In the three other runs, the additional resources are ramped up to $20 billion per year during Year 5 to Year 10, and remain at $20B/year thereafter. The priorities have been set as shown in the table on the next page. ________________________________________________ * The $32B under RC2 Screening is the cost of first-time screening for the entire asymptomatic RC2 population in a single year ($33B = 91M people x $350 per screening). If the entire RC2 population had already received a first screening, then the annual cost of re-screening assuming a 5-year screening interval would diminish to one-fifth of this initial cost, or $6.4B per year. On the other hand, if the entire RC2 population were screened, this would add another 31.2M people (RC2b) to the 13.2M (RC3) already eligible for risk management. This would increase the maximum required risk management resources from $35.5B (=13.2M*$2690) to $119B (=44.4M*$2690). Thus, RC2 screening may represent a relatively small ongoing cost by itself, but its potential impact on the costs of risk management may be very large. Indeed, this large potential impact may suggest that providing funds for screening makes sense only if a large financial commitment is at the same time made to supporting risk management for the RC2b population detected by screening.
PRIORITY BY INTERVENTION TYPE Run: Treat Screen & Prevent Prevent Attack treatment 10 8 8.5 Postacute mgmt. 9.5 8.5 9 Subacute mgmt. 9 9 9.5 Asympto mgmt. 8.5 9.5 10 RC2 screening 8 10 8 In the Treat run, the highest priorities go to treatment of attacks and care of postacute patients, whereas screening and management of the asymptomatic (primary prevention) get the lowest priorities. In the Screen & Prevent run, these priorities are reversed: the highest priorities go to screening and asymptomatic management, while the treatment of attacks and care of the postacute get the lowest priorities. The Prevent run is a slight variant on this upstream approach, in that it gives the highest priority to management of the asymptomatic, but the lowest priority to RC2 screening. This last run, de-emphasizing screening, was done so that it would be possible to isolate the value of primary prevention for the highest risk (RC3) population from the value of primary prevention for the intermediate risk (RC2b) population. Because the rates of attack and symptoms onset are somewhat lower for the RC2b population than they are for the RC3 population, one might question whether RC2 screening is cost-effective enough to warrant shifting significant resources in its direction.

23
The table on the next page indicates how resources are expended in the various runs, measured as a snapshot in Year 10. The figures in bold indicate where each run stands out relative to the other runs. The Treat run is the one providing the most additional resources to acute attack treatment and postacute management. The Screen & Prevent run is the one providing the most additional resources to RC2 screening and asymptomatic management. The Prevent run is the one providing the most additional resources to subacute management, and is second only to the Screen & Prevent run in providing additional resources to asymptomatic management. Run: Base Treat Screen & Prevent Prevent RESOURCES EXPENDED BY TYPE IN YEAR 10 ($ Billion) Attack treatment 31.9 35.1 32.2 33.1 Postacute mgmt. 29.5 35.9 31.6 33.9 Subacute mgmt. 14.5 19.4 18.1 20.3 Asympto mgmt. 7.1 10.5 15.6 14.3 RC2 screening 0 2.1 5.6 1.5___ Total 83.1 103.1 103.1 103.1 ASYMPTOMATIC SCREENING & RISK MANAGEMENT IN YEAR 20 Screened % of RC2 0% 19.6% 51.9% 12.0% Extent of Risk Mgmt. 20% 22.5% 23.2% 34.8% (for RC3 and detected RC2b) POPULATION IN YEAR 50 (Million) Asymptomatic 175.8 175.8 176.1 176.2 Subacute 10.8 11.0 10.9 10.9 Postacute 14.3 15.0 14.3 14.5___ All adults 200.9 201.7 201.2 201.6 POSTACUTE % OF SYMPTOMATIC IN YEAR 50 Postacute % of Sympto. 57.0% 57.8% 56.8% 56.9% The table indicates some of the key differences among the runs in terms of their impacts. By Year 20, the Screen & Prevent run increases the screened fraction of the RC2 population to over 50%, but it does not increase the extent of risk management significantly higher than the 22% seen in the Treat run. Although risk management resources are increased in Screen & Prevent, they are spread over a larger number of people. This dilution of prevention resources occurs because so many RC2b individuals have been identified through screening. Consequently, the higher-risk RC3 individuals get little more risk management under Screen & Prevent than they do under Treat. In the Prevent run, however, the emphasis is on risk management rather than screening, and so there is no such dilution effect: the extent of risk management is increased to 34.8%.

24
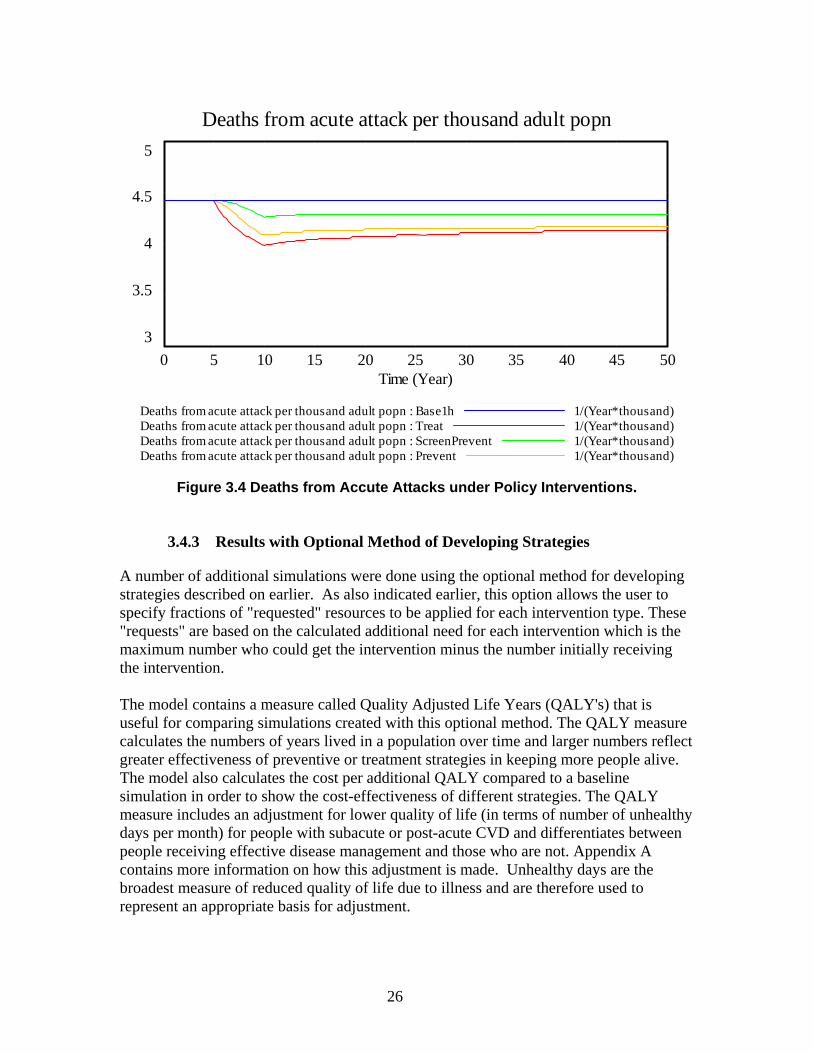
The table also indicates the changes in population stocks (in Year 50, the end of each run) that occur as a result of the interventions. Because the inflow of new adults is assumed fixed, a net increase in the adult population indicates a reduction in deaths. The population changes are perhaps the best way to understand the cumulative impact of the interventions on patient longevity and health. The Treat and the Prevent runs are about equally effective in reducing deaths and increasing longevity, with the Screen & Prevent run less than half as effective in reducing deaths relative to the Base Run. But the Treat and the Prevent runs achieve their success in different ways: Treat does it by primarily by preventing more deaths in postacute patients, whereas Prevent achieves its success by preventing more deaths in asymptomatic patients. (Both runs also achieve reasonable success in preventing deaths in subacute patients.) Thus, in terms of reducing the postacute fraction of the population, Prevent is the superior strategy. Reducing the postacute fraction is an important goal, because the postacute are associated with disability costs—aside from the healthcare costs already captured by the model—that affect patients, their families, and their employers. The graphs below illustrate the differences among the runs over time with regard to acute attacks and deaths from acute attack, both expressed as rates per thousand adult population. All 3 strategies with the $20B of additional resources show significant reductions in attacks and deaths through the ramp-up period ending Year 10, but then appear to lose some effectiveness thereafter. The reason for this apparent erosion—which is most noticeable under the Treat strategy—is that intensified disease management and attack treatment for the postacute, by reducing their death rates, prolongs the lives of those individuals whose risk of an attack is greatest. (The risk of attack is greater for the postacute than it is for the subacute, and greater for the subacute than it is for the asymptomatic. See Appendix A.) Thus, the very success of the Treat strategy in reducing death and extending life for the postacute leads to a gradual rebound in the overall number of attacks per capita. Less of this rebound occurs in the Prevent strategy, because it emphasizes risk reduction for the asymptomatic—with their lower attack rate—more than for the postacute. Although the Treat strategy becomes gradually less effective with respect to reducing the number of attacks, it retains an edge over the Prevent strategy in reducing the number of deaths from acute attack. This superiority in reducing deaths reflects the greater expenditure on the treatment of attacks under Treat than is made under Prevent. However, despite this significant difference in direct expenditure on urgent care, the edge that Treat holds over Prevent in death reduction, its strongest suit, becomes smaller and smaller as time goes on. The slimness of this edge is attributable to the rebound in acute attacks under Treat due to the greater longevity of the postacute. In summary, although the Treat strategy does more than the Prevent strategy to reduce attack-related deaths, its edge in this regard declines over time. The Treat strategy increases the longevity and thus the prevalence of the postacute population, whereas the Prevent strategy does more to keep the asymptomatic from moving to postacute in the first place. Thus, from the standpoint of postacute prevalence and associated disability,

25
the Prevent strategy is superior. Also, as noted earlier, the Screen & Prevent strategy appears to be less effective than either the Treat or Prevent strategies, because it diverts scarce resources to a sub-population whose risk of symptoms onset and attacks is only intermediate rather than high. Given our current model assumptions, those scarce resources are better spent on more intensively managing those at highest risk (RC3) rather than detecting and managing those at only intermediately-high risk (RC2b).
Acute attacks per thousand adult popn
10
9.5
9
8.5
8
0 5 10 15 20 25 30 35 40 45 50Time (Year)
Acute attacks per thousand adult popn : Base1h 1/(Year*thousand)Acute attacks per thousand adult popn : Treat 1/(Year*thousand)Acute attacks per thousand adult popn : ScreenPrevent 1/(Year*thousand)Acute attacks per thousand adult popn : Prevent 1/(Year*thousand)
Figure 3.3 Acute Attacks under Policy Interventions.
26
Deaths from acute attack per thousand adult popn
5
4.5
4
3.5
3
0 5 10 15 20 25 30 35 40 45 50Time (Year)
Deaths from acute attack per thousand adult popn : Base1h 1/(Year*thousand)Deaths from acute attack per thousand adult popn : Treat 1/(Year*thousand)Deaths from acute attack per thousand adult popn : ScreenPrevent 1/(Year*thousand)Deaths from acute attack per thousand adult popn : Prevent 1/(Year*thousand)
Figure 3.4 Deaths from Accute Attacks under Policy Interventions.
3.4.3 Results with Optional Method of Developing Strategies
A number of additional simulations were done using the optional method for developing strategies described on earlier. As also indicated earlier, this option allows the user to specify fractions of "requested" resources to be applied for each intervention type. These "requests" are based on the calculated additional need for each intervention which is the maximum number who could get the intervention minus the number initially receiving the intervention. The model contains a measure called Quality Adjusted Life Years (QALY's) that is useful for comparing simulations created with this optional method. The QALY measure calculates the numbers of years lived in a population over time and larger numbers reflect greater effectiveness of preventive or treatment strategies in keeping more people alive. The model also calculates the cost per additional QALY compared to a baseline simulation in order to show the cost-effectiveness of different strategies. The QALY measure includes an adjustment for lower quality of life (in terms of number of unhealthy days per month) for people with subacute or post-acute CVD and differentiates between people receiving effective disease management and those who are not. Appendix A contains more information on how this adjustment is made. Unhealthy days are the broadest measure of reduced quality of life due to illness and are therefore used to represent an appropriate basis for adjustment.

27
The table below shows the results for runs with a single or narrow focus created with this optional method (meeting 100% of the need in the indicated intervention(s) to the exclusion of any of the others):
$B in yr 50 QALY chg Mill in yr 50 Cumul $/QALY 100% Treat 17.1 0.54 43,348 100% Postacute DM 38.0 2.11 20,919 100% Subacute DM 38.1 1.54 32,360 100% Post+Sub DM 72.2 3.44 25,598 100% RM 34.9 1.01 57,561 100% Screen+RM 128.2 1.79 127,182 100% Screen 7.3 (-0.11) (-136,045)* __________________________ * That is, Screen alone is a net loser, because all it accomplishes is to dilute fixed RM funds so that they are shifting some $ from high-risk to intermediate-risk. These results suggest that disease management (DM) is the most "productive" activity in terms of dollars invested producing the greatest increase in QALY's. Disease management is so effective because it is focused on people with a high likelihood of having additional (fatal) attacks and unhealthy days. That doesn't mean that one should not do risk management (RM) as well, but simply that dollars invested in risk management (prevention) will yield fewer QALY's. To the extent that a large fraction of the disease management need is fulfilled, investments in prevention can provide additional gains in QALY's. Also, some risk management activities may prevent multiple chronic illnesses (diabetes in addition to cardiovascular disease) and their value can be underestimated if one is only looking at one set of diseases at a time.

28

29
Chapter 4: Summary This work extended earlier efforts (Backus 2007a) by enhancing two of the previously developed models to more closely consider policy options and their impacts. In one policy model, SNL employee data allowed the estimation of representative parameters to show the surprising result that marketing, as opposed to cost, dominated decisions and intervention implications. The specific use of a CVD model to determine the benefits of spending additional money on prevention policies showed the same types of impacts as the broad national model. Again, a two paradigm approach does indicate a potential benefit for validation and verification that is exploitable for future work. Qualitative Choice Theory and System Dynamics appear to work cooperatively to ensure realistic assessment of behavior-aware policy interventions.

30

31
References Backus, G. A., and R. J. Glass, February 2006, An Agent-Based Model Component to a
Framework for the Analysis of Terrorist-Group Dynamics. Sandia Report SAND2006-0860P, Sandia National Laboratories, Albuquerque, NM.
Backus, G. A., B. N. Chenoweth, and D. R. Strip, November 2007, Assessing the Drivers
of Health Plan Choices. Sandia Report SAND 2007-7664, Sandia National Laboratories, Albuquerque, NM.
Backus, G. A., D. R. Strip, G. B. Hirsch, J. Homer, J. D. Siirola, M. S. Bastian, D. A.
Schoenwald, D. A., and K. R. Braithwaite, November 2007, Accommodating Complexity and Human Behaviors in Decision Analysis, LDRD Final Report. Sandia Report SAND 2007-7666, Sandia National Laboratories, Albuquerque, NM.
Ben-Akiva, M., 1985, Discrete Choice Analysis: Theory and Applications. MIT Press,
Cambridge, MA, 104. Engle, R. F., and C. W. J. Granger, Co-integration and error correction representation,
estimation, and testing, in Econometric, vol. 55, pp. 251-276, 1987. Engle, R.F., and C. W. J. Granger, 1991, Long-Run Economic Relationships: Readings in
Cointegration. Oxford University Press, Oxford, UK. Granger, C. W. J., Some properties of time series data and their use in econometric model
specification, in Journal of Econometrics, vol. 16, pp. 121-130, 1981. Greenwald, B., and J. E. Stiglitz, 1986, Externalities in Economies with Imperfect
Information and Incomplete Markets. In Quarterly Journal of Economics, vol. 90. Cambridge: MIT Press.
Hendry, D. F., 1993, Econometrics: Alchemy or Science. Blackwell Publishers, Cambridge,
UK. Hendry, D. F., 1995, Dynamic Econometrics. Oxford University Press, Oxford, UK, vol. 31. Keeney, R. L., and H. Raiffa, 1993, Decisions with Multiple Objectives: Preferences and
Value Trade-offs. Cambridge University Press. McFadden, D., 1974, Conditional Logit Analysis of Qualitative Choice Behavior. In P.
Zarembka (Ed.), Frontiers in Econometrics, New York: Academic Press. McFadden, D., 1982, Qualitative Response Models. In W. Hildenbrand (Ed.), Advances in
Econometrics, vol. 10. New York: Cambridge University Press.
32
McFadden, D., and K. Train, 2000, Mixed MNL Models For Discrete Response. Journal of Applied Econometrics, vol. 15, pp. 447-470.
Salganik, M. J., P. S. Dodds, and D. J. Watts, February 10, 2006, Experimental Study of
Inequality and Unpredictability in an Artificial Cultural Market. Science, vol. 311:5762, pp. 854 – 856.
Siirola, J. D., August 2007, Agent-oriented Software Engineering for Simulation and
Optimization. Sandia Report SAND 2007-5021P, Sandia National Laboratories, Albuquerque, NM.
Train, K., 1986, Qualitative Choice Analysis. MIT Press, Cambridge, MA, vol. 21.
33
Appendix A: A Data Sources and Analysis for Calibration of Cardiovascular Disease Population Model
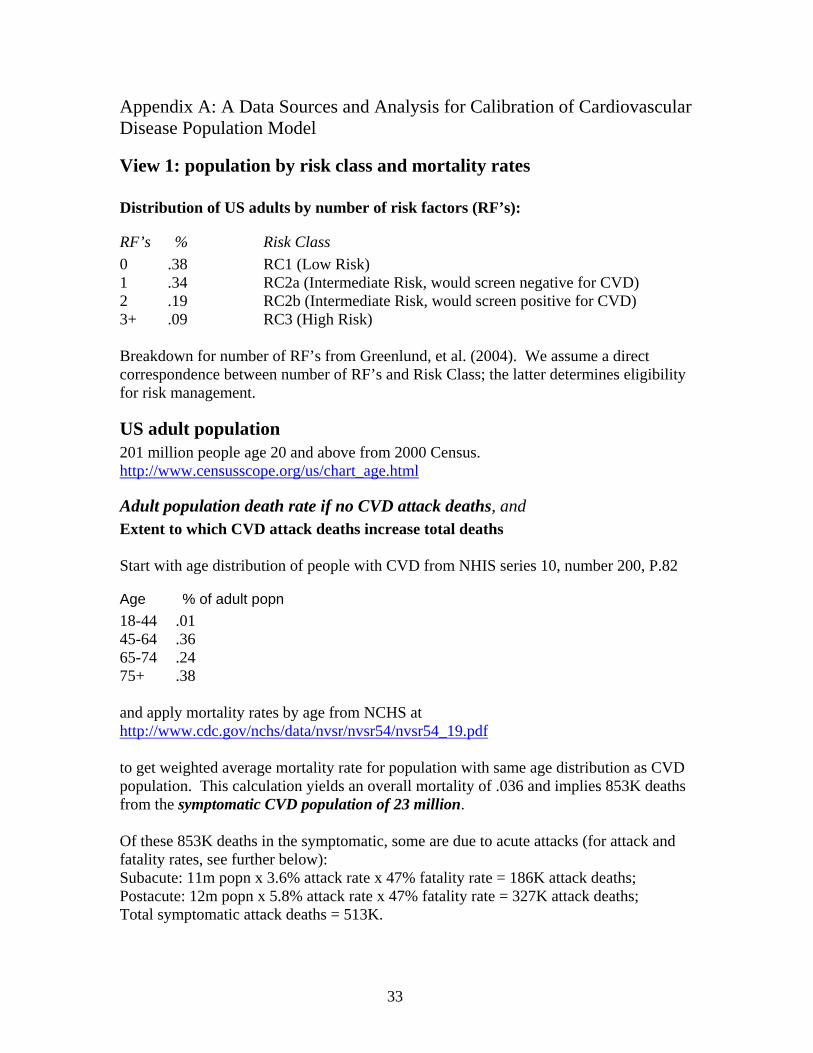
View 1: population by risk class and mortality rates Distribution of US adults by number of risk factors (RF’s):
RF’s % Risk Class
0 .38 RC1 (Low Risk) 1 .34 RC2a (Intermediate Risk, would screen negative for CVD) 2 .19 RC2b (Intermediate Risk, would screen positive for CVD) 3+ .09 RC3 (High Risk) Breakdown for number of RF’s from Greenlund, et al. (2004). We assume a direct correspondence between number of RF’s and Risk Class; the latter determines eligibility for risk management.
US adult population 201 million people age 20 and above from 2000 Census. http://www.censusscope.org/us/chart_age.html
Adult population death rate if no CVD attack deaths, and Extent to which CVD attack deaths increase total deaths Start with age distribution of people with CVD from NHIS series 10, number 200, P.82
Age % of adult popn 18-44 .01 45-64 .36 65-74 .24 75+ .38 and apply mortality rates by age from NCHS at http://www.cdc.gov/nchs/data/nvsr/nvsr54/nvsr54_19.pdf to get weighted average mortality rate for population with same age distribution as CVD population. This calculation yields an overall mortality of .036 and implies 853K deaths from the symptomatic CVD population of 23 million. Of these 853K deaths in the symptomatic, some are due to acute attacks (for attack and fatality rates, see further below): Subacute: 11m popn x 3.6% attack rate x 47% fatality rate = 186K attack deaths; Postacute: 12m popn x 5.8% attack rate x 47% fatality rate = 327K attack deaths; Total symptomatic attack deaths = 513K.

34
The difference is the number of deaths of symptomatic due to reasons other than CVD attack: 853K – 513K = 340K; 340K/23M = 1.48% per year rate. This 1.48% rate tells us the rate of dying due to non-CVD causes, but it does not tell us what the death rate would be in the absence of CVD attacks. In the extreme, imagine that the entire CVD population died from acute attacks, leaving none to die from other causes. The apparent non-CVD death rate would then be 0%. Now imagine that CVD deaths were instantaneously and universally eliminated. That would not reduce the death rate to zero! It would only reduce it by the extent to which CVD attack deaths increase total deaths. Thus, we see that the base rate (Adult popn death rate if no CVD attack deaths) must be something greater than 1.48%. To know how much greater, we must know the Extent to which CVD attack deaths increase total deaths. To pick a starting point, let us assume that parameter = 0.5, and see where that gets us with regard to the symptomatic population statistics cited above. Overall deaths = (Adult popn death rate if no CVD attack deaths*Popn) + (Attack deaths * Extent to which CVD attack deaths increase total deaths) 853K = (Adult popn death rate if no CVD attack deaths*23M) + (513K * 0.5) implies Adult popn death rate if no CVD attack deaths = 2.6% Is this 2.6% a reasonable figure? The average age of adults in the U.S. is 46 years. The inverse of 2.6% implies additional life expectancy of 38 years, giving a total life expectancy for adults of 84 years. This seems like a reasonable estimate of life expectancy for an adult without CVD. Note that with the inclusion of attack deaths, the death rate of the symptomatic is (853K/23M) = 3.7%, the inverse of which is 27 years, giving a total life expectancy for symptomatic CVD adults of 73 (=46+27) years at present. So, given our assumptions, the elimination of attack deaths could add 11 (=84-73) years to the life expectancy of Americans with CVD.
View 3: Attack Rates and Fatal Fractions
Attack rates for Asymptomatic population Average annual attack rates for asymptomatic people by risk class were based on calculations using Framingham data for different numbers of risk factors. The NHLBI cardiovascular risk calculator available at http://hp2010.nhlbihin.net/atpiii/calculator.asp gives the following:
35
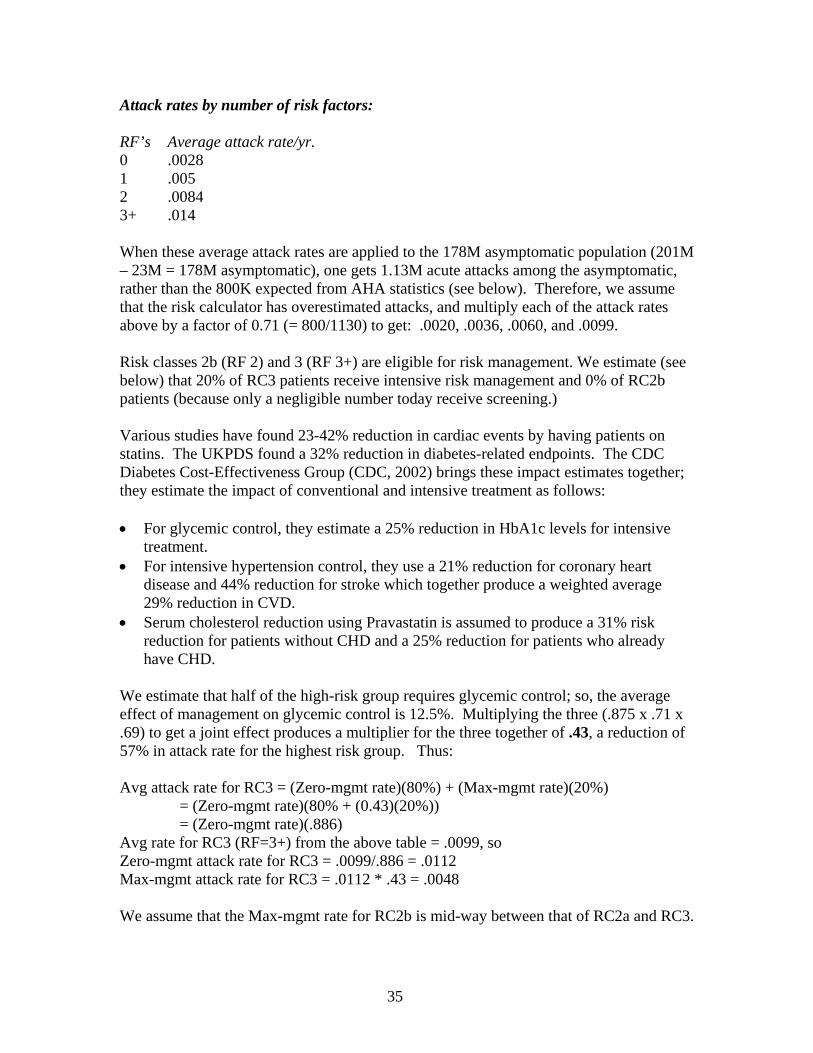
Attack rates by number of risk factors: RF’s Average attack rate/yr. 0 .0028 1 .005 2 .0084 3+ .014 When these average attack rates are applied to the 178M asymptomatic population (201M – 23M = 178M asymptomatic), one gets 1.13M acute attacks among the asymptomatic, rather than the 800K expected from AHA statistics (see below). Therefore, we assume that the risk calculator has overestimated attacks, and multiply each of the attack rates above by a factor of 0.71 (= 800/1130) to get: .0020, .0036, .0060, and .0099. Risk classes 2b (RF 2) and 3 (RF 3+) are eligible for risk management. We estimate (see below) that 20% of RC3 patients receive intensive risk management and 0% of RC2b patients (because only a negligible number today receive screening.) Various studies have found 23-42% reduction in cardiac events by having patients on statins. The UKPDS found a 32% reduction in diabetes-related endpoints. The CDC Diabetes Cost-Effectiveness Group (CDC, 2002) brings these impact estimates together; they estimate the impact of conventional and intensive treatment as follows: • For glycemic control, they estimate a 25% reduction in HbA1c levels for intensive
treatment. • For intensive hypertension control, they use a 21% reduction for coronary heart
disease and 44% reduction for stroke which together produce a weighted average 29% reduction in CVD.
• Serum cholesterol reduction using Pravastatin is assumed to produce a 31% risk reduction for patients without CHD and a 25% reduction for patients who already have CHD.
We estimate that half of the high-risk group requires glycemic control; so, the average effect of management on glycemic control is 12.5%. Multiplying the three (.875 x .71 x .69) to get a joint effect produces a multiplier for the three together of .43, a reduction of 57% in attack rate for the highest risk group. Thus: Avg attack rate for RC3 = (Zero-mgmt rate)(80%) + (Max-mgmt rate)(20%) = (Zero-mgmt rate)(80% + (0.43)(20%)) = (Zero-mgmt rate)(.886) Avg rate for RC3 (RF=3+) from the above table = .0099, so Zero-mgmt attack rate for RC3 = .0099/.886 = .0112 Max-mgmt attack rate for RC3 = .0112 * .43 = .0048 We assume that the Max-mgmt rate for RC2b is mid-way between that of RC2a and RC3.
36
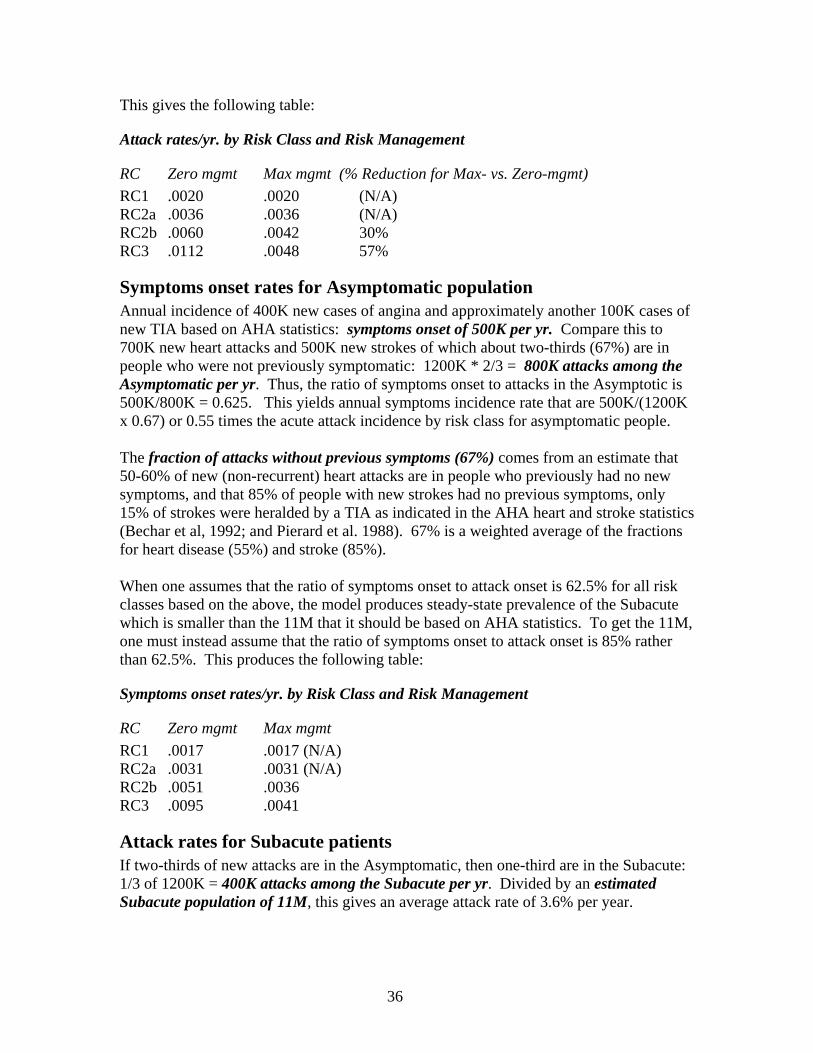
This gives the following table:
Attack rates/yr. by Risk Class and Risk Management
RC Zero mgmt Max mgmt (% Reduction for Max- vs. Zero-mgmt)
RC1 .0020 .0020 (N/A) RC2a .0036 .0036 (N/A) RC2b .0060 .0042 30% RC3 .0112 .0048 57%
Symptoms onset rates for Asymptomatic population Annual incidence of 400K new cases of angina and approximately another 100K cases of new TIA based on AHA statistics: symptoms onset of 500K per yr. Compare this to 700K new heart attacks and 500K new strokes of which about two-thirds (67%) are in people who were not previously symptomatic: 1200K * 2/3 = 800K attacks among the Asymptomatic per yr. Thus, the ratio of symptoms onset to attacks in the Asymptotic is 500K/800K = 0.625. This yields annual symptoms incidence rate that are 500K/(1200K x 0.67) or 0.55 times the acute attack incidence by risk class for asymptomatic people. The fraction of attacks without previous symptoms (67%) comes from an estimate that 50-60% of new (non-recurrent) heart attacks are in people who previously had no new symptoms, and that 85% of people with new strokes had no previous symptoms, only 15% of strokes were heralded by a TIA as indicated in the AHA heart and stroke statistics (Bechar et al, 1992; and Pierard et al. 1988). 67% is a weighted average of the fractions for heart disease (55%) and stroke (85%). When one assumes that the ratio of symptoms onset to attack onset is 62.5% for all risk classes based on the above, the model produces steady-state prevalence of the Subacute which is smaller than the 11M that it should be based on AHA statistics. To get the 11M, one must instead assume that the ratio of symptoms onset to attack onset is 85% rather than 62.5%. This produces the following table:
Symptoms onset rates/yr. by Risk Class and Risk Management
RC Zero mgmt Max mgmt
RC1 .0017 .0017 (N/A) RC2a .0031 .0031 (N/A) RC2b .0051 .0036 RC3 .0095 .0041
Attack rates for Subacute patients If two-thirds of new attacks are in the Asymptomatic, then one-third are in the Subacute: 1/3 of 1200K = 400K attacks among the Subacute per yr. Divided by an estimated Subacute population of 11M, this gives an average attack rate of 3.6% per year.

37
Let us assume that the reduction in acute attack rates with maximum disease management is 50% for the subacute, the same as for the postacute (see below). Let us also assume that the managed fraction of the subacute is 33% (see below). Thus: Avg attack rate for subacute = (Zero-mgmt rate)(67%) + (Max-mgmt rate)(33%) = (Zero-mgmt rate)(67% + (0.50)(33%)) = (Zero-mgmt rate)(.835) Avg rate = .036 (above), so Zero-mgmt attack rate for subacute = .036/.835 = .0431 Max-mgmt attack rate for subacute = .0431 * .50 = .0216.
Recurrent attack rates for Post-acute patients AHA statistics (Heart Disease and Stroke Statistics: 2006 Update) indicate 500K recurrent heart attacks (based on ARIC data) and 200K recurrent strokes (based on Greater Cincinnati/Northern Kentucky Stroke Study) for a total of 700K recurrent attacks per yr. In a Postacute population of about 12 million, this implies a rate of 5.8% per year. The literature suggests 25% reductions in recurrent attacks and death with each of beta- blocker usage and statin usage (Goldman, et al. 1988; and Sacks, et al. 1996). Assuming a combined program of these and other interventions (glycemic control, weight loss, smoking cessation) might suggest a 50% overall reduction in recurrence with maximum disease management. Let us also assume that the managed fraction of the postacute is 50% (see below). Thus: Avg attack rate for postacute = (Zero-mgmt rate)(50%) + (Max-mgmt rate)(50%) = (Zero-mgmt rate)(50% + (0.50)(50%)) = (Zero-mgmt rate)(.75) Avg rate = .058 (above), so Zero-mgmt attack rate for postacute = .058/.75 = .0773 Max-mgmt attack rate for postacute = .0773 * .50 = .0387.
Fatal fractions for non-sudden death acute attacks, and Sudden death fraction of attacks AHA reports 900K CVD deaths from 1.9M acute attacks: a fatality rate for attacks of 47%. Data don’t make it easy to distinguish between mortality rates for new vs. recurrent attacks; absent other data, we’ll assume 47% for both. The data suggest limited ability to reduce the fatality of attacks. According to one article, 63% of cardiac deaths are sudden and occur before the patient even gets to the hospital (Zheng et al. 2001.) A study in Oregon found that only 8% of cardiac arrest patients were successfully resuscitated before getting to the hospital (Chugh et al 2004.) The sudden death fraction for strokes is probably less than that for heart attacks. We therefore assume that 55% of acute attack deaths overall are sudden. This would make the sudden death fraction of attacks [55%x47%] = 26%. Non-sudden-death attacks account for the

38
remainder, 74%, of all attacks, and their deaths account for [47% - 26%] = 21% of all attacks. Thus, the average death rate for non-sudden death attacks is (21%/74%) = 28%. Once patients are in the hospital, case fatality rates have fallen as a result of better treatment and average around 10%. More aggressive treatment (e.g. angioplasty) might reduce that more substantially, by as much as two-thirds (Zahn, et al. 2000). We assume that, today, 70% of non-sudden death attacks are receiving aggressive intervention (see below). Thus: Avg fatality rate for non-sudden death attacks = (Zero-mgmt rate)(30%) + (Max-mgmt rate)(70%) = (Zero-mgmt rate)(30% + (0.33)(70%)) = (Zero-mgmt rate)(.53) Avg non-sudden death fatality rate = .28 (above), so Zero-mgmt non-sudden-death attack fatality rate = .28/.53 = .53 Max-mgmt non-sudden-death attack fatality rate = .53 * .33 = .175.
View 4: Risk Screening and Management
Resources required per RC2 screening Several sources suggested that screening costs for Risk Class 2 (intermediate risk) patients would be about $350 for one of the more sophisticated tests or $140 for one that is less sophisticated, but still more expensive than simply calculating the ratio between brachial and femoral blood pressures. An article http://www.ncbi.nlm.nih.gov/books/bv.fcgi?rid=hstat6.section.622 indicates that EBCT and exercise stress tests have a similar cost of about $350-400. Hayashino, et al. (2004) show exercise electrocardiography to be quite inexpensive ($140), but that exercise echocardiography is actually the most cost-effective method at a cost of $334 per test in patients with diabetes plus other risk factors. Screening costs (2003 $) Baseline Low High
Exercise electrocardiography 140 98 182 53
Exercise echocardiography 334 234 434 53
Exercise SPECT 730 511 949 53
Coronary angiography 6,035 4,225 7,846 53
We assume that RC2 screening would be done by exercise echocardiography at a cost of $350 per screening.

39
Screening Interval There is no clear guidance in the literature. Screening is mostly discussed as a one-time event. Five years seems a reasonable interval given the rate at which CVD might develop in an at-risk population. This is the same interval recommended for some other similarly priced mass-population screening procedures, such as colonoscopy.
Resources required per patient for maximum asymptomatic risk management The following annual costs are from the CDC diabetes cost-effectiveness study (CDC 2002). Intensive glycemic control $1531 ($538 for conventional) Intensive hypertension control 667 ($301 for conventional) Pravastatin for serum cholesterol 1398 The following costs are from Hayashino, et al. (2004).
Risk management costs Baseline Low High
Conventional diabetes care 1,113 779 1,447 52
Simvastatin 1,293 905 1,680 58
Aspirin 16 11 21 48
We assume that 50% of patients eligible for CVD risk management (RC3 and RC2b) would require treatment for hyperglycemia. With inclusion of anti-hypertensive treatment at a cost of $667 and aspirin at $16, the average total cost for comprehensive treatment based on CDC would be [1398+667+16+ 0.5*1531] = $2846.50; and based on Hayashino would be [1293+667+16+ 0.5*1113] =$2532.50. We assume a cost of $2690, midway between these estimates.
40
View 5: Disease Management and Attack Treatment
Resources required per subacute patient for maximum disease management, and
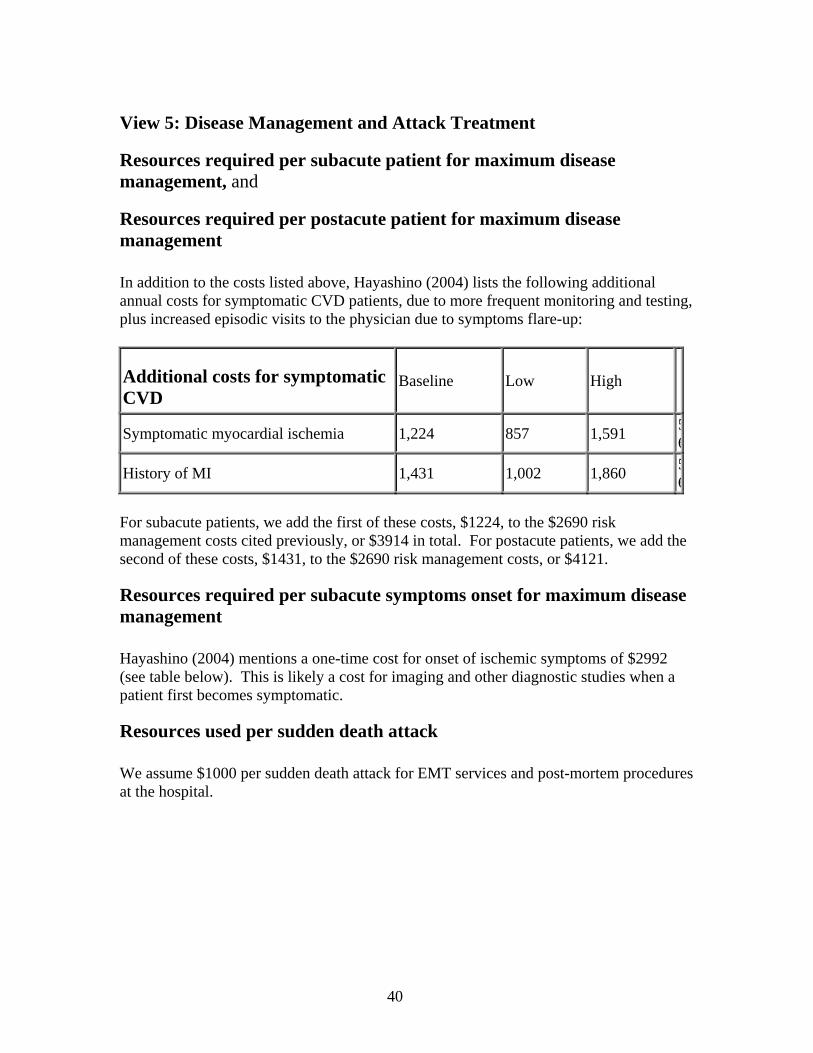
Resources required per postacute patient for maximum disease management In addition to the costs listed above, Hayashino (2004) lists the following additional annual costs for symptomatic CVD patients, due to more frequent monitoring and testing, plus increased episodic visits to the physician due to symptoms flare-up:
Additional costs for symptomatic CVD
Baseline Low High
Symptomatic myocardial ischemia 1,224 857 1,591 56
History of MI 1,431 1,002 1,860 56
For subacute patients, we add the first of these costs, $1224, to the $2690 risk management costs cited previously, or $3914 in total. For postacute patients, we add the second of these costs, $1431, to the $2690 risk management costs, or $4121.
Resources required per subacute symptoms onset for maximum disease management Hayashino (2004) mentions a one-time cost for onset of ischemic symptoms of $2992 (see table below). This is likely a cost for imaging and other diagnostic studies when a patient first becomes symptomatic.
Resources used per sudden death attack We assume $1000 per sudden death attack for EMT services and post-mortem procedures at the hospital.

41
Resources required per nonsudden death acute attack for maximum treatment Hayashino (2004) shows a cost in the table below of $21,161 for treating a surviving MI patient.
One-time acute attack costs Baseline Low High
Symptomatic myocardial ischemia 2,992 2,094 3,889 56
MI death 23,843 16,690 30,996 56
MI survival 21,161 14,813 27,509 56
Hayashino (2004) also outlines the potential risk reduction and cost of PTCA (angioplasty) and CABG (bypass surgery) for preventing recurrent attacks. Risk reduction for revascularization after MI Baseline Low High
PTCA 17% 0 22% 49
CABG 42% 29% 55% 49
Cost for revascularization after MI Baseline Low High
PTCA 15,884 11,119 20,650 53
CABG 42,125 29,487 54,762 53
It’s not clear what fraction of patients is expected to benefit from these procedures. According to the 2002 NCHS Hospital Discharge Survey, there were 515K CABG’s, 1328K cardiac catheterizations, and 1204K removal of coronary obstructions and insertions of stents. Because there are often several procedures performed on the same patient, a better indicator may be the numbers of discharges with one of these procedures: 653K with PTCA and insertion of stents, and 306K with CABG. This would suggest that PTCA and stent insertion are performed in 653K/2153K or 30% of CHD admissions and CABG is performed in 306K/2153K or 14% of CHD admissions. Applying these

42
fractions yields a cost of [21,161+ .30x15,884 + .14x42,125] or $31,913 or about $32,000 per non-sudden death acute attack patient.
View 6: Initial and Total Resources by Type
Asymptomatic risk management vs. maximum AHA statistics, quoting 1999-2000 NHANES indicate that only 33% of hypertension is controlled in whites and smaller percentages in Hispanics and blacks. Regarding serum cholesterol, less than half of persons who qualify for any kind of lipid-modifying treatment for CHD risk reduction are receiving it. Less than half of even the highest-risk persons, those who have symptomatic CHD, are receiving lipid-lowering treatment. Only about a third of treated patients are achieving their LDL goal; less than 20 percent of CHD patients are at their LDL goal. These statistics would suggest that 0.2 is a good initial estimate. Subacute disease management vs. maximum, and
Postacute disease management vs. maximum There is a lot written about failure of physicians to prescribe basic things such as beta blockers for post-MI patients, but no quantification. The fractions of 0.33 for subacute and 0.5 for postacute seem reasonable and may even be overly optimistic. One article indicated that even when patients are getting beta blockers, they get less than the optimal dose.
Non-sudden-death acute attack treatment vs. maximum Treatment for acute attacks appears to be more aggressive and 0.7 seems reasonable for this parameter.
View 7: Quality Adjusted Life-Years and Unhealthy Days The model also includes a measure of Quality Adjusted Life Years (QALY's) that is useful for comparing simulations. This measure calculates the numbers of years lived in a population over time and larger numbers reflect greater effectiveness of preventive or treatment strategies in keeping more people alive. The model also calculates the cost per additional QALY compared to a baseline simulation in order to show the cost-effectiveness of different strategies. The QALY measure includes an adjustment for lower quality of life (in terms of number of unhealthy days per month) for people with subacute or post-acute CVD and differentiates between people receiving effective disease management and those who are not. Unhealthy days are the broadest measure of reduced quality of life due to illness and we therefore thought they represented an appropriate

43
basis for adjustment. The following numbers of unhealthy days per month are used in the model for each of these groups.
No Disease Management With Disease Management
Asymptomatic 6 n/a (and General non-CVD Population) Subacute 9 7.5 Post-Acute 13.6 9.8 Data for these numbers came from a monograph called Measuring Healthy Days (http://www.cdc.gov/hrqol/monograph.htm) (see Table 2) published by the CDC's National Center for Chronic Disease Prevention and Health Promotion and were adjusted to reflect effects of disease management based on experience with diabetes modeling. The monograph (Table 2) also contains numbers of limited activity days for people with CVD. Limited activity days could also be incorporated into the model in the future if there seems to be value in doing so. While a narrower measure, limited activity days could be more easily linked to disability costs and used as part of an overall cost of disease measure.
References Bechar S, Reicher-Reiss H, Abinader E, et al, (1992). The prognostic significance of angina pectoris preceding the occurrence of a first acute myocardial infarction in 4166 consecutive hospitalized patients. Am Heart J 123:1481-6. CDC Diabetes Cost-Effectiveness Group (2002). Cost-effectiveness of intensive glycemic control, intensified hypertension control, and serum cholesterol kevel reduction for Type 2 diabetes. JAMA 287(19): 2542-2551. Chugh SS et al (2004). Current burden of sudden cardiac death: Multiple source surveillance versus retrospective death certificate-based review in a large U.S. community. J Am Coll Cardiol 44:1268-1275. Goldman L, Sia ST, Cook EF, Rutherford JD, Weinstein MC (1988). Costs and effectiveness of routine therapy with long-term beta-adrenergic antagonists after acute myocardial infarction. NEJM 319:152-157. Greenlund et al (2004). Trends in self-reported multiple cardiovascular disease risk factors among adults in the United States 1991-1999 (2004). Arch Intern Med 164:181-187.

44
Hayashino Y, Nagata-Kobayashi S, Morimoto T, et al (2004). Cost-effectiveness of screening for coronary artery disease in asymptomatic patients with Type 2 diabetes and additional atherogenic risk factors. J Gen Intern Med 19(12):1181-1191. Pierard LA, Dubois C, Smeets J, et al (1988). Prognostic significance of angina pectoris before first acute myocardial infarction. Am J Cardiol 61: 984-7. Sacks FM et al for the Recurrent Events Trial Investigators (1996). The effect of Pravastatin on coronary events after myocardial infarction in patients with average cholesterol levels. NEJM 335(14): 1001-1009. Zahn R, et al for the Maximal Individual Therapy in Acute Myocardial Infarction (MITRA) and the Myocardial Infarction Registry (MIR) Study Groups (2000). Decreasing hospital mortality between 1994 and 1998 in patients with acute myocardial infarction treated with primary angioplasty but not in patients treated with intravenous thrombolysis: Results from the pooled data of the maximal individual therapy in acute myocardial infarction (MITRA) registry and the myocardial infarction registry (MIR). J Am Coll Cardiol 36:2064-2071. Zheng Z-J, Croft JB, Giles WH, Mensah GA (2001). Sudden cardiac death in the United States, 1989 to 1998. Circulation 104: 2158.
45
Appendix B: CVD Model Equations (VENSIM Format) ******************************************************** .Active ********************************************************~ Active Equations | Acute attacks= Asympto popn acute attacks + Subacute popn acute attacks + Postacute recurrent attacks ~ people/Year ~ | Acute attacks per thousand adult popn= Acute attacks/Adult popn*1000 ~ 1/Year/thousand ~ | Additional QALYs per year= QALYs per year for adult popn - QALYs per year for adult popn initial ~ QALYs/Year ~ | Additional resources for asympto risk mgmt= IF THEN ELSE(Switch for separate resource budgets=0,Additional resources provided by intervention type under umbrella budget\ [RiskMgmt],Additional resources provided by intervention type under separate budgets\ [RiskMgmt]) ~ dollars/Year ~ | Additional resources for nonsudden death acute attack treatment= IF THEN ELSE( Switch for separate resource budgets=0,Additional resources provided by intervention type under umbrella budget\ [AttackTx],Additional resources provided by intervention type under separate budgets\ [AttackTx]) ~ dollars/Year ~ | Additional resources for postacute disease mgmt= IF THEN ELSE( Switch for separate resource budgets=0,Additional resources provided by intervention type under umbrella budget\ [PostDisMgmt],Additional resources provided by intervention type under separate budgets\ [PostDisMgmt]) ~ dollars/Year ~ | Additional resources for subacute disease mgmt= IF THEN ELSE( Switch for separate resource budgets=0,Additional resources provided by intervention type under umbrella budget\
46
[SubDisMgmt],Additional resources provided by intervention type under separate budgets\ [SubDisMgmt]) ~ dollars/Year ~ | Additional resources per QALY= ZIDZ(Additional resources provided,Additional QALYs per year) ~ dollars/QALY ~ | Additional resources provided= IF THEN ELSE(Switch for separate resource budgets=0,Additional resources total provided under umbrella budget\ ,SUM(Additional resources provided by intervention type under separate budgets[InterventionType\ !])) ~ dollars/Year ~ | Additional resources provided by intervention type under separate budgets[InterventionType\ ]= Additional resources requested by intervention type[InterventionType]*Fraction of need filled\ [InterventionType] * Fraction of need filled phasing in series(Time) ~ dollars/Year ~ | Additional resources provided by intervention type under umbrella budget[InterventionType\ ]= ALLOCATE BY PRIORITY(Additional resources requested by intervention type [InterventionType], Priority of intervention by type [InterventionType], 5, 10, Additional resources total provided under umbrella budget\ ) ~ dollars/Year ~ | Additional resources provided vs requested= ZIDZ(Additional resources provided,Additional resources requested) ~ dmnl ~ | Additional resources provided vs requested by intervention type[InterventionType]= ZIDZ(IF THEN ELSE(Switch for separate resource budgets=0,Additional resources provided by intervention type under umbrella budget\ [InterventionType],Additional resources provided by intervention type under separate budgets\ [InterventionType]),Additional resources requested by intervention type [InterventionType]) ~ dmnl ~ | Additional resources requested= SUM(Additional resources requested by intervention type[InterventionType!]) ~ dollars/Year ~ |

47
Additional resources requested by intervention type[InterventionType]= SMOOTHI(Additional resources required for max intervention by type[InterventionType]\ ,Time to reassess resource needs,0) ~ million dollars/Year ~ | Additional resources required for max acute attack treatment= MAX(0, Resources required for max treatment of nonsudden death acute attacks - Initial resources for nonsudden death acute attack treatment\ ) ~ dollars/Year ~ | Additional resources required for max asympto risk mgmt= MAX(0, Resources required for max asympto risk mgmt - Initial resources for asympto risk mgmt\ ) ~ dollars/Year ~ | Additional resources required for max intervention by type[Screen]= Resources required for max RC2 screenings ~~| Additional resources required for max intervention by type[RiskMgmt]= Additional resources required for max asympto risk mgmt ~~| Additional resources required for max intervention by type[SubDisMgmt]= Additional resources required for max subacute disease mgmt ~~| Additional resources required for max intervention by type[PostDisMgmt]= Additional resources required for max postacute disease mgmt ~~| Additional resources required for max intervention by type[AttackTx]= Additional resources required for max acute attack treatment ~ million dollars/Year ~ | Additional resources required for max postacute disease mgmt= MAX(0, Resources required for max postacute disease mgmt - Initial resources for postacute disease mgmt\ ) ~ dollars/Year ~ | Additional resources required for max subacute disease mgmt= MAX(0, Resources required for max subacute disease mgmt - Initial resources for subacute disease mgmt\ ) ~ dollars/Year ~ | Additional resources total billions series( [(0,0)-(50,80)],(0,0),(5,0),(10,0),(20,0),(30,0),(40,0),(50,0)) ~ billion dollars/Year ~ | Additional resources total provided under umbrella budget= 1e+009 * Additional resources total billions series(Time) ~ dollars/Year

48
~ | Adult deaths= SUM(Adult deaths by RC[RiskClass!]) ~ people/Year ~ | Adult deaths by RC[RiskClass]= Adult deaths from acute attack by RC[RiskClass] + Adult nonCVD deaths by RC[RiskClass\ ] ~ people/Year ~ | Adult deaths by RC initial[RiskClass]= INITIAL(Adult deaths by RC[RiskClass]) ~ people/Year ~ | Adult deaths from acute attack by RC[RiskClass]= Asympto deaths from acute attack by RC[RiskClass] + Subacute deaths from acute attack by RC\ [RiskClass] + Postacute deaths from recurrent attack by RC[RiskClass] ~ people/Year ~ | Adult deaths per thousand adult popn= Adult deaths/Adult popn*1000 ~ 1/Year/thousand ~ | Adult nonCVD deaths by RC[RiskClass]= Asympto nonCVD deaths by RC[RiskClass] + Subacute nonCVD deaths by RC[RiskClass] + Postacute nonCVD deaths by RC\ [RiskClass] ~ people/Year ~ | Adult popn= SUM(Adult popn by risk class[RiskClass!]) ~ people ~ | Adult popn by risk class[RiskClass]= Asymptomatic popn by risk class[RiskClass] + Symptomatic popn by risk class[RiskClass\ ] ~ people ~ | Adult popn by risk class initial[RiskClass]= 1e+006*Adult popn millions initial*Fraction of adult popn by risk class[RiskClass] ~ people ~ | Adult popn death rate if no CVD attack deaths=

49
0.026 ~ 1/Year ~ | Adult popn initial= INITIAL( Adult popn) ~ people ~ | Adult popn millions initial= 200.9 ~ million people ~ US census 2000 for age 20+. | Asympto attack deaths as fraction of total= ZIDZ(Asympto deaths from acute attack,Deaths from acute attacks) ~ dmnl ~ | Asympto attack rate if max risk mgmt[RiskClass]= 0.002,0.0036,0.0042,0.0048 ~ 1/Year ~ 0.0028,0.005,0.0059,0.0068; 1e: 0.0022,0.004,0.0047,0.0054 | Asympto attack rate if zero Risk Mgmt[RiskClass]= 0.002,0.0036,0.006,0.0112 ~ 1/Year ~ 0.0028,0.005,0.0084,0.016; 1e: 0.0022,0.004,0.0067,0.0126 | Asympto attacks as fraction of total= ZIDZ(Asympto popn acute attacks, Acute attacks) ~ dmnl ~ | Asympto deaths from acute attack= SUM(Asympto deaths from acute attack by RC[RiskClass!]) ~ people/Year ~ | Asympto deaths from acute attack by RC[RiskClass]= Asympto popn acute attacks by RC[RiskClass] * Fatal fraction of acute attacks ~ people/Year ~ | Asympto nonCVD deaths by RC[RiskClass]= Asymptomatic popn by risk class[RiskClass] * Adult popn death rate if no CVD attack deaths\ - Asympto deaths from acute attack by RC[RiskClass]*(1-Extent to which CVD attack deaths increase total deaths\ ) ~ people/Year ~ |

50
Asympto popn acute attack rate[RC1]= Asympto attack rate if zero Risk Mgmt[RC1] ~~| Asympto popn acute attack rate[RC2a]= Asympto attack rate if zero Risk Mgmt[RC2a] ~~| Asympto popn acute attack rate[RC2b]= Asympto attack rate if zero Risk Mgmt[RC2b] - (Asympto attack rate if zero Risk Mgmt\ [RC2b] - Asympto attack rate if max risk mgmt[RC2b])* Asymptomatic risk mgmt vs max*Screened fraction of asympto RC2 popn ~~| Asympto popn acute attack rate[RC3]= Asympto attack rate if zero Risk Mgmt[RC3] - (Asympto attack rate if zero Risk Mgmt[\ RC3] - Asympto attack rate if max risk mgmt[RC3])*Asymptomatic risk mgmt vs max ~ 1/Year ~ | Asympto popn acute attack rate initial[RC1]= Asympto attack rate if zero Risk Mgmt[RC1] ~~| Asympto popn acute attack rate initial[RC2a]= Asympto attack rate if zero Risk Mgmt[RC2a] ~~| Asympto popn acute attack rate initial[RC2b]= Asympto attack rate if zero Risk Mgmt[RC2b] ~~| Asympto popn acute attack rate initial[RC3]= Asympto attack rate if zero Risk Mgmt[RC3] - (Asympto attack rate if zero Risk Mgmt[\ RC3] - Asympto attack rate if max risk mgmt [RC3])*Asympto risk mgmt vs max initial ~ 1/Year ~ | Asympto popn acute attacks= SUM(Asympto popn acute attacks by RC[RiskClass!]) ~ people/Year ~ | Asympto popn acute attacks by RC[RiskClass]= Asymptomatic popn by risk class[RiskClass]*Asympto popn acute attack rate[RiskClass] ~ people/Year ~ | Asympto popn inflow by RC[RiskClass]= Adult deaths by RC initial[RiskClass] ~ people/Year ~ | Asympto popn symptoms onset rate[RC1]= Asympto symptoms onset rate if zero risk mgmt[RC1] ~~| Asympto popn symptoms onset rate[RC2a]= Asympto symptoms onset rate if zero risk mgmt[RC2a] ~~| Asympto popn symptoms onset rate[RC2b]= Asympto symptoms onset rate if zero risk mgmt[RC2b] - (Asympto symptoms onset rate if zero risk mgmt\ [RC2b] - Asympto symptoms onset rate if max risk mgmt[RC2b] )* Asymptomatic risk mgmt vs max*Screened fraction of asympto RC2 popn ~~| Asympto popn symptoms onset rate[RC3]= Asympto symptoms onset rate if zero risk mgmt[RC3] - (Asympto symptoms onset rate if zero risk mgmt\
51
[RC3] - Asympto symptoms onset rate if max risk mgmt[RC3] )*Asymptomatic risk mgmt vs max ~ 1/Year ~ | Asympto popn symptoms onset rate initial[RC1]= Asympto symptoms onset rate if zero risk mgmt[RC1] ~~| Asympto popn symptoms onset rate initial[RC2a]= Asympto symptoms onset rate if zero risk mgmt[RC2a] ~~| Asympto popn symptoms onset rate initial[RC2b]= Asympto symptoms onset rate if zero risk mgmt[RC2b] ~~| Asympto popn symptoms onset rate initial[RC3]= Asympto symptoms onset rate if zero risk mgmt[RC3] - (Asympto symptoms onset rate if zero risk mgmt\ [RC3] - Asympto symptoms onset rate if max risk mgmt [RC3] )*Asympto risk mgmt vs max initial ~ 1/Year ~ | Asympto risk mgmt vs max initial= 0.2 ~ dmnl ~ | Asympto surviving acute attack by RC[RiskClass]= Asympto popn acute attacks by RC[RiskClass] - Asympto deaths from acute attack by RC\ [RiskClass] ~ people/Year ~ | Asympto symptoms onset rate if max risk mgmt[RiskClass]= 0.0017,0.0031,0.0036,0.0041 ~ 1/Year ~ 0.0018,0.0031,0.0037,0.0043; 1e: 0.0018,0.0031,0.0037,0.0043; \ 0.0016,0.0029,0.0034,0.0039 | Asympto symptoms onset rate if zero risk mgmt[RiskClass]= 0.0017,0.0031,0.0051,0.0095 ~ 1/Year ~ 0.0018,0.0031,0.0053,0.01; 1e: 0.0018,0.0031,0.0053,0.01; \ 0.0016,0.0029,0.0048,0.009 | Asymptomatic popn= SUM(Asymptomatic popn by risk class[RiskClass!]) ~ people ~ | Asymptomatic popn by risk class[RiskClass]= INTEG ( Asympto popn inflow by RC[RiskClass] - Onset of subacute symptoms by RC[RiskClass] -\ Asympto deaths from acute attack by RC

52
[RiskClass] - Asympto surviving acute attack by RC[RiskClass] - Asympto nonCVD deaths by RC\ [RiskClass], Adult popn by risk class initial[RiskClass] - Subacute popn by risk class[RiskClass\ ] - Postacute popn by risk class[RiskClass]) ~ people ~ | Asymptomatic popn initial= INITIAL(Asymptomatic popn) ~ people ~ | Asymptomatic RC2 popn= Asymptomatic popn by risk class[RC2a]+Asymptomatic popn by risk class[RC2b] ~ people ~ | Asymptomatic risk mgmt vs max= MIN(1,ZIDZ(Resources used for asympto risk mgmt,Resources required for max asympto risk mgmt\ )) ~ ~ | Avg unhealthy days per mo for adult popn= (Asymptomatic popn*Avg unhealthy days per mo for Asympto + Subacute popn*(Subacute disease mgmt vs max *Avg unhealthy days per mo for Subacute w max disease mgmt + (1-Subacute disease mgmt vs max\ )*Avg unhealthy days per mo for Subacute w no disease mgmt ) + Postacute popn*(Postacute disease mgmt vs max*Avg unhealthy days per mo for Postacute w max disease mgmt + (1-Postacute disease mgmt vs max)*Avg unhealthy days per mo for Postacute w no disease mgmt\ )) / Adult popn ~ days/month ~ | Avg unhealthy days per mo for adult popn initial= (Asymptomatic popn initial*Avg unhealthy days per mo for Asympto + Subacute popn initial\ *(Subacute disease mgmt vs max initial *Avg unhealthy days per mo for Subacute w max disease mgmt + (1-Subacute disease mgmt vs max initial\ )*Avg unhealthy days per mo for Subacute w no disease mgmt ) + Postacute popn initial*(Postacute disease mgmt vs max initial*Avg unhealthy days per mo for Postacute w max disease mgmt + (1-Postacute disease mgmt vs max initial)*Avg unhealthy days per mo for Postacute w no disease mgmt\ )) / Adult popn initial ~ days/month ~ | Avg unhealthy days per mo for Asympto=
53
6 ~ days/month ~ | Avg unhealthy days per mo for Postacute w max disease mgmt= 9.8 ~ days/month ~ | Avg unhealthy days per mo for Postacute w no disease mgmt= 13.6 ~ days/month ~ | Avg unhealthy days per mo for Subacute w max disease mgmt= 7.5 ~ days/month ~ | Avg unhealthy days per mo for Subacute w no disease mgmt= 9 ~ days/month ~ | Combined intervention resources= Resources used for RC2 screening + Resources used for asympto risk mgmt + Resources used for subacute disease mgmt\ + Resources used for postacute disease mgmt + Resources used for acute attacks ~ dollars/Year ~ | Combined resources required for max intervention= Resources required for max RC2 screenings + Resources required for max asympto risk mgmt\ + Resources required for max subacute disease mgmt + Resources required for max postacute disease mgmt\ + Resources required for max treatment of nonsudden death acute attacks ~ dollars/Year ~ | Cumul additional QALYs= INTEG ( Additional QALYs per year, 0) ~ QALYs ~ | Cumul additional resources= INTEG ( Additional resources provided, 0) ~ dollars ~ | Cumul additional resources per QALY= ZIDZ(Cumul additional resources,Cumul additional QALYs) ~ dollars/QALY
54
~ | Deaths from acute attack per thousand adult popn= Deaths from acute attacks/Adult popn*1000 ~ 1/Year/thousand ~ | Deaths from acute attacks= Asympto deaths from acute attack + Subacute deaths from acute attack + Postacute deaths from recurrent attack ~ people/Year ~ | Extent to which CVD attack deaths increase total deaths= 0.5 ~ dmnl ~ | Fatal fraction of acute attacks= Sudden death fraction of attacks*1 + (1-Sudden death fraction of attacks)*Fatal fraction of nonsudden death acute attacks ~ dmnl ~ | Fatal fraction of acute attacks initial= Sudden death fraction of attacks*1 + (1-Sudden death fraction of attacks)*Fatal fraction of nonsudden death acute attacks initial ~ dmnl ~ | Fatal fraction of nonsudden death acute attacks= Fatal fraction of nonsudden death attacks if zero treatment - (Fatal fraction of nonsudden death attacks if zero treatment - Fatal fraction of nonsudden death attacks if max treatment)*Nonsudden death acute attack treatment vs max ~ dmnl ~ | Fatal fraction of nonsudden death acute attacks initial= Fatal fraction of nonsudden death attacks if zero treatment - (Fatal fraction of nonsudden death attacks if zero treatment - Fatal fraction of nonsudden death attacks if max treatment)*Nonsudden death acute attack treatment vs max initial ~ dmnl ~ | Fatal fraction of nonsudden death attacks if max treatment= 0.175 ~ dmnl ~ | Fatal fraction of nonsudden death attacks if zero treatment= 0.53 ~ dmnl ~ |

55
First time acute attacks= Asympto popn acute attacks + Subacute popn acute attacks ~ people/Year ~ | Fraction of adult popn by risk class[RiskClass]= 0.38,0.34,0.19,0.09 ~ dmnl ~ Must sum to 100%. Risk classes 1 (low), 2a, 2b, and 3 (high) based on \ number of risk factors (RFs) per BRFSS 1999. (High BP, high cholesterol, \ diabetes, obesity, smoker.) Tentatively using: RC1=0 RFs; RC2=[1 or 2] \ RFs, RC3=3 or more RFs. For now, did split between 2a and 2b by assuming \ 2a corresponds to 1 RF (34%) and 2b corresponds to 2 RFs (19%) | Fraction of need filled[InterventionType]= 0,0,0,0,0 ~ ~ | Fraction of need filled phasing in series( [(0,0)-(50,1)],(0,0),(5,0),(10,1),(20,1),(30,1),(40,1),(50,1)) ~ dmnl ~ | Fraction of resources used by intervention type[Screen]= Fraction of resources used for RC2 screening ~~| Fraction of resources used by intervention type[RiskMgmt]= Fraction of resources used for asympto risk mgmt ~~| Fraction of resources used by intervention type[SubDisMgmt]= Fraction of resources used for subacute disease mgmt ~~| Fraction of resources used by intervention type[PostDisMgmt]= Fraction of resources used for postacute disease mgmt ~~| Fraction of resources used by intervention type[AttackTx]= Fraction of resources used for acute attack treatment ~ dmnl ~ | Fraction of resources used for acute attack treatment= Resources used for acute attacks/Combined intervention resources ~ dmnl ~ | Fraction of resources used for asympto risk mgmt= Resources used for asympto risk mgmt/Combined intervention resources ~ dmnl ~ | Fraction of resources used for postacute disease mgmt= Resources used for postacute disease mgmt/Combined intervention resources ~ dmnl ~ | Fraction of resources used for RC2 screening= Resources used for RC2 screening/Combined intervention resources ~ dmnl

56
~ | Fraction of resources used for subacute disease mgmt= Resources used for subacute disease mgmt/Combined intervention resources ~ dmnl ~ | Initial resources for asympto risk mgmt= Initial resources reqd for max asympto risk mgmt * Asympto risk mgmt vs max initial ~ dollars/Year ~ | Initial resources for nonsudden death acute attack treatment= Initial resources reqd for max treatment of nonsudden death acute attacks * Nonsudden death acute attack treatment vs max initial ~ dollars/Year ~ | Initial resources for postacute disease mgmt= Initial resources reqd for max postacute disease mgmt * Postacute disease mgmt vs max initial ~ dollars/Year ~ | Initial resources for subacute disease mgmt= Initial resources reqd for max subacute disease mgmt * Subacute disease mgmt vs max initial ~ dollars/Year ~ | Initial resources reqd for max asympto risk mgmt= INITIAL( Resources required for max asympto risk mgmt) ~ dollars/Year ~ | Initial resources reqd for max postacute disease mgmt= INITIAL( Resources required for max postacute disease mgmt) ~ dollars/Year ~ | Initial resources reqd for max subacute disease mgmt= INITIAL( Resources required for max subacute disease mgmt) ~ dollars/Year ~ | Initial resources reqd for max treatment of nonsudden death acute attacks= INITIAL( Resources required for max treatment of nonsudden death acute attacks) ~ dollars/Year ~ | Interventions vs max by type[Screen]= Screened fraction of asympto RC2 popn ~~| Interventions vs max by type[RiskMgmt]= Asymptomatic risk mgmt vs max ~~| Interventions vs max by type[SubDisMgmt]= Subacute disease mgmt vs max ~~|

57
Interventions vs max by type[PostDisMgmt]= Postacute disease mgmt vs max ~~| Interventions vs max by type[AttackTx]= Nonsudden death acute attack treatment vs max ~ dmnl ~ | Max RC2 first time screenings= (Asymptomatic RC2 popn - Screened asympto RC2 popn)/1 ~ people/Year ~ | Nonsudden death acute attack treatment vs max= MIN(1,ZIDZ(Resources used for nonsudden death acute attack treatment,Resources required for max treatment of nonsudden death acute attacks\ )) ~ dmnl ~ | Nonsudden death acute attack treatment vs max initial= 0.7 ~ dmnl ~ | Nonsudden death acute attacks= Acute attacks*(1-Sudden death fraction of attacks) ~ ~ | Onset of subacute symptoms= SUM(Onset of subacute symptoms by RC[RiskClass!]) ~ people/Year ~ | Onset of subacute symptoms by RC[RiskClass]= Asymptomatic popn by risk class[RiskClass]*Asympto popn symptoms onset rate[RiskClass\ ] ~ people/Year ~ | Outflow of screened asympto RC2 popn= (Asympto popn acute attacks by RC[RC2a]+Asympto popn acute attacks by RC[RC2b] + Onset of subacute symptoms by RC [RC2a]+Onset of subacute symptoms by RC[RC2b])*Screened fraction of asympto RC2 popn\ + (Screened asympto RC2 popn*Adult popn death rate if no CVD attack deaths ) ~ people/Year ~ | Outflow rate of screened asympto RC2 popn= ZIDZ(Outflow of screened asympto RC2 popn, Screened asympto RC2 popn) ~ 1/Year ~ |
58
People surviving acute attacks= Acute attacks - Deaths from acute attacks ~ people/Year ~ | Postacute attack deaths as fraction of total= ZIDZ(Postacute deaths from recurrent attack,Deaths from acute attacks) ~ dmnl ~ | Postacute attack rate if max disease mgmt= 0.0387 ~ 1/Year ~ | Postacute attack rate if zero disease mgmt= 0.0773 ~ 1/Year ~ | Postacute attacks as fraction of total= ZIDZ(Postacute recurrent attacks, Acute attacks) ~ dmnl ~ | Postacute deaths from recurrent attack= SUM(Postacute deaths from recurrent attack by RC[RiskClass!]) ~ people/Year ~ | Postacute deaths from recurrent attack by RC[RiskClass]= Postacute popn recurrent attacks by RC[RiskClass]*Fatal fraction of acute attacks ~ people/Year ~ | Postacute disease mgmt vs max= MIN(1,ZIDZ(Resources used for postacute disease mgmt,Resources required for max postacute disease mgmt\ )) ~ dmnl ~ | Postacute disease mgmt vs max initial= 0.5 ~ dmnl ~ | Postacute fraction of symptomatic= Postacute popn/Symptomatic popn ~ dmnl ~ | Postacute nonCVD deaths by RC[RiskClass]= Postacute popn by risk class[RiskClass]*Adult popn death rate if no CVD attack deaths\ - Postacute deaths from recurrent attack by RC[RiskClass]*(1-Extent to which CVD attack deaths increase total deaths\

59
) ~ people/Year ~ | Postacute popn= SUM(Postacute popn by risk class[RiskClass!]) ~ people ~ | Postacute popn acute attack rate= Postacute attack rate if zero disease mgmt - (Postacute attack rate if zero disease mgmt\ - Postacute attack rate if max disease mgmt)*Postacute disease mgmt vs max ~ 1/Year ~ | Postacute popn acute attack rate initial= Postacute attack rate if zero disease mgmt - (Postacute attack rate if zero disease mgmt\ - Postacute attack rate if max disease mgmt )*Postacute disease mgmt vs max initial ~ 1/Year ~ | Postacute popn by risk class[RiskClass]= INTEG ( Asympto surviving acute attack by RC[RiskClass]+Subacute surviving acute attack by RC\ [RiskClass]-Postacute nonCVD deaths by RC[RiskClass]-Postacute deaths from recurrent attack by RC\ [RiskClass], Postacute popn by risk class initial[RiskClass]) ~ million people ~ | Postacute popn by risk class initial[RiskClass]= Adult popn by risk class initial[RiskClass] * Postacute popn fraction by risk class initial\ [RiskClass] ~ people ~ | Postacute popn fraction by risk class initial[RiskClass]= ZIDZ( (1-Subacute fraction of Not Postacute by risk class initial[RiskClass])*Asympto popn acute attack rate initial\ [RiskClass ]*(1-Fatal fraction of acute attacks initial) + Subacute fraction of Not Postacute by risk class initial\ [RiskClass]*Subacute popn acute attack rate initial *(1-Fatal fraction of acute attacks initial), (1-Subacute fraction of Not Postacute by risk class initial\ [RiskClass])*Asympto popn acute attack rate initial [RiskClass]*(1-Fatal fraction of acute attacks initial) + Postacute popn acute attack rate initial\ *Fatal fraction of acute attacks initial*Extent to which CVD attack deaths increase total deaths + Adult popn death rate if no CVD attack deaths + Subacute fraction of Not Postacute by risk class initial\ [RiskClass]*Subacute popn acute attack rate initial *(1-Fatal fraction of acute attacks initial)

60
~ dmnl ~ see derivation 6/28/06 | Postacute popn initial= INITIAL(Postacute popn) ~ people ~ | Postacute popn prevalence= Postacute popn/Adult popn ~ dmnl ~ | Postacute popn recurrent attacks by RC[RiskClass]= Postacute popn by risk class[RiskClass]*Postacute popn acute attack rate ~ people/Year ~ | Postacute popn surviving recurrent attack by RC[RiskClass]= Postacute popn recurrent attacks by RC[RiskClass] - Postacute deaths from recurrent attack by RC\ [RiskClass] ~ people/Year ~ | Postacute recurrent attacks= SUM(Postacute popn recurrent attacks by RC[RiskClass!]) ~ people/Year ~ | Priority of intervention by type[InterventionType]= 8,8.5,9,9.5,10 ~ dmnl ~ priority scale 0-10 | QALYs per year for adult popn= (1 - Avg unhealthy days per mo for adult popn/30) * Adult popn ~ QALYs/Year ~ | QALYs per year for adult popn initial= (1 - Avg unhealthy days per mo for adult popn initial/30) * Adult popn initial ~ QALYs/Year ~ | RC2 first time screenings= Max RC2 first time screenings * RC2 first time screenings vs max ~ people/Year ~ | RC2 first time screenings vs max= MIN(1,ZIDZ(Resources used for RC2 first time screenings, Resources required for max RC2 first time screenings\ ))

61
~ dmnl ~ | RC2 rescreenings= Screened asympto RC2 popn/Screening interval ~ people/Year ~ | Resources required for max asympto risk mgmt= Resources required per patient for max asympto risk mgmt*(Asymptomatic popn by risk class\ [RC3] + Asymptomatic popn by risk class [RC2b]*Screened fraction of asympto RC2 popn) ~ dollars/Year ~ | Resources required for max postacute disease mgmt= Postacute popn * Resources required per postacute patient for max disease mgmt ~ dollars/Year ~ | Resources required for max RC2 first time screenings= Max RC2 first time screenings * Resources required per RC2 screening ~ ~ use only with RC2 | Resources required for max RC2 screenings= Resources required for max RC2 first time screenings + Resources used for RC2 rescreenings ~ dollars/Year ~ | Resources required for max subacute disease mgmt= Resources required for max subacute disease mgmt ongoing + Resources required for max subacute disease mgmt from onset ~ dollars/Year ~ | Resources required for max subacute disease mgmt from onset= Onset of subacute symptoms*Resources required per subacute symptoms onset for max disease mgmt ~ dollars/Year ~ | Resources required for max subacute disease mgmt ongoing= Subacute popn*Resources required per subacute patient for max disease mgmt ~ dollars/Year ~ | Resources required for max treatment of nonsudden death acute attacks= Nonsudden death acute attacks * Resources required per nonsudden death acute attack for max treatment ~ dollars/Year ~ |
62
Resources required per nonsudden death acute attack for max treatment= 32000 ~ dollars/person ~ | Resources required per patient for max asympto risk mgmt= 2690 ~ dollars/person ~ | Resources required per postacute patient for max disease mgmt= 4121 ~ dollars/(person*Year) ~ CDC 2002 and Hayashino 2004 | Resources required per RC2 screening= 350 ~ dollars/person ~ | Resources required per subacute patient for max disease mgmt= 3914 ~ dollars/(person*Year) ~ CDC 2002 and Hayashino 2004 | Resources required per subacute symptoms onset for max disease mgmt= 2992 ~ dollars/(person*Year) ~ Hayashino 2004 | Resources used for acute attacks= Resources used for nonsudden death acute attack treatment + Resources used for sudden death attacks ~ dollars/Year ~ | Resources used for asympto risk mgmt= Additional resources for asympto risk mgmt + Initial resources for asympto risk mgmt ~ dollars/Year ~ | Resources used for nonsudden death acute attack treatment= Additional resources for nonsudden death acute attack treatment + Initial resources for nonsudden death acute attack treatment ~ dollars/Year ~ | Resources used for postacute disease mgmt= Additional resources for postacute disease mgmt + Initial resources for postacute disease mgmt ~ dollars/Year ~ |

63
Resources used for RC2 first time screenings= Resources used for RC2 screening - Resources used for RC2 rescreenings ~ dollars/Year ~ | Resources used for RC2 rescreenings= RC2 rescreenings * Resources required per RC2 screening ~ dollars/Year ~ | Resources used for RC2 screening= IF THEN ELSE(Switch for separate resource budgets=0,Additional resources provided by intervention type under umbrella budget\ [Screen],Additional resources provided by intervention type under separate budgets[\ Screen]) ~ dollars/Year ~ | Resources used for subacute disease mgmt= Additional resources for subacute disease mgmt + Initial resources for subacute disease mgmt ~ dollars/Year ~ | Resources used for sudden death attacks= Sudden death acute attacks*Resources used per sudden death attack ~ dollars/Year ~ | Resources used per sudden death attack= 1000 ~ dollars/person ~ | Screened asympto RC2 popn= INTEG ( RC2 first time screenings - Outflow of screened asympto RC2 popn, 0) ~ people ~ | Screened fraction of asympto RC2 popn= ZIDZ(Screened asympto RC2 popn,Asymptomatic RC2 popn) ~ dmnl ~ | Screening interval= 5 ~ years ~ | Subacute attack deaths as fraction of total= ZIDZ(Subacute deaths from acute attack,Deaths from acute attacks) ~ dmnl ~ |

64
Subacute attack rate if max disease mgmt= 0.0216 ~ 1/Year ~ | Subacute attack rate if zero disease mgmt= 0.0431 ~ 1/Year ~ | Subacute attacks as fraction of total= ZIDZ(Subacute popn acute attacks, Acute attacks) ~ dmnl ~ | Subacute deaths from acute attack= SUM(Subacute deaths from acute attack by RC[RiskClass!]) ~ people/Year ~ | Subacute deaths from acute attack by RC[RiskClass]= Subacute popn acute attacks by RC[RiskClass]*Fatal fraction of acute attacks ~ people/Year ~ | Subacute disease mgmt vs max= MIN(1,ZIDZ(Resources used for subacute disease mgmt,Resources required for max subacute disease mgmt\ )) ~ dmnl ~ | Subacute disease mgmt vs max initial= 0.33 ~ dmnl ~ | Subacute fraction of Not Postacute by risk class initial[RiskClass]= ZIDZ(Asympto popn symptoms onset rate initial[RiskClass], Asympto popn symptoms onset rate initial\ [RiskClass] + Subacute popn acute attack rate initial*(1-Fatal fraction of acute attacks initial\ +Fatal fraction of acute attacks initial*Extent to which CVD attack deaths increase total deaths\ ) + Adult popn death rate if no CVD attack deaths) ~ dmnl ~ see derivation 6/28/06 | Subacute nonCVD deaths by RC[RiskClass]= Subacute popn by risk class[RiskClass]*Adult popn death rate if no CVD attack deaths\ - Subacute deaths from acute attack by RC[RiskClass]*(1-Extent to which CVD attack deaths increase total deaths\ ) ~ people/Year

65
~ | Subacute popn= SUM(Subacute popn by risk class[RiskClass!]) ~ people ~ | Subacute popn acute attack rate= Subacute attack rate if zero disease mgmt - (Subacute attack rate if zero disease mgmt\ - Subacute attack rate if max disease mgmt)*Subacute disease mgmt vs max ~ 1/Year ~ | Subacute popn acute attack rate initial= Subacute attack rate if zero disease mgmt - (Subacute attack rate if zero disease mgmt\ - Subacute attack rate if max disease mgmt )*Subacute disease mgmt vs max initial ~ 1/Year ~ | Subacute popn acute attacks= SUM(Subacute popn acute attacks by RC[RiskClass!]) ~ people/Year ~ | Subacute popn acute attacks by RC[RiskClass]= Subacute popn by risk class[RiskClass]*Subacute popn acute attack rate ~ people/Year ~ | Subacute popn by risk class[RiskClass]= INTEG ( Onset of subacute symptoms by RC[RiskClass]-Subacute deaths from acute attack by RC[\ RiskClass]-Subacute nonCVD deaths by RC[RiskClass]-Subacute surviving acute attack by RC\ [RiskClass], Subacute popn by risk class initial[RiskClass]) ~ people ~ | Subacute popn by risk class initial[RiskClass]= (Adult popn by risk class initial[RiskClass] - Postacute popn by risk class initial[\ RiskClass]) * Subacute fraction of Not Postacute by risk class initial[RiskClass] ~ people ~ | Subacute popn initial= INITIAL(Subacute popn) ~ people ~ | Subacute popn prevalence= Subacute popn/Adult popn ~ dmnl ~ |
66
Subacute surviving acute attack by RC[RiskClass]= Subacute popn acute attacks by RC[RiskClass] - Subacute deaths from acute attack by RC\ [RiskClass] ~ people/Year ~ | Sudden death acute attacks= Acute attacks*Sudden death fraction of attacks ~ people/Year ~ | Sudden death fraction of attacks= 0.26 ~ dmnl ~ Assume 55% of acute attack deaths are sudden (the number is 63% for MI; \ assume lower for stroke.) Overall attack fatality rate is 47%, so sudden \ death fraction of all attacks is 55%x47% = 26%. | Switch for separate resource budgets= 0 ~ ~ | Symptomatic nonCVD deaths= SUM(Subacute nonCVD deaths by RC[RiskClass!]+Postacute nonCVD deaths by RC[RiskClass\ !]) ~ people/Year ~ | Symptomatic popn= SUM(Symptomatic popn by risk class[RiskClass!]) ~ people ~ | Symptomatic popn by risk class[RiskClass]= Subacute popn by risk class[RiskClass] + Postacute popn by risk class[RiskClass] ~ people ~ | Symptomatic popn prevalence= Symptomatic popn/Adult popn ~ dmnl ~ | Time to reassess resource needs= 2 ~ years ~ | ******************************************************** .Array ********************************************************~ Subscripted Arrays

67
| InterventionType: Screen,RiskMgmt,SubDisMgmt,PostDisMgmt,AttackTx ~ ~ | RiskClass: RC1,RC2a,RC2b,RC3 ~ ~ | ******************************************************** .Control ********************************************************~ Simulation Control Parameters | FINAL TIME = 50 ~ Year ~ The final time for the simulation. | INITIAL TIME = 0 ~ Year ~ The initial time for the simulation. | SAVEPER = TIME STEP ~ Year [0,?] ~ The frequency with which output is stored. | TIME STEP = 0.25 ~ Year [0,?] ~ The time step for the simulation. | \\\---/// Sketch information - do not modify anything except names V300 Do not put anything below this section - it will be ignored *Stock-flow structure $192-192-192,0,Arial|12||0-0-0|0-0-0|0-0-255|-1--1--1|-1--1--1|96,96,75,0 10,1,Subacute popn by risk class,574,377,63,35,3,3,0,4,0,0,0,0,0-0-0,255-255-128,|12||0-0-0 10,2,Postacute popn by risk class,979,373,66,36,3,3,0,4,0,0,0,0,0-0-0,255-255-128,|12||0-0-0 1,3,4,1,4,0,0,22,0,0,0,-1--1--1,,1|(472,373)| 11,4,2012,428,373,6,8,34,3,0,0,1,0,0,0 10,5,Onset of subacute symptoms by RC,428,404,65,23,40,3,0,0,-1,0,0,0 1,6,8,2,4,0,0,22,0,0,0,-1--1--1,,1|(848,375)| 1,7,8,1,100,0,0,22,0,0,0,-1--1--1,,1|(704,375)| 11,8,1980,778,375,6,8,34,3,0,0,1,0,0,0 10,9,Subacute surviving acute attack by RC,778,416,69,18,40,3,0,0,-1,0,0,0 1,10,11,2,4,0,0,22,0,0,0,-1--1--1,,3|(979,99)|(979,99)|(979,218)| 11,11,3148,380,99,6,8,34,3,0,0,1,0,0,0 10,12,Asympto surviving acute attack by RC,380,125,69,18,40,3,0,0,-1,0,0,0 12,13,48,744,254,10,8,0,3,0,0,-1,0,0,0

68
1,14,16,13,4,0,0,22,0,0,0,-1--1--1,,1|(697,252)| 1,15,16,1,100,0,0,22,0,0,0,-1--1--1,,1|(574,252)| 11,16,48,654,252,6,8,34,3,0,0,1,0,0,0 10,17,Subacute deaths from acute attack by RC,654,286,86,26,40,3,0,0,-1,0,0,0 12,18,48,576,523,10,8,0,3,0,0,-1,0,0,0 1,19,21,18,4,0,0,22,0,0,0,-1--1--1,,1|(576,492)| 1,20,21,1,100,0,0,22,0,0,0,-1--1--1,,1|(576,435)| 11,21,48,576,464,8,6,33,3,0,0,4,0,0,0 10,22,Subacute nonCVD deaths by RC,646,464,69,18,40,3,0,0,-1,0,0,0 12,23,48,978,518,10,8,0,3,0,0,-1,0,0,0 1,24,26,23,4,0,0,22,0,0,0,-1--1--1,,1|(978,487)| 1,25,26,2,100,0,0,22,0,0,0,-1--1--1,,1|(978,431)| 11,26,48,978,459,8,6,33,3,0,0,4,0,0,0 10,27,Postacute nonCVD deaths by RC,1051,459,71,18,40,3,0,0,-1,0,0,0 10,28,Adult popn death rate if no CVD attack deaths,356,600,78,27,8,3,0,2,0,0,0,0,0-0-0,0-0-0,|12||255-0-0 1,29,28,22,0,0,0,0,0,64,0,-1--1--1,,1|(503,530)| 1,30,28,27,0,0,0,0,0,64,0,-1--1--1,,1|(700,530)| 1,31,1,22,0,0,0,0,0,64,0,-1--1--1,,1|(611,423)| 1,32,2,27,0,0,0,0,0,64,0,-1--1--1,,1|(1017,419)| 12,33,48,1153,245,10,8,0,3,0,0,-1,0,0,0 1,34,36,33,4,0,0,22,0,0,0,-1--1--1,,3|(1138,246)|(1138,246)|(1140,246)| 1,35,36,2,100,0,0,22,0,0,0,-1--1--1,,1|(979,246)| 11,36,48,1058,246,6,8,34,3,0,0,1,0,0,0 10,37,Postacute deaths from recurrent attack by RC,1058,285,82,18,40,3,0,0,-1,0,0,0 10,38,Fatal fraction of acute attacks,624,66,71,27,8,2,0,3,-1,0,0,0,64-128-128,0-0-0,|12||64-128-128 10,39,Asympto popn acute attack rate,179,94,66,18,8,2,0,3,-1,0,0,0,64-128-128,0-0-0,|12||64-128-128 10,40,Subacute popn acute attack rate,421,306,66,18,8,2,0,3,-1,0,0,0,64-128-128,0-0-0,|12||64-128-128 10,41,Postacute popn acute attack rate,1132,85,66,18,8,2,0,3,-1,0,0,0,64-128-128,0-0-0,|12||64-128-128 10,42,Asympto popn acute attacks by RC,179,210,59,27,8,3,0,0,0,0,0,0 1,43,42,12,0,0,0,0,0,64,0,-1--1--1,,1|(281,167)| 1,44,39,42,1,0,0,0,0,64,0,-1--1--1,,1|(165,139)| 10,45,Subacute popn acute attacks by RC,527,194,73,18,8,3,0,0,0,0,0,0 1,46,1,45,1,0,0,0,0,64,0,-1--1--1,,1|(524,291)| 1,47,45,17,1,0,0,0,0,64,0,-1--1--1,,1|(616,214)| 1,48,40,45,0,0,0,0,0,64,0,-1--1--1,,1|(468,255)| 1,49,45,9,1,0,0,0,0,64,0,-1--1--1,,1|(746,233)| 1,50,17,9,1,0,0,0,0,64,0,-1--1--1,,1|(735,329)| 1,51,38,17,1,0,0,0,0,64,0,-1--1--1,,1|(674,164)| 10,52,Postacute popn recurrent attacks by RC,1060,169,71,27,8,3,0,0,0,0,0,0 1,53,41,52,0,0,0,0,0,64,0,-1--1--1,,1|(1104,117)| 1,54,2,52,1,0,0,0,0,64,0,-1--1--1,,1|(979,258)| 1,55,52,37,0,0,0,0,0,64,0,-1--1--1,,1|(1059,224)| 1,56,38,37,1,0,0,0,0,64,0,-1--1--1,,1|(923,137)| 10,57,Asympto popn symptoms onset rate,443,521,60,27,8,2,0,3,-1,0,0,0,64-128-128,0-0-0,|12||64-128-128 10,58,Symptomatic popn by risk class,832,589,69,18,8,3,0,0,0,0,0,0 1,59,2,58,0,0,0,0,0,64,0,-1--1--1,,1|(903,484)| 1,60,1,58,1,0,0,0,0,64,0,-1--1--1,,1|(747,457)| 10,61,Adult popn by risk class initial,195,692,65,18,8,3,0,0,-1,0,0,0 10,62,Postacute popn surviving recurrent attack by RC,1153,362,66,27,8,3,0,0,0,0,0,0 1,63,52,62,1,0,0,0,0,64,0,-1--1--1,,1|(1195,209)|
69
1,64,37,62,0,0,0,0,0,64,0,-1--1--1,,1|(1094,314)| 1,65,57,5,1,0,0,0,0,64,0,-1--1--1,,1|(452,467)| 10,66,Adult popn millions initial,116,627,49,18,8,3,0,2,0,0,0,0,0-0-0,0-0-0,|12||255-0-0 10,67,Fraction of adult popn by risk class,112,761,66,18,8,3,0,2,0,0,0,0,0-0-0,0-0-0,|12||255-0-0 1,68,66,61,0,0,0,0,0,64,0,-1--1--1,,1|(149,655)| 1,69,67,61,0,0,0,0,0,64,0,-1--1--1,,1|(147,730)| 1,70,11,84,100,0,0,22,0,0,0,-1--1--1,,1|(286,99)| 1,71,4,84,100,0,0,22,0,0,0,-1--1--1,,1|(385,373)| 1,72,42,94,0,0,0,0,0,64,0,-1--1--1,,1|(255,224)| 1,73,94,12,0,0,0,0,0,64,0,-1--1--1,,1|(370,192)| 1,74,38,94,1,0,0,0,0,64,0,-1--1--1,,1|(469,147)| 10,75,Postacute popn,1184,508,41,19,8,3,0,16,0,0,0,0,0-0-0,0-0-0,|12|B|0-0-0 10,76,Subacute popn,530,563,39,19,8,3,0,16,0,0,0,0,0-0-0,0-0-0,|12|B|0-0-0 1,77,1,76,0,0,0,0,0,64,0,-1--1--1,,1|(551,471)| 1,78,2,75,1,0,0,0,0,64,0,-1--1--1,,1|(1145,437)| 10,79,Symptomatic popn,854,667,53,19,8,3,0,16,0,0,0,0,0-0-0,0-0-0,|12|B|0-0-0 10,80,Asymptomatic popn,150,482,58,19,8,3,0,16,0,0,0,0,0-0-0,0-0-0,|12|B|0-0-0 1,81,58,79,0,0,0,0,0,64,0,-1--1--1,,1|(840,620)| 10,82,Subacute popn by risk class initial,574,430,60,18,8,2,1,3,-1,0,0,0,64-128-128,0-0-0,|12||64-128-128 10,83,Postacute popn by risk class initial,979,427,62,18,8,2,1,3,-1,0,0,0,64-128-128,0-0-0,|12||64-128-128 10,84,Asymptomatic popn by risk class,286,378,63,35,3,3,0,4,0,0,0,0,0-0-0,255-255-128,|12||0-0-0 12,85,48,85,382,10,8,0,3,0,0,-1,0,0,0 1,86,88,84,4,0,0,22,0,0,0,-1--1--1,,1|(194,382)| 1,87,88,85,100,0,0,22,0,0,0,-1--1--1,,1|(124,382)| 11,88,48,160,382,6,8,34,3,0,0,1,0,0,0 10,89,Asympto popn inflow by RC,160,415,53,18,40,3,0,0,-1,0,0,0 12,90,48,419,223,10,8,0,3,0,0,-1,0,0,0 1,91,93,90,4,0,0,22,0,0,0,-1--1--1,,1|(389,221)| 1,92,93,84,100,0,0,22,0,0,0,-1--1--1,,1|(286,221)| 11,93,48,364,221,6,8,34,3,0,0,1,0,0,0 10,94,Asympto deaths from acute attack by RC,364,247,78,18,40,3,0,0,0,0,0,0 1,95,84,5,1,0,0,0,0,64,0,-1--1--1,,1|(320,425)| 1,96,84,42,1,0,0,0,0,64,0,-1--1--1,,1|(212,316)| 1,97,84,80,0,0,0,0,0,64,0,-1--1--1,,1|(213,433)| 12,98,48,285,537,10,8,0,3,0,0,-1,0,0,0 1,99,101,98,4,0,0,22,0,0,0,-1--1--1,,1|(285,503)| 1,100,101,84,100,0,0,22,0,0,0,-1--1--1,,1|(285,439)| 11,101,48,285,471,8,6,33,3,0,0,4,0,0,0 10,102,Asympto nonCVD deaths by RC,352,471,66,18,40,3,0,0,-1,0,0,0 1,103,28,102,0,0,0,0,0,64,0,-1--1--1,,1|(354,537)| 1,104,84,102,1,0,0,0,0,64,0,-1--1--1,,1|(318,434)| 10,105,Adult popn by risk class,464,707,50,18,8,3,0,0,0,0,0,0 1,106,58,105,0,0,0,0,0,64,0,-1--1--1,,1|(651,646)| 1,107,84,105,1,0,0,0,0,64,0,-1--1--1,,1|(204,545)| 10,108,Adult popn,576,758,39,10,8,3,0,0,0,0,0,0 1,109,105,108,0,0,0,0,0,64,0,-1--1--1,,1|(522,733)| 10,110,Adult deaths by RC initial,95,308,61,18,8,2,0,3,-1,0,0,0,64-128-128,0-0-0,|12||64-128-128 1,111,110,89,0,0,0,0,0,64,0,-1--1--1,,1|(123,355)| 10,112,Symptomatic popn prevalence,860,741,61,18,8,3,0,0,0,0,0,0 10,113,Postacute popn prevalence,1120,655,58,18,8,3,0,0,0,0,0,0 10,114,Subacute popn prevalence,676,692,56,18,8,3,0,0,0,0,0,0 1,115,76,114,0,0,0,0,0,64,0,-1--1--1,,1|(597,623)| 1,116,108,114,0,0,0,0,0,64,0,-1--1--1,,1|(613,732)|

70
1,117,108,112,0,0,0,0,0,64,0,-1--1--1,,1|(700,750)| 1,118,79,112,0,0,0,0,0,64,0,-1--1--1,,1|(855,697)| 1,119,108,113,0,0,0,0,0,64,0,-1--1--1,,1|(831,709)| 1,120,75,113,0,0,0,0,0,64,0,-1--1--1,,1|(1154,575)| 10,121,Postacute fraction of symptomatic,1014,592,66,18,8,3,0,0,0,0,0,0 1,122,79,121,0,0,0,0,0,64,0,-1--1--1,,1|(928,631)| 1,123,75,121,0,0,0,0,0,64,0,-1--1--1,,1|(1104,547)| 1,124,94,102,0,0,0,0,0,64,0,-1--1--1,,1|(358,352)| 1,125,17,22,0,0,0,0,0,64,0,-1--1--1,,1|(649,372)| 1,126,37,27,0,0,0,0,0,64,0,-1--1--1,,1|(1054,365)| 10,127,Extent to which CVD attack deaths increase total deaths,489,641,83,27,8,3,0,2,0,0,0,0,0-0-0,0-0-0,|12||255-0-0 1,128,82,1,0,0,0,0,0,64,1,-1--1--1,,1|(574,412)| 1,129,83,2,0,0,0,0,0,64,1,-1--1--1,,1|(979,409)| 1,130,61,84,0,0,0,0,0,64,1,-1--1--1,,1|(235,550)| 1,131,1,84,0,0,0,0,0,64,1,-1--1--1,,1|(437,377)| 1,132,2,84,0,0,0,0,0,64,1,-1--1--1,,1|(637,374)| 1,133,127,102,0,0,0,0,0,64,0,-1--1--1,,1|(421,556)| 1,134,127,22,0,0,0,0,0,64,0,-1--1--1,,1|(566,553)| 1,135,127,27,0,0,0,0,0,64,0,-1--1--1,,1|(776,548)| \\\---/// Sketch information - do not modify anything except names V300 Do not put anything below this section - it will be ignored *Aggregate flows $192-192-192,0,Arial|12||0-0-0|0-0-0|0-0-255|-1--1--1|-1--1--1|96,96,75,0 10,1,Deaths from acute attacks,670,408,54,19,8,3,0,16,0,0,0,0,0-0-0,0-0-0,|12|B|0-0-0 10,2,Asympto attack deaths as fraction of total,319,344,74,27,8,3,0,0,0,0,0,0 10,3,Subacute attack deaths as fraction of total,338,423,74,27,8,3,0,0,0,0,0,0 10,4,Asympto deaths from acute attack by RC,415,237,73,27,8,2,0,3,-1,0,0,0,64-128-128,0-0-0,|12||64-128-128 10,5,Postacute deaths from recurrent attack by RC,927,235,75,27,8,2,0,3,-1,0,0,0,64-128-128,0-0-0,|12||64-128-128 10,6,Subacute deaths from acute attack by RC,668,223,73,27,8,2,0,3,-1,0,0,0,64-128-128,0-0-0,|12||64-128-128 10,7,Onset of subacute symptoms by RC,1117,285,71,27,8,2,0,3,-1,0,0,0,64-128-128,0-0-0,|12||64-128-128 10,8,Asympto popn acute attacks by RC,389,826,82,27,8,2,0,3,-1,0,0,0,64-128-128,0-0-0,|12||64-128-128 10,9,Subacute popn acute attacks by RC,699,842,82,18,8,2,0,3,-1,0,0,0,64-128-128,0-0-0,|12||64-128-128 10,10,Postacute popn recurrent attacks by RC,1002,818,71,27,8,2,0,3,-1,0,0,0,64-128-128,0-0-0,|12||64-128-128 10,11,Acute attacks,688,632,54,11,8,3,0,16,0,0,0,0,0-0-0,0-0-0,|12|B|0-0-0 10,12,Subacute deaths from acute attack,659,311,63,18,8,3,0,0,0,0,0,0 1,13,6,12,0,0,0,0,0,64,0,-1--1--1,,1|(663,264)| 1,14,12,1,0,0,0,0,0,64,0,-1--1--1,,1|(663,352)| 10,15,Asympto deaths from acute attack,489,317,63,18,8,3,0,0,0,0,0,0 1,16,4,15,0,0,0,0,0,64,0,-1--1--1,,1|(450,276)| 1,17,15,1,0,0,0,0,0,64,0,-1--1--1,,1|(571,358)| 10,18,Postacute deaths from recurrent attack,866,326,75,18,8,3,0,0,0,0,0,0 1,19,5,18,0,0,0,0,0,64,0,-1--1--1,,1|(897,279)| 1,20,18,1,0,0,0,0,0,64,0,-1--1--1,,1|(775,363)| 10,21,Subacute popn acute attacks,706,722,56,18,8,3,0,0,0,0,0,0 10,22,Asympto popn acute attacks,507,720,53,18,8,3,0,0,0,0,0,0 10,23,Postacute recurrent attacks,932,721,68,19,8,3,0,16,0,0,0,0,0-0-0,0-0-0,|12|B|0-0-0 1,24,8,22,0,0,0,0,0,64,0,-1--1--1,,1|(447,773)| 1,25,9,21,0,0,0,0,0,64,0,-1--1--1,,1|(701,788)|
71
1,26,10,23,0,0,0,0,0,64,0,-1--1--1,,1|(968,771)| 1,27,23,11,0,0,0,0,0,64,0,-1--1--1,,1|(805,674)| 1,28,21,11,0,0,0,0,0,64,0,-1--1--1,,1|(697,680)| 1,29,22,11,0,0,0,0,0,64,0,-1--1--1,,1|(598,675)| 10,30,People surviving acute attacks,676,527,60,18,8,3,0,0,0,0,0,0 1,31,11,30,0,0,0,0,0,64,0,-1--1--1,,1|(683,589)| 1,32,1,30,0,0,0,0,0,64,0,-1--1--1,,1|(672,461)| 10,33,Onset of subacute symptoms,1107,391,43,28,8,3,0,16,0,0,0,0,0-0-0,0-0-0,|12|B|0-0-0 1,34,7,33,0,0,0,0,0,64,0,-1--1--1,,1|(1112,330)| 1,35,15,2,0,0,0,0,0,64,0,-1--1--1,,1|(416,328)| 1,36,1,2,0,0,0,0,0,64,0,-1--1--1,,1|(511,379)| 1,37,12,3,0,0,0,0,0,64,0,-1--1--1,,1|(516,360)| 1,38,1,3,0,0,0,0,0,64,0,-1--1--1,,1|(520,414)| 10,39,Asympto attacks as fraction of total,342,672,72,18,8,3,0,0,0,0,0,0 10,40,Subacute attacks as fraction of total,352,624,65,18,8,3,0,0,0,0,0,0 1,41,11,39,0,0,0,0,0,64,0,-1--1--1,,1|(530,649)| 1,42,11,40,0,0,0,0,0,64,0,-1--1--1,,1|(532,628)| 1,43,22,39,0,0,0,0,0,64,0,-1--1--1,,1|(435,699)| 1,44,21,40,0,0,0,0,0,64,0,-1--1--1,,1|(540,675)| 10,45,Postacute attacks as fraction of total,900,605,66,18,8,3,0,0,0,0,0,0 10,46,Postacute attack deaths as fraction of total,899,407,74,27,8,3,0,0,0,0,0,0 1,47,1,46,0,0,0,0,0,64,0,-1--1--1,,1|(767,407)| 1,48,18,46,0,0,0,0,0,64,0,-1--1--1,,1|(877,355)| 1,49,23,45,0,0,0,0,0,64,0,-1--1--1,,1|(917,669)| 1,50,11,45,0,0,0,0,0,64,0,-1--1--1,,1|(781,620)| 10,51,First time acute attacks,566,798,61,19,8,3,0,16,0,0,0,0,0-0-0,0-0-0,|12|B|0-0-0 1,52,22,51,0,0,0,0,0,64,0,-1--1--1,,1|(531,752)| 1,53,21,51,0,0,0,0,0,64,0,-1--1--1,,1|(643,756)| 10,54,Nonsudden death acute attacks,834,482,65,18,8,3,0,0,-1,0,0,0 1,55,11,54,0,0,0,0,0,0,0,-1--1--1,,1|(752,565)| 10,56,Sudden death acute attacks,892,534,57,19,8,3,0,16,-1,0,0,0,0-0-0,0-0-0,|12|B|0-0-0 1,57,11,56,0,0,0,0,0,0,0,-1--1--1,,1|(774,590)| 10,58,Sudden death fraction of attacks,1050,485,69,18,8,2,0,2,-1,0,0,0,0-0-0,0-0-0,|12||255-0-0 1,59,58,54,0,0,0,0,0,64,0,-1--1--1,,1|(946,483)| 1,60,58,56,0,0,0,0,0,64,0,-1--1--1,,1|(977,507)| 10,61,Subacute nonCVD deaths by RC,98,777,80,18,8,2,0,3,-1,0,0,0,64-128-128,0-0-0,|12||64-128-128 10,62,Postacute nonCVD deaths by RC,141,842,82,18,8,2,0,3,-1,0,0,0,64-128-128,0-0-0,|12||64-128-128 10,63,Asympto nonCVD deaths by RC,270,879,71,18,8,2,0,3,-1,0,0,0,64-128-128,0-0-0,|12||64-128-128 10,64,Adult nonCVD deaths by RC,205,706,53,18,8,3,0,0,0,0,0,0 1,65,63,64,0,0,0,0,0,64,0,-1--1--1,,1|(240,799)| 1,66,62,64,0,0,0,0,0,64,0,-1--1--1,,1|(169,780)| 1,67,61,64,0,0,0,0,0,64,0,-1--1--1,,1|(145,745)| 10,68,Adult deaths from acute attack by RC,296,173,69,18,8,3,0,0,0,0,0,0 1,69,4,68,0,0,0,0,0,64,0,-1--1--1,,1|(353,203)| 1,70,6,68,1,0,0,0,0,64,0,-1--1--1,,1|(492,185)| 1,71,5,68,1,0,0,0,0,64,0,-1--1--1,,1|(629,157)| 10,72,Adult deaths by RC,153,431,46,18,8,3,0,0,0,0,0,0 1,73,68,72,1,0,0,0,0,64,0,-1--1--1,,1|(178,298)| 1,74,64,72,1,0,0,0,0,64,0,-1--1--1,,1|(140,558)| 10,75,Adult deaths by RC initial,100,368,56,18,8,3,0,2,0,0,0,0,0-0-0,0-0-0,|12||128-128-128 10,76,Fatal fraction of acute attacks,1176,615,61,18,8,2,0,3,-1,0,0,0,64-128-128,0-0-0,|12||64-128-128 10,77,Adult popn,334,501,48,10,8,2,0,3,-1,0,0,0,64-128-128,0-0-0,|12||64-128-128

72
10,78,Deaths from acute attack per thousand adult popn,528,484,72,27,8,3,0,0,0,0,0,0 1,79,77,78,0,0,0,0,0,64,0,-1--1--1,,1|(412,494)| 1,80,1,78,0,0,0,0,0,64,0,-1--1--1,,1|(612,438)| 10,81,Acute attacks per thousand adult popn,524,566,73,18,8,3,0,0,0,0,0,0 1,82,77,81,0,0,0,0,0,64,0,-1--1--1,,1|(410,527)| 1,83,11,81,0,0,0,0,0,64,0,-1--1--1,,1|(621,605)| 10,84,Adult deaths,222,500,50,11,8,3,0,16,0,0,0,0,0-0-0,0-0-0,|12|B|0-0-0 1,85,72,84,0,0,0,0,0,64,0,-1--1--1,,1|(186,464)| 10,86,Adult deaths per thousand adult popn,270,559,73,18,8,3,0,0,0,0,0,0 1,87,84,86,0,0,0,0,0,64,0,-1--1--1,,1|(238,520)| 1,88,77,86,0,0,0,0,0,64,0,-1--1--1,,1|(311,521)| 1,89,72,75,0,0,0,0,0,64,1,-1--1--1,,1|(131,404)| 10,90,Symptomatic nonCVD deaths,88,643,59,18,8,3,0,0,0,0,0,0 1,91,61,90,0,0,0,0,0,64,0,-1--1--1,,1|(93,716)| 1,92,62,90,0,0,0,0,0,64,0,-1--1--1,,1|(116,749)| \\\---/// Sketch information - do not modify anything except names V300 Do not put anything below this section - it will be ignored *Adverse event rates $192-192-192,0,Arial|12||0-0-0|0-0-0|0-0-255|-1--1--1|-1--1--1|96,96,75,0 10,1,Nonsudden death acute attack treatment vs max,747,187,81,27,8,2,0,3,-1,0,0,0,64-128-128,0-0-0,|12||64-128-128 10,2,Subacute attack rate if zero disease mgmt,185,458,77,18,8,3,0,2,0,0,0,0,0-0-0,0-0-0,|12||255-0-0 10,3,Postacute attack rate if zero disease mgmt,523,447,78,18,8,3,0,2,0,0,0,0,0-0-0,0-0-0,|12||255-0-0 10,4,Subacute attack rate if max disease mgmt,332,524,82,27,8,3,0,2,0,0,0,0,0-0-0,0-0-0,|12||255-0-0 10,5,Postacute attack rate if max disease mgmt,669,517,84,27,8,3,0,2,0,0,0,0,0-0-0,0-0-0,|12||255-0-0 10,6,Subacute popn acute attack rate,177,596,61,18,8,3,0,0,0,0,0,0 10,7,Postacute popn acute attack rate,550,592,61,18,8,3,0,0,0,0,0,0 1,8,2,6,0,0,0,0,0,64,0,-1--1--1,,1|(181,520)| 1,9,4,6,0,0,0,0,0,64,0,-1--1--1,,1|(250,561)| 1,10,3,7,0,0,0,0,0,64,0,-1--1--1,,1|(534,512)| 1,11,5,7,0,0,0,0,0,64,0,-1--1--1,,1|(608,555)| 10,12,Postacute disease mgmt vs max,554,682,73,27,8,2,0,3,-1,0,0,0,64-128-128,0-0-0,|12||64-128-128 10,13,Subacute disease mgmt vs max,196,689,73,27,8,2,0,3,-1,0,0,0,64-128-128,0-0-0,|12||64-128-128 1,14,13,6,0,0,0,0,0,64,0,-1--1--1,,1|(187,644)| 1,15,12,7,0,0,0,0,0,64,0,-1--1--1,,1|(551,639)| 10,16,Asympto popn acute attack rate,1128,548,61,18,8,3,0,0,0,0,0,0 10,17,Asympto popn symptoms onset rate,864,550,60,27,8,3,0,0,0,0,0,0 10,18,Asymptomatic risk mgmt vs max,977,642,73,27,8,2,0,3,-1,0,0,0,64-128-128,0-0-0,|12||64-128-128 10,19,Asympto attack rate if zero Risk Mgmt,1067,371,73,18,8,3,0,2,0,0,0,0,0-0-0,0-0-0,|12||255-0-0 10,20,Asympto attack rate if max risk mgmt,1182,437,73,18,8,3,0,2,0,0,0,0,0-0-0,0-0-0,|12||255-0-0 1,21,19,16,0,0,0,0,0,64,0,-1--1--1,,1|(1094,452)| 1,22,20,16,0,0,0,0,0,64,0,-1--1--1,,1|(1158,486)| 1,23,18,16,0,0,0,0,0,64,0,-1--1--1,,1|(1053,594)| 1,24,34,16,1,0,0,0,0,64,0,-1--1--1,,1|(1118,606)| 1,25,18,17,0,0,0,0,0,64,0,-1--1--1,,1|(925,600)| 1,26,34,17,1,0,0,0,0,64,0,-1--1--1,,1|(875,647)|

73
10,27,Asympto symptoms onset rate if zero risk mgmt,799,376,76,27,8,3,0,2,0,0,0,0,0-0-0,0-0-0,|12||255-0-0 10,28,Asympto symptoms onset rate if max risk mgmt,921,441,75,27,8,3,0,2,0,0,0,0,0-0-0,0-0-0,|12||255-0-0 1,29,28,17,0,0,0,0,0,64,0,-1--1--1,,1|(895,489)| 1,30,27,17,0,0,0,0,0,64,0,-1--1--1,,1|(828,456)| 10,31,Fatal fraction of acute attacks,503,267,57,18,8,3,0,0,0,0,0,0 10,32,Fatal fraction of nonsudden death attacks if zero treatment,392,73,91,27,8,3,0,2,0,0,0,0,0-0-0,0-0-0,|12||255-0-0 10,33,Fatal fraction of nonsudden death attacks if max treatment,627,76,91,27,8,3,0,2,0,0,0,0,0-0-0,0-0-0,|12||255-0-0 10,34,Screened fraction of asympto RC2 popn,969,715,76,27,8,2,0,3,-1,0,0,0,64-128-128,0-0-0,|12||64-128-128 10,35,Sudden death fraction of attacks,302,212,65,18,8,3,0,2,0,0,0,0,0-0-0,0-0-0,|12||255-0-0 1,36,35,31,0,0,0,0,0,64,0,-1--1--1,,1|(399,238)| 10,37,Fatal fraction of nonsudden death acute attacks,522,171,63,27,8,3,0,0,0,0,0,0 1,38,33,37,0,0,0,0,0,64,0,-1--1--1,,1|(579,118)| 1,39,32,37,0,0,0,0,0,64,0,-1--1--1,,1|(450,117)| 1,40,1,37,0,0,0,0,0,64,0,-1--1--1,,1|(632,179)| 1,41,37,31,0,0,0,0,0,64,0,-1--1--1,,1|(512,216)| \\\---/// Sketch information - do not modify anything except names V300 Do not put anything below this section - it will be ignored *Risk screening and management $192-192-192,0,Arial|12||0-0-0|0-0-0|0-0-255|-1--1--1|-1--1--1|96,96,75,0 10,1,Asymptomatic risk mgmt vs max,776,631,68,18,8,3,0,0,0,0,0,0 10,2,RC2 first time screenings vs max,395,252,68,18,8,3,0,0,0,0,0,0 10,3,Screened fraction of asympto RC2 popn,793,355,74,18,8,3,0,0,0,0,0,0 10,4,Screened asympto RC2 popn,771,183,73,36,3,3,0,4,0,0,0,0,0-0-0,255-255-128,|12||0-0-0 12,5,48,520,185,10,8,0,3,0,0,-1,0,0,0 1,6,8,4,4,0,0,22,0,0,0,-1--1--1,,1|(653,185)| 1,7,8,5,100,0,0,22,0,0,0,-1--1--1,,1|(563,185)| 11,8,48,603,185,6,8,34,3,0,0,1,0,0,0 10,9,RC2 first time screenings,603,217,50,18,40,3,0,0,-1,0,0,0 10,10,Resources required per RC2 screening,139,441,72,18,8,3,0,2,0,0,0,0,0-0-0,0-0-0,|12||255-0-0 10,11,Resources required for max RC2 first time screenings,379,345,84,27,8,3,0,0,0,0,0,0 1,12,10,11,0,0,0,0,0,64,0,-1--1--1,,1|(241,400)| 1,13,40,2,0,0,0,0,0,64,0,-1--1--1,,1|(273,236)| 1,14,11,2,0,0,0,0,0,64,0,-1--1--1,,1|(385,300)| 1,15,4,3,0,0,0,0,0,64,0,-1--1--1,,1|(781,271)| 1,16,2,9,0,0,0,0,0,64,0,-1--1--1,,1|(501,234)| 10,17,Max RC2 first time screenings,592,333,68,18,8,3,0,0,0,0,0,0 1,18,17,9,1,0,0,0,0,64,0,-1--1--1,,1|(556,265)| 1,19,17,11,0,0,0,0,0,64,0,-1--1--1,,1|(500,337)| 10,20,Resources used for RC2 screening,165,116,71,18,8,2,0,3,-1,0,0,0,64-128-128,0-0-0,|12||64-128-128 1,21,4,17,0,0,0,0,0,64,0,-1--1--1,,1|(676,262)| 10,22,Screening interval,444,503,38,18,8,3,0,2,0,0,0,0,0-0-0,0-0-0,|12||255-0-0 12,23,48,1059,181,10,8,0,3,0,0,-1,0,0,0 1,24,26,23,4,0,0,22,0,0,0,-1--1--1,,1|(998,182)| 1,25,26,4,100,0,0,22,0,0,0,-1--1--1,,1|(890,182)| 11,26,48,942,182,6,8,34,3,0,0,1,0,0,0 10,27,Outflow of screened asympto RC2 popn,942,220,72,18,40,3,0,0,-1,0,0,0 10,28,Onset of subacute symptoms by RC,1166,258,71,27,8,2,0,3,-1,0,0,0,64-128-128,0-0-0,|12||64-128-128 1,29,28,27,0,0,0,0,0,64,0,-1--1--1,,1|(1061,240)|

74
10,30,Adult popn death rate if no CVD attack deaths,1153,330,83,27,8,2,0,2,0,0,0,0,0-0-0,0-0-0,|12||255-0-0 1,31,30,27,0,0,0,0,0,64,0,-1--1--1,,1|(1045,273)| 1,32,4,27,1,0,0,0,0,64,0,-1--1--1,,1|(883,143)| 1,33,3,27,0,0,0,0,0,64,0,-1--1--1,,1|(861,292)| 10,34,RC2 rescreenings,445,425,48,18,8,3,0,0,0,0,0,0 1,35,4,34,1,0,0,0,0,64,0,-1--1--1,,1|(646,374)| 1,36,22,34,0,0,0,0,0,64,0,-1--1--1,,1|(444,471)| 10,37,Resources used for RC2 rescreenings,173,325,71,18,8,3,0,0,0,0,0,0 1,38,10,37,0,0,0,0,0,64,0,-1--1--1,,1|(153,389)| 1,39,34,37,1,0,0,0,0,64,0,-1--1--1,,1|(308,391)| 10,40,Resources used for RC2 first time screenings,163,223,71,27,8,3,0,0,0,0,0,0 1,41,20,40,0,0,0,0,0,64,0,-1--1--1,,1|(164,158)| 1,42,37,40,0,0,0,0,0,64,0,-1--1--1,,1|(169,285)| 10,43,Resources required per patient for max asympto risk mgmt,1082,615,87,27,8,3,0,2,0,0,0,0,0-0-0,0-0-0,|12||255-0-0 10,44,Resources required for max asympto risk mgmt,889,537,84,27,8,3,0,0,0,0,0,0 1,45,3,44,1,0,0,0,0,64,0,-1--1--1,,1|(892,428)| 1,46,43,44,0,0,0,0,0,64,0,-1--1--1,,1|(992,578)| 10,47,Resources used for asympto risk mgmt,545,645,76,18,8,2,0,3,-1,0,0,0,64-128-128,0-0-0,|12||64-128-128 1,48,44,1,0,0,0,0,0,64,0,-1--1--1,,1|(832,584)| 1,49,47,1,0,0,0,0,0,64,0,-1--1--1,,1|(657,638)| 10,50,Resources required for max RC2 screenings,285,529,72,27,8,3,0,0,0,0,0,0 1,51,37,50,0,0,0,0,0,64,0,-1--1--1,,1|(222,416)| 1,52,11,50,0,0,0,0,0,64,0,-1--1--1,,1|(335,430)| 10,53,Asymptomatic RC2 popn,706,425,53,18,8,3,0,0,0,0,0,0 1,54,53,17,0,0,0,0,0,64,0,-1--1--1,,1|(654,383)| 1,55,53,3,0,0,0,0,0,64,0,-1--1--1,,1|(743,394)| 10,56,Asympto popn acute attacks by RC,1169,173,82,18,8,2,0,3,-1,0,0,0,64-128-128,0-0-0,|12||64-128-128 1,57,56,27,0,0,0,0,0,64,0,-1--1--1,,1|(1057,195)| 10,58,Outflow rate of screened asympto RC2 popn,972,315,68,27,8,3,0,0,0,0,0,0 1,59,4,58,0,0,0,0,0,64,0,-1--1--1,,1|(871,249)| 1,60,27,58,0,0,0,0,0,64,0,-1--1--1,,1|(952,256)| 10,61,Asymptomatic popn by risk class,645,523,66,27,8,2,0,3,-1,0,0,0,64-128-128,0-0-0,|12||64-128-128 1,62,61,53,0,0,0,0,0,64,0,-1--1--1,,1|(673,475)| 1,63,61,44,0,0,0,0,0,64,0,-1--1--1,,1|(751,528)| \\\---/// Sketch information - do not modify anything except names V300 Do not put anything below this section - it will be ignored *Disease mgmt & Attack treatment $192-192-192,0,Arial|12||0-0-0|0-0-0|0-0-255|-1--1--1|-1--1--1|96,96,75,0 10,1,Resources required per nonsudden death acute attack for max treatment,1087,263,87,27,8,3,0,2,0,0,0,0,0-0-0,0-0-0,|12||255-0-0 10,2,Resources required for max treatment of nonsudden death acute attacks,976,416,101,27,8,3,0,0,0,0,0,0 1,3,1,2,0,0,0,0,0,64,0,-1--1--1,,1|(1035,333)| 10,4,Nonsudden death acute attack treatment vs max,972,525,81,27,8,3,0,0,0,0,0,0 1,5,2,4,0,0,0,0,0,64,0,-1--1--1,,1|(974,463)| 10,6,Subacute disease mgmt vs max,266,492,67,18,8,3,0,0,0,0,0,0 10,7,Postacute disease mgmt vs max,629,520,69,18,8,3,0,0,0,0,0,0 10,8,Resources used for nonsudden death acute attack treatment,981,641,85,27,8,2,0,3,-1,0,0,0,64-128-128,0-0-0,|12||64-128-128 1,9,8,4,0,0,0,0,0,64,0,-1--1--1,,1|(977,589)|

75
10,10,Resources used for postacute disease mgmt,630,638,76,27,8,2,0,3,-1,0,0,0,64-128-128,0-0-0,|12||64-128-128 10,11,Resources used for subacute disease mgmt,271,621,76,27,8,2,0,3,-1,0,0,0,64-128-128,0-0-0,|12||64-128-128 10,12,Resources required for max postacute disease mgmt,636,399,84,27,8,3,0,0,0,0,0,0 10,13,Resources required for max subacute disease mgmt,263,389,84,27,8,3,0,0,0,0,0,0 1,14,13,6,0,0,0,0,0,64,0,-1--1--1,,1|(263,438)| 1,15,12,7,0,0,0,0,0,64,0,-1--1--1,,1|(632,457)| 1,16,10,7,0,0,0,0,0,64,0,-1--1--1,,1|(629,581)| 1,17,11,6,0,0,0,0,0,64,0,-1--1--1,,1|(268,558)| 10,18,Resources required per subacute patient for max disease mgmt,208,119,86,27,8,3,0,2,0,0,0,0,0-0-0,0-0-0,|12||255-0-0 10,19,Resources required per postacute patient for max disease mgmt,670,242,86,27,8,3,0,2,0,0,0,0,0-0-0,0-0-0,|12||255-0-0 1,20,18,30,0,0,0,0,0,64,0,-1--1--1,,1|(187,192)| 1,21,19,12,0,0,0,0,0,64,0,-1--1--1,,1|(654,313)| 10,22,Subacute popn,103,173,40,18,8,2,0,3,-1,0,0,0,64-128-128,0-0-0,|12||64-128-128 10,23,Postacute popn,527,298,42,18,8,2,0,3,-1,0,0,0,64-128-128,0-0-0,|12||64-128-128 1,24,22,30,0,0,0,0,0,64,0,-1--1--1,,1|(127,215)| 1,25,23,12,0,0,0,0,0,64,0,-1--1--1,,1|(570,339)| 10,26,Onset of subacute symptoms,357,93,43,27,8,2,0,3,-1,0,0,0,64-128-128,0-0-0,|12||64-128-128 10,27,Resources required per subacute symptoms onset for max disease mgmt,476,159,95,27,8,3,0,2,0,0,0,0,0-0-0,0-0-0,|12||255-0-0 1,28,27,31,0,0,0,0,0,64,0,-1--1--1,,1|(421,211)| 1,29,26,31,0,0,0,0,0,64,0,-1--1--1,,1|(357,176)| 10,30,Resources required for max subacute disease mgmt ongoing,164,279,84,27,8,3,0,0,0,0,0,0 10,31,Resources required for max subacute disease mgmt from onset,357,273,84,27,8,3,0,0,0,0,0,0 1,32,31,13,0,0,0,0,0,64,0,-1--1--1,,1|(314,325)| 1,33,30,13,0,0,0,0,0,64,0,-1--1--1,,1|(208,328)| 10,34,Nonsudden death acute attacks,892,265,69,18,8,2,0,2,0,0,0,0,0-0-0,0-0-0,|12||64-128-128 1,35,34,2,0,0,0,0,0,64,0,-1--1--1,,1|(927,329)| 10,36,Resources used per sudden death attack,871,74,74,18,8,3,0,2,0,0,0,0,0-0-0,0-0-0,|12||255-0-0 10,37,Resources used for sudden death attacks,974,163,78,18,8,3,0,0,0,0,0,0 1,38,36,37,0,0,0,0,0,64,0,-1--1--1,,1|(916,113)| 10,39,Sudden death acute attacks,1092,68,56,18,8,2,0,2,0,0,0,0,0-0-0,0-0-0,|12||64-128-128 1,40,39,37,0,0,0,0,0,64,0,-1--1--1,,1|(1038,111)| \\\---/// Sketch information - do not modify anything except names V300 Do not put anything below this section - it will be ignored *Initial & total resources by type $192-192-192,0,Arial|12||0-0-0|0-0-0|0-0-255|-1--1--1|-1--1--1|96,96,75,0 10,1,Resources used for nonsudden death acute attack treatment,1042,453,85,27,8,3,0,0,0,0,0,0 10,2,Resources used for asympto risk mgmt,419,239,71,18,8,3,0,0,0,0,0,0 10,3,Resources used for postacute disease mgmt,633,612,71,27,8,3,0,0,0,0,0,0 10,4,Resources used for subacute disease mgmt,256,638,71,27,8,3,0,0,0,0,0,0 10,5,Postacute disease mgmt vs max initial,607,414,62,27,8,3,0,2,0,0,0,0,0-0-0,0-0-0,|12||255-0-0 10,6,Initial resources for postacute disease mgmt,621,516,69,27,8,3,0,0,0,0,0,0 1,7,5,6,0,0,0,0,0,64,0,-1--1--1,,1|(612,458)| 10,8,Additional resources for postacute disease mgmt,565,695,80,27,8,2,0,3,-1,0,0,0,64-128-128,0-0-0,|12||64-128-128 1,9,8,3,0,0,0,0,0,64,0,-1--1--1,,1|(594,658)| 1,10,6,3,0,0,0,0,0,64,0,-1--1--1,,1|(625,557)|

76
10,11,Subacute disease mgmt vs max initial,135,437,62,27,8,3,0,2,0,0,0,0,0-0-0,0-0-0,|12||255-0-0 10,12,Initial resources for subacute disease mgmt,250,542,69,27,8,3,0,0,0,0,0,0 1,13,11,12,0,0,0,0,0,64,0,-1--1--1,,1|(186,484)| 10,14,Nonsudden death acute attack treatment vs max initial,933,204,86,27,8,3,0,2,0,0,0,0,0-0-0,0-0-0,|12||255-0-0 10,15,Initial resources for nonsudden death acute attack treatment,1040,360,85,27,8,3,0,0,0,0,0,0 1,16,14,15,0,0,0,0,0,64,0,-1--1--1,,1|(982,276)| 1,17,12,4,0,0,0,0,0,64,0,-1--1--1,,1|(252,583)| 10,18,Additional resources for nonsudden death acute attack treatment,923,593,92,27,8,2,0,3,-1,0,0,0,64-128-128,0-0-0,|12||64-128-128 10,19,Additional resources for subacute disease mgmt,144,720,80,27,8,2,0,3,-1,0,0,0,64-128-128,0-0-0,|12||64-128-128 1,20,19,4,0,0,0,0,0,64,0,-1--1--1,,1|(193,683)| 1,21,18,1,0,0,0,0,0,64,0,-1--1--1,,1|(977,528)| 1,22,15,1,0,0,0,0,0,64,0,-1--1--1,,1|(1040,399)| 10,23,Additional resources for asympto risk mgmt,211,239,78,27,8,2,0,3,-1,0,0,0,64-128-128,0-0-0,|12||64-128-128 10,24,Asympto risk mgmt vs max initial,263,79,70,18,8,3,0,2,0,0,0,0,0-0-0,0-0-0,|12||255-0-0 10,25,Initial resources for asympto risk mgmt,398,153,69,18,8,3,0,0,0,0,0,0 1,26,24,25,0,0,0,0,0,64,0,-1--1--1,,1|(323,112)| 1,27,25,2,0,0,0,0,0,64,0,-1--1--1,,1|(406,189)| 1,28,23,2,0,0,0,0,0,64,0,-1--1--1,,1|(311,239)| 10,29,Resources required for max asympto risk mgmt,579,75,77,27,8,2,0,3,-1,0,0,0,64-128-128,0-0-0,|12||64-128-128 10,30,Resources required for max subacute disease mgmt,329,369,89,27,8,2,0,3,-1,0,0,0,64-128-128,0-0-0,|12||64-128-128 10,31,Resources required for max postacute disease mgmt,769,363,89,27,8,2,0,3,-1,0,0,0,64-128-128,0-0-0,|12||64-128-128 10,32,Resources required for max treatment of nonsudden death acute attacks,948,114,106,27,8,2,0,3,-1,0,0,0,64-128-128,0-0-0,|12||64-128-128 10,33,Initial resources reqd for max asympto risk mgmt,614,149,76,27,8,3,0,2,0,0,0,0,0-0-0,0-0-0,|12||160-160-160 1,34,33,25,0,0,0,0,0,64,0,-1--1--1,,1|(509,150)| 10,35,Initial resources reqd for max subacute disease mgmt,319,445,87,27,8,3,0,2,0,0,0,0,0-0-0,0-0-0,|12||160-160-160 1,36,35,12,0,0,0,0,0,64,0,-1--1--1,,1|(288,487)| 10,37,Initial resources reqd for max postacute disease mgmt,774,451,87,27,8,3,0,2,0,0,0,0,0-0-0,0-0-0,|12||160-160-160 1,38,37,6,0,0,0,0,0,64,0,-1--1--1,,1|(703,480)| 10,39,Initial resources reqd for max treatment of nonsudden death acute attacks,1140,256,103,27,8,3,0,2,0,0,0,0,0-0-0,0-0-0,|12||160-160-160 1,40,39,15,0,0,0,0,0,64,0,-1--1--1,,1|(1094,303)| 10,41,Resources used for sudden death attacks,1163,683,76,27,8,2,0,2,0,0,0,0,0-0-0,0-0-0,|12||64-128-128 10,42,Resources used for acute attacks,1152,557,71,18,8,3,0,0,0,0,0,0 1,43,41,42,0,0,0,0,0,64,0,-1--1--1,,1|(1157,622)| 1,44,1,42,1,0,0,0,0,64,0,-1--1--1,,1|(1107,492)| 1,45,29,33,0,0,0,0,0,0,1,-1--1--1,,1|(592,105)| 1,46,30,35,0,0,0,0,0,0,1,-1--1--1,,1|(325,400)| 1,47,31,37,0,0,0,0,0,0,1,-1--1--1,,1|(770,400)| 1,48,32,39,0,0,0,0,0,0,1,-1--1--1,,1|(1037,180)| 10,49,Resources used for RC2 screening,114,145,71,18,8,2,0,3,-1,0,0,0,64-160-98,0-0-0,|12||64-160-98 \\\---/// Sketch information - do not modify anything except names

77
V300 Do not put anything below this section - it will be ignored *Allocation of additional resources $192-192-192,0,Arial|12||0-0-0|0-0-0|0-0-255|-1--1--1|-1--1--1|96,96,75,0 10,1,Additional resources for postacute disease mgmt,237,584,84,27,8,3,0,0,0,0,0,0 10,2,Additional resources for subacute disease mgmt,230,506,84,27,8,3,0,0,0,0,0,0 10,3,Additional resources for nonsudden death acute attack treatment,289,670,87,27,8,3,0,0,0,0,0,0 10,4,Resources used for RC2 screening,241,332,75,18,8,3,0,0,0,0,0,0 10,5,Additional resources for asympto risk mgmt,255,409,73,27,8,3,0,0,0,0,0,0 10,6,Time,800,179,29,10,8,2,0,3,-1,0,0,0,64-128-128,0-0-0,|12||64-128-128 10,7,Additional resources total provided under umbrella budget,821,290,93,27,8,3,0,0,0,0,0,0 1,8,6,7,1,0,0,0,0,64,0,-1--1--1,,1|(805,223)| 10,9,Additional resources provided by intervention type under umbrella budget,567,488,104,27,8,3,0,0,0,0,0,0 1,10,9,4,0,0,0,0,0,64,0,-1--1--1,,1|(400,408)| 1,11,9,5,0,0,0,0,0,64,0,-1--1--1,,1|(402,446)| 1,12,9,2,0,0,0,0,0,64,0,-1--1--1,,1|(395,496)| 1,13,9,1,0,0,0,0,0,64,0,-1--1--1,,1|(404,535)| 1,14,9,3,0,0,0,0,0,64,0,-1--1--1,,1|(433,575)| 10,15,Priority of intervention by type,258,204,70,18,8,3,0,2,-1,0,0,0,0-0-0,0-0-0,|12||255-0-0 10,16,Additional resources requested by intervention type,839,392,80,27,8,2,0,2,0,0,0,0,0-0-0,0-0-0,|12||64-128-128 10,17,Additional resources total billions series,969,215,75,18,8,3,0,2,0,0,0,0,0-0-0,0-0-0,|12||255-0-255 1,18,17,7,0,0,0,0,0,64,0,-1--1--1,,1|(910,244)| 10,19,Additional resources provided vs requested by intervention type,764,575,92,27,8,3,0,0,0,0,0,0 1,20,16,19,0,0,0,0,0,64,0,-1--1--1,,1|(804,477)| 1,21,9,19,0,0,0,0,0,64,0,-1--1--1,,1|(658,528)| 10,22,Additional resources requested,820,719,42,27,8,2,0,3,-1,0,0,0,64-128-128,0-0-0,|12||64-128-128 10,23,Additional resources provided,563,597,71,18,8,3,0,0,0,0,0,0 10,24,Additional resources provided vs requested,651,683,81,18,8,3,0,0,0,0,0,0 1,25,23,24,0,0,0,0,0,64,0,-1--1--1,,1|(601,635)| 1,26,22,24,0,0,0,0,0,64,0,-1--1--1,,1|(761,707)| 1,27,7,9,1,0,0,0,0,64,0,-1--1--1,,1|(719,381)| 1,28,16,9,0,0,0,0,0,64,0,-1--1--1,,1|(709,437)| 1,29,15,9,0,0,0,0,0,64,0,-1--1--1,,1|(401,336)| 10,30,Switch for separate resource budgets,456,145,71,18,8,3,0,2,0,0,0,0,0-0-0,0-0-0,|12||255-0-0 10,31,Additional resources provided by intervention type under separate budgets,645,220,104,27,8,3,0,0,0,0,0,0 1,32,16,31,0,0,0,0,0,64,0,-1--1--1,,1|(747,310)| 1,33,31,5,0,0,0,0,0,64,0,-1--1--1,,1|(456,311)| 1,34,31,2,0,0,0,0,0,64,0,-1--1--1,,1|(443,359)| 1,35,31,1,0,0,0,0,0,64,0,-1--1--1,,1|(446,397)| 1,36,31,3,0,0,0,0,0,64,0,-1--1--1,,1|(471,439)| 1,37,31,4,0,0,0,0,0,64,0,-1--1--1,,1|(433,278)| 1,38,31,23,1,0,0,0,0,64,0,-1--1--1,,1|(670,435)| 1,39,30,4,0,0,0,0,0,64,0,-1--1--1,,1|(353,233)| 1,40,30,5,0,0,0,0,0,64,0,-1--1--1,,1|(363,266)| 1,41,30,2,0,0,0,0,0,64,0,-1--1--1,,1|(349,315)| 1,42,30,1,0,0,0,0,0,64,0,-1--1--1,,1|(352,353)| 1,43,30,3,0,0,0,0,0,64,0,-1--1--1,,1|(376,396)| 1,44,30,19,0,0,0,0,0,64,0,-1--1--1,,1|(601,349)| 1,45,30,23,1,0,0,0,0,64,0,-1--1--1,,1|(455,396)|

78
1,46,31,19,1,0,0,0,0,64,0,-1--1--1,,1|(723,370)| 12,47,0,1055,301,80,20,3,124,0,0,0,0,0,0 Fraction of need filled[Screen],0,1,0.01 10,48,Fraction of need filled,637,80,40,18,8,3,0,2,0,0,0,0,0-0-0,0-0-0,|12||255-0-0 1,49,48,31,0,0,0,0,0,64,0,-1--1--1,,1|(640,138)| 12,50,0,1055,384,80,20,3,124,0,0,0,0,0,0 Fraction of need filled[RiskMgmt],0,1,0.01 12,51,0,1051,471,80,20,3,124,0,0,0,0,0,0 Fraction of need filled[SubDisMgmt],0,1,0.01 12,52,0,1050,553,80,20,3,124,0,0,0,0,0,0 Fraction of need filled[PostDisMgmt],0,1,0.01 12,53,0,1056,646,80,20,3,124,0,0,0,0,0,0 Fraction of need filled[AttackTx],0,1,0.01 1,54,7,23,0,0,0,0,0,64,0,-1--1--1,,1|(693,442)| 10,55,Fraction of need filled phasing in series,808,112,60,27,8,3,0,2,0,0,0,0,0-0-0,0-0-0,|12||255-0-255 1,56,55,31,0,0,0,0,0,64,0,-1--1--1,,1|(732,162)| 1,57,6,31,0,0,0,0,0,0,0,-1--1--1,,1|(765,187)| \\\---/// Sketch information - do not modify anything except names V300 Do not put anything below this section - it will be ignored *Demand for additional resources $192-192-192,0,Arial|12||0-0-0|0-0-0|0-0-255|-1--1--1|-1--1--1|96,96,75,0 10,1,Resources required for max asympto risk mgmt,865,178,89,27,8,2,0,3,-1,0,0,0,64-128-128,0-0-0,|12||64-128-128 10,2,Resources required for max postacute disease mgmt,869,471,89,27,8,2,0,3,-1,0,0,0,64-128-128,0-0-0,|12||64-128-128 10,3,Resources required for max subacute disease mgmt,895,321,89,27,8,2,0,3,-1,0,0,0,64-128-128,0-0-0,|12||64-128-128 10,4,Resources required for max treatment of nonsudden death acute attacks,869,612,106,27,8,2,0,3,-1,0,0,0,64-128-128,0-0-0,|12||64-128-128 10,5,Initial resources for nonsudden death acute attack treatment,851,698,85,27,8,2,0,3,-1,0,0,0,64-128-128,0-0-0,|12||64-128-128 10,6,Initial resources for asympto risk mgmt,866,241,82,27,8,2,0,3,-1,0,0,0,64-128-128,0-0-0,|12||64-128-128 10,7,Initial resources for postacute disease mgmt,863,536,82,27,8,2,0,3,-1,0,0,0,64-128-128,0-0-0,|12||64-128-128 10,8,Initial resources for subacute disease mgmt,915,390,82,27,8,2,0,3,-1,0,0,0,64-128-128,0-0-0,|12||64-128-128 10,9,Resources required for max RC2 screenings,623,150,77,27,8,2,0,3,-1,0,0,0,64-128-128,0-0-0,|12||64-128-128 10,10,Additional resources required for max asympto risk mgmt,645,271,77,27,8,3,0,0,0,0,0,0 1,11,1,10,0,0,0,0,0,64,0,-1--1--1,,1|(761,221)| 1,12,6,10,0,0,0,0,0,64,0,-1--1--1,,1|(759,255)| 10,13,Additional resources required for max subacute disease mgmt,677,376,87,27,8,3,0,0,0,0,0,0 1,14,3,13,0,0,0,0,0,64,0,-1--1--1,,1|(791,346)| 1,15,8,13,0,0,0,0,0,64,0,-1--1--1,,1|(805,384)| 10,16,Additional resources required for max postacute disease mgmt,626,456,90,27,8,3,0,0,0,0,0,0 1,17,2,16,0,0,0,0,0,64,0,-1--1--1,,1|(754,464)| 1,18,7,16,0,0,0,0,0,64,0,-1--1--1,,1|(751,498)| 10,19,Additional resources required for max acute attack treatment,628,599,81,27,8,3,0,0,0,0,0,0 1,20,4,19,0,0,0,0,0,64,0,-1--1--1,,1|(742,605)| 1,21,5,19,0,0,0,0,0,64,0,-1--1--1,,1|(745,651)| 10,22,Additional resources required for max intervention by type,413,353,75,27,8,3,0,0,0,0,0,0 1,23,9,22,0,0,0,0,0,64,0,-1--1--1,,1|(523,246)|

79
1,24,10,22,0,0,0,0,0,64,0,-1--1--1,,1|(535,309)| 1,25,13,22,0,0,0,0,0,64,0,-1--1--1,,1|(545,364)| 1,26,16,22,0,0,0,0,0,64,0,-1--1--1,,1|(525,407)| 1,27,19,22,0,0,0,0,0,64,0,-1--1--1,,1|(525,481)| 10,28,Additional resources requested by intervention type,225,355,75,27,8,3,0,0,0,0,0,0 1,29,22,28,0,0,0,0,2,65,0,-1--1--1,|12||0-0-0,1|(325,353)| 10,30,Time to reassess resource needs,275,243,64,18,8,3,0,2,-1,0,0,0,64-128-128,0-0-0,|12||255-0-0 1,31,30,28,0,0,0,0,0,64,0,-1--1--1,,1|(254,288)| 10,32,Additional resources requested,216,475,37,27,8,3,0,0,-1,0,0,0 1,33,28,32,0,0,0,0,0,0,0,-1--1--1,,1|(221,408)| 10,34,Combined resources required for max intervention,1109,427,84,28,8,3,0,16,0,0,0,0,0-0-0,0-0-0,|12|B|0-0-0 1,35,1,34,0,0,0,0,0,64,0,-1--1--1,,1|(981,296)| 1,36,3,34,0,0,0,0,0,64,0,-1--1--1,,1|(994,370)| 1,37,2,34,0,0,0,0,0,64,0,-1--1--1,,1|(984,449)| 1,38,4,34,0,0,0,0,0,64,0,-1--1--1,,1|(982,524)| 1,39,9,34,1,0,0,0,0,64,0,-1--1--1,,1|(1032,177)| \\\---/// Sketch information - do not modify anything except names V300 Do not put anything below this section - it will be ignored *Aggregate resources & fractions $192-192-192,0,Arial|12||0-0-0|0-0-0|0-0-255|-1--1--1|-1--1--1|96,96,75,0 10,1,Combined intervention resources,723,341,48,28,8,3,0,16,0,0,0,0,0-0-0,0-0-0,|12|B|0-0-0 1,2,43,1,0,0,0,0,0,64,0,-1--1--1,,1|(704,487)| 10,3,Resources used for asympto risk mgmt,535,246,76,18,8,2,0,3,-1,0,0,0,64-128-128,0-0-0,|12||64-128-128 1,4,3,1,0,0,0,0,0,64,0,-1--1--1,,1|(616,286)| 10,5,Resources used for postacute disease mgmt,539,525,76,27,8,2,0,3,-1,0,0,0,64-128-128,0-0-0,|12||64-128-128 1,6,5,1,0,0,0,0,0,64,0,-1--1--1,,1|(625,438)| 10,7,Resources used for RC2 screening,666,162,71,18,8,2,0,3,-1,0,0,0,64-128-128,0-0-0,|12||64-128-128 1,8,7,1,0,0,0,0,0,64,0,-1--1--1,,1|(690,239)| 10,9,Resources used for subacute disease mgmt,525,403,76,27,8,2,0,3,-1,0,0,0,64-128-128,0-0-0,|12||64-128-128 1,10,9,1,0,0,0,0,0,64,0,-1--1--1,,1|(631,370)| 10,11,Fraction of resources used for RC2 screening,913,149,78,27,8,3,0,0,0,0,0,0 1,12,1,11,1,0,0,0,0,64,0,-1--1--1,,1|(780,228)| 1,13,7,11,0,0,0,0,0,64,0,-1--1--1,,1|(779,156)| 10,14,Fraction of resources used for asympto risk mgmt,920,279,78,27,8,3,0,0,0,0,0,0 10,15,Fraction of resources used for subacute disease mgmt,920,411,78,27,8,3,0,0,0,0,0,0 10,16,Fraction of resources used for postacute disease mgmt,945,512,78,27,8,3,0,0,0,0,0,0 10,17,Fraction of resources used for acute attack treatment,951,630,78,27,8,3,0,0,0,0,0,0 1,18,1,15,0,0,0,0,0,64,0,-1--1--1,,1|(800,368)| 1,19,1,14,0,0,0,0,0,64,0,-1--1--1,,1|(799,316)| 1,20,1,16,1,0,0,0,0,64,0,-1--1--1,,1|(810,442)| 1,21,1,17,1,0,0,0,0,64,0,-1--1--1,,1|(791,499)| 1,22,3,14,0,0,0,0,0,64,0,-1--1--1,,1|(719,261)| 1,23,9,15,0,0,0,0,0,64,0,-1--1--1,,1|(714,406)| 1,24,5,16,0,0,0,0,0,64,0,-1--1--1,,1|(734,518)| 1,25,43,17,0,0,0,0,0,64,0,-1--1--1,,1|(807,618)| 10,26,Fraction of resources used by intervention type,1133,363,78,27,8,3,0,0,0,0,0,0 1,27,14,26,0,0,0,0,0,64,0,-1--1--1,,1|(1019,318)| 1,28,11,26,1,0,0,0,0,64,0,-1--1--1,,1|(1059,208)| 1,29,15,26,0,0,0,0,0,64,0,-1--1--1,,1|(1019,388)| 1,30,16,26,0,0,0,0,0,64,0,-1--1--1,,1|(1033,441)|

80
1,31,17,26,1,0,0,0,0,64,0,-1--1--1,,1|(1089,521)| 10,32,Interventions vs max by type,350,359,56,18,8,3,0,0,0,0,0,0 10,33,Nonsudden death acute attack treatment vs max,220,518,81,27,8,2,0,3,-1,0,0,0,64-128-128,0-0-0,|12||64-128-128 1,34,33,32,0,0,0,0,0,64,0,-1--1--1,,1|(284,439)| 10,35,Asymptomatic risk mgmt vs max,201,279,72,18,8,2,0,3,-1,0,0,0,64-128-128,0-0-0,|12||64-128-128 1,36,35,32,0,0,0,0,0,64,0,-1--1--1,,1|(268,315)| 10,37,Postacute disease mgmt vs max,192,419,62,27,8,2,0,3,-1,0,0,0,64-128-128,0-0-0,|12||64-128-128 1,38,37,32,0,0,0,0,0,64,0,-1--1--1,,1|(271,389)| 10,39,Subacute disease mgmt vs max,194,357,71,18,8,2,0,3,-1,0,0,0,64-128-128,0-0-0,|12||64-128-128 1,40,39,32,0,0,0,0,0,64,0,-1--1--1,,1|(272,357)| 10,41,Screened fraction of asympto RC2 popn,234,197,79,18,8,2,0,3,-1,0,0,0,64-128-128,0-0-0,|12||64-128-128 1,42,41,32,0,0,0,0,0,64,0,-1--1--1,,1|(287,272)| 10,43,Resources used for acute attacks,690,610,65,18,8,2,0,3,-1,0,0,0,64-128-128,0-0-0,|12||64-128-128 1,44,43,17,0,0,0,0,0,64,0,-1--1--1,,1|(807,618)| \\\---/// Sketch information - do not modify anything except names V300 Do not put anything below this section - it will be ignored *Stock initialization $192-192-192,0,Arial|12||0-0-0|0-0-0|0-0-255|-1--1--1|-1--1--1|96,96,75,0 10,1,Subacute popn acute attack rate initial,745,315,61,27,8,2,0,2,0,0,0,0,0-0-0,0-0-0,|12||64-128-128 10,2,Postacute popn acute attack rate initial,559,527,62,27,8,2,0,2,0,0,0,0,0-0-0,0-0-0,|12||64-128-128 10,3,Asympto popn acute attack rate initial,513,370,61,27,8,2,0,2,0,0,0,0,0-0-0,0-0-0,|12||64-128-128 10,4,Asympto popn symptoms onset rate initial,986,123,76,27,8,2,0,2,0,0,0,0,0-0-0,0-0-0,|12||64-128-128 10,5,Fatal fraction of acute attacks initial,872,551,74,27,8,2,0,2,0,0,0,0,0-0-0,0-0-0,|12||64-128-128 10,6,Adult popn by risk class initial,468,174,70,18,8,2,0,2,0,0,0,0,0-0-0,0-0-0,|12||128-128-128 10,7,Subacute popn by risk class initial,657,148,66,18,8,3,0,0,0,0,0,0 10,8,Postacute popn by risk class initial,598,262,68,18,8,3,0,0,0,0,0,0 10,9,Subacute fraction of Not Postacute by risk class initial,882,231,87,27,8,3,0,0,0,0,0,0 1,10,4,9,0,0,0,0,0,64,0,-1--1--1,,1|(938,171)| 1,11,1,9,0,0,0,0,0,64,0,-1--1--1,,1|(807,276)| 10,12,Adult popn death rate if no CVD attack deaths,1033,335,86,27,8,2,0,3,-1,0,0,0,64-128-128,0-0-0,|12||64-128-128 1,13,12,9,0,0,0,0,0,64,0,-1--1--1,,1|(963,286)| 10,14,Postacute popn fraction by risk class initial,777,448,74,27,8,3,0,0,0,0,0,0 1,15,3,14,0,0,0,0,0,64,0,-1--1--1,,1|(631,405)| 1,16,12,14,0,0,0,0,0,64,0,-1--1--1,,1|(911,388)| 1,17,2,14,0,0,0,0,0,64,0,-1--1--1,,1|(655,491)| 1,18,1,14,0,0,0,0,0,64,0,-1--1--1,,1|(758,374)| 1,19,5,14,0,0,0,0,0,64,0,-1--1--1,,1|(829,504)| 1,20,5,14,0,0,0,0,0,64,0,-1--1--1,,1|(829,504)| 1,21,5,14,0,0,0,0,0,64,0,-1--1--1,,1|(829,504)| 1,22,14,8,0,0,0,0,0,64,0,-1--1--1,,1|(688,355)| 1,23,6,8,0,0,0,0,0,64,0,-1--1--1,,1|(526,214)| 1,24,8,7,0,0,0,0,0,64,0,-1--1--1,,1|(623,211)| 1,25,9,7,0,0,0,0,0,64,0,-1--1--1,,1|(763,187)| 1,26,6,7,0,0,0,0,0,64,0,-1--1--1,,1|(557,162)|

81
1,27,9,14,0,0,0,0,0,64,0,-1--1--1,,1|(832,333)| 10,28,Extent to which CVD attack deaths increase total deaths,989,435,83,27,8,2,0,3,-1,0,0,0,64-128-128,0-0-0,|12||255-0-0 1,29,28,14,0,0,0,0,0,64,0,-1--1--1,,1|(885,441)| 1,30,28,9,0,0,0,0,0,64,0,-1--1--1,,1|(938,339)| 1,31,5,9,0,0,0,0,0,64,0,-1--1--1,,1|(876,397)| \\\---/// Sketch information - do not modify anything except names V300 Do not put anything below this section - it will be ignored *Adverse event rates - initial $192-192-192,0,Arial|12||0-0-0|0-0-0|0-0-255|-1--1--1|-1--1--1|96,96,75,0 10,1,Postacute disease mgmt vs max initial,552,684,74,18,8,2,0,2,0,0,0,0,0-0-0,0-0-0,|12||255-0-0 10,2,Subacute disease mgmt vs max initial,190,681,74,18,8,2,0,2,0,0,0,0,0-0-0,0-0-0,|12||255-0-0 10,3,Nonsudden death acute attack treatment vs max initial,733,156,91,27,8,2,0,2,0,0,0,0,0-0-0,0-0-0,|12||255-0-0 10,4,Asympto risk mgmt vs max initial,977,640,53,27,8,2,0,2,0,0,0,0,0-0-0,0-0-0,|12||255-0-0 10,5,Subacute popn acute attack rate initial,198,572,61,27,8,3,0,0,0,0,0,0 10,6,Postacute popn acute attack rate initial,554,578,61,27,8,3,0,0,0,0,0,0 10,7,Asympto popn acute attack rate initial,1128,548,75,18,8,3,0,0,0,0,0,0 10,8,Asympto popn symptoms onset rate initial,864,550,76,27,8,3,0,0,0,0,0,0 10,9,Fatal fraction of acute attacks initial,492,287,70,18,8,3,0,0,0,0,0,0 1,10,2,5,0,0,0,0,0,64,0,-1--1--1,,1|(192,637)| 1,11,1,6,0,0,0,0,0,64,0,-1--1--1,,1|(552,642)| 1,12,4,7,0,0,0,0,0,64,0,-1--1--1,,1|(1053,593)| 1,13,4,8,0,0,0,0,0,64,0,-1--1--1,,1|(926,599)| 10,14,Fatal fraction of nonsudden death attacks if max treatment,669,74,91,27,8,2,0,3,-1,0,0,0,64-128-128,0-0-0,|12||255-0-0 10,15,Fatal fraction of nonsudden death attacks if zero treatment,377,72,91,27,8,2,0,3,-1,0,0,0,64-128-128,0-0-0,|12||255-0-0 10,16,Subacute attack rate if max disease mgmt,304,493,81,18,8,2,0,3,-1,0,0,0,64-128-128,0-0-0,|12||255-0-0 1,17,16,5,0,0,0,0,0,64,0,-1--1--1,,1|(262,523)| 10,18,Subacute attack rate if zero disease mgmt,197,430,81,18,8,2,0,3,-1,0,0,0,64-128-128,0-0-0,|12||255-0-0 1,19,18,5,0,0,0,0,0,64,0,-1--1--1,,1|(197,489)| 10,20,Postacute attack rate if max disease mgmt,632,489,82,18,8,2,0,3,-1,0,0,0,64-128-128,0-0-0,|12||255-0-0 1,21,20,6,0,0,0,0,0,64,0,-1--1--1,,1|(601,523)| 10,22,Postacute attack rate if zero disease mgmt,496,430,82,18,8,2,0,3,-1,0,0,0,64-128-128,0-0-0,|12||255-0-0 1,23,22,6,0,0,0,0,0,64,0,-1--1--1,,1|(520,492)| 10,24,Asympto symptoms onset rate if max risk mgmt,923,459,75,27,8,2,0,3,-1,0,0,0,64-128-128,0-0-0,|12||255-0-0 1,25,24,8,0,0,0,0,0,64,0,-1--1--1,,1|(897,498)| 10,26,Asympto symptoms onset rate if zero risk mgmt,804,402,76,27,8,2,0,3,-1,0,0,0,64-128-128,0-0-0,|12||255-0-0 1,27,26,8,0,0,0,0,0,64,0,-1--1--1,,1|(830,469)| 10,28,Asympto attack rate if max risk mgmt,1181,448,78,18,8,2,0,3,-1,0,0,0,64-128-128,0-0-0,|12||255-0-0 1,29,28,7,0,0,0,0,0,64,0,-1--1--1,,1|(1157,491)| 10,30,Asympto attack rate if zero Risk Mgmt,1082,393,78,18,8,2,0,3,-1,0,0,0,64-128-128,0-0-0,|12||255-0-0 1,31,30,7,0,0,0,0,0,64,0,-1--1--1,,1|(1102,463)| 10,32,Sudden death fraction of attacks,277,236,69,18,8,2,0,3,-1,0,0,0,64-128-128,0-0-0,|12||255-0-0 10,33,Fatal fraction of nonsudden death acute attacks initial,499,175,85,27,8,3,0,0,0,0,0,0

82
1,34,14,33,0,0,0,0,0,64,0,-1--1--1,,1|(590,120)| 1,35,15,33,0,0,0,0,0,64,0,-1--1--1,,1|(432,119)| 1,36,3,33,0,0,0,0,0,64,0,-1--1--1,,1|(619,164)| 1,37,33,9,0,0,0,0,0,64,0,-1--1--1,,1|(496,228)| 1,38,32,9,0,0,0,0,0,64,0,-1--1--1,,1|(377,259)| \\\---/// Sketch information - do not modify anything except names V300 Do not put anything below this section - it will be ignored *QALYs $192-192-192,0,Arial|12||0-0-0|0-0-0|0-0-255|-1--1--1|-1--1--1|96,96,75,0 10,1,Postacute popn,679,681,42,18,8,2,0,2,0,0,0,0,0-0-0,0-0-0,|12||64-128-128 10,2,Subacute popn,547,710,40,18,8,2,0,2,0,0,0,0,0-0-0,0-0-0,|12||64-128-128 10,3,Asymptomatic popn,377,709,57,18,8,2,0,2,0,0,0,0,0-0-0,0-0-0,|12||64-128-128 10,4,Postacute disease mgmt vs max,181,691,62,27,8,2,0,3,-1,0,0,0,64-128-128,0-0-0,|12||64-128-128 10,5,Subacute disease mgmt vs max,175,600,71,18,8,2,0,3,-1,0,0,0,64-128-128,0-0-0,|12||64-128-128 10,6,Postacute disease mgmt vs max initial,262,289,74,18,8,2,0,2,0,0,0,0,0-0-0,0-0-0,|12||255-0-0 10,7,Subacute disease mgmt vs max initial,257,219,74,18,8,2,0,2,0,0,0,0,0-0-0,0-0-0,|12||255-0-0 10,8,Asymptomatic popn initial,403,180,53,18,8,3,0,2,0,0,0,0,0-0-0,0-0-0,|12||128-128-128 10,9,Subacute popn initial,508,134,56,18,8,3,0,2,0,0,0,0,0-0-0,0-0-0,|12||128-128-128 10,10,Postacute popn initial,646,155,58,18,8,3,0,2,0,0,0,0,0-0-0,0-0-0,|12||128-128-128 10,11,Avg unhealthy days per mo for Asympto,172,488,72,18,8,3,0,2,0,0,0,0,0-0-0,0-0-0,|12||255-0-0 10,12,Avg unhealthy days per mo for Subacute w no disease mgmt,510,426,84,27,8,3,0,2,0,0,0,0,0-0-0,0-0-0,|12||255-0-0 10,13,Avg unhealthy days per mo for Subacute w max disease mgmt,321,445,85,27,8,3,0,2,0,0,0,0,0-0-0,0-0-0,|12||255-0-0 10,14,Avg unhealthy days per mo for Postacute w no disease mgmt,696,425,84,27,8,3,0,2,0,0,0,0,0-0-0,0-0-0,|12||255-0-0 10,15,Avg unhealthy days per mo for Postacute w max disease mgmt,819,493,87,27,8,3,0,2,0,0,0,0,0-0-0,0-0-0,|12||255-0-0 10,16,Avg unhealthy days per mo for adult popn initial,586,317,84,27,8,3,0,0,0,0,0,0 1,17,11,16,1,0,0,0,0,64,0,-1--1--1,,1|(210,443)| 1,18,14,16,0,0,0,0,0,64,0,-1--1--1,,1|(646,375)| 1,19,15,16,1,0,0,0,0,64,0,-1--1--1,,1|(767,385)| 1,20,12,16,0,0,0,0,0,64,0,-1--1--1,,1|(543,377)| 1,21,6,16,0,0,0,0,0,64,0,-1--1--1,,1|(412,301)| 1,22,7,16,0,0,0,0,0,64,0,-1--1--1,,1|(402,262)| 1,23,13,16,0,0,0,0,0,64,0,-1--1--1,,1|(446,384)| 1,24,8,16,0,0,0,0,0,64,0,-1--1--1,,1|(482,239)| 1,25,9,16,0,0,0,0,0,64,0,-1--1--1,,1|(541,214)| 1,26,10,16,0,0,0,0,0,64,0,-1--1--1,,1|(620,224)| 10,27,QALYs per year for adult popn initial,833,332,70,18,8,3,0,0,0,0,0,0 1,28,16,27,0,0,0,0,0,64,0,-1--1--1,,1|(709,324)| 10,29,Adult popn,797,659,48,10,8,2,0,3,-1,0,0,0,64-128-128,0-0-0,|12||64-128-128 10,30,Adult popn initial,745,211,59,10,8,3,0,2,0,0,0,0,0-0-0,0-0-0,|12||128-128-128 1,31,30,27,0,0,0,0,0,64,0,-1--1--1,,1|(781,261)| 1,32,30,16,0,0,0,0,0,64,0,-1--1--1,,1|(683,251)| 10,33,Avg unhealthy days per mo for adult popn,535,556,78,18,8,3,0,0,0,0,0,0 1,34,11,33,1,0,0,0,0,64,0,-1--1--1,,1|(334,545)| 1,35,13,33,0,0,0,0,0,64,0,-1--1--1,,1|(430,501)| 1,36,12,33,0,0,0,0,0,64,0,-1--1--1,,1|(521,488)| 1,37,14,33,0,0,0,0,0,64,0,-1--1--1,,1|(615,490)| 1,38,15,33,0,0,0,0,0,64,0,-1--1--1,,1|(679,523)| 1,39,5,33,0,0,0,0,0,64,0,-1--1--1,,1|(344,579)|

83
1,40,4,33,0,0,0,0,0,64,0,-1--1--1,,1|(358,623)| 1,41,3,33,0,0,0,0,0,64,0,-1--1--1,,1|(450,637)| 1,42,2,33,0,0,0,0,0,64,0,-1--1--1,,1|(541,639)| 1,43,1,33,0,0,0,0,0,64,0,-1--1--1,,1|(612,623)| 1,44,29,33,0,0,0,0,0,64,0,-1--1--1,,1|(682,614)| 10,45,QALYs per year for adult popn,854,576,58,18,8,3,0,0,0,0,0,0 1,46,33,45,0,0,0,0,0,64,0,-1--1--1,,1|(697,565)| 1,47,29,45,0,0,0,0,0,64,0,-1--1--1,,1|(818,627)| 10,48,Cumul additional QALYs,1143,395,63,35,3,3,0,4,0,0,0,0,0-0-0,255-255-128,|12||0-0-0 12,49,48,926,400,10,8,0,3,0,0,-1,0,0,0 1,50,52,48,4,0,0,22,0,0,0,-1--1--1,,1|(1047,400)| 1,51,52,49,100,0,0,22,0,0,0,-1--1--1,,1|(969,400)| 11,52,48,1008,400,6,8,34,3,0,0,1,0,0,0 10,53,Additional QALYs per year,1008,426,58,18,40,3,0,0,-1,0,0,0 1,54,27,53,0,0,0,0,0,64,0,-1--1--1,,1|(913,375)| 1,55,45,53,0,0,0,0,0,64,0,-1--1--1,,1|(925,505)| 10,56,Cumul additional resources,1121,150,63,35,3,3,0,4,0,0,0,0,0-0-0,255-255-128,|12||0-0-0 10,57,Cumul additional resources per QALY,1140,266,74,18,8,3,0,0,0,0,0,0 1,58,56,57,0,0,0,0,0,64,0,-1--1--1,,1|(1130,209)| 1,59,48,57,0,0,0,0,0,64,0,-1--1--1,,1|(1141,328)| 10,60,Additional resources per QALY,982,282,51,27,8,3,0,0,0,0,0,0 1,61,53,60,0,0,0,0,0,64,0,-1--1--1,,1|(996,365)| 1,62,3,8,0,1,0,0,0,0,1,-1--1--1,,1|(389,451)| 1,63,2,9,0,1,0,0,0,0,1,-1--1--1,,1|(527,428)| 1,64,1,10,0,1,0,0,0,0,1,-1--1--1,,1|(662,424)| 1,65,29,30,0,1,0,0,0,0,1,-1--1--1,,1|(771,441)| 10,66,Additional resources total provided under umbrella budget,1121,203,88,27,8,2,1,3,-1,0,0,0,64-160-98,0-0-0,|12||64-160-98 1,67,66,56,0,1,0,0,0,0,0,-1--1--1,,1|(1121,187)| 10,68,Additional resources total provided under umbrella budget,982,310,88,27,8,2,1,3,-1,0,0,0,64-160-98,0-0-0,|12||64-160-98 1,69,68,60,0,1,0,0,0,0,0,-1--1--1,,1|(982,303)| 12,70,48,906,150,10,8,0,3,0,0,-1,0,0,0 1,71,73,56,4,0,0,22,0,0,0,-1--1--1,,1|(1025,150)| 1,72,73,70,100,0,0,22,0,0,0,-1--1--1,,1|(948,150)| 11,73,48,987,150,6,8,34,3,0,0,1,0,0,0 10,74,Additional resources provided,987,185,42,27,40,2,0,3,-1,0,0,0,64-160-98,0-0-0,|12||64-160-98 1,75,74,60,0,0,0,0,0,64,0,-1--1--1,,1|(984,226|

84
External Distribution
1 Jack Homer Homer Consulting 3618 Avalon Court Voorhees, NJ 08043 http://www.angelfire.com/biz2/HomerConsulting/index.html
Internal Distribution 1 MS 0123 D. Chavez, LDRD Office, 1011 1 MS 0370 G. A. Backus, 1433 1 MS 1015 R. E. Nelson, 03330 1 MS 1016 L. D. Duffy, 03300 1 MS 1138 G. B. Hirsch, 6322 1 MS 1316 D. R. Strip, 1412 1 MS 0899 Technical Library, 9536 (electronic copy)

85


