Begbies Traynor Group is the
56
Transcript of Begbies Traynor Group is the


Begbies Traynor Group is the UK’s leading independent business recovery practice, principally serving the mid‑market and SMEs.
Our aim is to add value and optimise financial outcomes for our clients and business stakeholders.
More about us can be found on pages 02-05
Begbies Traynor Group plc
Business review
01 Our 2013 highlights
02 Business review
02 Who we are 02 Where we are 03 What we do
04 Our strategy
04 Our strategic goals 04 Our cases
05 Key facts
06 Chairman’s statement
09 Financial review
Corporate governance
11 Board of directors
12 Directors’ report
14 Statement of directors’ responsibilities
15 Directors’ remuneration report
17 Corporate governance statement
Financial statements
18 Independent auditor’s report
19 Consolidated income statement
20 Consolidated statement of comprehensive income
21 Consolidated statement of changes in equity
22 Consolidated balance sheet
23 Consolidated cash flow statement
24 Notes to the consolidated financial statements
47 Independent auditor’s report
48 Company balance sheet
49 Notes to the company financial statements
Shareholder information
52 Officers and professional advisors
01Begbies Traynor Group plc Annual Report and Accounts 2013
Our 2013 highlightsBusiness review
Financial highlights U Revenue1 of £51.1 million (2012: £57.7 million)
U EBITA2 (pre-exceptional items and acquisition-related costs) of £7.7 million (2012: £8.5 million)
U Adjusted profit before tax3 of £6.7 million (2012: £7.4 million)
U Profit before tax of £2.4 million (2012: £5.5 million)
U Statutory profit for the year of £1.4 million (2012: loss of £5.7 million including loss from discontinued operations and impairment charges)
U Earnings per share:
– adjusted basic and diluted EPS4 from continuing operations of 5.3 pence (2012: 6.0 pence)
– basic and fully diluted EPS from continuing operations of 1.6 pence (2012: 4.4 pence)
– basic and fully diluted EPS from continuing and discontinued operations of 1.6 pence (2012: loss of 6.4 pence)
U Proposed final dividend maintained at 1.6 pence (2012: 1.6 pence), making a total dividend for the year of 2.2 pence (2012: 2.2 pence)
U Net debt of £17.2 million (2012: £20.1 million), reduced from £27.3 million at 31 October 2011 and giving significant headroom within the banking facilities
U Net assets per share of 64 pence (2012: 65 pence)
Operational highlights U Market share maintained despite declining market with the group handling the largest number of corporate insolvency appointments in the UK
U Operating margins maintained at 15% – cost base reduced by £8 million over last two years
U Completed refinancing of debt facilities, providing the group with long-term £30 million funding line and £5 million overdraft
U Launched BTG Financial Consulting, incorporating the group’s restructuring services-led practice, and already completed several higher value, complex restructuring cases
U Notable insolvency cases in the period included Port Vale FC, Pentagon Capital Management and United Carpets
U Post period end we were appointed as administrators of Rett Retail Ltd, owner of the Ark fashion retail chain
1 From continuing operations2 Earnings before interest, tax and amortisation of intangible assets arising on acquisitions
(from continuing operations)3 Profit before tax from continuing operations of £2.4 million (2012: £5.5 million) plus amortisation of intangible assets arising on acquisitions of £0.4 million (2012: £0.4 million) plus finance charge arising from the discounting of deferred consideration of £nil (2012: £0.1 million) plus exceptional items and acquisition-related costs of £3.9 million (2012: £1.4 million)
4 See reconciliation in note 11
For more on who we are and what we do: www.begbies-traynorgroup.com

02 Begbies Traynor Group plc Annual Report and Accounts 2013
The UK’s leading independent business recovery practice
Business review
We provide our services via a comprehensive network spanning the whole of the UK, with offices in the following locations:
1 Aberdeen 2 Bath 3 Belfast 4 Birmingham 5 Blackpool 6 Brighton 7 Bristol 8 Cambridge 9 Cardiff10 Chester11 Derby12 Doncaster13 Dundee14 Edinburgh15 Exeter16 Glasgow17 Halifax
18 Hull19 Leeds20 Leicester21 Liverpool22 London23 Manchester24 Newcastle upon Tyne25 Nottingham26 Portsmouth27 Preston28 Salisbury29 Sheffield30 Southampton31 Southend32 Stoke-on-Trent33 Teesside34 York
Who we areA market-leading group.
Begbies Traynor Group is the UK’s leading independent business recovery practice, principally serving the mid‑market and SMEs.
We provide a range of specialist professional services primarily to businesses, their professional advisors and the major banks covering insolvency, restructuring and risk management activities.
We provide these services on a local, national and international basis through our extensive UK-wide office base and our international network of professionals in over 100 countries.
14
1
13
16
24
3 33
34
181917275
2112
2923
1032 25
204
11
8
3122
279
6263028
15
Where we areAn extensive network.

03Begbies Traynor Group plc Annual Report and Accounts 2013
What we doThe group’s core insolvency and restructuring division provides corporate recovery, restructuring, financial consulting and personal insolvency services and is complemented by global risk partners, a specialist risk consulting and forensic investigation consultancy.
We are the UK’s leading independent insolvency practice, handling the largest number of corporate insolvency appointments in the country.
Our highly experienced team of specialist partners has a strong reputation; we are accredited by all major banks; and we have excellent referral networks from other professional services organisations.
Our nationwide team provides advice to businesses, financial institutions, stakeholders and other professionals on formal corporate insolvencies, including administrations and liquidations.
Our experienced national team provides advice to debtors and creditors on all aspects of personal insolvency, both formal insolvency processes and informal advice.
In England and Wales our team will act on bankruptcy appointments and individual voluntary arrangements, together with trust deeds and sequestrations in Scotland.
Our restructuring specialists work closely with management, lenders and other key stakeholders to create solutions aimed at delivering an immediate impact and ensuring a sound basis for future trading.
Our services include debt restructuring; lender and creditor negotiations; business reviews; and corporate simplification, including options for simplifying complex corporate structures to eliminate risks and costs.
Our team of financial consulting specialists provide corporate finance, valuation and debt advisory services to a broad range of clients.
Global risk partners is a specialist risk consulting and forensic investigation consultancy.
Its services include forensic technology and accountancy, risk and security consultancy and corporate intelligence and investigations.
1
3
2
4
Corporate recovery
Personal insolvency
Restructuring and financial consulting
Global risk partners

04 Begbies Traynor Group plc Annual Report and Accounts 2013
Our strategyWe aim to enhance our position as the UK’s leading independent business recovery practice, ensuring our core division is well‑placed to benefit from the opportunities presented by the long‑term growth in the UK insolvency market, together with developing the complementary service offerings.
Business review
Our strategic goals Our cases
Develop core insolvency practice through senior recruitment, selective acquisitions and staff development
We were appointed as administrators to a garden centre business in West Yorkshire. Having traded for over 25 years, the garden centre had an annual turnover of approximately £2 million and its assets included a freehold site and significant levels of stock.
Despite being a well-established, viable business with a loyal customer base, it unfortunately suffered from financial pressures unrelated to its day-to-day operations. After a thorough review we were confident that a buyer could quickly be found and so we continued to trade the business, preserving the jobs of all staff.
We subsequently sold the business to a private investment vehicle which generated a positive return to the bank compared to liquidation or closure, as well as securing all the jobs, and most importantly gave the business a firm base for future growth.
A service sector client with a turnover of £140 million and up to £16 million of invoice finance debt approached us at crisis point after losing two significant customers amounting to £50 million of annual turnover.
Key issues facing the business included loss of sales, suspension of trade credit insurance, significant overhead costs and suppliers demanding upfront payments. The management was uncertain of its next steps.
Our initial focus was on short-term stability; this was achieved by negotiating extended credit terms with key suppliers and securing the ongoing support of the incumbent bank. This enabled the management team to avoid imminent insolvency and provided vital time to fully assess the options available to the business.
Having stabilised the business, we developed a credible restructuring plan which would lead to a profitable and cash-generative business.
Our involvement preserved value in the business and employment, delivered a stable financial structure and enabled management to regain control.
Win higher value, complex instructions from existing clients and prospects by demonstrating our growing capabilities and credentials
1
2

05Begbies Traynor Group plc Annual Report and Accounts 2013
Staff and partners at 30 April 2013.
New recovery engagements in the year.
The number of licensed Insolvency Practitioners across the UK. The number of recovery engagements.
The number of UK-based banks who provided us with insolvency and restructuring appointments during the year.
The number of member and associated firms in BTG Global Network, our international alliance. These members operate in 371 locations across 112 countries.
We remain the UK’s leading independent business recovery practice, handling the largest number of corporate appointments in the country.
No.1
501
151
71
16
9,334
2,027
The total number of UK locations that we operate from.
34
Key facts

06 Begbies Traynor Group plc Annual Report and Accounts 2013
IntroductionLast year was a challenging period for our industry with the number of UK corporate insolvency appointments decreasing by 10% over the 12 months to 31 March 2013. In this environment we consider that we have delivered a solid financial performance for the year as a result of the ongoing management of our cost base, which has mitigated the impact of lower revenues. We have maintained our operating margins at 15% and reduced our net debt to £17.2 million at 30 April 2013 (2012: £20.1 million), with gearing reduced to 30% (2012: 34%).
Over the last two financial years we have reduced our cost base by £8 million from £52 million to £44 million and have reduced net debt significantly from £27.3 million as at 31 October 2011 to £17.2 million as at the year end.
We remain the UK’s leading independent business recovery practice, handling the largest number of corporate insolvency appointments in the country and have maintained our leading market share.
We completed a refinancing of our debt facilities in April 2013, which has provided the group with a committed £30 million funding line, with maturity dates from July 2017 to April 2021, together with a £5 million overdraft facility. We have significant headroom in this facility.
These new debt facilities, together with the significant reduction in debt over the last 18 months, place the group in a strong financial position. This will enable us to consider making organic investments and selective acquisitions, whilst providing confidence in the underlying strength of the group, despite the challenging trading conditions.
ResultsGroup revenue from continuing operations in the year ended 30 April 2013 was £51.1 million (2012: £57.7 million), with earnings before interest, tax and amortisation (pre-exceptional items and acquisition-related costs) of £7.7 million (2012: £8.5 million). Adjusted profit before tax1 was £6.7 million (2012: £7.4 million). Profit before tax was £2.4 million (2012: £5.5 million). Exceptional items and acquisition-related costs relating to continuing operations were £3.9 million (2012: £1.4 million). The exceptional costs form a part of the group’s cost management programme, which has reduced the cost base by £8 million since 2011, with a further £2 million of savings to be realised in the new financial year. Statutory profit for the year was £1.4 million (2012: loss of £5.7 million after loss from discontinued operations and associated impairment charges).
The results on a sequential basis, which show a broadly stable level of EBITA despite falling revenues, over the last 18 months are as follows:
Chairman’s statementBusiness review
In summary Market share maintained despite declining market with the group handling the largest number of corporate insolvency appointments in the UK
Operating margins maintained at 15% – cost base reduced by £8 million over last two years
Completed refinancing of debt facilities, providing the group with long-term £30 million funding line and £5 million overdraft
Results on a sequential basisSix months Six months Six months Six months
ended ended ended ended
31 October 30 April 31 October 30 April
2011 2012 2012 2013
£m £m £m £m
Revenue 29.4 28.3 26.1 25.0EBITA 4.6 3.9 3.7 4.0Adjusted profit before tax 4.1 3.3 3.2 3.5Profit before tax 3.4 2.1 2.0 0.4
Unaudited. Cumulative 12 months ending 30 April audited
07Begbies Traynor Group plc Annual Report and Accounts 2013
Earnings per share from continuing operations2, adjusted for the net of tax impact of amortisation of intangible assets arising on acquisition, exceptional and acquisition-related costs and the finance charge arising from the discounting of deferred consideration liabilities, was 5.3 pence (2012: 6.0 pence). Basic and fully diluted EPS from continuing operations were 1.6 pence (2012: 4.4 pence).
Net debt at 30 April 2013 was £17.2 million (2012: £20.1 million), giving gearing of 30% (2012: 34%) and headroom of £17.9 million in the group’s principal banking facilities. Interest cover3 was 7.8 times (2012: 7.2 times). Net assets per share were 64 pence (2012: 65 pence). 1 Profit before tax from continuing operations of
£2.4 million (2012: £5.5 million) plus amortisation of intangible assets arising on acquisitions of £0.4 million (2012: £0.4 million) plus finance charge arising from the discounting of deferred consideration of £nil (2012: £0.1 million) plus exceptional items and acquisition-related costs of £3.9 million (2012: £1.4 million)
2 See reconciliation in note 113 Before exceptional costs and amortisation
of intangible assets arising on acquisitions
DividendThe board remains committed to its long-term progressive dividend policy, which takes account of the underlying growth in earnings, whilst acknowledging the requirement for continuing investment and short-term fluctuations in profit.
Having considered the results for the year, the outlook for the new financial year and the ongoing requirements of the business, the board has recommended the total dividend be maintained at 2.2 pence (2012: 2.2 pence), comprising the interim dividend already paid of 0.6 pence (2012: 0.6 pence) and a final dividend of 1.6 pence (2012: 1.6 pence).
The final dividend will be paid on 7 November 2013 to shareholders on the register on 11 October 2013, with an ex-dividend date of 9 October 2013.
StrategyWe aim to enhance our position, through organic investment and selective acquisitions, as the UK’s leading independent insolvency practice, ensuring our core division is well-placed to benefit from the opportunities presented by long-term growth in the UK insolvency market, together with developing complementary service offerings.
PeopleWe are reliant on the expertise, professionalism and commitment of our people and I thank all of them for their contribution during a challenging year.
As at 30 April 2013, the group’s continuing operations employed a total of 501 people (2012: 563), a decrease of 11% compared with a year ago, which includes 392 direct fee earners, of whom 71 are partners, and 109 support staff. We continue to invest in training and developing our people; three of our fee earners passed the Joint Insolvency Examination Board (‘JIEB’) exams in November 2012, and we are pleased to have promoted two fee earners to partner during the year.
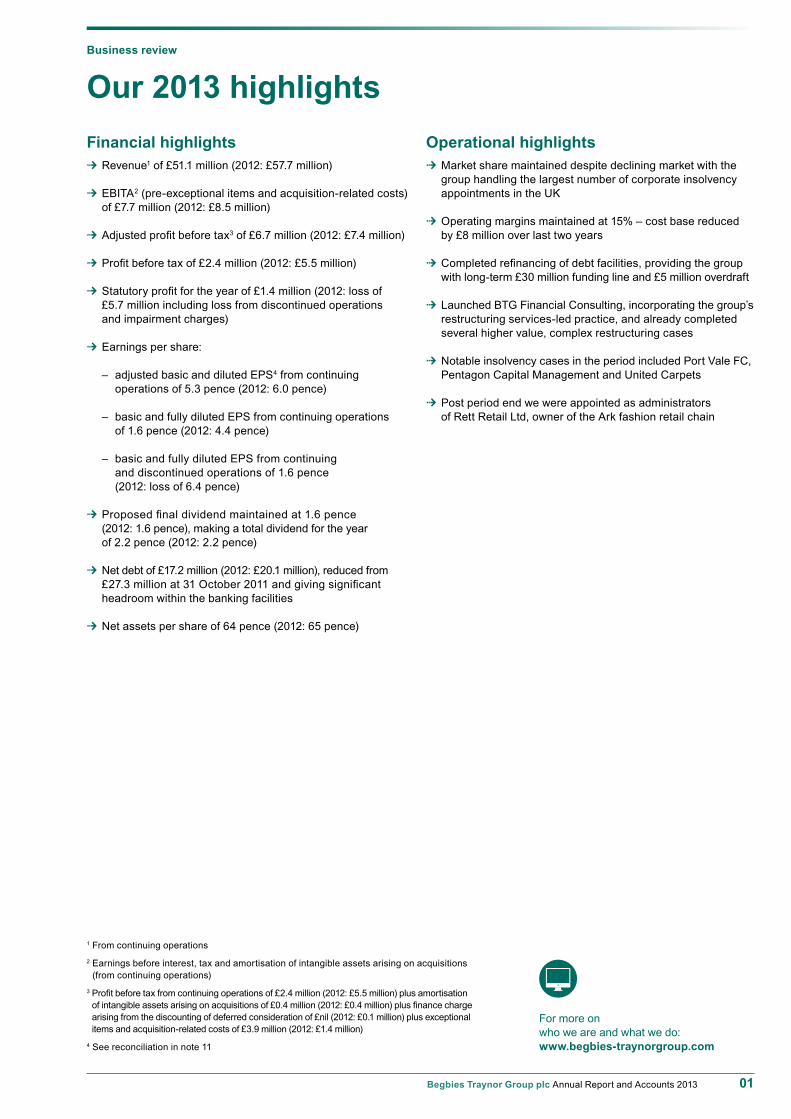
Operational review – continuing operationsInsolvency and restructuringBegbies Traynor is the UK’s leading independent business rescue, recovery, restructuring and insolvency organisation, providing a partner-led service to stakeholders in troubled businesses.
Segmental profits in the year decreased to £12.3 million (2012: £13.7 million), on revenues which decreased to £47.5 million (2012: £53.1 million). Operating margins remained broadly unchanged at 25.9% (2012: 25.8%).
The UK insolvency market remains challenging with a 10% decrease in the number of UK corporate insolvencies in the 12 months ended 31 March 2013 compared to the same period in the prior year. Activity levels remain lower than
expected at this stage of the economic cycle, with base rates of 0.5% (since May 2009) continuing to provide a very benign financing environment for otherwise weak companies that in previous recessions would almost certainly have gone into an insolvency process.
As the UK insolvency business with the largest market share, any volatility in national insolvency numbers has a direct impact on our operational volumes. In this environment, with constrained activity levels, we have continued to keep our cost base under close review to ensure it is aligned to current and projected activity levels. The number of people employed in the division has decreased to 415 as at 30 April 2013 from 466 at the start of the financial year.
The division has continued to generate good operating margins as a result of the efficiency measures, in spite of the reduced revenues and consequent reduction in overall profit.
We remain the market leader in UK mid-market insolvency and believe that the combination of our full national coverage, strong relationships with all major UK banks and excellent referral networks from other professional services organisations leaves the business well-placed to take full advantage of its market. Our strong market position was borne out by our appointment to a number of high-profile insolvency cases during the year, including the successful sale of Port Vale Football Club from administration as a going concern, the administration of Pentagon Capital Management and the pre-pack administration of United Carpets (Northern) Limited, a 73-store chain of carpet superstores. Following the period end, we were appointed as administrators of Rett Retail Ltd, owner of the Ark fashion retail chain, and on 28 June 2013 we announced that JD Sports had acquired the business out of administration, securing the jobs for 160 of Ark’s 200 employees.
13 13 13 13
12 12 12 12
Insolvency
Revenue (£m) Revenue (£m)EBITA (£m) EBITA (£m)
Global risk partners
53.1 13.7 4.6 nil
47.5 12.3 3.6 (0.2)

08 Begbies Traynor Group plc Annual Report and Accounts 2013
Operational review – continuing operations continuedInsolvency and restructuring continuedDuring the year, as part of the ongoing development of our advisory services, we launched BTG Financial Consulting, which incorporates the group’s restructuring services-led practice. The team draws on the existing specialist expertise within the group, offering a comprehensive range of multi-discipline services. Utilising the extensive capabilities of its domestic teams as well as the specialist firms around the international network, the team advises UK and international clients facing strategic, financial and commercial challenges and has already completed several higher value, complex restructuring cases.
We will continue to develop our core business through a combination of senior recruitment, selective acquisitions and staff development, with the intention of progressively increasing our market share. Further development will come from winning higher value, more complex instructions from existing clients and prospects by demonstrating our growing capabilities and credentials.
Global risk partnersGlobal risk partners is a specialist risk consulting and forensic investigation consultancy. Its services include forensic technology and accountancy; risk and security consultancy; and corporate intelligence and investigations.
This segment generated a loss of £0.2 million in the year (2012: £nil) on revenues which decreased to £3.6 million (2012: £4.6 million).
Having generated a profit of £0.2 million in the first six months of the year, a number of anticipated sales opportunities failed to convert in the second half year, which resulted in reduced revenue levels and a loss for the year as a whole, below our expectations.
The number of people employed in global risk partners was 30 on 30 April 2013, down from 34 the year before.
Insolvency marketGovernment insolvency statistics for the 12 months ended 31 March 2013 showed a 10% decrease in the number of UK corporate insolvencies compared to the same period in the prior year. This contrasts with a 5% increase in the preceding year. The statistics for the first quarter of calendar year 2013 represented an 18% reduction on the comparable quarter of 2012 and was the fourth consecutive quarter of decreases in corporate insolvencies.
The ‘Begbies Traynor Red Flag Alert’ quarterly report, which monitors early warning signs of potential insolvency activity, revealed that the number of UK companies experiencing critical problems in the first calendar quarter of 2013 had decreased by 34% from the same period in 2012, albeit with an increase of 8% from the preceding quarter.
Corporate insolvency rates (expressed as a percentage of active corporate entities) remain at historically low levels, especially when contrasted with previous recessions. The board’s view is that this is due to the ongoing high level of monetary support, principally low interest rates, combined with lenient attitudes by creditors towards financially stressed companies.
The board continues to plan for suppressed market conditions to continue in the new financial year.
OutlookAs the UK insolvency business with the largest market share, any change in national insolvency numbers, which are difficult to predict in the current climate, has a direct impact on our operational volumes. In the near term, we do not anticipate an improvement in the market conditions as described above.
We enter the new financial year with further committed cost reductions of £2 million, which will enable us to maintain our operating margins in the event of a modest reduction in revenue. Importantly, however, the group does retain the capacity and expertise to handle an increase in activity levels should they arise, which would result in improved profit and margins due to the inherent operational gearing in the business.
Our new debt facilities, together with the significant reduction in debt, place the group in a strong financial position. This will enable us to consider making organic investments and selective acquisitions, whilst providing confidence in the underlying strength of the group, despite the challenging trading conditions.
An update on current trading will be provided at the time of the company’s annual general meeting in October 2013.
Ric TraynorExecutive chairman3 July 2013
Chairman’s statement continuedBusiness review

09Begbies Traynor Group plc Annual Report and Accounts 2013
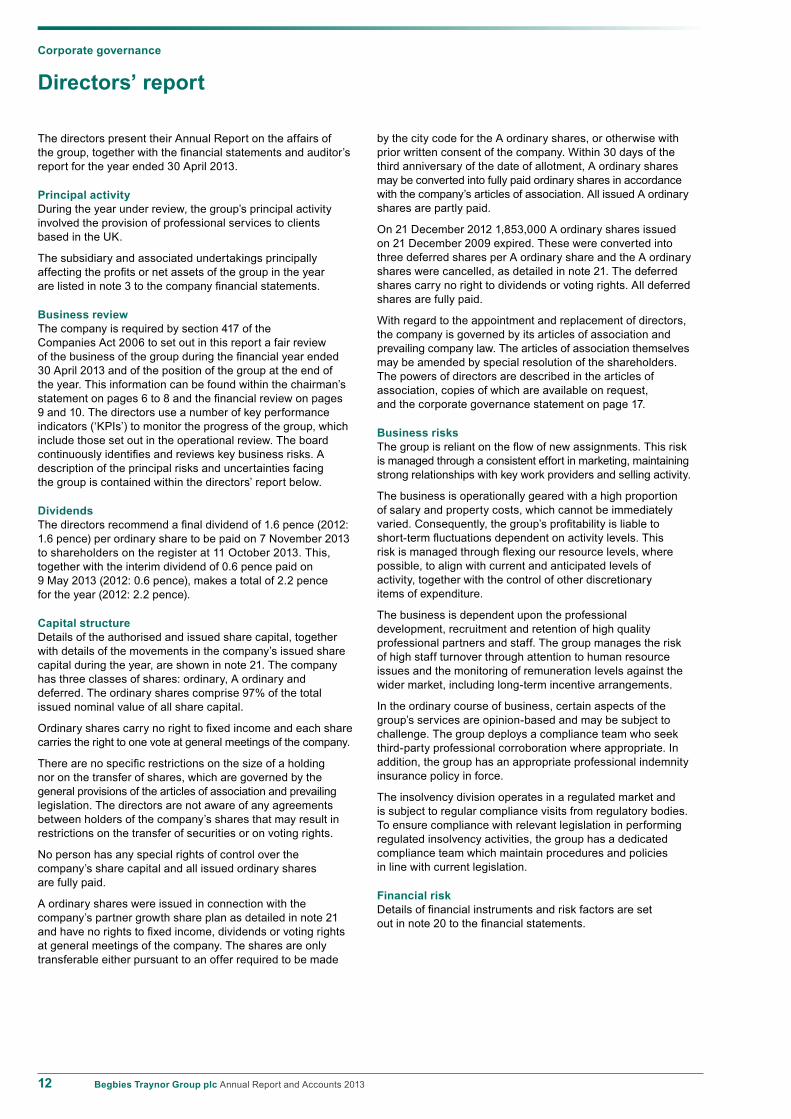
Financial highlights – continuing operationsThe group’s revenue from continuing operations in the year was £51.1 million (2012: £57.7 million), with insolvency revenue having decreased by £5.6 million or 10.5% and global risk partners’ revenue having decreased by £1.0 million or 22.7%.
EBITA (pre-exceptional and acquisition-related costs) decreased to £7.7 million (2012: £8.5 million). Margins remained unchanged at 15% principally due to cost savings from the restructuring of the group’s cost base.
The table below summarises financial performance on a sequential basis for the last two years.
During the year, the group incurred exceptional costs of £3.9 million (2012: £1.4 million), with restructuring costs accounting for £3.8 million and advice relating to the recent debt refinancing accounting for £0.1 million. The restructuring costs, which have been incurred to reduce the cost base to an appropriate level for the reduced activity levels in the wider market, relate to staff reductions (£2.1 million), onerous property leases (£0.3 million) and non-cash asset write downs (£1.4 million).
The group’s cost base has reduced markedly from £52 million in 2011 to £44 million in 2013 and is anticipated to reduce by a further £2 million in the new financial year as a result of these efficiency measures.
Amortisation of intangible assets arising on acquisitions was £0.4 million (2012: £0.4 million).
Finance costs decreased to £1.0 million (2012: £1.2 million) due to the reduced levels of net debt over the year.
Adjusted profit before tax was £6.7 million (2012: £7.4 million). Profit before tax was £2.4 million (2012: £5.5 million). The reconciliation between these profit measures is shown in the table on page 10.
The tax charge arising on pre-exceptional profits was £1.9 million (2012: £1.8 million). This represents an effective rate of 29% (2012: 27%). The group’s tax rate is higher than the prevailing UK tax rate of 24% as a result of expenses incurred by the group that are not deductible in determining taxable profit. The tax charge for the year from continuing operations was £1.0 million (2012: £1.5 million), which represents an effective rate of 41% (2012: 27%).
Profit for the year from continuing operations was £1.4 million (2012: £4.0 million).
Earnings per share (‘EPS’)EPS from continuing operations1, adjusted for the net of tax impact of amortisation of intangible assets arising on acquisitions, exceptional and acquisition-related costs and the finance charge arising from the discounting of deferred consideration liabilities, was 5.3 pence (2012: 6.0 pence).
Basic and fully diluted EPS from continuing operations were 1.6 pence (2012: 4.4 pence).1 See reconciliation in note 11
FinancingThe group is in a strong financial position, having entered into new banking facilities totalling £35 million on 26 April 2013. The new facilities, which are unsecured, comprise:
U £10 million committed revolving credit facility, with a July 2017 maturity date, from HSBC;
U £10 million committed revolving credit facility, with a July 2017 maturity date, from Santander UK;
U £10 million term facility with M&G UK Companies Financing Fund 2, with £5 million maturing in April 2020 and £5 million maturing in April 2021; and a
U £5 million overdraft facility from HSBC.
These new facilities provide the group with an attractive blend of medium and long-term financing at competitive rates and will enable the group to consider organic investment and acquisition opportunities.
They replace the group’s previous £35 million debt facilities, in place during the year, which were due to mature in 2014. All bank covenants in relation to these facilities were met during the year.
Financial reviewBusiness review
Financial performance on a sequential basisSix months Six months Six months Six months
ended ended ended ended
31 October 30 April 31 October 30 April
2011 2012 2012 2013
£m £m £m £m
Revenue 29.4 28.3 26.1 25.0Costs (net of other operating income) (24.8) (24.4) (22.4) (21.0)
EBITA 4.6 3.9 3.7 4.0
Margin 15.7% 13.7% 14.0% 16.0%
Unaudited. Cumulative 12 months ending 30 April audited
13 13 13
12 12 12
Revenue1 (£m) Adjusted EPS3 (p)EBITA2 (£m)
57.7 8.5 6.0
51.1 7.7 5.3
1 From continuing operations
2 Pre-exceptional and acquisition-related costs
3 See reconciliation in note 11

10 Begbies Traynor Group plc Annual Report and Accounts 2013
Financing continuedThe arrangement costs associated with this refinancing, including legal fees, amount to approximately £0.5 million of which £0.1 million was charged as an exceptional item in the year. The remainder will be recognised over the expected life of the facilities in accordance with International Financial Reporting Standards (IFRSs). The effective financing cost of these new facilities is expected to be around 5.6% (previous facility: 4.6%), reflecting current market rates.
Net borrowings at 30 April 2013 were £17.2 million (2012: £20.1 million), with a reduction in gearing to 30% (2012: 34%). Interest cover2 was a very comfortable 7.8 times (2012: 7.2 times).
At 30 April 2013, the group had utilised £17.1 million (2012: £19.7 million) of its principal bank facilities, giving significant headroom within the total facilities of £35 million. The group continues to use other sources of finance as appropriate. At 30 April 2013, the group had asset-related finance of £0.1 million (2012: £0.4 million).2 Before exceptional costs and amortisation
of intangible assets arising on acquisitions
Cash flowsCash generated by operations (before interest and tax payments) in the year increased to £7.8 million (2012: £3.9 million), principally due to an improved working capital position. This cash flow is stated after £1.7 million (2012: £0.8 million) of
restructuring payments and £1.4 million (2012: £2.5 million) of payments relating to discontinued operations (utilisation of disposal provisions and operating losses in the prior year).
Tax payments in the year were £0.4 million (2012: £0.8 million). Interest payments were £1.5 million (2012: £0.7 million), including £0.4 million of arrangement fees in respect of the new bank facilities.
Cash flows from investing activities were £1.0 million (2012: inflow of £1.9 million). Capital expenditure was £0.4 million (2012: £1.2 million) and deferred payments relating to prior year acquisitions were £0.6 million (2012: deferred payments of £2.8 million and in-year acquisition payments of £0.4 million). Prior year cash flows included £3.8 million of proceeds from the disposal of property, plant and equipment, principally due to the sale and leaseback of the group’s company car fleet, and the disposal of businesses (after transaction costs) generated cash of £2.5 million.
Financing cash flows were £4.1 million (2012: £4.3 million). During the year there was a repayment of asset finance obligations of £0.2 million (2012: net repayment of £3.4 million principally due to the sale and leaseback of the group’s company car fleet) and a repayment on the group’s principal bank facilities of £2.0 million (2012: drawdown of £1.0 million). Dividend payments were £2.0 million (2012: £2.0 million).
Net assetsAt 30 April 2013 net assets were £57.7 million (2012: £58.5 million), equivalent to net assets per share of 64 pence (2012: 65 pence).
Non-current assets decreased to £52.6 million (2012: £53.6 million) due to low levels of capital investment in the year and depreciation costs.
Current assets (excluding assets held for sale) decreased to £45.2 million (2012: £48.1 million), principally due to a reduction in working capital of £3.6 million. Assets held for sale were £nil (2012: £0.2 million).
Gross borrowings reduced to £22.1 million (2012: £24.4 million).
Trade and other payables, which reduced to £9.4 million (2012: £10.4 million), includes trade creditors and accruals of £7.1 million (2012: £7.6 million), deferred consideration liabilities of £0.3 million (2012: £0.9 million) and tax and social security creditors of £2.0 million (2012: £1.9 million). Provisions for restructuring costs and post-disposal obligations total £3.0 million (2012: £3.5 million) of which £2.2 million (2012: £2.0 million) is payable within one year. Current tax liabilities were £0.5 million (2012: £nil). Deferred tax liabilities are £5.1 million (2012: £5.0 million).
Nick TaylorGroup finance director3 July 2013
Financial review continuedBusiness review
Reconciliation of profit before tax
2013 2012£m £m
Adjusted profit before tax from continuing operations 6.7 7.4Less:Amortisation of intangible assets arising on acquisitions (0.4) (0.4)Finance charges arising on discounting of deferred consideration — (0.1)Exceptional costs (3.9) (1.4)
Profit before tax from continuing operations 2.4 5.5

11Begbies Traynor Group plc Annual Report and Accounts 2013
Mark was appointed to the board in 2011 as head of insolvency and restructuring, having joined the group in 2005 following an acquisition. He led our London and South East region prior to his board appointment and played a key role in developing the group’s advisory practice.
Mark also acts as an insolvency practitioner and has been appointed in numerous complex and high-profile assignments. He is currently vice-president of the Insolvency Practitioners Association and will take up presidency in April 2014.
Mark Fry (age 45)Head of insolvency and restructuring
John was appointed to the board in 2007 as a non-executive director. He currently runs his own private equity investment and consultancy business. John was an executive director of Caledonia Investments plc and previously worked for the Hambros Group for over 20 years, where he was an executive director of Hambros Bank and joint managing director of Hambro Countrywide.
John May (age 58)Non-executive director
Ric has been an insolvency practitioner since qualifying as a chartered accountant with Arthur Andersen in 1984. He established Traynor & Co. in 1989 which, following the acquisition of Begbies London in 1997, became Begbies Traynor.
Ric has focussed on the development of the business, including the group’s successful introduction to AIM in 2004, and on practice management. He continues to lead the business and remains a major shareholder.
Ric Traynor (age 53)Executive chairman
Nick was appointed as group finance director in 2010, having joined the group as financial controller in 2007. He is a chartered accountant who qualified with KPMG and previously held senior finance roles in United Utilities PLC and Vertex Data Science Limited, the business process outsourcer.
Nick Taylor (age 42)Group finance director
Graham was appointed to the board in 2004, initially as group finance director and subsequently as corporate development director. With effect from 5 July 2012, Graham took on a new role as a non-executive director. He has held a number of senior finance positions including corporate finance partner at Spicer and Oppenheim (now part of Deloitte) and finance director of Enterprise plc, in addition to developing his own corporate finance boutique in the 1990s.
Graham McInnes (age 61)Non-executive director
Board of directorsCorporate governance
12 Begbies Traynor Group plc Annual Report and Accounts 2013
Corporate governance
Directors’ report
The directors present their Annual Report on the affairs of the group, together with the financial statements and auditor’s report for the year ended 30 April 2013.
Principal activityDuring the year under review, the group’s principal activity involved the provision of professional services to clients based in the UK.
The subsidiary and associated undertakings principally affecting the profits or net assets of the group in the year are listed in note 3 to the company financial statements.
Business reviewThe company is required by section 417 of the Companies Act 2006 to set out in this report a fair review of the business of the group during the financial year ended 30 April 2013 and of the position of the group at the end of the year. This information can be found within the chairman’s statement on pages 6 to 8 and the financial review on pages 9 and 10. The directors use a number of key performance indicators (‘KPIs’) to monitor the progress of the group, which include those set out in the operational review. The board continuously identifies and reviews key business risks. A description of the principal risks and uncertainties facing the group is contained within the directors’ report below.
DividendsThe directors recommend a final dividend of 1.6 pence (2012: 1.6 pence) per ordinary share to be paid on 7 November 2013 to shareholders on the register at 11 October 2013. This, together with the interim dividend of 0.6 pence paid on 9 May 2013 (2012: 0.6 pence), makes a total of 2.2 pence for the year (2012: 2.2 pence).
Capital structureDetails of the authorised and issued share capital, together with details of the movements in the company’s issued share capital during the year, are shown in note 21. The company has three classes of shares: ordinary, A ordinary and deferred. The ordinary shares comprise 97% of the total issued nominal value of all share capital.
Ordinary shares carry no right to fixed income and each share carries the right to one vote at general meetings of the company.
There are no specific restrictions on the size of a holding nor on the transfer of shares, which are governed by the general provisions of the articles of association and prevailing legislation. The directors are not aware of any agreements between holders of the company’s shares that may result in restrictions on the transfer of securities or on voting rights.
No person has any special rights of control over the company’s share capital and all issued ordinary shares are fully paid.
A ordinary shares were issued in connection with the company’s partner growth share plan as detailed in note 21 and have no rights to fixed income, dividends or voting rights at general meetings of the company. The shares are only transferable either pursuant to an offer required to be made
by the city code for the A ordinary shares, or otherwise with prior written consent of the company. Within 30 days of the third anniversary of the date of allotment, A ordinary shares may be converted into fully paid ordinary shares in accordance with the company’s articles of association. All issued A ordinary shares are partly paid.
On 21 December 2012 1,853,000 A ordinary shares issued on 21 December 2009 expired. These were converted into three deferred shares per A ordinary share and the A ordinary shares were cancelled, as detailed in note 21. The deferred shares carry no right to dividends or voting rights. All deferred shares are fully paid.
With regard to the appointment and replacement of directors, the company is governed by its articles of association and prevailing company law. The articles of association themselves may be amended by special resolution of the shareholders. The powers of directors are described in the articles of association, copies of which are available on request, and the corporate governance statement on page 17.
Business risksThe group is reliant on the flow of new assignments. This risk is managed through a consistent effort in marketing, maintaining strong relationships with key work providers and selling activity.
The business is operationally geared with a high proportion of salary and property costs, which cannot be immediately varied. Consequently, the group’s profitability is liable to short-term fluctuations dependent on activity levels. This risk is managed through flexing our resource levels, where possible, to align with current and anticipated levels of activity, together with the control of other discretionary items of expenditure.
The business is dependent upon the professional development, recruitment and retention of high quality professional partners and staff. The group manages the risk of high staff turnover through attention to human resource issues and the monitoring of remuneration levels against the wider market, including long-term incentive arrangements.
In the ordinary course of business, certain aspects of the group’s services are opinion-based and may be subject to challenge. The group deploys a compliance team who seek third-party professional corroboration where appropriate. In addition, the group has an appropriate professional indemnity insurance policy in force.
The insolvency division operates in a regulated market and is subject to regular compliance visits from regulatory bodies. To ensure compliance with relevant legislation in performing regulated insolvency activities, the group has a dedicated compliance team which maintain procedures and policies in line with current legislation.
Financial riskDetails of financial instruments and risk factors are set out in note 20 to the financial statements.
13Begbies Traynor Group plc Annual Report and Accounts 2013
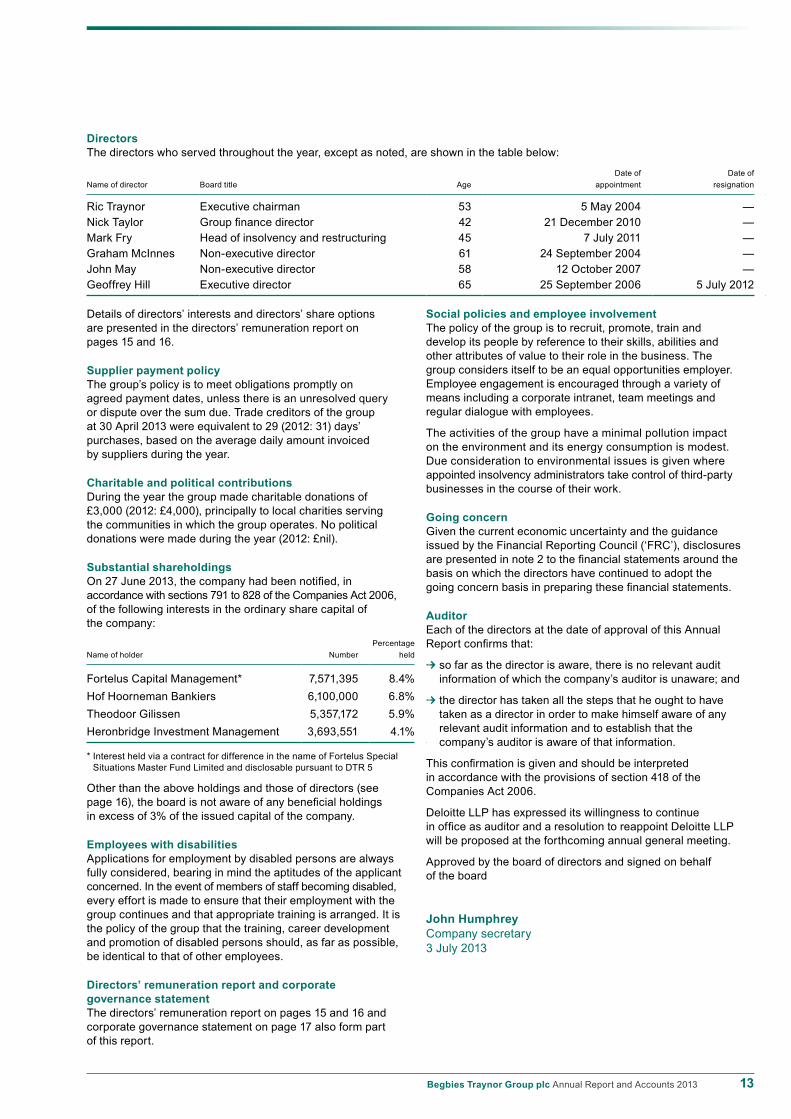
DirectorsThe directors who served throughout the year, except as noted, are shown in the table below:
Date of Date ofName of director Board title Age appointment resignation
Ric Traynor Executive chairman 53 5 May 2004 —Nick Taylor Group finance director 42 21 December 2010 —Mark Fry Head of insolvency and restructuring 45 7 July 2011 —Graham McInnes Non-executive director 61 24 September 2004 —John May Non-executive director 58 12 October 2007 —Geoffrey Hill Executive director 65 25 September 2006 5 July 2012
Details of directors’ interests and directors’ share options are presented in the directors’ remuneration report on pages 15 and 16.
Supplier payment policyThe group’s policy is to meet obligations promptly on agreed payment dates, unless there is an unresolved query or dispute over the sum due. Trade creditors of the group at 30 April 2013 were equivalent to 29 (2012: 31) days’ purchases, based on the average daily amount invoiced by suppliers during the year.
Charitable and political contributionsDuring the year the group made charitable donations of £3,000 (2012: £4,000), principally to local charities serving the communities in which the group operates. No political donations were made during the year (2012: £nil).
Substantial shareholdingsOn 27 June 2013, the company had been notified, in accordance with sections 791 to 828 of the Companies Act 2006, of the following interests in the ordinary share capital of the company:
PercentageName of holder Number held
Fortelus Capital Management* 7,571,395 8.4%Hof Hoorneman Bankiers 6,100,000 6.8%Theodoor Gilissen 5,357,172 5.9%Heronbridge Investment Management 3,693,551 4.1%
* Interest held via a contract for difference in the name of Fortelus Special Situations Master Fund Limited and disclosable pursuant to DTR 5
Other than the above holdings and those of directors (see page 16), the board is not aware of any beneficial holdings in excess of 3% of the issued capital of the company.
Employees with disabilitiesApplications for employment by disabled persons are always fully considered, bearing in mind the aptitudes of the applicant concerned. In the event of members of staff becoming disabled, every effort is made to ensure that their employment with the group continues and that appropriate training is arranged. It is the policy of the group that the training, career development and promotion of disabled persons should, as far as possible, be identical to that of other employees.
Directors’ remuneration report and corporate governance statementThe directors’ remuneration report on pages 15 and 16 and corporate governance statement on page 17 also form part of this report.
Social policies and employee involvementThe policy of the group is to recruit, promote, train and develop its people by reference to their skills, abilities and other attributes of value to their role in the business. The group considers itself to be an equal opportunities employer. Employee engagement is encouraged through a variety of means including a corporate intranet, team meetings and regular dialogue with employees.
The activities of the group have a minimal pollution impact on the environment and its energy consumption is modest. Due consideration to environmental issues is given where appointed insolvency administrators take control of third-party businesses in the course of their work.
Going concernGiven the current economic uncertainty and the guidance issued by the Financial Reporting Council (‘FRC’), disclosures are presented in note 2 to the financial statements around the basis on which the directors have continued to adopt the going concern basis in preparing these financial statements.
AuditorEach of the directors at the date of approval of this Annual Report confirms that:
U so far as the director is aware, there is no relevant audit information of which the company’s auditor is unaware; and
U the director has taken all the steps that he ought to have taken as a director in order to make himself aware of any relevant audit information and to establish that the company’s auditor is aware of that information.
This confirmation is given and should be interpreted in accordance with the provisions of section 418 of the Companies Act 2006.
Deloitte LLP has expressed its willingness to continue in office as auditor and a resolution to reappoint Deloitte LLP will be proposed at the forthcoming annual general meeting.
Approved by the board of directors and signed on behalf of the board
John HumphreyCompany secretary3 July 2013
14 Begbies Traynor Group plc Annual Report and Accounts 2013
Corporate governance
The directors are responsible for preparing the Annual Report and the financial statements in accordance with applicable law and regulations.
Company law requires the directors to prepare financial statements for each financial year. Under that law the directors are required to prepare the group financial statements in accordance with International Financial Reporting Standards (‘IFRSs’) as adopted by the European Union and Article 4 of the IAS Regulation and have elected to prepare the parent company financial statements in accordance with United Kingdom Generally Accepted Accounting Practice (United Kingdom Accounting Standards and applicable law). Under company law the directors must not approve the accounts unless they are satisfied that they give a true and fair view of the state of affairs of the company and of the profit or loss of the company for that period.
In preparing the parent company financial statements, the directors are required to:
U select suitable accounting policies and then apply them consistently;
U make judgements and accounting estimates that are reasonable and prudent;
U state whether applicable UK Accounting Standards have been followed, subject to any material departures disclosed and explained in the financial statements; and
U prepare the financial statements on the going concern basis unless it is inappropriate to presume that the company will continue in business.
In preparing the group financial statements, International Accounting Standard 1 requires that directors:
U properly select and apply accounting policies;
U present information, including accounting policies, in a manner that provides relevant, reliable, comparable and understandable information;
U provide additional disclosures when compliance with the specific requirements in IFRSs are insufficient to enable users to understand the impact of particular transactions, other events and conditions on the entity’s financial position and financial performance; and
U make an assessment of the company’s ability to continue as a going concern.
The directors are responsible for keeping adequate accounting records that are sufficient to show and explain the company’s transactions and disclose with reasonable accuracy at any time the financial position of the company and enable them to ensure that the financial statements comply with the Companies Act 2006. They are also responsible for safeguarding the assets of the company and hence for taking reasonable steps for the prevention and detection of fraud and other irregularities.
The directors are responsible for the maintenance and integrity of the corporate and financial information included on the company’s website. Legislation in the United Kingdom governing the preparation and dissemination of financial statements may differ from legislation in other jurisdictions.
Responsibility statement We confirm that to the best of our knowledge:
U the financial statements, prepared in accordance with the relevant financial reporting framework, give a true and fair view of the assets, liabilities, financial position and profit or loss of the company and the undertakings included in the consolidation taken as a whole; and
U the management report, which is incorporated into the directors’ report, includes a fair review of the development and performance of the business and the position of the company and the undertakings included in the consolidation taken as a whole, together with a description of the principal risks and uncertainties that they face.
By order of the board
Ric Traynor Nick TaylorExecutive chairman Group finance director3 July 2013
Statement of directors’ responsibilities
15Begbies Traynor Group plc Annual Report and Accounts 2013
The company is not obliged to prepare a directors’ remuneration report and the information below does not constitute a ‘directors’ remuneration report’ within the meaning of the Companies Act 2006.
The remuneration committeeThe remuneration committee comprises John May, a non-executive director, and the executive chairman. The committee determines the profit shares, remuneration, bonuses and consultancy charges payable to the executive directors. The committee meets annually to allocate a performance-related profit sharing pool between the executive directors and to settle their base remuneration for the ensuing year. The profit pool is computed by reference to annual growth in operating profits and earnings per share.
Remuneration policyThe objectives of the remuneration policy are to ensure that the overall remuneration of executive directors is aligned with the performance of the group and preserves an appropriate balance of income and shareholder value.
Directors’ remunerationThe normal remuneration arrangements for executive directors consist of directors’ fees, basic salary, consultancy charges or profit share and annual performance-related bonuses. In addition, they receive income protection insurance, private medical insurance, retirement benefits and death in service benefits.
Directors’ fees are fixed by the remuneration committee. The profit shares and consultancy charges disclosed are the amounts charged against operating profit in the consolidated income statement for the year ended 30 April 2013.
Directors’ remuneration report
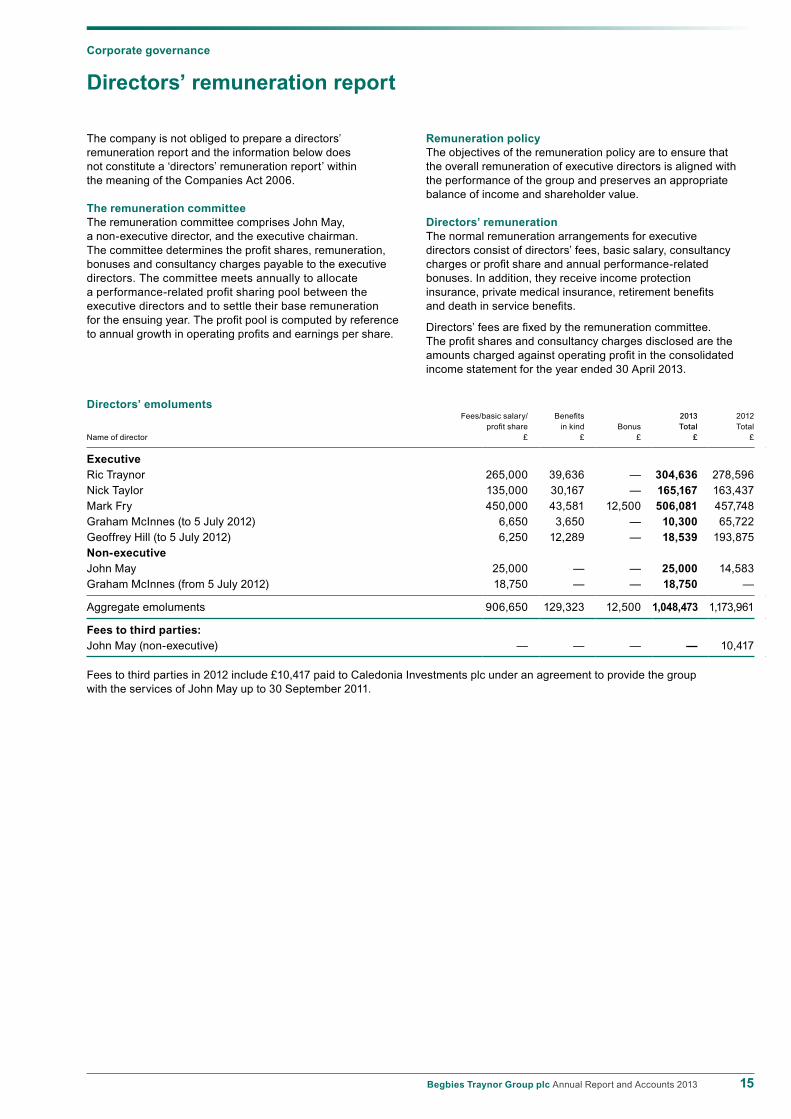
Directors’ emoluments Fees/basic salary/ Benefits 2013 2012
profit share in kind Bonus Total TotalName of director £ £ £ £ £
ExecutiveRic Traynor 265,000 39,636 — 304,636 278,596Nick Taylor 135,000 30,167 — 165,167 163,437Mark Fry 450,000 43,581 12,500 506,081 457,748Graham McInnes (to 5 July 2012) 6,650 3,650 — 10,300 65,722Geoffrey Hill (to 5 July 2012) 6,250 12,289 — 18,539 193,875Non-executiveJohn May 25,000 — — 25,000 14,583Graham McInnes (from 5 July 2012) 18,750 — — 18,750 —
Aggregate emoluments 906,650 129,323 12,500 1,048,473 1,173,961
Fees to third parties:John May (non-executive) — — — — 10,417
Fees to third parties in 2012 include £10,417 paid to Caledonia Investments plc under an agreement to provide the group with the services of John May up to 30 September 2011.
Corporate governance

16 Begbies Traynor Group plc Annual Report and Accounts 2013
Corporate governance
Directors’ share options and growth share planAggregate emoluments disclosed above do not include any amounts for the value of options to acquire ordinary shares in the company granted to or held by the directors. Details of share options and growth share plan awards for directors who served during the year are detailed below:
The market price of the company’s shares at the end of the financial year was 34 pence and the range of market prices during the year was 25 pence to 38 pence.
Details of share options granted by the company at 30 April 2013 are given in note 22. None of the terms and conditions of the share options were varied in the year. The performance criteria for all of the directors’ options were consistent with the remuneration policy.
Directors’ remuneration report continued
Directors’ interestsThe directors who held office at 30 April 2013 had the following interests in the shares of the group:
30 April 2013 1 May 2012 or subsequent date of appointment
Name of director Description of shares Beneficial % Beneficial %
Ric Traynor Ordinary shares 26,561,697 29.5 26,561,697 29.5Nick Taylor Ordinary shares 5,000 0.006 5,000 0.006Mark Fry Ordinary shares 143,890 0.16 143,890 0.16Graham McInnes Ordinary shares 855,704 0.95 855,704 0.95John May Ordinary shares 202,500 0.23 202,500 0.23
No changes took place in the interests of directors between 30 April 2013 and 27 June 2013.
Earliest Exercise Number at Forfeited/ Number atDate of exercise Expiry price 1 May lapsed 30 April
Name of director Scheme grant date date (pence) 2012 in year 2013
Mark Fry Growth shares 21 December 2009 21 December 2012 21 December 2012 120 365,854 (365,854) —Mark Fry Growth shares 21 December 2010 21 December 2013 21 December 2013 100 272,727 — 272,727Mark Fry Growth shares 1 July 2011 1 July 2014 1 July 2014 68 1,923,077 — 1,923,077Nick Taylor Share options 15 July 2010 15 July 2013 15 July 2017 61.8 50,000 — 50,000
17Begbies Traynor Group plc Annual Report and Accounts 2013
The board is committed to high standards of corporate governance and, although as an AIM listed company Begbies Traynor Group plc is not bound by the UK Corporate Governance code that was issued in 2010 by the Financial Reporting Council (‘the Code’), the directors adopt these rules in the manner they believe appropriate to the company’s status. Detailed below are the key components of the group’s corporate governance policies and procedures.
The boardThe full board meets formally and informally throughout the year and the executive directors attend regular operational board meetings. The agendas for these meetings formalise the matters reserved for decision by the board of the company. The board directs and controls the group and risk management issues. The board is responsible for strategy, performance and stewardship of the group’s resources.
The board consists of the executive chairman, group finance director, one executive director and two non-executive directors. All directors have access to the company secretary and all group records. Each director is authorised to take external advice in support of his duties at the expense of the company.
Committees of the boardThe board has two committees, each of which has written terms of reference. The minutes of the committees are circulated to and reviewed by the board.
The audit committeeThe audit committee is chaired by John May, a non-executive director, and meets periodically in accordance with its terms of reference. The executive chairman, group finance director and a representative of the external auditor will normally attend meetings. The committee meets at least twice a year to discuss governance, financial reporting and internal control and risk management.
The remuneration committeeThe remuneration committee, which is chaired by John May, a non-executive director, and attended by the executive chairman, is responsible for all elements of the remuneration of the executive directors. The committee performs its functions in accordance with its terms of reference. Additional information is included in the directors’ remuneration report on pages 15 and 16.
Investor communicationsMeetings with institutional shareholders and independent analysts take place throughout the year and all shareholders are free to contact any member of the board at any time. Shareholders have a formal opportunity to question the board at the AGM of the company, at the conclusion of which all board members are available for informal discussion.
Internal control and risk managementThe systems of internal control and risk management are the responsibility of the board, which sets and reviews appropriate policies. Managers are delegated the tasks of implementation and maintenance of systems in accordance with those policies and the identification, evaluation, management and reporting of risk and control issues.
Budgets are produced annually and key performance targets within them are set by the board.
Performance against those budgets is regularly reviewed and variances are investigated and acted upon by members of the board and both head office and regional managers. Reforecasting is undertaken when variances are material and, if adverse, cannot be eliminated by such action.
The above systems and procedures can only provide reasonable assurance; they cannot eliminate the potential of material misstatement or loss, nor the risk of the group falling short of its strategic objectives and targets.
Corporate governance
Corporate governance statement
18 Begbies Traynor Group plc Annual Report and Accounts 2013
Financial statements
Independent auditor’s reportto the members of Begbies Traynor Group plcWe have audited the group financial statements of Begbies Traynor Group plc for the year ended 30 April 2013, which comprise the consolidated income statement, the consolidated statement of comprehensive income, the consolidated statement of changes in equity, the consolidated balance sheet, the consolidated cash flow statement and the related notes 1 to 28. The financial reporting framework that has been applied in their preparation is applicable law and International Financial Reporting Standards (‘IFRSs’) as adopted by the European Union.
This report is made solely to the company’s members, as a body, in accordance with chapter 3 of part 16 of the Companies Act 2006. Our audit work has been undertaken so that we might state to the company’s members those matters we are required to state to them in an auditor’s report and for no other purpose. To the fullest extent permitted by law, we do not accept or assume responsibility to anyone other than the company and the company’s members as a body for our audit work, for this report, or for the opinions we have formed.
Respective responsibilities of directors and auditorAs explained more fully in the statement of directors’ responsibilities, the directors are responsible for the preparation of the group financial statements and for being satisfied that they give a true and fair view. Our responsibility is to audit and express an opinion on the group financial statements in accordance with applicable law and International Standards on Auditing (UK and Ireland). Those standards require us to comply with the Auditing Practices Board’s Ethical Standards for Auditors.
Scope of the audit of the financial statementsAn audit involves obtaining evidence about the amounts and disclosures in the financial statements sufficient to give reasonable assurance that the financial statements are free from material misstatement, whether caused by fraud or error. This includes an assessment of: whether the accounting policies are appropriate to the group’s circumstances and have been consistently applied and adequately disclosed; the reasonableness of significant accounting estimates made by the directors; and the overall presentation of the financial statements. In addition, we read all the financial and non-financial information in the Annual Report to identify material inconsistencies with the audited financial statements. If we become aware of any apparent material misstatements or inconsistencies we consider the implications for our report.
Opinion on financial statementsIn our opinion the group financial statements:
U give a true and fair view of the state of the group’s affairs as at 30 April 2013 and of its profit for the year then ended;
U have been properly prepared in accordance with IFRSs as adopted by the European Union; and
U have been prepared in accordance with the requirements of the Companies Act 2006.
Opinion on other matter prescribed by the Companies Act 2006In our opinion the information given in the directors’ report for the financial year for which the financial statements are prepared is consistent with the group financial statements.
Matters on which we are required to report by exceptionWe have nothing to report in respect of the following matters where the Companies Act 2006 requires us to report to you if, in our opinion:
U certain disclosures of directors’ remuneration specified by law are not made; or
U we have not received all the information and explanations we require for our audit.
Other matterWe have reported separately on the parent company financial statements of Begbies Traynor Group plc for the year ended 30 April 2013.
William Smith MA ACA (Senior Statutory Auditor)for and on behalf of Deloitte LLPChartered Accountants and Statutory AuditorManchester, United Kingdom3 July 2013
19Begbies Traynor Group plc Annual Report and Accounts 2013
Financial statements
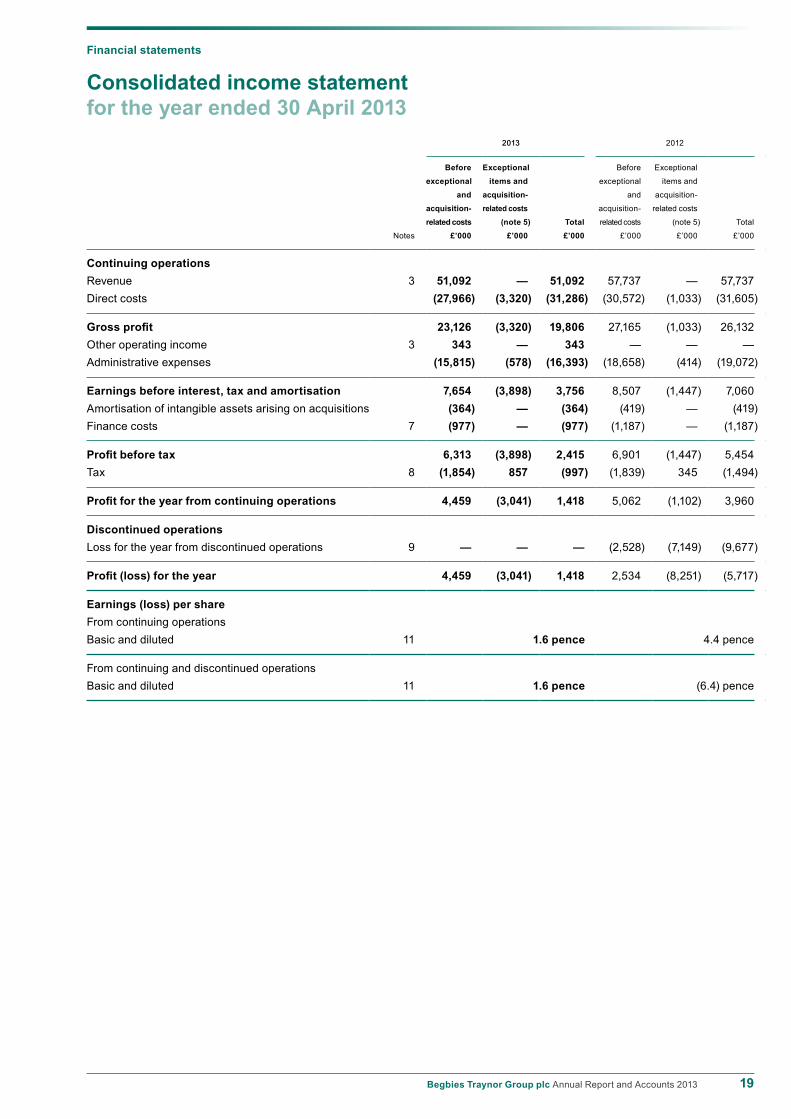
Consolidated income statementfor the year ended 30 April 2013
2013 2012
Before Exceptional Before Exceptional
exceptional items and exceptional items and
and acquisition- and acquisition-
acquisition- related costs acquisition- related costs
related costs (note 5) Total related costs (note 5) Total
Notes £’000 £’000 £’000 £’000 £’000 £’000
Continuing operationsRevenue 3 51,092 — 51,092 57,737 — 57,737Direct costs (27,966) (3,320) (31,286) (30,572) (1,033) (31,605)
Gross profit 23,126 (3,320) 19,806 27,165 (1,033) 26,132Other operating income 3 343 — 343 — — —Administrative expenses (15,815) (578) (16,393) (18,658) (414) (19,072)
Earnings before interest, tax and amortisation 7,654 (3,898) 3,756 8,507 (1,447) 7,060Amortisation of intangible assets arising on acquisitions (364) — (364) (419) — (419)Finance costs 7 (977) — (977) (1,187) — (1,187)
Profit before tax 6,313 (3,898) 2,415 6,901 (1,447) 5,454Tax 8 (1,854) 857 (997) (1,839) 345 (1,494)
Profit for the year from continuing operations 4,459 (3,041) 1,418 5,062 (1,102) 3,960
Discontinued operationsLoss for the year from discontinued operations 9 — — — (2,528) (7,149) (9,677)
Profit (loss) for the year 4,459 (3,041) 1,418 2,534 (8,251) (5,717)
Earnings (loss) per shareFrom continuing operationsBasic and diluted 11 1.6 pence 4.4 pence
From continuing and discontinued operationsBasic and diluted 11 1.6 pence (6.4) pence

20 Begbies Traynor Group plc Annual Report and Accounts 2013
Financial statements
Consolidated statement of comprehensive incomefor the year ended 30 April 2013
2013 2012
£’000 £’000
Profit (loss) for the year 1,418 (5,717)Other comprehensive incomeExchange differences on translation of foreign operations — (5)
Total comprehensive income for the year 1,418 (5,722)
21Begbies Traynor Group plc Annual Report and Accounts 2013
Financial statements
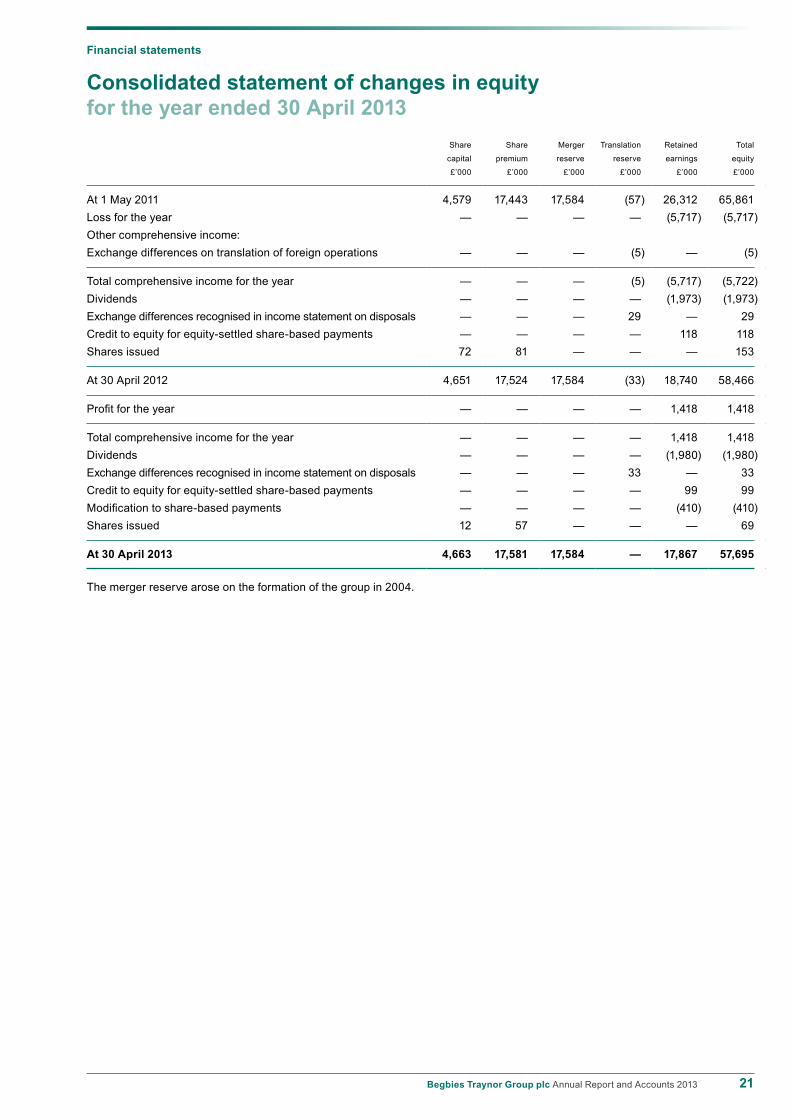
Consolidated statement of changes in equityfor the year ended 30 April 2013
Share Share Merger Translation Retained Total
capital premium reserve reserve earnings equity
£’000 £’000 £’000 £’000 £’000 £’000
At 1 May 2011 4,579 17,443 17,584 (57) 26,312 65,861Loss for the year — — — — (5,717) (5,717)Other comprehensive income:Exchange differences on translation of foreign operations — — — (5) — (5)
Total comprehensive income for the year — — — (5) (5,717) (5,722)Dividends — — — — (1,973) (1,973)Exchange differences recognised in income statement on disposals — — — 29 — 29Credit to equity for equity-settled share-based payments — — — — 118 118Shares issued 72 81 — — — 153
At 30 April 2012 4,651 17,524 17,584 (33) 18,740 58,466
Profit for the year — — — — 1,418 1,418
Total comprehensive income for the year — — — — 1,418 1,418Dividends — — — — (1,980) (1,980)Exchange differences recognised in income statement on disposals — — — 33 — 33Credit to equity for equity-settled share-based payments — — — — 99 99Modification to share-based payments — — — — (410) (410)Shares issued 12 57 — — — 69
At 30 April 2013 4,663 17,581 17,584 — 17,867 57,695
The merger reserve arose on the formation of the group in 2004.

22 Begbies Traynor Group plc Annual Report and Accounts 2013
Financial statements
Consolidated balance sheetat 30 April 2013
2013 2012
Notes £’000 £’000
Non-current assetsIntangible assets 12 50,436 50,942Property, plant and equipment 13 2,165 2,677
52,601 53,619
Current assetsTrade and other receivables 14 40,233 43,755Current tax receivable — 12Cash and cash equivalents 4,962 4,302Assets classified as held for sale 9 — 198
45,195 48,267
Total assets 97,796 101,886
Current liabilitiesTrade and other payables 15 (9,413) (10,271)Current tax liabilities (496) —Borrowings 16 (109) (212)Provisions 17 (2,157) (1,986)Liabilities directly associated with assets classified as held for sale 9 — (145)
(12,175) (12,614)
Net current assets 33,020 35,653
Non-current liabilitiesTrade and other payables 15 — (94)Borrowings 16 (22,018) (24,145)Provisions 17 (830) (1,542)Deferred tax 19 (5,078) (5,025)
(27,926) (30,806)
Total liabilities (40,101) (43,420)
Net assets 57,695 58,466
EquityShare capital 21 4,663 4,651Share premium 17,581 17,524Merger reserve 17,584 17,584Translation reserve — (33)Retained earnings 17,867 18,740
Equity attributable to owners of the company 57,695 58,466
The financial statements of Begbies Traynor Group plc, registered number 5120043, were approved by the board of directors and authorised for issue on 3 July 2013. They were signed on its behalf by:
Ric Traynor Nick TaylorExecutive chairman Group finance director
23Begbies Traynor Group plc Annual Report and Accounts 2013
Financial statements
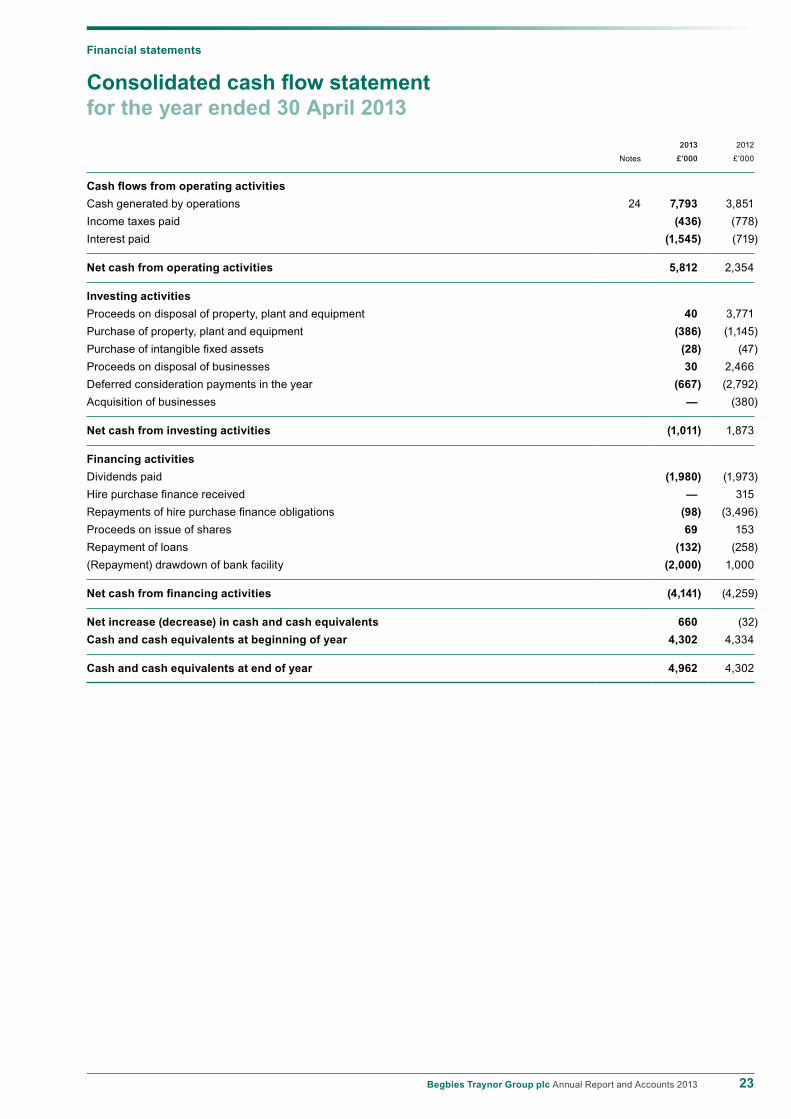
Consolidated cash flow statementfor the year ended 30 April 2013
2013 2012
Notes £’000 £’000
Cash flows from operating activitiesCash generated by operations 24 7,793 3,851Income taxes paid (436) (778)Interest paid (1,545) (719)
Net cash from operating activities 5,812 2,354
Investing activitiesProceeds on disposal of property, plant and equipment 40 3,771Purchase of property, plant and equipment (386) (1,145)Purchase of intangible fixed assets (28) (47)Proceeds on disposal of businesses 30 2,466Deferred consideration payments in the year (667) (2,792)Acquisition of businesses — (380)
Net cash from investing activities (1,011) 1,873
Financing activitiesDividends paid (1,980) (1,973)Hire purchase finance received — 315Repayments of hire purchase finance obligations (98) (3,496)Proceeds on issue of shares 69 153Repayment of loans (132) (258)(Repayment) drawdown of bank facility (2,000) 1,000
Net cash from financing activities (4,141) (4,259)
Net increase (decrease) in cash and cash equivalents 660 (32)Cash and cash equivalents at beginning of year 4,302 4,334
Cash and cash equivalents at end of year 4,962 4,302
24 Begbies Traynor Group plc Annual Report and Accounts 2013
Financial statements
Notes to the consolidated financial statementsfor the year ended 30 April 20131. General informationBegbies Traynor Group plc is a company incorporated in the United Kingdom under the Companies Act 2006. The address of the registered office is 340 Deansgate, Manchester M3 4LY. The nature of the group’s operations and its principal activities are set out in the directors’ report on page 12.
These financial statements are presented in pounds sterling because that is the currency of the primary economic environment in which the group operates.
2. Accounting policiesThe principal accounting policies adopted in the preparation of these financial statements are set out below.
(a) Basis of accountingThe financial statements have been prepared in accordance with applicable UK law and International Financial Reporting Standards (‘IFRSs’) as adopted by the European Union (‘EU’), including International Accounting Standards (‘IAS’) and Interpretations issued by the International Financial Reporting Interpretations Committee (‘IFRIC’).
The financial statements have been prepared on the historical cost basis and all accounting policies have been applied consistently throughout the current and preceding year.
Going concernThe group’s business activities, together with factors likely to affect its future development, performance and position, are set out in the chairman’s statement. The financial position of the group, its cash flows, liquidity position and borrowing facilities are described in the financial review.
Furthermore, notes 16 and 20 to the financial statements include full details of the group’s borrowings in addition to the group’s objectives and policies for managing its capital, its financial risk management objectives and its exposures to credit, interest rate and liquidity risk.
The group has principal banking facilities of £35 million, of which £17.1 million was utilised (net of cash balances) at 30 April 2013.
In carrying out their duties in respect of going concern, the directors have completed a review of the group’s current financial position and cash flow forecasts for a period exceeding 12 months from the date of signing these financial statements. This review included sensitivity analysis to determine the potential impact on the group of reasonably possible downside scenarios. Under all modelled scenarios, the group’s banking facilities were sufficient and all associated covenant measures were forecast to be met.
After making enquiries, the directors have a reasonable expectation that the company and the group have adequate resources to continue in operational existence for the foreseeable future. Accordingly, they continue to adopt the going concern basis in preparing the Annual Report and Accounts.
Earnings before interest, tax and amortisation (‘EBITA’)EBITA includes the results from operating activities of the group, including software amortisation costs, but stated before finance costs, taxation and amortisation of intangible assets arising on acquisitions.
Exceptional items and acquisition-related costsThe group presents certain items separately as ‘exceptional’. These are items which in management’s judgement should be disclosed separately by virtue of their size and or nature.
(b) Basis of consolidationThe consolidated financial statements incorporate the financial statements of Begbies Traynor Group plc and entities controlled by Begbies Traynor Group plc (its subsidiaries which include limited liability partnerships). Control is achieved where Begbies Traynor Group plc (‘the company’) has the power to govern the financial and operating policies of an investee entity so as to obtain benefits from its activities. The results of subsidiaries are included in the consolidated income statement.
The results of entities acquired or disposed of during the year are included in the consolidated income statement from the effective date of acquisition or up to the effective date of disposal, as appropriate.
Where necessary, the accounts of the subsidiaries are adjusted to conform to the group’s accounting policies. All intra-group transactions, balances, income and expenses are eliminated on consolidation.
(c) Changes in accounting policiesThe accounting policies adopted are consistent with those of the previous financial year.
25Begbies Traynor Group plc Annual Report and Accounts 2013
2. Accounting policies continued(d) Business combinationsThe acquisition of subsidiaries and businesses is accounted for using the purchase method. The consideration for each acquisition is measured at the aggregate of the fair values, at the date of exchange, of assets given, liabilities incurred or assumed and equity instruments issued by the group in exchange for control of the acquiree. Acquisition-related costs are recognised in the income statement as incurred.
Identifiable assets acquired and liabilities and contingent liabilities assumed in a business combination are measured initially at their fair values at the acquisition date. Where the fair value of the assets and liabilities at acquisition cannot be determined reliably in the initial accounting, these values are considered to be provisional for a period of 12 months from the date of acquisition. If additional information relating to the condition of these assets and liabilities at the acquisition date is obtained within this period, then the provisional values are adjusted retrospectively. This includes the restatement of comparative information for prior periods.
Goodwill arising on acquisition is recognised as an asset and initially measured at cost, being the excess of the cost of the business combination over the group’s interest in the net fair value of the identifiable assets, liabilities and contingent liabilities recognised.
If, after reassessment, the group’s interest in the net fair value of the acquiree’s identifiable assets, liabilities and contingent liabilities exceeds the cost of the business combination, the excess is recognised immediately in profit or loss. Adjustments to contingent consideration for acquisitions made before 1 May 2010 (from which date IFRS 3 (revised) has been adopted) are recorded against goodwill. Adjustments to contingent consideration for acquisitions made after 1 May 2010 are recorded in the income statement.
(e) Intangible assetsGoodwillGoodwill arising on consolidation is recognised as an asset.
Following initial recognition, goodwill is subject to impairment reviews, at least annually, and measured at cost less accumulated impairment losses. Any impairment is recognised immediately in the income statement and is not subsequently reversed.
On disposal of a subsidiary the attributable amount of goodwill is included in the determination of the gain or loss on disposal.
Goodwill arising on acquisitions before the date of the group’s transition to IFRSs has been retained at the previous UK GAAP amounts, subject to being tested for impairment at that date and at least annually thereafter.
Other intangible assetsOther intangible assets are measured initially at cost and are amortised on a straight-line basis over their estimated useful lives. The carrying amount is reduced by any provision for impairment where necessary.
On a business combination, as well as recording separable intangible assets already recognised in the balance sheet of the acquired entity at their fair value, identifiable intangible assets that are separable or arise from contractual or other legal rights are also included in the acquisition balance sheet at fair value.
Amortisation is charged so as to write off the cost or valuation of assets over their estimated useful lives, on the following basis:
Software on strategic systems 10% of cost
Intangible assets arising on acquisitions 33% of fair value at acquisition
Assets in the course of construction are not depreciated.
(f) Property, plant and equipmentAll assets are stated at historical cost less accumulated depreciation and accumulated impairment losses.
Depreciation is charged so as to write off the cost or valuation of assets over their estimated useful lives, on the following basis:
Computers 20%–33% of cost
Motor vehicles 25% on a reducing balance basis
Office equipment 15% of cost
Leasehold improvements evenly over period of lease
The gain or loss arising on the disposal of an asset is determined as the difference between the sales proceeds and the carrying amount of the asset and is recognised within profit or loss for the period.
Assets held under finance leases are depreciated over their expected useful lives on the same basis as owned assets or, where shorter, over the relevant lease term.

26 Begbies Traynor Group plc Annual Report and Accounts 2013
Notes to the consolidated financial statements continuedfor the year ended 30 April 2013
Financial statements
2. Accounting policies continued(g) Impairment of tangible and intangible assets excluding goodwillAt each balance sheet date, the group reviews the carrying amounts of its tangible and intangible assets to determine whether there is any indication that those assets have suffered an impairment loss. If any such indication exists, the recoverable amount of the asset is estimated in order to determine the extent of any impairment loss. Where the asset does not generate cash flows that are independent from other assets, the group estimates the recoverable amount of the cash-generating unit to which the asset belongs.
Recoverable amount is the higher of fair value less costs to sell and value in use. In assessing value in use, the estimated future cash flows are discounted to their present value using a pre-tax discount rate that reflects current market assessments of the time value and the risks specific to the asset for which the estimates of future cash flows have not been adjusted.
If the recoverable amount of an asset (or cash-generating unit) is estimated to be less than its carrying amount, the carrying amount of the asset (or cash-generating unit) is reduced to its recoverable amount. An impairment loss is recognised as an expense immediately.
Where an impairment loss subsequently reverses, the carrying amount of the asset (or cash-generating unit) is increased to the revised estimate of its recoverable amount, but so that the increased carrying amount does not exceed the carrying amount that would have been determined had no impairment loss been recognised for the asset (or cash-generating unit) in prior years. A reversal of an impairment loss is recognised as income immediately.
(h) Assets and liabilities classified as held for saleAssets and liabilities are classified as held for sale where their carrying amount is to be recovered principally through a sale transaction rather than continuing use and a sale is considered highly probable. Management must be committed to the sale which is expected to complete within one year. They are stated at the lower of carrying amount and fair value less costs to sell.
(i) Financial instrumentsFinancial assets and financial liabilities are recognised in the group’s balance sheet when the group becomes a party to the contractual provisions of the instrument.
Cash and cash equivalentsCash and cash equivalents comprise cash in hand and demand deposits and other short-term highly liquid investments that are readily convertible to a known amount of cash and are subject to an insignificant risk of changes in value.
Trade receivablesTrade receivables are stated at amortised cost less allowances for estimated irrecoverable amounts.
Trade payablesTrade payables are stated at their amortised cost.
Financial liabilities and equity instrumentsFinancial liabilities and equity instruments are classified according to the substance of the contractual arrangements entered into. An equity instrument is any contract that evidences a residual interest in the assets of the group after deducting all of its liabilities.
Equity instrumentsEquity instruments issued by the group are recorded at the proceeds received, net of direct issue costs.
Bank borrowingsInterest bearing bank loans and overdrafts are recorded at the proceeds received, net of direct issue costs. Finance charges, including premiums payable on settlement or redemption and direct issue costs, are accounted for on an amortised cost basis to the income statement using the effective interest method and are added to the carrying amount of the instrument to the extent that they are not settled in the period in which they arise.
(j) ProvisionsProvisions are recognised when the group has a present legal or constructive obligation as a result of a past event, it is probable that the group will be required to settle the obligation and the amount can be reliably estimated.
27Begbies Traynor Group plc Annual Report and Accounts 2013
2. Accounting policies continued(k) LeasesLeases are classified according to the substance of the transaction. A lease that transfers substantially all the risks and rewards of ownership to the lessee is classified as a finance lease. All other leases are classified as operating leases.
Finance leasesFinance leases are capitalised in the consolidated balance sheet at their fair value or, if lower, at the present value of the minimum lease payments, each determined at the inception of the lease. The corresponding liability is shown as a finance lease obligation to the lessor. Leasing repayments comprise both a capital and a finance element. The finance element is written off to the income statement so as to produce an approximately constant periodic rate of charge on the outstanding obligation. Such assets are depreciated over the shorter of their estimated useful lives or the period of the lease.
Operating leasesOperating lease rentals are charged to the income statement on a straight-line basis over the period of the lease even where payments are not made on such a basis. Lease incentives are spread over the period of the lease.
(l) Revenue recognition Revenue represents amounts recoverable from clients for professional services provided during the year, excluding value added tax. The group recognises revenue when the amount can be reliably measured and it is probable economic benefits will flow.
Services provided to clients, which at the balance sheet date have not been billed to clients, are recognised as unbilled revenue.
Revenue recognised in this manner is based on an assessment of the fair value of the services provided at the balance sheet date reflecting the stage of completion (determined by costs incurred to date as a percentage of the total anticipated costs) of each assignment. These estimates and judgements may change over time as the case completes and this will be recognised in the income statement in the period in which the revision becomes known. These judgements are formed over a large portfolio of cases and are therefore unlikely to be individually material.
Unbilled revenue on individual client assignments is included as unbilled income within trade and other receivables.
For contingent fee engagements, which comprise a small element of the group’s overall activities, revenue is only recognised (over and above any agreed minimum fee) when it is virtually certain at the balance sheet date of a successful outcome to the engagement.
(m) Borrowing costsBorrowing costs directly attributable to the acquisition, construction or production of qualifying assets, which are assets that necessarily take a substantial period of time to get ready for their intended use or sale, are added to the cost of those assets, until such time as the assets are substantially ready for their intended use or sale. Other borrowing costs are recognised in profit or loss in the period in which they are incurred.
(n) Pensions and retirement benefitsThe group operates a defined contribution scheme in the UK for certain employees. The costs of the pension funding borne by the group are charged to the income statement as an expense as they fall due.
(o) Share-based paymentsEquity-settled share-based payments to employees and others providing similar services are measured at the fair value of the equity instruments at the grant date. The fair value excludes the effect of non market-based vesting conditions. Details regarding the determination of the fair value of equity-settled share-based transactions are set out in note 22.
The fair value determined at the grant date of the equity-settled share-based payments is expensed on a straight-line basis over the vesting period, based on the group’s estimate of equity instruments that will eventually vest. At each balance sheet date, the group revises its estimate of the number of equity instruments expected to vest as a result of the effect of non market-based vesting conditions. The impact of the revision of the original estimates, if any, is recognised in profit or loss such that the cumulative expense reflects the revised estimate, with a corresponding adjustment to equity reserves.
28 Begbies Traynor Group plc Annual Report and Accounts 2013
Notes to the consolidated financial statements continuedfor the year ended 30 April 2013
Financial statements
2. Accounting policies continued(p) TaxationThe tax expense represents the sum of current tax and deferred tax.
Current taxation Current tax is based on taxable profit for the period. Taxable profit differs from net profit as reported in the income statement because it excludes items of income or expense that are taxable or deductible in other years and it further excludes items that are never taxable or deductible. The group’s liability for current tax is calculated using tax rates that have been enacted or substantively enacted by the balance sheet date.
Deferred taxation Deferred tax is the tax expected to be payable or recoverable on differences between the carrying amounts of assets and liabilities in the financial statements and the corresponding tax bases used in the computation of taxable profit and is accounted for using the balance sheet liability method. Deferred tax liabilities are generally recognised for all taxable temporary differences and deferred tax assets are recognised to the extent that it is probable that taxable profits will be available against which deductible temporary differences can be utilised. Such assets and liabilities are not recognised if the temporary difference arises from goodwill or from the initial recognition (other than in a business combination) of other assets and liabilities in a transaction that affects neither the tax profit nor the accounting profit.
The carrying amount of deferred tax assets is reviewed at each balance sheet date and reduced to the extent that it is no longer probable that sufficient taxable profits will be available to allow all or part of the asset to be recovered.
Deferred tax is calculated at the tax rates that are expected to apply in the period when the liability is settled or the asset is realised. Deferred tax is charged or credited in the income statement except when it relates to items charged or credited to equity, in which case the deferred tax is also dealt with in equity.
Deferred tax assets and liabilities are offset when there is a legally enforceable right to set off current tax assets against current tax liabilities and when they relate to income taxes by the same taxation authority and the group intends to settle its current tax assets and liabilities on a net basis.
(q) Foreign currency Transactions and balancesTransactions in foreign currencies are recorded at the exchange rates ruling on the dates of the transactions. At each balance sheet date, monetary assets and liabilities denominated in foreign currencies are translated into sterling at the relevant rates of exchange ruling on the balance sheet date. Gains and losses arising on retranslation are included in net profit or loss for the period.
Group companiesOn consolidation, the balance sheets of overseas subsidiaries are translated into sterling at exchange rates applicable at the balance sheet date. The income statements are translated into sterling using the average rate in the period. Exchange differences resulting from the translation of such balance sheets at rates ruling at the beginning and end of the period, together with the differences between income statements translated at average rates and rates ruling at the period end, are dealt with as movements on the group’s translation reserve, a separate component of equity. On disposal of a foreign operation any cumulative translation differences are recognised as income or expense in the period in which the operation is disposed of.
(r) Critical accounting judgements and key sources of estimation uncertaintyIn the process of applying the group’s accounting policies, the group is required to make certain estimates, judgements and assumptions that it believes are reasonable based upon the information available. These estimates and assumptions affect the reported amounts of assets and liabilities at the date of the financial statements and the reported amounts of revenue and expenses during the periods presented.
On an ongoing basis, the group evaluates its estimates using historical experience, consultation with experts and other methods considered reasonable in the particular circumstances. Actual results may differ from the estimates, the effect of which is recognised in the period in which the facts that give rise to the revision become known.
The group believes that the estimates and judgements in relation to goodwill to have the most significant impact on the annual results under IFRSs as set out below.

29Begbies Traynor Group plc Annual Report and Accounts 2013
2. Accounting policies continued(r) Critical accounting judgements and key sources of estimation uncertainty continuedGoodwillThe group records all assets and liabilities acquired in purchase acquisitions, including goodwill, at fair value. Goodwill is not amortised but is subject, at a minimum, to annual tests for impairment. The initial goodwill recorded and subsequent impairment review requires management to make subjective judgements concerning the value in use of cash-generating units. This requires an estimate of the future cash flows expected to arise from the cash-generating unit and a suitable discount rate to calculate present value. Details of the assumptions made are provided in note 12.
(s) Recently issued accounting pronouncementsInternational Financial Reporting StandardsAt the date of authorisation of these financial statements, the following relevant standards and interpretations were in issue but not yet effective and have not been applied in these financial statements:
International Accounting Standards Effective date (IAS/IFRSs) (year end commencing on or after)
IFRS 9 ‘Financial Instruments’ 1 January 2015Amendments to IFRS 7 and IAS 32 ‘Offsetting Financial Assets and Financial Liabilities’ 1 January 2014IFRS 10 ‘Consolidated Financial Statements’ 1 January 2014ED/2012/1 ‘Revenue from Contracts with Customers’ 1 January 2015
Beyond the information above, it is not practical to provide a reasonable estimate of the effect of these standards until a detailed review has been completed.
3. RevenueAn analysis of the group’s revenue is as follows:
2013 2012£’000 £’000
Continuing operationsRendering of professional services 51,092 57,737Other income 343 —
51,435 57,737Discontinued operationsRendering of professional services (note 9) — 3,824
51,435 61,561
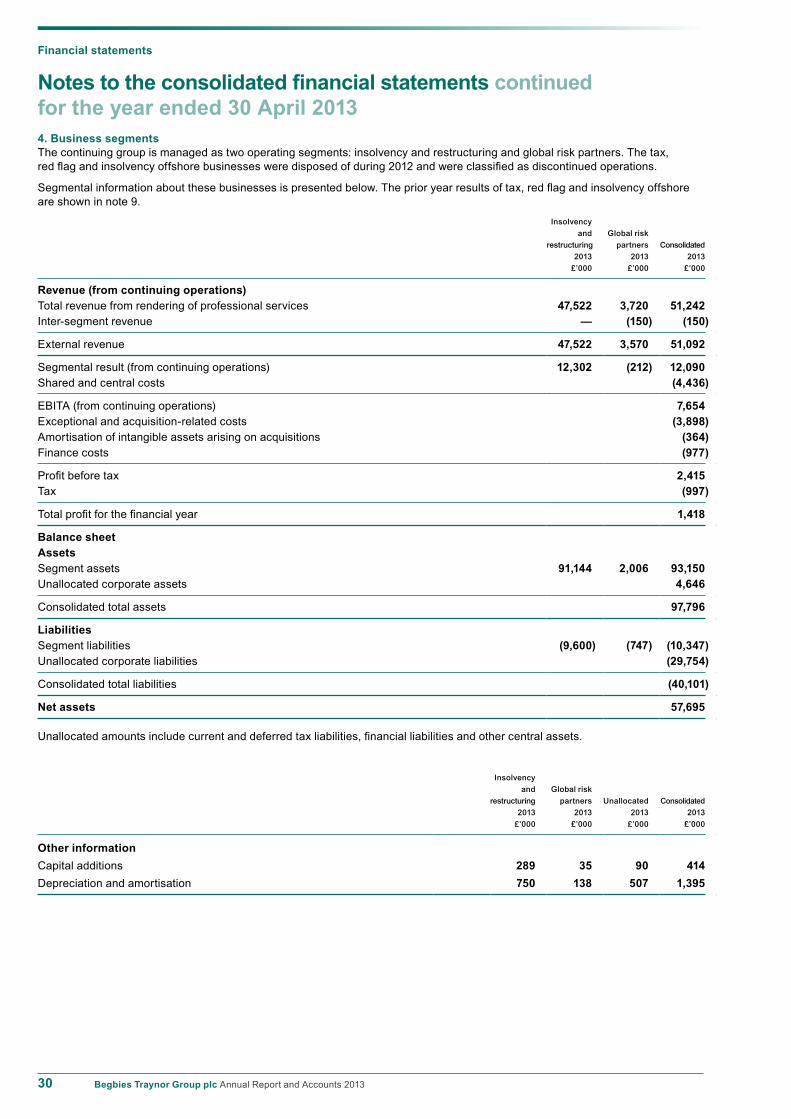
30 Begbies Traynor Group plc Annual Report and Accounts 2013
Notes to the consolidated financial statements continuedfor the year ended 30 April 2013
Financial statements
4. Business segmentsThe continuing group is managed as two operating segments: insolvency and restructuring and global risk partners. The tax, red flag and insolvency offshore businesses were disposed of during 2012 and were classified as discontinued operations.
Segmental information about these businesses is presented below. The prior year results of tax, red flag and insolvency offshore are shown in note 9.
Insolvency
and Global risk
restructuring partners Consolidated
2013 2013 2013
£’000 £’000 £’000
Revenue (from continuing operations)Total revenue from rendering of professional services 47,522 3,720 51,242Inter-segment revenue — (150) (150)
External revenue 47,522 3,570 51,092
Segmental result (from continuing operations) 12,302 (212) 12,090Shared and central costs (4,436)
EBITA (from continuing operations) 7,654Exceptional and acquisition-related costs (3,898)Amortisation of intangible assets arising on acquisitions (364)Finance costs (977)
Profit before tax 2,415Tax (997)
Total profit for the financial year 1,418
Balance sheetAssetsSegment assets 91,144 2,006 93,150Unallocated corporate assets 4,646
Consolidated total assets 97,796
LiabilitiesSegment liabilities (9,600) (747) (10,347)Unallocated corporate liabilities (29,754)
Consolidated total liabilities (40,101)
Net assets 57,695
Unallocated amounts include current and deferred tax liabilities, financial liabilities and other central assets.
Insolvency
and Global risk
restructuring partners Unallocated Consolidated
2013 2013 2013 2013
£’000 £’000 £’000 £’000
Other informationCapital additions 289 35 90 414Depreciation and amortisation 750 138 507 1,395

31Begbies Traynor Group plc Annual Report and Accounts 2013
4. Business segments continuedInsolvency
and Global risk restructuring partners Consolidated
2012 2012 2012£’000 £’000 £’000
Revenue (from continuing operations)Total revenue from rendering of professional services 53,117 4,813 57,930Inter-segment revenue — (193) (193)
External revenue 53,117 4,620 57,737
Segmental result (from continuing operations) 13,700 5 13,705Shared and central costs (5,198)
EBITA (from continuing operations) 8,507Exceptional and acquisition-related costs (1,447)Amortisation of intangible assets arising on acquisitions (419)Finance costs (1,187)
Profit before tax 5,454Tax (1,494)
Profit for the year from continuing operations 3,960Loss for the year from discontinued operations (9,677)
Total loss for the financial year (5,717)
Balance sheetAssetsSegment assets 95,808 3,003 98,811Unallocated corporate assets 2,877
Consolidated total assets 101,688
LiabilitiesSegment liabilities (11,365) (691) (12,056)Unallocated corporate liabilities (31,219)
Consolidated total liabilities (43,275)
Net assets – continuing operations 58,413Net assets – discontinued operations 53
Net assets 58,466
Unallocated amounts above include current and deferred tax liabilities, financial liabilities and other central assets.
Insolvencyand Global risk
restructuring partners Discontinued Unallocated Consolidated2012 2012 2012 2012 2012£’000 £’000 £’000 £’000 £’000
Other informationCapital additions 754 271 31 136 1,192Depreciation and amortisation 1,595 122 10 606 2,333
Geographical segmentsThe group’s principal operations and markets are located in the UK.
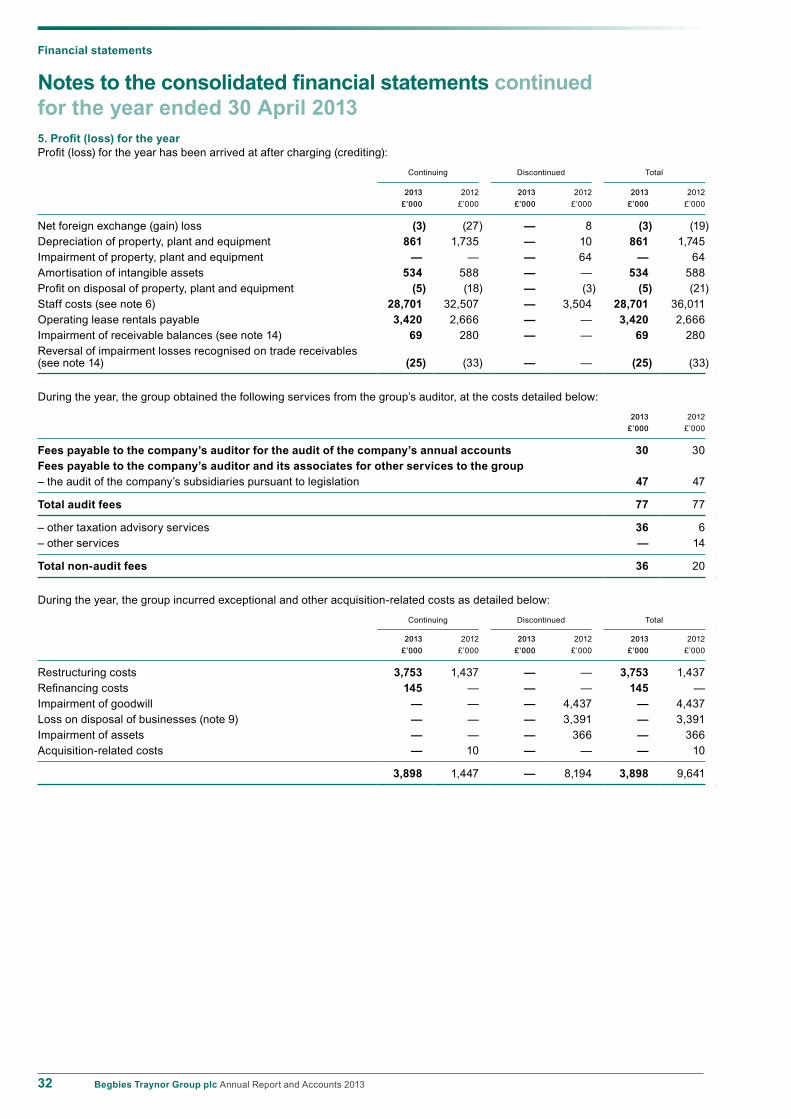
32 Begbies Traynor Group plc Annual Report and Accounts 2013
Notes to the consolidated financial statements continuedfor the year ended 30 April 2013
Financial statements
5. Profit (loss) for the yearProfit (loss) for the year has been arrived at after charging (crediting):
Continuing Discontinued Total
2013 2012 2013 2012 2013 2012£’000 £’000 £’000 £’000 £’000 £’000
Net foreign exchange (gain) loss (3) (27) — 8 (3) (19)Depreciation of property, plant and equipment 861 1,735 — 10 861 1,745Impairment of property, plant and equipment — — — 64 — 64Amortisation of intangible assets 534 588 — — 534 588Profit on disposal of property, plant and equipment (5) (18) — (3) (5) (21)Staff costs (see note 6) 28,701 32,507 — 3,504 28,701 36,011Operating lease rentals payable 3,420 2,666 — — 3,420 2,666Impairment of receivable balances (see note 14) 69 280 — — 69 280Reversal of impairment losses recognised on trade receivables (see note 14) (25) (33) — — (25) (33)
During the year, the group obtained the following services from the group’s auditor, at the costs detailed below:
2013 2012£’000 £’000
Fees payable to the company’s auditor for the audit of the company’s annual accounts 30 30Fees payable to the company’s auditor and its associates for other services to the group– the audit of the company’s subsidiaries pursuant to legislation 47 47
Total audit fees 77 77
– other taxation advisory services 36 6– other services — 14
Total non-audit fees 36 20
During the year, the group incurred exceptional and other acquisition-related costs as detailed below:
Continuing Discontinued Total
2013 2012 2013 2012 2013 2012£’000 £’000 £’000 £’000 £’000 £’000
Restructuring costs 3,753 1,437 — — 3,753 1,437Refinancing costs 145 — — — 145 —Impairment of goodwill — — — 4,437 — 4,437Loss on disposal of businesses (note 9) — — — 3,391 — 3,391Impairment of assets — — — 366 — 366Acquisition-related costs — 10 — — — 10
3,898 1,447 — 8,194 3,898 9,641

33Begbies Traynor Group plc Annual Report and Accounts 2013
6. Staff costsThe average monthly number of persons (including executive directors) working within the group was:
Continuing Discontinued Total
2013 2012 2013 2012 2013 2012£’000 £’000 £’000 £’000 £’000 £’000
Partners and consultants 77 83 — 9 77 92Fee-earning staff 334 366 — 24 334 390Support staff 121 137 — 24 121 161
532 586 — 57 532 643
Continuing Discontinued Total
2013 2012 2013 2012 2013 2012£’000 £’000 £’000 £’000 £’000 £’000
Their aggregate remuneration comprised:Wages, salaries and partners’ profit share 26,192 29,688 — 3,216 26,192 32,904Social security costs 1,673 1,871 — 210 1,673 2,081Other pension costs (note 27) 836 948 — 78 836 1,026
28,701 32,507 — 3,504 28,701 36,011
Directors’ remuneration and transactionsDirectors’ remuneration
2013 2012£’000 £’000
Short-term employee benefits 1,025 1,152Post-employment benefits 23 22Sums paid to third parties in respect of directors’ services — 10
1,048 1,184
Number Number
The average number of directors who:Are members of a defined contribution pension scheme 1 1Had awards receivable in the form of shares under a long-term incentive scheme 3 3
Pension contributions paid by the company in respect of such directors were as follows:
2013 2012£’000 £’000
Nick Taylor 23 22
The highest paid director in the year was Mark Fry and his total remuneration for the period was £506,081 (2012: £457,748 for the period from 7 July 2011 to 30 April 2012). No contributions (2012: £nil) were made into a company pension scheme on his behalf.

34 Begbies Traynor Group plc Annual Report and Accounts 2013
Notes to the consolidated financial statements continuedfor the year ended 30 April 2013
Financial statements
7. Finance costsContinuing Discontinued Total
2013 2012 2013 2012 2013 2012£’000 £’000 £’000 £’000 £’000 £’000
Interest on bank overdrafts and loans 961 1,067 — 5 961 1,072Finance charges on hire purchase contracts 2 72 — 5 2 77
Total interest expense 963 1,139 — 10 963 1,149Unwinding of discount on deferred consideration liabilities 14 48 — — 14 48
Total finance costs 977 1,187 — 10 977 1,197
8. TaxContinuing Discontinued Total
2013 2012 2013 2012 2013 2012£’000 £’000 £’000 £’000 £’000 £’000
Current tax charge (credit) 944 1,517 — (1,484) 944 33Deferred tax charge (credit) (note 19) 53 (23) — 261 53 238
997 1,494 — (1,223) 997 271
Corporation tax is calculated at 24% (2012: 26%) of the estimated assessable profit for the year.
The charge for the year can be reconciled to the profit per the income statement as follows:
2013 2012£’000 £’000
Profit (loss) before tax:Continuing operations 2,415 5,454Discontinued operations (note 9) — (10,900)
2,415 (5,446)
Notional tax charge (credit) at the UK corporation tax rate of 24% (2012: 26%) 580 (1,416)Adjustments in respect of current income tax of prior years 57 6Tax effect of expenses that are not deductible in determining taxable profit 575 850Tax effect of asset impairment charges (discontinued operations) that are not deductible in determining taxable profit — 1,249Impact of change in rate (209) (390)Deferred tax at 23% (2012: 24%) (6) (28)
Total tax expense reported in the income statement 997 271

35Begbies Traynor Group plc Annual Report and Accounts 2013
9. Discontinued operations On 15 October 2012 the group disposed of its Kenyan operations (disclosed within insolvency offshore), which were classified as held for sale in the balance sheet at 30 April 2012. Proceeds of £30,000 were received during the year.
On 26 November 2011, the group disposed of its tax business to Smith & Williamson Holdings Limited and on 10 April 2012, the group disposed of Red Flag A!ert LLP to Ric Traynor, the group’s executive chairman. The Channel Islands business was sold to Grant Thornton Limited on 11 January 2012, and the Cayman Islands business was closed during 2012.
The results of the discontinued operations for 2012 were as follows:
2012
InsolvencyTax Red flag offshore Total
£’000 £’000 £’000 £’000
Revenue 2,802 531 491 3,824Direct costs (2,811) (78) (530) (3,419)
Gross profit (loss) (9) 453 (39) 405Administrative expenses (1,539) (1,310) (252) (3,101)
EBITA (1,548) (857) (291) (2,696)Finance costs (10) — — (10)Exceptional and acquisition-related costs (4,437) — (366) (4,803)
Loss before tax (5,995) (857) (657) (7,509)Tax 178
Loss after tax (7,331)Loss on disposal (3,391)Tax on loss on disposal 1,045
Net loss attributable to discontinued operations (9,677)
The discontinued operations resulted in cash flows as follows:
2012£’000
Net cash flows from operating activities (2,501)Net cash flows from investing activities 2,435
Net cash outflows (66)
An analysis of the assets and liabilities classified as held for sale at 30 April 2012 is set out below:
Insolvencyoffshore
£’000
Trade and other receivables 198
Total assets 198
Trade and other payables (130)Provisions (15)
Total liabilities (145)
Net assets of disposal group 53
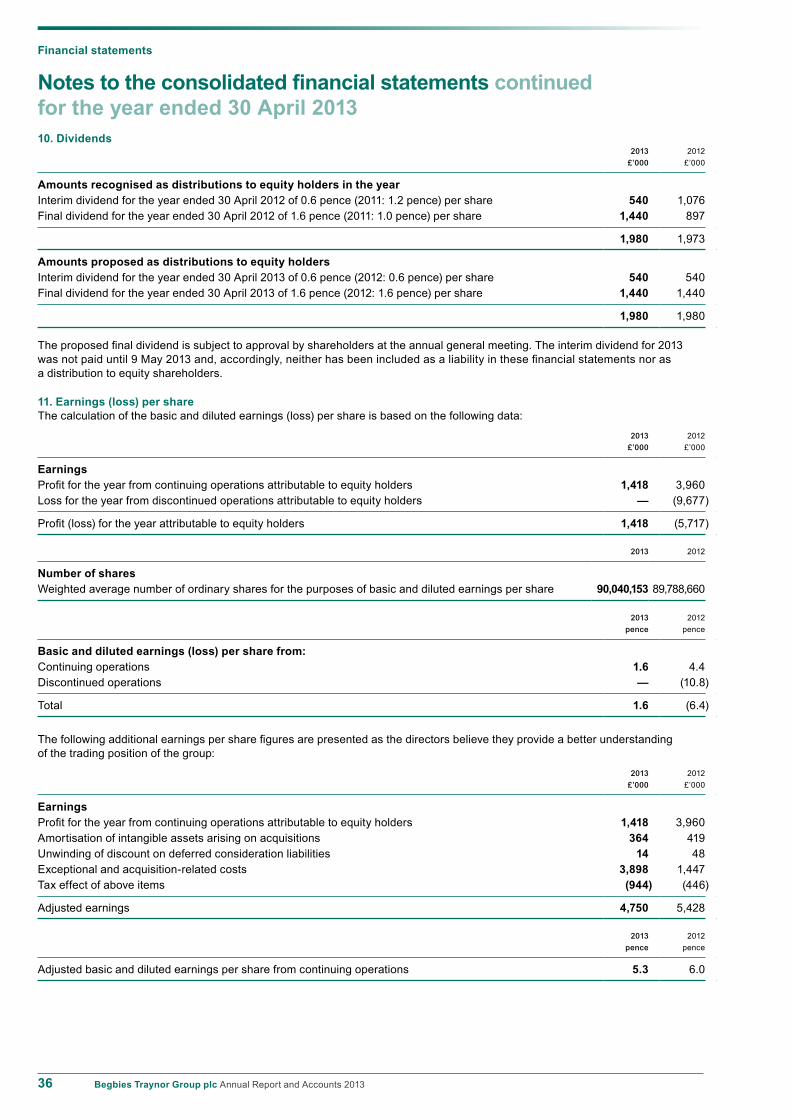
36 Begbies Traynor Group plc Annual Report and Accounts 2013
Notes to the consolidated financial statements continuedfor the year ended 30 April 2013
Financial statements
10. Dividends2013 2012
£’000 £’000
Amounts recognised as distributions to equity holders in the yearInterim dividend for the year ended 30 April 2012 of 0.6 pence (2011: 1.2 pence) per share 540 1,076Final dividend for the year ended 30 April 2012 of 1.6 pence (2011: 1.0 pence) per share 1,440 897
1,980 1,973
Amounts proposed as distributions to equity holders Interim dividend for the year ended 30 April 2013 of 0.6 pence (2012: 0.6 pence) per share 540 540Final dividend for the year ended 30 April 2013 of 1.6 pence (2012: 1.6 pence) per share 1,440 1,440
1,980 1,980
The proposed final dividend is subject to approval by shareholders at the annual general meeting. The interim dividend for 2013 was not paid until 9 May 2013 and, accordingly, neither has been included as a liability in these financial statements nor as a distribution to equity shareholders.
11. Earnings (loss) per shareThe calculation of the basic and diluted earnings (loss) per share is based on the following data:
2013 2012£’000 £’000
EarningsProfit for the year from continuing operations attributable to equity holders 1,418 3,960Loss for the year from discontinued operations attributable to equity holders — (9,677)
Profit (loss) for the year attributable to equity holders 1,418 (5,717)
2013 2012
Number of sharesWeighted average number of ordinary shares for the purposes of basic and diluted earnings per share 90,040,153 89,788,660
2013 2012pence pence
Basic and diluted earnings (loss) per share from:Continuing operations 1.6 4.4Discontinued operations — (10.8)
Total 1.6 (6.4)
The following additional earnings per share figures are presented as the directors believe they provide a better understanding of the trading position of the group:
2013 2012£’000 £’000
EarningsProfit for the year from continuing operations attributable to equity holders 1,418 3,960Amortisation of intangible assets arising on acquisitions 364 419Unwinding of discount on deferred consideration liabilities 14 48Exceptional and acquisition-related costs 3,898 1,447Tax effect of above items (944) (446)
Adjusted earnings 4,750 5,428
2013 2012pence pence
Adjusted basic and diluted earnings per share from continuing operations 5.3 6.0
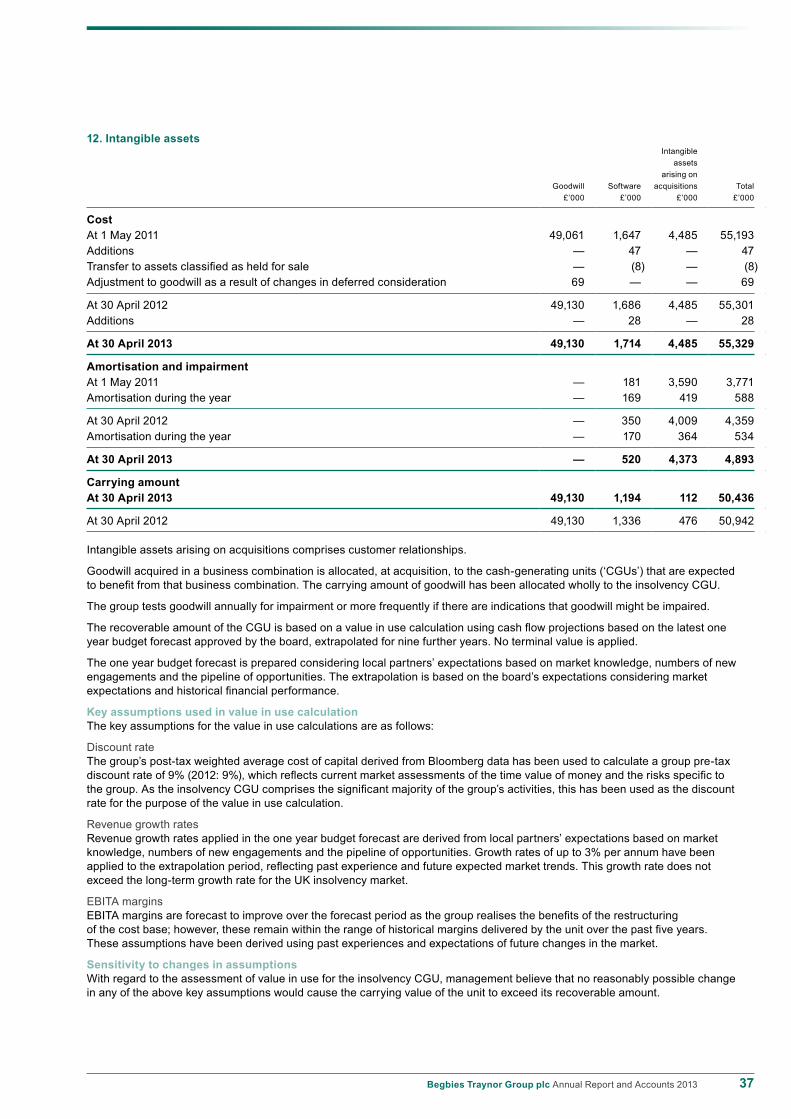
37Begbies Traynor Group plc Annual Report and Accounts 2013
12. Intangible assetsIntangible
assets arising on
Goodwill Software acquisitions Total£’000 £’000 £’000 £’000
CostAt 1 May 2011 49,061 1,647 4,485 55,193Additions — 47 — 47Transfer to assets classified as held for sale — (8) — (8)Adjustment to goodwill as a result of changes in deferred consideration 69 — — 69
At 30 April 2012 49,130 1,686 4,485 55,301Additions — 28 — 28
At 30 April 2013 49,130 1,714 4,485 55,329
Amortisation and impairment At 1 May 2011 — 181 3,590 3,771Amortisation during the year — 169 419 588
At 30 April 2012 — 350 4,009 4,359Amortisation during the year — 170 364 534
At 30 April 2013 — 520 4,373 4,893
Carrying amountAt 30 April 2013 49,130 1,194 112 50,436
At 30 April 2012 49,130 1,336 476 50,942
Intangible assets arising on acquisitions comprises customer relationships.
Goodwill acquired in a business combination is allocated, at acquisition, to the cash-generating units (‘CGUs’) that are expected to benefit from that business combination. The carrying amount of goodwill has been allocated wholly to the insolvency CGU.
The group tests goodwill annually for impairment or more frequently if there are indications that goodwill might be impaired.
The recoverable amount of the CGU is based on a value in use calculation using cash flow projections based on the latest one year budget forecast approved by the board, extrapolated for nine further years. No terminal value is applied.
The one year budget forecast is prepared considering local partners’ expectations based on market knowledge, numbers of new engagements and the pipeline of opportunities. The extrapolation is based on the board’s expectations considering market expectations and historical financial performance.
Key assumptions used in value in use calculationThe key assumptions for the value in use calculations are as follows:
Discount rateThe group’s post-tax weighted average cost of capital derived from Bloomberg data has been used to calculate a group pre-tax discount rate of 9% (2012: 9%), which reflects current market assessments of the time value of money and the risks specific to the group. As the insolvency CGU comprises the significant majority of the group’s activities, this has been used as the discount rate for the purpose of the value in use calculation.
Revenue growth ratesRevenue growth rates applied in the one year budget forecast are derived from local partners’ expectations based on market knowledge, numbers of new engagements and the pipeline of opportunities. Growth rates of up to 3% per annum have been applied to the extrapolation period, reflecting past experience and future expected market trends. This growth rate does not exceed the long-term growth rate for the UK insolvency market.
EBITA marginsEBITA margins are forecast to improve over the forecast period as the group realises the benefits of the restructuring of the cost base; however, these remain within the range of historical margins delivered by the unit over the past five years. These assumptions have been derived using past experiences and expectations of future changes in the market.
Sensitivity to changes in assumptionsWith regard to the assessment of value in use for the insolvency CGU, management believe that no reasonably possible change in any of the above key assumptions would cause the carrying value of the unit to exceed its recoverable amount.

38 Begbies Traynor Group plc Annual Report and Accounts 2013
Notes to the consolidated financial statements continuedfor the year ended 30 April 2013
Financial statements
13. Property, plant and equipmentLeasehold Office Motor
improvements equipment Computers vehicles Total£’000 £’000 £’000 £’000 £’000
Cost or valuationAt 1 May 2011 4,207 1,103 2,062 5,901 13,273Additions 220 35 172 718 1,145Disposals (84) (29) (15) (6,444) (6,572)Transfer to assets classified as held for sale (71) (45) (64) (20) (200)
At 30 April 2012 4,272 1,064 2,155 155 7,646Additions 229 26 131 — 386Disposals (2) (2) (3) (141) (148)
At 30 April 2013 4,499 1,088 2,283 14 7,884
Depreciation and impairmentAt 1 May 2011 2,054 784 1,419 2,196 6,453Charge for the year 432 104 286 923 1,745Impairment 26 18 10 10 64Disposals (81) (28) (15) (2,995) (3,119)Transfer to assets classified as held for sale (71) (43) (41) (19) (174)
At 30 April 2012 2,360 835 1,659 115 4,969Charge for the year 498 81 279 3 861Disposals (1) (1) (3) (106) (111)
At 30 April 2013 2,857 915 1,935 12 5,719
Carrying amount At 30 April 2013 1,642 173 348 2 2,165
At 30 April 2012 1,912 229 496 40 2,677
In addition, the group’s obligations under hire purchase contracts (see note 18) are secured by the lessors’ title to the leased assets, which have a carrying amount of £nil (2012: £24,000).

39Begbies Traynor Group plc Annual Report and Accounts 2013
14. Trade and other receivables2013 2012
£’000 £’000
Trade receivables 6,374 6,896Unbilled income 31,316 33,785Other debtors and prepayments 2,543 3,074
40,233 43,755
Trade receivables do not carry interest and are stated net of allowances for doubtful receivables of £188,000 (2012: £444,000).
The directors consider that the carrying amount of trade and other receivables approximates to their fair value.
Trade receivables are non-interest bearing and are generally on 30 days’ terms. Refer to note 20 for disclosures on credit risk.
As at 30 April, the analysis of trade receivables that were past due but not impaired is as follows:
Neither pastdue nor
impaired upto 30 days
Past due but
not impaired
Total 1–3 monthsMore than4 months
£’000 £’000 £’000 £’000
2013 6,374 3,201 1,691 1,4822012 6,896 3,164 1,496 2,236
Movement in the allowance for doubtful debts2013 2012
£’000 £’000
Balance at beginning of the year 444 264Amounts written off during the year (300) (67)Amounts recovered during the year (25) (33)Increase in allowance recognised in profit or loss 69 280
Balance at end of the year 188 444
15. Trade and other payables2013 2012
£’000 £’000
CurrentTrade payables 1,034 1,324Other taxes and social security 1,995 1,869Accruals 6,112 6,248Deferred consideration 272 830
9,413 10,271
Non-currentDeferred consideration — 94
Trade creditors are non-interest bearing and are normally settled on terms agreed with suppliers.
The directors consider that the carrying amount of trade payables approximates to their fair value.

40 Begbies Traynor Group plc Annual Report and Accounts 2013
Notes to the consolidated financial statements continuedfor the year ended 30 April 2013
Financial statements
16. Borrowings2013 2012
£’000 £’000
Unsecured borrowing at amortised costBank loans 22,127 24,259Secured borrowing at amortised costHire purchase capital (see note 18) — 98
Total borrowings 22,127 24,357
Amount due for settlement within 12 months 109 212
Amount due for settlement after 12 months 22,018 24,145
The principal features of the group’s borrowings are as follows:
(i) The group’s principal borrowings at 30 April 2013 comprise unsecured, revolving credit facilities (‘RCFs’) totalling £20 million, a term loan of £10 million together with a £5 million overdraft which were entered into on 26 April 2013. The principal features of these borrowings are summarised as follows:
U RCF of £10 million provided by HSBC, of which £6 million was drawn at 30 April 2013. The facility has a 4.25 year term. The effective interest rate was 5.2%;
U RCF of £10 million provided by Santander, of which £6 million was drawn at 30 April 2013. The facility has a 4.25 year term. The effective interest rate was 5.2%;
U term loan of £10 million provided by M&G UK Companies Financing Fund 2, of which £10 million was drawn at 30 April 2013. The facility has a £5 million maturity in April 2020 and £5 million maturity in April 2021. The effective interest rate was 5%; and
U bank overdraft of £5 million provided by HSBC, which is repayable on demand. This facility was undrawn at 30 April 2013 and interest is payable at 2.50% over bank base rate.
(ii) The group has additional unsecured bank loans as follows:
U borrowings of £127,000 (2012: £222,000), repayable over two years. Interest on this loan is fixed at 6.27%.
(iii) Hire purchase liabilities in the prior year were secured by the assets leased. The borrowings were a mixture of fixed and variable interest rate debt.
(iv) The borrowings in place during the current financial year from 1 May 2012 to 26 April 2013 and the whole of the preceding financial year were as follows:
U RCF of £15 million provided by HSBC, of which £11 million was drawn at 30 April 2012. The effective interest rate was 4.6%;
U RCF of £15 million provided by Yorkshire Bank, of which £13 million was drawn at 30 April 2012. The effective interest rate was 4.6%; and
U bank overdraft of £5 million provided by HSBC, which is repayable on demand. This facility was undrawn at 30 April 2012 and interest was payable at 1.75% over bank base rate.
All borrowings are denominated in sterling. Of the total cash balance of £4,962,000 (2012: £4,302,000), £4,836,000 is denominated in sterling (2012: £3,989,000) and £126,000 in US dollars (2012: £313,000). The directors consider that the fair values of the group’s financial instruments approximate to their book value.
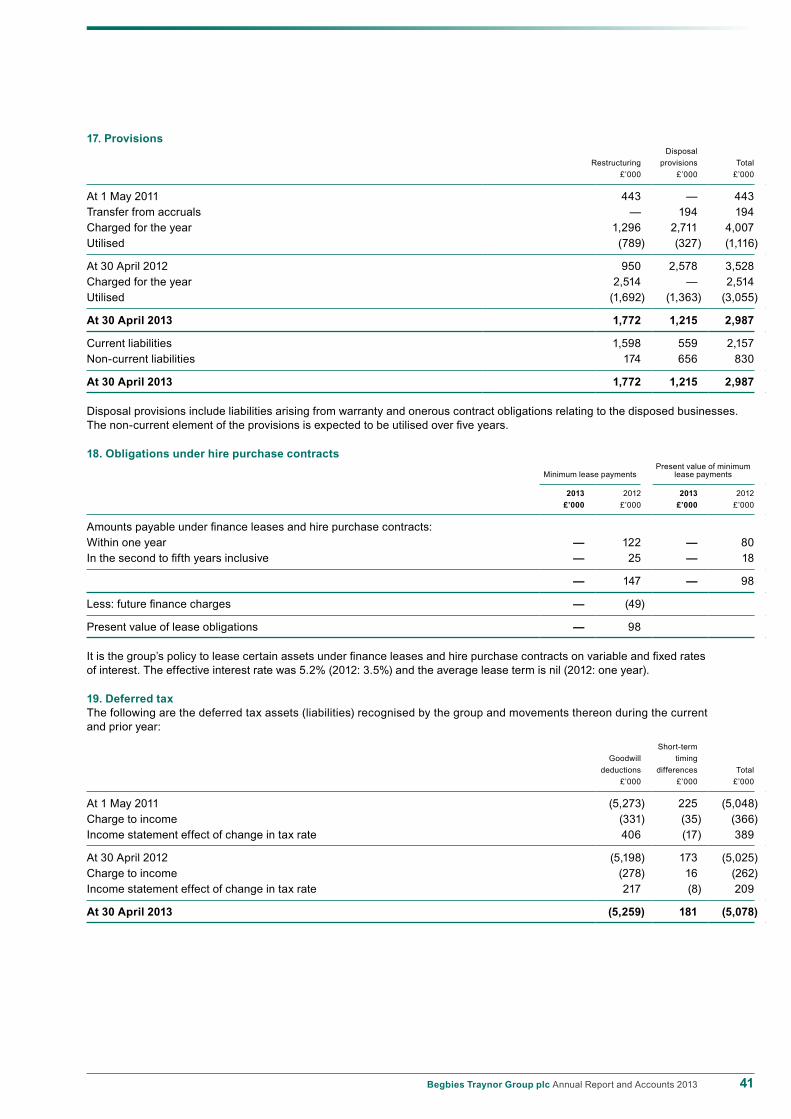
41Begbies Traynor Group plc Annual Report and Accounts 2013
17. ProvisionsDisposal
Restructuring provisions Total£’000 £’000 £’000
At 1 May 2011 443 — 443Transfer from accruals — 194 194Charged for the year 1,296 2,711 4,007Utilised (789) (327) (1,116)
At 30 April 2012 950 2,578 3,528Charged for the year 2,514 — 2,514Utilised (1,692) (1,363) (3,055)
At 30 April 2013 1,772 1,215 2,987
Current liabilities 1,598 559 2,157Non-current liabilities 174 656 830
At 30 April 2013 1,772 1,215 2,987
Disposal provisions include liabilities arising from warranty and onerous contract obligations relating to the disposed businesses. The non-current element of the provisions is expected to be utilised over five years.
18. Obligations under hire purchase contracts
Minimum lease paymentsPresent value of minimum
lease payments
2013 2012 2013 2012£’000 £’000 £’000 £’000
Amounts payable under finance leases and hire purchase contracts:Within one year — 122 — 80In the second to fifth years inclusive — 25 — 18
— 147 — 98
Less: future finance charges — (49)
Present value of lease obligations — 98
It is the group’s policy to lease certain assets under finance leases and hire purchase contracts on variable and fixed rates of interest. The effective interest rate was 5.2% (2012: 3.5%) and the average lease term is nil (2012: one year).
19. Deferred taxThe following are the deferred tax assets (liabilities) recognised by the group and movements thereon during the current and prior year:
Short-termGoodwill timing
deductions differences Total£’000 £’000 £’000
At 1 May 2011 (5,273) 225 (5,048)Charge to income (331) (35) (366)Income statement effect of change in tax rate 406 (17) 389
At 30 April 2012 (5,198) 173 (5,025)Charge to income (278) 16 (262)Income statement effect of change in tax rate 217 (8) 209
At 30 April 2013 (5,259) 181 (5,078)
42 Begbies Traynor Group plc Annual Report and Accounts 2013
Notes to the consolidated financial statements continuedfor the year ended 30 April 2013
Financial statements
19. Deferred tax continuedThe Finance Act 2012, which was substantially enacted in July 2012, included provisions to reduce the rate of corporation tax to 24% with effect from 1 April 2012 and 23% with effect from 1 April 2013. Accordingly, deferred tax balances have been revalued to the lower rate of 23% in these accounts.
The government has announced that it intends to further reduce the rate of corporation tax to 21% with effect from 1 April 2014 and 20% from 1 April 2015. As this legislation was not substantially enacted by 30 April 2013, the impact of the anticipated rate change is not reflected in the tax provisions reported in these accounts. If deferred tax assets and liabilities of the group were all to reverse after 1 April 2015, the effect of future changes from 23% to 20% would be to reduce the net deferred tax liability by £663,000. To the extent that the deferred tax reverses more quickly than this the impact on the net deferred tax liability will be reduced.
Certain deferred tax assets and liabilities have been offset. The following is the analysis of the deferred tax balances (after offset) for financial reporting purposes:
2013 2012£’000 £’000
Deferred tax liabilities (5,259) (5,198)Deferred tax assets 181 173
(5,078) (5,025)
20. Financial instrumentsFinancial risk management objectives and policiesThe group’s principal financial instruments comprise bank loans and overdrafts, finance leases and hire purchase contracts. The main purpose of these financial instruments is to raise finance for the group’s operations. The group also has various other financial instruments, such as trade receivables and trade payables, which arise directly from its operations.
It is, and has been throughout the period under review, the group’s policy that no trading in financial instruments shall be undertaken.
The main risks arising from the group’s financial instruments are interest rate risk, credit risk and liquidity risk. The board reviews and agrees policies for managing each of these risks and they are summarised below.
Interest rate riskThe group’s external borrowings at the balance sheet date comprise bank overdraft and loan facilities and finance lease and hire purchase payables. All principal borrowings are on floating interest rates. The group does not seek to fix interest rates on these borrowings as the board currently considers the exposure to interest rate risk acceptable.
If interest rates had been 50 basis points higher and all other variables were held constant, the group’s profit for the year ended 30 April 2013 and net assets at that date would decrease by £80,000 (2012: £96,000). This is attributable to the group’s exposure to movements in interest rate on its variable rate borrowings.
Credit riskThe nature of the group’s debtor balances, the time taken for payment by clients and the associated credit risk are dependent on the type of engagement.
On formal insolvency appointments (which form the majority of the group’s activities), invoices are generally raised having achieved approval at a creditors’ meeting to draw fees. This is typically settled on a timely basis from case funds. The credit risk on these engagements is therefore considered to be extremely low.
On other engagements, principally consultancy services and litigation support, the timescale to receive payment from the date of invoice is typically longer as the group’s standard 30 day payment terms (referred to in note 14) are not practically enforceable in all situations. The board does not believe that this is an indication of increased credit risk on these engagements.
Receivable balances are monitored on an ongoing basis with the result that the group’s exposure to bad debts is not significant. Movements in the allowance for doubtful debts are disclosed in note 14. The group does not believe it is exposed to any material concentrations of credit risk.
Unbilled revenue is recognised by the group only when all conditions for revenue recognition have been met in line with the group’s accounting policy in note 2(l).
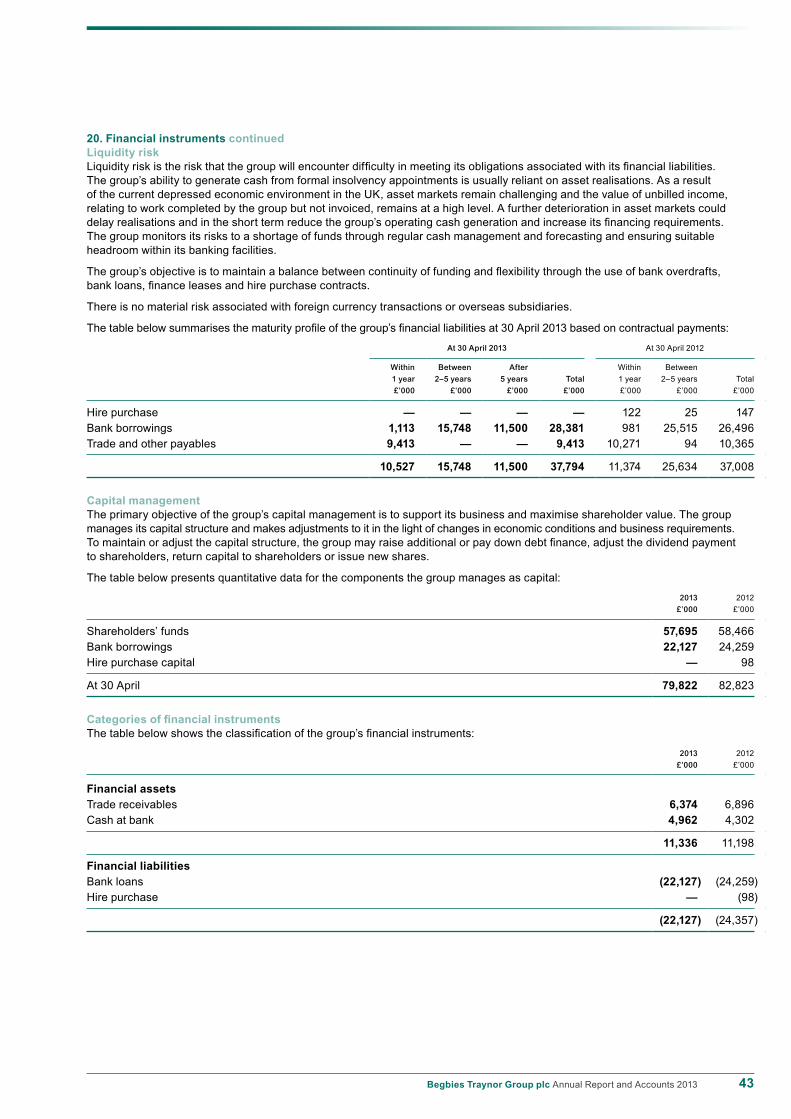
43Begbies Traynor Group plc Annual Report and Accounts 2013
20. Financial instruments continuedLiquidity riskLiquidity risk is the risk that the group will encounter difficulty in meeting its obligations associated with its financial liabilities. The group’s ability to generate cash from formal insolvency appointments is usually reliant on asset realisations. As a result of the current depressed economic environment in the UK, asset markets remain challenging and the value of unbilled income, relating to work completed by the group but not invoiced, remains at a high level. A further deterioration in asset markets could delay realisations and in the short term reduce the group’s operating cash generation and increase its financing requirements. The group monitors its risks to a shortage of funds through regular cash management and forecasting and ensuring suitable headroom within its banking facilities.
The group’s objective is to maintain a balance between continuity of funding and flexibility through the use of bank overdrafts, bank loans, finance leases and hire purchase contracts.
There is no material risk associated with foreign currency transactions or overseas subsidiaries.
The table below summarises the maturity profile of the group’s financial liabilities at 30 April 2013 based on contractual payments:
At 30 April 2013 At 30 April 2012
Within Between After Within Between1 year 2–5 years 5 years Total 1 year 2–5 years Total£’000 £’000 £’000 £’000 £’000 £’000 £’000
Hire purchase — — — — 122 25 147Bank borrowings 1,113 15,748 11,500 28,381 981 25,515 26,496Trade and other payables 9,413 — — 9,413 10,271 94 10,365
10,527 15,748 11,500 37,794 11,374 25,634 37,008
Capital managementThe primary objective of the group’s capital management is to support its business and maximise shareholder value. The group manages its capital structure and makes adjustments to it in the light of changes in economic conditions and business requirements. To maintain or adjust the capital structure, the group may raise additional or pay down debt finance, adjust the dividend payment to shareholders, return capital to shareholders or issue new shares.
The table below presents quantitative data for the components the group manages as capital:
2013 2012£’000 £’000
Shareholders’ funds 57,695 58,466Bank borrowings 22,127 24,259Hire purchase capital — 98
At 30 April 79,822 82,823
Categories of financial instrumentsThe table below shows the classification of the group’s financial instruments:
2013 2012£’000 £’000
Financial assetsTrade receivables 6,374 6,896Cash at bank 4,962 4,302
11,336 11,198
Financial liabilitiesBank loans (22,127) (24,259)Hire purchase — (98)
(22,127) (24,357)
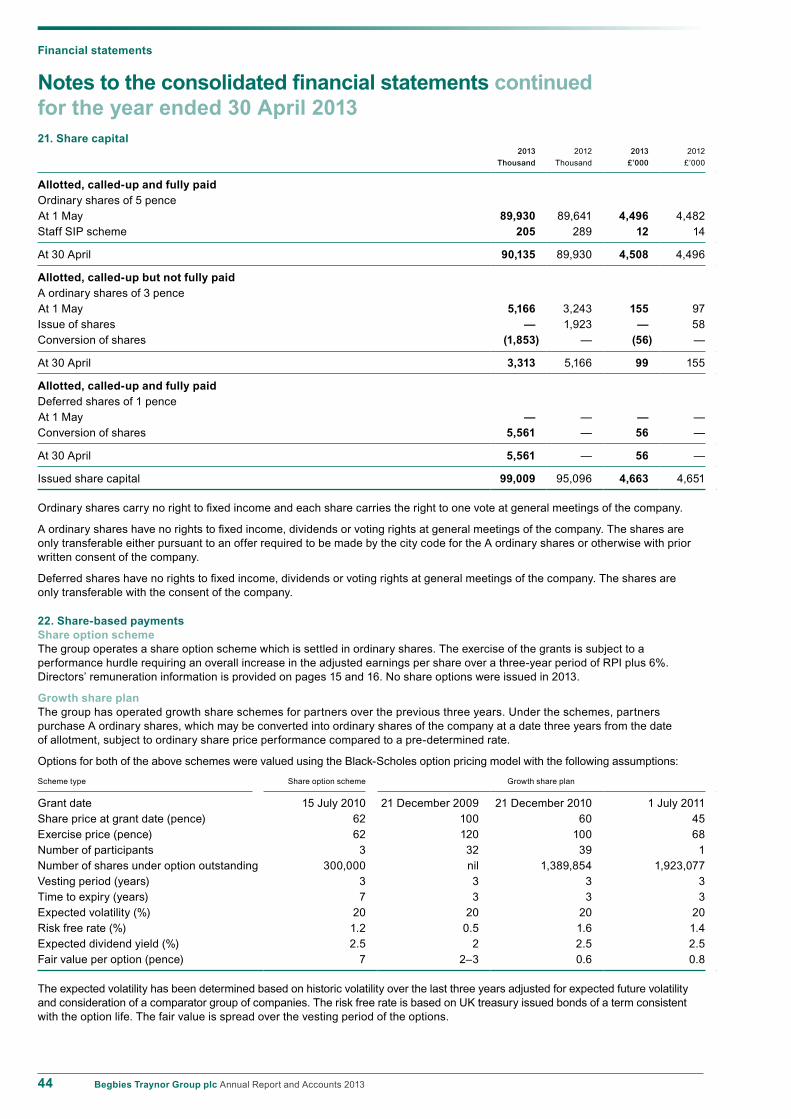
44 Begbies Traynor Group plc Annual Report and Accounts 2013
Notes to the consolidated financial statements continuedfor the year ended 30 April 2013
Financial statements
21. Share capital 2013 2012 2013 2012
Thousand Thousand £’000 £’000
Allotted, called-up and fully paidOrdinary shares of 5 penceAt 1 May 89,930 89,641 4,496 4,482Staff SIP scheme 205 289 12 14
At 30 April 90,135 89,930 4,508 4,496
Allotted, called-up but not fully paidA ordinary shares of 3 penceAt 1 May 5,166 3,243 155 97Issue of shares — 1,923 — 58Conversion of shares (1,853) — (56) —
At 30 April 3,313 5,166 99 155
Allotted, called-up and fully paidDeferred shares of 1 penceAt 1 May — — — —Conversion of shares 5,561 — 56 —
At 30 April 5,561 — 56 —
Issued share capital 99,009 95,096 4,663 4,651
Ordinary shares carry no right to fixed income and each share carries the right to one vote at general meetings of the company.
A ordinary shares have no rights to fixed income, dividends or voting rights at general meetings of the company. The shares are only transferable either pursuant to an offer required to be made by the city code for the A ordinary shares or otherwise with prior written consent of the company.
Deferred shares have no rights to fixed income, dividends or voting rights at general meetings of the company. The shares are only transferable with the consent of the company.
22. Share-based payments Share option schemeThe group operates a share option scheme which is settled in ordinary shares. The exercise of the grants is subject to a performance hurdle requiring an overall increase in the adjusted earnings per share over a three-year period of RPI plus 6%. Directors’ remuneration information is provided on pages 15 and 16. No share options were issued in 2013.
Growth share planThe group has operated growth share schemes for partners over the previous three years. Under the schemes, partners purchase A ordinary shares, which may be converted into ordinary shares of the company at a date three years from the date of allotment, subject to ordinary share price performance compared to a pre-determined rate.
Options for both of the above schemes were valued using the Black-Scholes option pricing model with the following assumptions:
Scheme type Share option scheme Growth share plan
Grant date 15 July 2010 21 December 2009 21 December 2010 1 July 2011Share price at grant date (pence) 62 100 60 45Exercise price (pence) 62 120 100 68Number of participants 3 32 39 1Number of shares under option outstanding 300,000 nil 1,389,854 1,923,077Vesting period (years) 3 3 3 3Time to expiry (years) 7 3 3 3Expected volatility (%) 20 20 20 20Risk free rate (%) 1.2 0.5 1.6 1.4Expected dividend yield (%) 2.5 2 2.5 2.5Fair value per option (pence) 7 2–3 0.6 0.8
The expected volatility has been determined based on historic volatility over the last three years adjusted for expected future volatility and consideration of a comparator group of companies. The risk free rate is based on UK treasury issued bonds of a term consistent with the option life. The fair value is spread over the vesting period of the options.

45Begbies Traynor Group plc Annual Report and Accounts 2013
22. Share-based payments continuedGrowth share plan continuedNo options were exercised during the financial year.
The growth share plan granted on 21 December 2009 matured during the year, and the A ordinary shares converted into deferred shares as detailed in note 21.
The group recognised an expense of £99,000 (2012: £118,000) related to equity-settled share-based payments.
23. AcquisitionsDuring the prior year, the group acquired a portfolio of Scottish insolvency cases, together with three employees, for £0.4 million.
24. Reconciliation to the cash flow statement2013 2012
£’000 £’000
Profit (loss) for the year 1,418 (5,717)Adjustments for:Tax 997 271Finance costs 977 1,197Amortisation of intangible assets 534 588Depreciation of property, plant and equipment 861 1,745Exceptional cost relating to impairment of assets — 366Non-cash exceptional costs 1,384 141Loss on disposal of businesses — 680Profit on disposal of property, plant and equipment (5) (21)Impairment of goodwill — 4,437Share-based payment expense 99 118
Operating cash flows before movements in working capital 6,265 3,805Decrease (increase) in receivables 2,489 (101)Decrease in payables (420) (2,345)(Decrease) increase in provisions (541) 2,492
Cash generated by operations 7,793 3,851
Cash and cash equivalents (which are presented as a single class of assets on the face of the balance sheet) comprise cash at bank and other short-term highly liquid investments with a maturity of three months or less.
25. Contingent liabilitiesThe group had no material contingent liabilities at 30 April 2013 or 30 April 2012.
26. Operating lease arrangements
2013 2012£’000 £’000
Minimum lease payments under operating leases recognised as an expense in the year 3,420 2,666
At the balance sheet date, the group had outstanding commitments for future minimum lease payments under non-cancellable operating leases, which fall due as follows:
2013 2012£’000 £’000
Within one year 3,073 3,771In the second to fifth years inclusive 4,593 6,394After five years — 2
7,666 10,167
Operating lease payments principally represent rentals payable by the group for certain of its office properties, which have an average duration of six years, together with operating leases for motor vehicles.

46 Begbies Traynor Group plc Annual Report and Accounts 2013
Notes to the consolidated financial statements continuedfor the year ended 30 April 2013
Financial statements
27. PensionsThe group operates defined contribution pension schemes for all qualifying employees.
The total cost charged to income of £836,000 (2012: £1,026,000) represents contributions payable to these schemes by the group at rates specified in the rules of the plans. As at 30 April 2013, contributions of £67,000 (2012: £75,000) due in respect of the current year had not been paid over to the schemes.
28. Related party transactionsTransactions between the company and its subsidiaries, which are related parties, have been eliminated on consolidation and are not disclosed in this note.
Remuneration of key management personnelThe remuneration of the directors, who are the key management personnel of the group, is set out in note 6 for each of the categories specified in IAS 24 ‘Related Party Disclosures’. In addition, the share-based payment charge in respect of key management personnel in the year was a charge of £19,000 (2012: credit of £26,000). Further information about the remuneration of individual directors is provided in the directors’ remuneration report on pages 15 and 16.
At 30 April 2013 £31,500 (2012: £174,000) was payable to key management personnel in respect of these transactions.
Directors’ transactionsDuring the year the following transactions, all of which were on arm’s length terms and in the ordinary course of business, occurred in which directors have an interest:
Various commercial properties used by members of the group during the year are owned or part owned by Ric Traynor or his personal pension fund. Rent and service charges paid on those properties by entities within the group in the year totalled £720,000 (2012: £720,000). At 30 April 2013 £nil (2012: £nil) was payable in respect of these transactions.
One commercial property used by members of the group during the year is part owned by Mark Fry. Rent and service charges paid on this property by entities within the group in the year totalled £85,000 (2012: £85,000). At 30 April 2013 £nil (2012: £nil) was payable in respect of this transaction. Mark Fry also part owns a company which provides archiving facilities to entities within the group. £20,500 (2012: £22,500) was paid by entities within the group for this service during the year. At 30 April 2013 £5,000 (2012: £5,000) was payable in respect of this service.
Ric Traynor purchased the controlling interest in Red Flag A!ert LLP on 10 April 2012, with the group retaining a minority interest in the partnership. The group has agreed to continue to provide shared, IT, HR, marketing, administrative and accounting services to Red Flag for which £150,000 was payable by Red Flag during the year (2012: £12,500). The Group has negotiated an agreement to retain full access to the database and joint marketing rights for the publication of Red Flag Alert quarterly statistics and was charged a fee of £150,000 for the year (2012: £12,500). Rent of £50,000 was paid to the Group by Red Flag during the year (2012: £6,250). At 30 April 2013 £nil (2012: £nil) was owing or payable in respect of these transactions.
47Begbies Traynor Group plc Annual Report and Accounts 2013
Financial statements
We have audited the financial statements of Begbies Traynor Group plc for the year ended 30 April 2013, which comprise the company balance sheet and the related notes 1 to 8. The financial reporting framework that has been applied in their preparation is applicable law and United Kingdom Accounting Standards (United Kingdom Generally Accepted Accounting Practice).
This report is made solely to the company’s members, as a body, in accordance with chapter 3 of part 16 of the Companies Act 2006. Our audit work has been undertaken so that we might state to the company’s members those matters we are required to state to them in an auditor’s report and for no other purpose. To the fullest extent permitted by law, we do not accept or assume responsibility to anyone other than the company and the company’s members as a body for our audit work, for this report, or for the opinions we have formed.
Respective responsibilities of directors and auditorAs explained more fully in the statement of directors’ responsibilities, the directors are responsible for the preparation of the financial statements and for being satisfied that they give a true and fair view. Our responsibility is to audit and express an opinion on the company financial statements in accordance with applicable law and International Standards on Auditing (UK and Ireland). Those standards require us to comply with the Auditing Practices Board’s Ethical Standards for Auditors.
Scope of the audit of the financial statementsAn audit involves obtaining evidence about the amounts and disclosures in the financial statements sufficient to give reasonable assurance that the financial statements are free from material misstatement, whether caused by fraud or error. This includes an assessment of: whether the accounting policies are appropriate to the company’s circumstances and have been consistently applied and adequately disclosed; the reasonableness of significant accounting estimates made by the directors; and the overall presentation of the financial statements. In addition, we read all the financial and non-financial information in the Annual Report to identify material inconsistencies with the audited financial statements. If we become aware of any apparent material misstatements or inconsistencies we consider the implications for our report.
Opinion on financial statementsIn our opinion the company financial statements:
U give a true and fair view of the state of the company’s affairs as at 30 April 2013;
U have been properly prepared in accordance with United Kingdom Generally Accepted Accounting Practice; and
U have been prepared in accordance with the requirements of the Companies Act 2006.
Opinion on other matter prescribed by the Companies Act 2006In our opinion the information given in the directors’ report for the financial year for which the financial statements are prepared is consistent with the financial statements.
Matters on which we are required to report by exceptionWe have nothing to report in respect of the following matters where the Companies Act 2006 requires us to report to you if, in our opinion:
U adequate accounting records have not been kept, or returns adequate for our audit have not been received from branches not visited by us; or
U the financial statements are not in agreement with the accounting records and returns; or
U certain disclosures of directors’ remuneration specified by law are not made; or
U we have not received all the information and explanations we require for our audit.
Other matterWe have reported separately on the consolidated financial statements of Begbies Traynor Group plc for the year ended 30 April 2013.
William Smith MA ACA (Senior Statutory Auditor)for and on behalf of Deloitte LLPChartered Accountants and Statutory Auditor Manchester, United Kingdom3 July 2013
Independent auditor’s reportto the members of Begbies Traynor Group plc

48 Begbies Traynor Group plc Annual Report and Accounts 2013
Financial statements
2013 2012
Notes £’000 £’000
Fixed assetsInvestment in subsidiaries 3 23,675 23,675
Current assetsDebtors 4 33,938 36,343
Creditors: amounts falling due within one yearOther creditors and accruals (476) (50)Borrowings 5 (109) (132)
(585) (182)
Net current assets 33,353 36,161
Total assets less current liabilities 57,028 59,836Creditors: amounts falling due after more than one yearBorrowings 5 (18) (127)
Net assets 57,010 59,709
Capital and reservesCalled-up share capital 6 4,663 4,651Share premium account 7 17,581 17,524Merger reserve 7 17,584 17,584Profit and loss account 7 17,182 19,950
Shareholders’ funds 8 57,010 59,709
The financial statements of Begbies Traynor Group plc, registered number 5120043, were approved by the board of directors and authorised for issue on 3 July 2013. They were signed on its behalf by:
Ric Traynor Nick TaylorExecutive chairman Group finance director
Company balance sheetat 30 April 2013

49Begbies Traynor Group plc Annual Report and Accounts 2013
Financial statements
Notes to the company financial statementsfor the year ended 30 April 20131. Significant accounting policiesBasis of accountingThe separate financial statements of the company have been prepared under the historical cost convention and in accordance with applicable United Kingdom law and accounting standards.
The principal accounting policies are summarised below. They have all been applied consistently throughout the year and the preceding year.
InvestmentsFixed asset investments in subsidiaries are shown at cost less provision for impairment. The carrying value of fixed asset investment is reviewed for impairment if events or changes in circumstances indicate that the carrying value may not be recoverable.
Share-based paymentsThe fair value of services received in exchange for the grant of options is recognised as an expense over the vesting period in accordance with FRS 20. Options are valued using the Black-Scholes option pricing model. Further details are provided in note 22 of the consolidated financial statements.
2. Profit for the yearAs permitted by section 408 of the Companies Act 2006, the company has elected not to present its own profit and loss account for the year. Begbies Traynor Group plc reported a loss for the financial year ended 30 April 2013 of £477,000 (2012: profit of £1,447,000).
The company has no employees (2012: no employees).
The auditor’s remuneration for audit and other services is disclosed in note 5 to the consolidated financial statements.
3. Investment in subsidiaries£’000
CostAt 1 May 2012 and 30 April 2013 29,810
Provision for impairmentAt 1 May 2012 and 30 April 2013 6,135
Net book valueAt 30 April 2012 and 30 April 2013 23,675
Details of principal operating subsidiary entities are set out below. These undertakings are included in the consolidated group financial statements and are 100% owned.
Subsidiary undertaking Nature of business Country of incorporation
Begbies Traynor Limited* Holding company England and WalesBTG Consulting Limited* Holding company England and WalesBegbies Traynor International Limited* Holding company England and WalesBegbies Traynor (Central) LLP Insolvency England and WalesBTG Corporate Finance LLP (formerly BTG Financial Consulting LLP) Corporate finance England and WalesBTG Global Risk Partners Limited Investigation agency England and WalesBTG Financial Consulting LLP (formerly BTG Consulting LLP) Financial consulting England and Wales
* Interest is controlled by subsidiary undertakings, except where marked where shares are held directly by Begbies Traynor Group plc
All shareholdings relate to ordinary shares.
The directors of the company are of the opinion that the value of the investments in subsidiaries, as underpinned by their membership benefits in the operating entities of the group, is not less than the cost of those investments.
4. Debtors2013 2012
£’000 £’000
Amounts falling due within one yearAmounts owed by group undertakings 33,804 36,202Other debtors 134 141
33,938 36,343
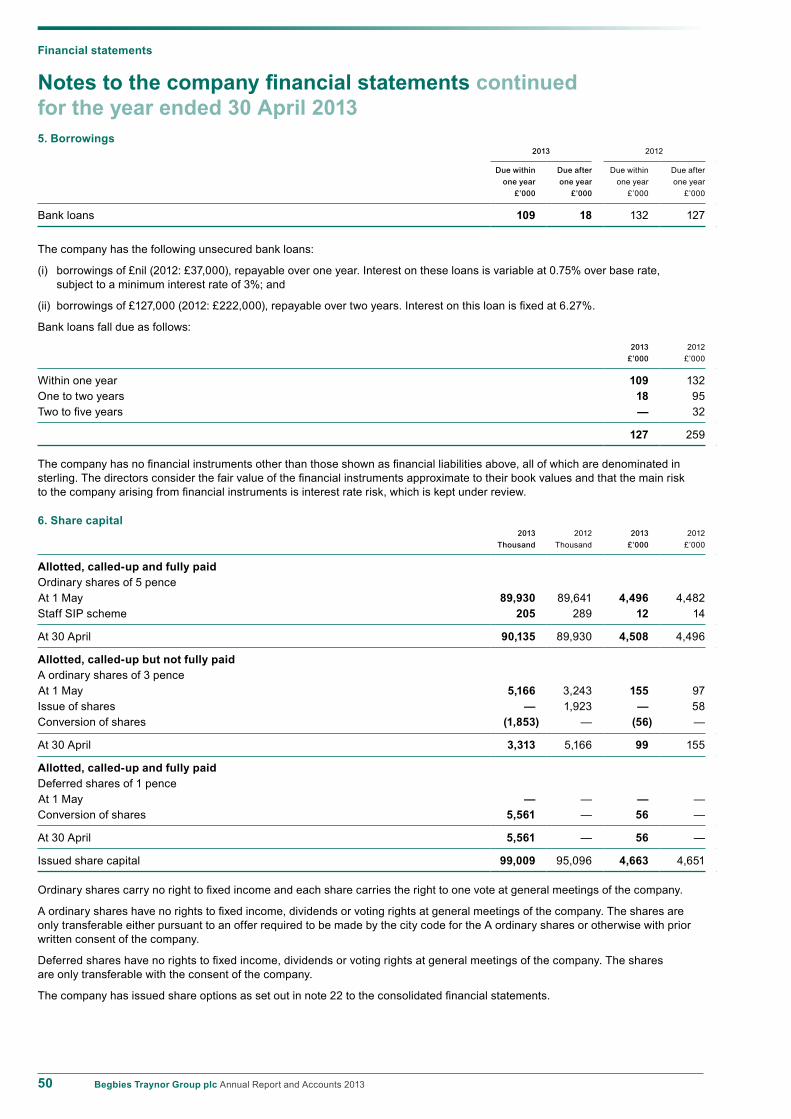
50 Begbies Traynor Group plc Annual Report and Accounts 2013
Financial statements
Notes to the company financial statements continuedfor the year ended 30 April 20135. Borrowings
2013 2012
Due within Due after Due within Due afterone year one year one year one year
£’000 £’000 £’000 £’000
Bank loans 109 18 132 127
The company has the following unsecured bank loans:
(i) borrowings of £nil (2012: £37,000), repayable over one year. Interest on these loans is variable at 0.75% over base rate, subject to a minimum interest rate of 3%; and
(ii) borrowings of £127,000 (2012: £222,000), repayable over two years. Interest on this loan is fixed at 6.27%.
Bank loans fall due as follows:
2013 2012£’000 £’000
Within one year 109 132One to two years 18 95Two to five years — 32
127 259
The company has no financial instruments other than those shown as financial liabilities above, all of which are denominated in sterling. The directors consider the fair value of the financial instruments approximate to their book values and that the main risk to the company arising from financial instruments is interest rate risk, which is kept under review.
6. Share capital 2013 2012 2013 2012
Thousand Thousand £’000 £’000
Allotted, called-up and fully paidOrdinary shares of 5 penceAt 1 May 89,930 89,641 4,496 4,482Staff SIP scheme 205 289 12 14
At 30 April 90,135 89,930 4,508 4,496
Allotted, called-up but not fully paidA ordinary shares of 3 penceAt 1 May 5,166 3,243 155 97Issue of shares — 1,923 — 58Conversion of shares (1,853) — (56) —
At 30 April 3,313 5,166 99 155
Allotted, called-up and fully paidDeferred shares of 1 penceAt 1 May — — — —Conversion of shares 5,561 — 56 —
At 30 April 5,561 — 56 —
Issued share capital 99,009 95,096 4,663 4,651
Ordinary shares carry no right to fixed income and each share carries the right to one vote at general meetings of the company.
A ordinary shares have no rights to fixed income, dividends or voting rights at general meetings of the company. The shares are only transferable either pursuant to an offer required to be made by the city code for the A ordinary shares or otherwise with prior written consent of the company.
Deferred shares have no rights to fixed income, dividends or voting rights at general meetings of the company. The shares are only transferable with the consent of the company.
The company has issued share options as set out in note 22 to the consolidated financial statements.

51Begbies Traynor Group plc Annual Report and Accounts 2013
7. ReservesShare
premium Merger Profit andaccount reserve loss account£’000 £’000 £’000
At 1 May 2012 17,524 17,584 19,950Loss for the year — — (477)Shares issued 57 — —Dividends — — (1,980)Credit to equity for equity-settled share-based payments — — 99Modification to share-based payments — — (410)
At 30 April 2013 17,581 17,584 17,182
The merger reserve arose on the formation of the group in 2004.
8. Reconciliation of movements in equity shareholders’ funds2013 2012
£’000 £’000
At 1 May 59,709 59,964Proceeds of share issues, net of costs:– nominal share capital 12 72– share premium account 57 81(Loss) profit for the year (477) 1,447Dividends (1,980) (1,973)Credit to equity for equity-settled share-based payment 99 118Modification to cash-settled share-based payment (410) —
At 30 April 57,010 59,709
52 Begbies Traynor Group plc Annual Report and Accounts 2013
Shareholder information
Officers and professional advisors
Directors R W Traynor E N Taylor M R Fry R G McInnes J M May G D Hill (resigned 5 July 2012)
SecretaryJ A Humphrey
Company number5120043
Registered office340 Deansgate Manchester M3 4LY
BankersHSBC Bank plc4 Hardman Square Spinningfields Manchester M3 3EB
Santander UK plcManchester Corporate Business Centre 298 Deansgate Manchester M3 4HH
M&G UK Companies Financing Fund II LLPLaurence Pountney Hill London EC4R 0HH
SolicitorsBrabners LLP55 King Street Manchester M2 4LQ
AuditorDeloitte LLPChartered accountants and statutory auditor Manchester
RegistrarComputershare Investor Services PlcPO Box 82, The Pavilions Bridgwater Road Bristol BS99 6ZZ
Corporate and financial PR advisorsMHP Communications Limited60 Great Portland Street London W1W 7RT
Nominated advisor and joint brokerCanaccord Genuity Limited88 Wood Street London EC2V 7QR
Joint brokerShore Capital Stockbrokers LimitedThe Corn Exchange Fenwick Street Liverpool L2 7RB