BEFORE THE HON’BLE
100
BEFORE THE HON’BLE TAMIL NADU ELECTRICITY REGULATORY COMMISSION, CHENNAI FILING OF THE PETITION FOR FINAL TRUE-UP OF FY 2011-12 TO FY 2015-16 AND ARR FOR FY 2016-17 TO FY 2018-19 UNDER TNERC (TERMS AND CONDITIONS FOR DETERMINATION OF TARIFF) REGULATIONS, 2005 AND TNERC (MULTI YEAR TARIFF FRAMEWORK) REGULATIONS, 2009 AMENDED FROM TIME TO TIME & UNDER PART VII (SECTION 61 TO SECTION 64) OF THE ELECTRICITY ACT, 2003 READ WITH THE RELEVANT GUIDELINES FILED BY TAMILNADU GENERATION AND DISTRIBUTION CORPORATION LIMITED (TANGEDCO) CHENNAI
Transcript of BEFORE THE HON’BLE
BEFORE THE HON’BLE
TAMIL NADU ELECTRICITY REGULATORY COMMISSION,
CHENNAI
FILING OF THE PETITION FOR FINAL TRUE-UP OF FY 2011-12 TO FY
2015-16 AND ARR FOR FY 2016-17 TO FY 2018-19
UNDER TNERC (TERMS AND CONDITIONS FOR DETERMINATION OF TARIFF)
REGULATIONS, 2005 AND TNERC (MULTI YEAR TARIFF FRAMEWORK)
REGULATIONS, 2009 AMENDED FROM TIME TO TIME
&
UNDER PART VII (SECTION 61 TO SECTION 64) OF THE ELECTRICITY ACT, 2003
READ WITH THE RELEVANT GUIDELINES
FILED BY TAMILNADU GENERATION AND DISTRIBUTION CORPORATION
LIMITED (TANGEDCO)
CHENNAI

Petition for Final True-up for FY 2011-12 to FY 2015-16, ARR for FY 2017-18 to FY 2018-19
Table of Contents
1. OVERVIEW OF TANGEDCO ....................................................................................................................... 2
1.1 PREAMBLE ................................................................................................................................................ 2
1.2 BACKGROUND ........................................................................................................................................... 2
1.3 FINAL TRANSFER SCHEME ............................................................................................................................ 4
1.4 FINANCIAL RESTRUCTURING PLAN (FRP) ........................................................................................................ 5
1.5 UJWAL DISCOM ASSURANCE YOJANA (UDAY) ................................................................................................ 6
1.6 OPERATIONAL PERFORMANCE OF TANGEDCO ............................................................................................... 7
2. OVERALL APPROACH FOR PRESENT FILING ............................................................................................ 17
2.1 PRESENT APPROACH................................................................................................................................. 17
2.2 DATA/INFORMATION FOR ARR .................................................................................................................. 18
2.3 REGULATORY FRAMEWORK ........................................................................................................................ 18
2.4 SUMMARY OF ASSUMPTIONS ..................................................................................................................... 18
3. FINAL TRUING UP OF FY 2011-12 TO FY 2015-16.................................................................................... 20
3.1 PREAMBLE .............................................................................................................................................. 20
3.2 PRINCIPLES FOR FINAL TRUING UP OF FY 2011-12 TO FY 2015-16 ................................................................. 20
3.3 OPERATIONAL PERFORMANCE PARAMETERS – GENERATION ............................................................................ 20
3.4 PLANT LOAD FACTOR (PLF) ....................................................................................................................... 22
3.5 AUXILIARY CONSUMPTION ......................................................................................................................... 23
3.6 STATION HEAT RATE (SHR) ....................................................................................................................... 24
3.7 SPECIFIC OIL CONSUMPTION ...................................................................................................................... 26
3.8 FUEL RELATED PARAMETERS ...................................................................................................................... 27
3.9 NET GENERATION .................................................................................................................................... 28
3.10 COMPUTATION OF FUEL EXPENSES FOR FY 2011-12 TO FY 2015-16............................................................... 29
3.11 SUMMARY OF VARIABLE COST FOR FY 2011-12 TO FY 2015-16 .................................................................... 29
3.12 CAPITAL EXPENDITURE AND CAPITALIZATION ................................................................................................. 32
3.13 FIXED COST FOR FY 2011-12 TO FY 2015-16 ............................................................................................. 33
3.14 DEPRECIATION ........................................................................................................................................ 34
3.15 INTEREST ON LOAN AND OTHER FINANCE CHARGES ........................................................................................ 35
3.16 INTEREST ON WORKING CAPITAL ................................................................................................................ 36
3.17 RETURN ON EQUITY ................................................................................................................................. 37
3.18 OPERATION AND MAINTENANCE EXPENSES ................................................................................................... 39
3.19 OTHER DEBITS ........................................................................................................................................ 40
3.20 OPERATING CHARGES AND EXTRA-ORDINARY ITEMS....................................................................................... 41
3.21 OTHER INCOME ....................................................................................................................................... 42
3.22 NON-TARIFF INCOME ............................................................................................................................... 43
3.23 PRIOR PERIOD ITEMS ................................................................................................................................ 43
3.24 SUMMARY OF FIXED COST OF TANGEDCO FOR FY 2011-12 TO FY 2015-16 .................................................. 44
3.25 TOTAL COST FOR FY 2011-12 TO FY 2015-16 ............................................................................................ 50
3.26 POWER PURCHASE EXPENSES FOR FY 2011-12 TO FY 2015-16 ..................................................................... 51
3.27 REVENUE FROM SALE OF POWER ................................................................................................................. 52
3.28 IMPACT OF WHEELING UNITS AND COST ...................................................................................................... 52
3.29 ENERGY BALANCE EXCLUDING WHEELING UNITS ........................................................................................... 53
Petition for Final True-up for FY 2011-12 to FY 2015-16, ARR for FY 2017-18 to FY 2018-19
3.30 T&D LOSS .............................................................................................................................................. 53
3.31 SUMMARIZED ARR AND REVENUE GAP FOR FY 2011-12 TO FY 2015-16 ........................................................ 55
4. ANNUAL AGGREGATE REVENUE REQUIREMENT FOR FY 2016-17 TO FY 2018-19 ................................... 57
4.1 PREAMBLE .............................................................................................................................................. 57
4.2 OPERATIONAL PERFORMANCE .................................................................................................................... 57
4.3 PLANT LOAD FACTOR ................................................................................................................................ 57
4.4 AUXILIARY CONSUMPTION ......................................................................................................................... 58
4.5 STATION HEAT RATE (SHR) ....................................................................................................................... 58
4.6 SPECIFIC OIL CONSUMPTION ...................................................................................................................... 58
4.7 FUEL RELATED PARAMETERS ...................................................................................................................... 59
4.8 PERFORMANCE TRAJECTORIES TO DETERMINE VARIABLE COST OF THE OWN GENERATION PLANT .............................. 60
4.9 GENERATION FROM THE STATE OWNED POWER PLANT ................................................................................... 66
4.10 COMPUTATION OF FUEL EXPENSES FOR FY 2016-17 TO 2018-19 ................................................................... 67
4.11 SUMMARY OF VARIABLE COST FOR FY 2016-17 TO FY 2018-19 .................................................................... 68
4.12 CAPITAL EXPENDITURE AND CAPITALIZATION ................................................................................................. 69
4.13 FIXED COST FOR FY 2016-17 TO FY 2018-19 ............................................................................................. 70
4.14 DEPRECIATION ........................................................................................................................................ 70
4.15 INTEREST ON LOAN AND FINANCE CHARGES .................................................................................................. 71
4.16 INTEREST ON WOKING CAPITAL .................................................................................................................. 73
4.17 REASONABLE RATE OF RETURN ON EQUITY ................................................................................................... 74
4.18 OPERATION & MAINTENANCE EXPENSES ...................................................................................................... 75
4.19 OTHER DEBITS ........................................................................................................................................ 77
4.20 OTHER INCOME ....................................................................................................................................... 78
4.21 NON-TARIFF INCOME ............................................................................................................................... 79
4.22 SUMMARY OF FIXED COST FOR FY 2016-17 TO FY2018-19 .......................................................................... 79
4.23 SALES ESTIMATION FOR FY 2016-17 AND FY 2018-19 ................................................................................. 84
4.24 TRANSMISSION CHARGES .......................................................................................................................... 86
4.25 POWER PURCHASE EXPENSES FOR FY 2016-17 TO FY 2018-19 ..................................................................... 86
4.26 ENERGY AVAILABILITY FOR FY 2016-17 TO FY 2018-19 ................................................................................ 88
4.27 ENERGY BALANCE FOR FY 2016-17 TO FY 2018-19 ..................................................................................... 90
4.28 MERIT ORDER DISPATCH ........................................................................................................................... 90
4.29 SUMMARIZED ARR AND REVENUE GAP FOR FY 2016-17 TO FY 2018-19 ........................................................ 91
5. SUMMARY OF REVENUE GAP TOTAL REVENUE GAP TO BE RECOVERED ................................................ 92
5.1 TOTAL REVENUE GAP TO BE RECOVERED ...................................................................................................... 92
6. PRAYERS ................................................................................................................................................ 93
6.1 TANGEDCO RESPECTFULLY PRAYS TO THE HON'BLE COMMISSION: .................................................................. 93

Petition for Final True-up for FY 2011-12 to FY 2015-16, ARR for FY 2017-18 to FY 2018-19
List of Tables Table 1: Plant Load Factor (%) .............................................................................................................. 23
Table 2: Auxiliary Consumption (%) ...................................................................................................... 24
Table 3: Station Heat Rate (kCal/kWh) ................................................................................................. 24
Table 4: Specific Oil Consumption (ml/kWh) ........................................................................................ 27
Table 5: Gross Calorific Value-Thermal Stations (kCal/kg) (kCal/scm) ................................................. 27
Table 6: Price of Primary Fuel-Thermal Stations (Rs. /MT) (Rs. /SCM) ................................................. 28
Table 7: Net Generation (in MUs) ......................................................................................................... 28
Table 8: Variable Cost for FY 2011-12 to FY 2015-16 (Rs. Crores) ..................................... 29
Table 9: Variable Cost per Unit for FY 2011-12 to FY 2015-16 (Rs. /kWh) ........................................... 29
Table 10: Summary of Variable Cost for FY 2011-12 ............................................................................ 30
Table 11: Summary of Variable Cost for FY 2012-13 ............................................................................ 30
Table 12: Summary of Variable Cost for FY 2013-14 ............................................................................ 31
Table 13: Summary of Variable Cost for FY 2014-15 ............................................................................ 31
Table 14: Summary of Variable Cost for FY 2015-16 ............................................................................ 32
Table 15: Capitalization for FY 2011-12 to FY 2015-16 ......................................................................... 33
Table 16: Depreciation for FY 2011-12 to FY 2015-16 .......................................................................... 35
Table 17: Interest and Finance Charges FY 2011-12 to FY 2015-16 ...................................................... 35
Table 18: Interest on Working Capital for FY 2011-12 to FY 2015-16 .................................................. 37
Table 19: Return on Equity for FY 2011-12, to FY 2015-16 ................................................................... 38
Table 20: O&M Expenses for FY 2011-12 to FY 2015-16 ...................................................................... 40
Table 21: Other Debits for FY 2011-12 to FY 2015-16 .......................................................................... 41
Table 22: Operating Charges and Extra Ordinary Item for FY 2011-12 to FY 2015-16 ......................... 42
Table 23: Other Income for FY 2011-12 to FY 2015-16......................................................................... 43
Table 24: Non Tariff Income for FY 2011-12 to FY 2015-16 .................................................................. 43
Table 25: Summary of Fixed Cost for FY 2011-12 ................................................................................. 45
Table 26: Summary of Fixed Cost for FY 2012-13 ................................................................................. 46
Table 27: Summary of Fixed Cost for FY 2013-14 ................................................................................. 47
Table 28: Summary of Fixed Cost for FY 2014-15 ................................................................................. 48
Table 29: Summary of Fixed Cost for FY 2015-16 ................................................................................. 49
Table 30: Total Cost of Generation and Distribution Function of TANGEDCO for FY 2011-12 to FY
2015-16 ................................................................................................................................................. 50
Table 31: Power Purchase Expenses for FY 2011-12 to FY 2015-16 ..................................................... 51
Table 32: Sales and Revenue from sale of power for FY 2011-12 to FY 2015-16 ................................. 52
Table 33: Wheeling Adjustment in Sales for FY 2011-12 to FY 2015-16 ............................................... 53
Table 34: Wheeling Adjustment in Power Purchase for FY 2011-12 to FY 2015-16 ............................. 53
Table 35: Energy Balance Statement for FY 2011-12 to FY 2015-16 excluding wheeling units............ 53
Table 36: Annual Revenue Requirement of TANGEDCO for FY 2011-12 to FY 2015-16 ....................... 56
Table 37: Plant Load Factor - FY 2016-17 to 2018-19 ........................................................................... 57
Table 38: Auxiliary Consumption - FY 2016-17 to FY2018-19 ............................................................... 58
Table 39: Station Heat Rates of Thermal Power Plants – FY 2016-17 to FY 2018-19 (k Cal/kWh) ....... 58

Petition for Final True-up for FY 2011-12 to FY 2015-16, ARR for FY 2017-18 to FY 2018-19
Table 40: Specific Oil Consumption (ml/kWh) – FY 2016-17 to FY 2018-19 ......................................... 59
Table 41: GCV of Coal/Gas for FY 2016-17 to FY 2018-19 (kcal/kg) ..................................................... 59
Table 42: Price of Coal/Gas for FY 2016-17 to FY 2018-19 (Rs. /MT) (Rs. /SCM) ................................. 60
Table 43: Performance Trajectories of Coal based generating plant ................................................... 61
Table 44: Performance Trajectories of Gas based generating plant .................................................... 65
Table 45: Gross and Net Generation from Own Plant during FY 2016-17 to FY 2018-19..................... 67
Table 46: Fuel Cost for FY 2016-17 to FY 2018-19 ................................................................................ 67
Table 47: Summary of Variable Cost for FY 2016-17 ............................................................................ 68
Table 48: Summary of Variable Cost for FY 2017-18 ............................................................................ 68
Table 49: Summary of Variable Cost for FY 2018-19 ............................................................................ 69
Table 50: Capitalization for FY 2016-17 to FY 2018-19 ......................................................................... 70
Table 51: Depreciation for FY 2016-17 to FY 2018-19 .......................................................................... 71
Table 52: Interest & Finance Charges for FY 2016-17 to FY 2018-19 ................................................... 73
Table 53: Interest on Working Capital for FY 2016-17 to 2018-19 ....................................................... 74
Table 54: Return on Equity for FY 2016-17 to FY 2018-19 .................................................................... 75
Table 55: O&M Expenses for FY 2016-17 to FY 2018-19 ...................................................................... 77
Table 56: Other Debits for FY 2016-17 to FY 2018-19 .......................................................................... 78
Table 57: Other Income for FY 2016-17 to FY 2018-19......................................................................... 79
Table 58: Non-Tariff Income FY 2016-17 to FY2018-19 (Distribution) ................................................. 79
Table 59: Summary of Fixed Cost for FY 2016-17 ................................................................................. 80
Table 60: Summary of Fixed Cost for FY 2017-18 ................................................................................. 81
Table 61: Summary of Fixed Cost for FY 2018-19 ................................................................................. 82
Table 62: Projected Total Cost from FY 2016-17 to FY 2018-19 ........................................................... 83
Table 63: Sales for FY 2016-17 to 2018-19 ........................................................................................... 85
Table 64: Power Purchase Expenses for FY 2016-17 to FY 2018-19 ..................................................... 87
Table 65: Energy availability from FY 2016-17 to FY 2018-19 .............................................................. 89
Table 66: Energy Balance Statement for FY 2016-17 to FY 2018-19 .................................................... 90
Table 67: Annual Revenue Requirement for FY 2016-17 to FY 2018-19 .............................................. 91
Table 68: Consolidated Revenue Gap ................................................................................................... 92
Petition for Final True-up for FY 2011-12 to FY 2015-16, ARR for FY 2017-18 to FY 2018-19
List of Abbreviations Sr. No Abbreviations Descriptions
1. A&G Administrative and General
2. AS Aggregate Revenue Requirement
3. BBGTPS Basin Bridge Gas Turbine Power Station
4. CAPEX Capital Expenditure
5. CERC Central Electricity Regulatory Commission
6. CPPs Captive Power Plants
7. Crs Crores
8. Discom Distribution Companies
9. ECL Eastern Coal Fields Ltd
10. ETPS Ennore Thermal Power Station
11. FY Financial Year
12. GFA Gross Fixed Assets
13. G.O. Government Order
14. GoTN Government of Tamil Nadu
15. HT High Tension
16. HEP Hydro Electric Power
17. IPP Independent Power Producers
18. KGTPS Kuttalam Gas Turbine Power Station
19. KV Kilo Volt
20. kVA Kilo Volt Ampere
21. FY Financial Year
22. GFA Gross Fixed Assets
23. G.O. Government Order
24. GoTN Government of Tamil Nadu
25. HT High Tension
26. HEP Hydro Electric Power
27. IPP Independent Power Producers
28. KGTPS Kuttalam Gas Turbine Power Station
29. KV Kilo Volt
30. kVA Kilo Volt Ampere
31. kVAh Kilo Volt Ampere Hour
32. kW Kilo Watt
33. kWh Kilo Watt Hour
34. LT Low Tension
35. MCL Mahanadhi Coal Fields Ltd
36. MOD Merit Order Despatch
37. kVAh Kilo Volt Ampere Hour
38. kW Kilo Watt

Petition for Final True-up for FY 2011-12 to FY 2015-16, ARR for FY 2017-18 to FY 2018-19
Sr. No Abbreviations Descriptions
39. kWh Kilo Watt Hour
40. LT Low Tension
41. MCL Mahanadhi Coal Fields Ltd
42. MOD Merit Order Despatch
43. MOU Memorandum of Understanding
44. MTPS Mettur Thermal Power Station
45. MU Million Units (Million kWh)
46. MVA Mega Volt Ampere
47. MW Mega Watt
48. MYT Multi Year Tariff
49. NCTPS North Chennai Thermal Power Station
50. NTP National Tariff Policy
51. NTPC National Thermal Power Corporation
52. O&M Operation & Maintenance
53. PAF Plant Availability Factor
54. PFC Power finance Corporation
55. PLF Plant Load Factor
56. R&M Repair and Maintenance
57. ROE Return on Equity
58. RPO Renewable Purchase Obligation
59. Rs Rupees
60. SBI State Bank of India
61. SHR Station Heat Rate
62. T&D Transmission and Distribution
63. TNEB Tamil Nadu Electricity Board
64. TANGEDCO Tamil Nadu Generation and Distribution Corporation Limited
65. TANTRANSCO Tamil Nadu Transmission Corporation Limited
66. TKGTPS Thirumakottai Gas Turbine Power Station
67. TNERC Tamil Nadu Electricity Regulatory Commission
68. TTPS Tuticorin Thermal Power Station
69. VGTPS Valuthur Gas Turbine Power Station
Petition for Final True-up for FY 2011-12 to FY 2015-16, ARR for FY 2017-18 to FY 2018-19
Page 1
BEFORE THE TAMIL NADU ELECTRICITY REGULATORY COMMISSION
CHENNAI
Filing No:
Case No:
IN THE MATTER OF Filing of Petition for Final True Up of FY 2011-12 to FY 2015-16 and Aggregate Revenue Requirement Determination for FY 2016-17 to FY 2018-19 under TNERC (Terms and Conditions for Determination of Tariff) Regulations, 2005 and of MYT under TNERC (Multi Year Tariff Framework) Regulations, 2009 amended from time to time along with other guidelines and directions issued by the TNERC and under Part VII (Section 61 to Section 64) of the Electricity Act, 2003 read with the relevant Guidelines.
AND
IN THE MATTER OF Tamil Nadu Generation and Distribution Corporation Limited,
N.P.K.R.R Maligai,
144, Anna Salai,
Chennai 600 002 ..…PETITIONER
THE APPLICANT NAMED ABOVE RESPECTFULLY SHOWETH UNDER

Petition for Final True-up for FY 2011-12 to FY 2015-16, ARR for FY 2017-18 to FY 2018-19
Page 2
1. OVERVIEW OF TANGEDCO
1.1 Preamble
1.1.1 This section presents the background and reasons for filing of this Petition.
1.2 Background
1.2.1 Tamil Nadu Electricity Board (TNEB) came into existence on 1st July 1957 under the repealed
Act of Electricity (Supply) Act 1948 and has been in the business of generation, transmission
and distribution of electricity in the state of Tamil Nadu.
1.2.2 Over the last few decades, there has been significant interest in opening the Electricity
sector to competition and, by extension, interest in designing electricity markets to push the
sector toward more efficient outcomes. Accordingly, the Electricity Act, 2003 (“the Act” or
“EA 2003”) was enacted with effect from 10th June, 2003 which requires the State
Governments to initiate major changes in the Industry Structure and Operations of the state
power sector. The objective of the enactment was to make competition feasible or desirable
in a sector that has been vertically integrated and highly regulated or state owned.
1.2.3 In line with the Electricity Act 2003, Sections 131 to 134 mandates reorganisation of the
State Electricity Boards into functional entities and corporatisation of the same. Regardless
of the design of the electricity sector reforms, the ultimate goal of reforms is to make the
sector more efficient. Therefore, in order to meet the requirements under the Act and to
become more efficient and competitive, the Government of Tamil Nadu (GoTN) and the
Tamil Nadu Electricity Board (TNEB) proposed to restructure the state power sector.
1.2.4 In accordance with the above mandate the Government of Tamil Nadu (GoTN) had given in-
principle approval for the re-organization of TNEB by establishing a holding company, named
TNEB Ltd and two subsidiary companies, namely Tamil Nadu Transmission Corporation
Limited (TANTRANSCO) and Tamil Nadu Generation and Distribution Corporation Limited
(TANGEDCO) vide G.O.Ms.No.114 Energy (B2) Department dated 8th October 2008 with the
stipulation that the aforementioned companies shall be fully owned by Government.
1.2.5 Based on the approval of Memorandum of Association and Articles of Association of
TANGEDCO and TNEB Limited by the Government of Tamil Nadu vide G.O.Ms.No.94 Energy
(B2) Department dated 16th Nov 2009, Tamil Nadu Generation and Distribution Corporation
Limited (TANGEDCO) and TNEB Limited was incorporated on 1st Dec 2009 with an authorized
share capital of Rs. 5.00 Crores and paid up capital of Rs. 5.00 Lakhs each for TANGEDCO and
TNEB Limited. The Certificates of commencement of business have been obtained for the
TANGEDCO on 16th Mar 2010 and for TNEB Ltd on 12th Mar 2010 respectively.
Petition for Final True-up for FY 2011-12 to FY 2015-16, ARR for FY 2017-18 to FY 2018-19
Page 3
1.2.6 The proposal for Assets Transfer and Employee transfer called as Tamil Nadu Electricity
Board (Reorganization and Reforms) Transfer Scheme 2010 has been notified by
Government of Tamil Nadu vide G.O. (Ms).No.100 Energy (B2) Department dated 19th Oct
2010 with the effective date of implementation as 1st Nov 2010. Based on the above
notification TNEB has been re-organized from 1st Nov 2010.
1.2.7 As per the Transfer Scheme the Provisional period for transfer of Assets is 1 year and for
transfer of employees is 3 years. From 1st Nov 2010 onwards all the employees of the
erstwhile TNEB shall stand transferred to and absorbed in TANGEDCO on a provisional basis
and assigned to the services of the relevant transferee.
1.2.8 Subsequently, as per the request of TNEB Limited, the second provisional transfer scheme
was notified by the State Government vide G.O. (Ms.) No.2, Energy (B2) department, dated
2nd January 2012 with amendment in the restructuring of Balance Sheet of TNEB for the
successor entities i.e. TANGEDCO and TANTRANSCO, considering the audited balance sheet
of TNEB for FY 2009-10 and it had extended the provisional time for final transfer of assets
and liabilities to the successor entities of erstwhile TNEB up to 31st Oct 2012.
1.2.9 Subsequently, the audited balance sheet as on 31.10.2010 was ready and as a result the final
transfer scheme was notified by the Government of Tamilnadu vide G.O.Ms No.49, Energy
(B1) department, dated 13th August 2015, which is the final amendment to the earlier
transfer scheme (G.O. (Ms).No.100 Energy (B2) Department dated 19th Oct 2010 and G.O.
(Ms.) No.2, Energy (B2) department, dated 2nd January 2012) which gave effect to the
transfer of assets and liabilities to successor entities of erstwhile TNEB as on 01.11.2010
1.2.10 Post restructuring, TANGEDCO as per the notification was provided with the functions of
generation and distribution of electricity in the State of Tamil Nadu.
1.2.11 The enactment of the Electricity Act, 2003 has opened up the power sector for competition
in all spheres of activities. TANGEDCO as the State Generation and Distribution Utility is
entrusted with the duty of generating power and distribution of the same to the end
consumers through its generating stations and vast distribution network.
1.2.12 Starting with a modest installed capacity of 156 MW on 1st July 1957, the Board’s own
generating capacity in its command has grown to 27,625.45 MW as on 1st April 2016.
TANGEDCO has an even mix of the various generating capacities such as 4,660 MW of coal
based thermal stations, 516 MW of Gas Turbine Stations and 2,308 MW of Hydro Stations. In
addition, there is an infirm power of 17 MW from Wind Farms. Besides, the Board has a
Petition for Final True-up for FY 2011-12 to FY 2015-16, ARR for FY 2017-18 to FY 2018-19
Page 4
share of 5,464 MW from Central Generating Stations, 9,649 MW of non-conventional energy
sources (including Wind, solar), 987 MW from CPP and 4,042 MW from long term and
medium term open access (LTOA & MTOA) and IPPs. The present demand of power in the
State is ~14,500 - 15,000 MW and reached an all-time high of 15,343 MW and high energy
consumption of 345.617 MUs on 29th April 2016.
1.3 Final Transfer Scheme
1.3.1 The accumulated losses of erstwhile TNEB to an extent of Rs. 34,741.35 Crores has been
adjusted in the Final Transfer Scheme notified vide G.O. M.S No. 49 dated 13th August 2015,
by revaluation of assets to an extent of 54,658.71 Crores and the excess evaluation reserve
of Rs. 12,265.99 Crores, Rs. 7,163.58 Crores and Rs. 487.79 Crores transferred to
TANGEDCO, TANTRANSCO and TNEB Ltd. respectively. Through the notification of final
transfer scheme the Government of Tamil Nadu has assigned the Assets and Liabilities (as on
31.10.2010) to TANGEDCO on final basis.
1.3.2 Impact of Final Balance Sheet:
The transfer value of the Fixed Assets forming part of Schedules A, B and C of the respective
Transferees have been done at book values excluding the land, buildings, plant and
machineries, lines, cables and network, which are revalued based on the guideline value
resulting into Revaluation Reserve of Rs.12,265.99 Crores for TANGEDCO.
i. For the purpose of Return on Equity, Equity Capital of Rs. 2,290.72 Crores has been
considered as per the final transfer scheme.
ii. Long Term Loan has been considered as Rs. 19,307.65 Crores in line with the notified
balance sheet and interest is calculated on the actual basis which was accrued from
1st November 2010 to 31st March 2011 and the differential treatment between
provisional and final transfer scheme has been adjusted in the FY 2015-16. Some of
the generic loans such as bonds, loan from HUDCO, LIC, Tamil Nadu Power fin and
Medium Term Loan availed by erstwhile TNEB and has been considered as the long
term loan of TANGEDCO.
iii. The allocation of fixed assets and loans are similar and has been transferred under
the Final transfer scheme resulting in additional debt burden of the debt obligation
on TANGEDCO.
iv. The transfer value of the fixed assets is determined based on revenue potentials of
the asset and in line with the provisions of the Act.
TANGEDCO submits that the opening balance sheet as per final transfer scheme has
been considered for the calculation of ARR in the present petition.
v. TANGEDCO requests the Hon’ble Commission to allow the variation in expenses with
respect to Final transfer scheme and allow the same to adjust in the ARR in the
current petition.
Petition for Final True-up for FY 2011-12 to FY 2015-16, ARR for FY 2017-18 to FY 2018-19
Page 5
1.4 Financial Restructuring Plan (FRP)
1.4.1 As per the guidelines for financial restructuring plan (FRP) of utilities framed by an exert
committee of Government of India, TANGEDCO has formulated a Financial Restructuring
Plan (FRP) to enable a turn around, financial sustainability and long term viability of the state
utility. The key aspects of the Financial Restructuring Plan (FRP) approved by State
Government in December 2012 are as follows.
The eligible amount of short term liabilities worked out for financial restructuring of
TANGEDCO is Rs. 24,422 Crores as on 31st March 2012 which includes Short Term
Loans, Medium Term Loans, Non-CAPEX loans from TNPFC and Power Purchase
Liability.
Even though, TANGEDCO is eligible for restructuring of Rs. 24,422 crores as on
31.03.2012, the actual amount considered for restructuring as on 30.09.2012 is Rs
12,765.35 Crores only.
Around 50% of the eligible amount of short term liabilities i.e. Rs. 6,353.49 Crores is
to be taken over by the State Government by issue of bonds/ special securities of
Government and for which TANGEDCO has issued Bonds to the lenders. The balance
50% of short term liabilities has to be restructured by banks.
The State Government has provided a sum of Rs. 2,000 Crore as Budget estimate for
FY 2014-15 for taking over of bonds issued by TANGEDCO under FRP. Out of the
above, the State Government has taken over bonds to the tune of Rs. 1,000 Crore on
27th June 2014.
‘The State Government will take over the liability over next five years by issuance of
special securities in favour of participating lenders in the phased manner keeping
the fiscal space available till the entire loan is taken over by the State Government.
The process of taking over a portion of the bonds during 2014-15 is under progress
at the GoTN.
The 50% short term loans payable to various commercial Banks (24 banks) to the
extent of Rs.5951.43 crores have been restructured and consequently, its
repayment commitments has been postponed for a period of 7 years after the initial
moratorium period of 3 years.
Under FRP, a business Plan was approved and the Bankers concerned are committed
to provide loan assistance to TANGEDCO being their share of the 100% of estimated
cash loss funding for the financial year 2012-13, 75% of operating loss related to
financial year 2013-14 and 50% of operating loss related to financial year 2014-15.
Accordingly, the lenders have been funding their share in the estimated losses for
2012-13 & 2013-14 as long term loans to TANGEDCO and the GOTN is also
sanctioning and releasing the share of 25% in estimated loss under FRP for the year
2013-14. The availment of loan assistances for the financial year 2014-15 from
lenders and GOTN is sanctioning and releasing the share of 50% estimated loss
under FRP for the year 2014-15.
All the assistances availed by TANGEDCO shall be backed with Government
Petition for Final True-up for FY 2011-12 to FY 2015-16, ARR for FY 2017-18 to FY 2018-19
Page 6
Guarantee as per FRP and the Government of Tamil Nadu has provided guarantee to
the extent of Rs. 23,835.46 Crores.
1.5 Ujwal Discom Assurance Yojana (UDAY)
1.5.1 On 09.01.2017, the Ministry of Power, Government of India entered in to an Memorandum
of Understanding (MoU) with the Government of Tamil Nadu and TANGEDCO under the
Ujwal Discom Assurance Yojana (UDAY) Scheme for the operational and financial turnaround
of the DISCOM.
1.5.2 TANGEDCO is expected to derive overall benefits of 11,000 Crores through UDAY by way of
savings in interest cost, reduction in AT&C loss, coal rationalisation and energy efficiency
measures etc.
1.5.3 The salient features of the scheme are as follows:
Under the scheme, the Government of Tamil Nadu is taking over 75% of the outstanding
distribution function debt of Rs. 30,420 Crores of TANGEDCO as on 30th September, 2015
during FY 2016-17 itself.
The balance 25% outstanding debt to be re-priced or re-issued as State guaranteed
Discom bonds at coupon rates 3-4% lower than the average existing interest rate.
The reduction in debt and reduced interest rates (on balance debt) to have savings of Rs.
950 Crores in interest cost annually.
Commitment to bring about operational efficiency through compulsory feeder and
distribution transformer metering, consumer indexing & GIS mapping of losses,
upgrade/change transformers, meters etc., smart metering of high-end consumers,
reduction in transmission losses and increased power supplies in areas with reduced
AT&C losses.
Additional revenue of around Rs. 1,601 crores to TANGEDCO by way of reduction in
AT&C losses and transmission losses to 13.50% by FY 2018-19 and 3.89% by FY 2019-20
respectively.
Gain of Rs. 2,882 Crores annually on account of interest on loan taken over by
Government of Tamil Nadu and savings in cash flow on account relief from loan
repayment around Rs.2282 Crores per year. Totally Rs 5164 crores in cash flow savings
per year on account of interest and loan repayment relief.
Gain of Rs. 2304 Crores through implementation of demand side management measures
like usage of energy efficient LED bulbs, agricultural pumps, fans and air-conditioners,
etc, efficient industrial equipment’s through PAT scheme (Perform, Achieve and Trade)
(to reduce peak load, flatten load curve).
Incentives to the State Government and the Discom for improving the power
Petition for Final True-up for FY 2011-12 to FY 2015-16, ARR for FY 2017-18 to FY 2018-19
Page 7
infrastructure in the State and for lowering the cost of power from Central Government.
Additional/priority funding through the Central schemes such as Deen Dayal Upadhyay
Gram Jyoti Yojana (DDUGJY), Integrated Power Development Scheme (IPDS), Power
Sector Development Fund (PSDF) or such other schemes of the Ministries of Power and
New & Renewable Energy subject to adherence to operational milestones outlined in
the scheme.
Gain of 4320 Crores through Coal reforms like additional coal at notified prices, coal
swapping, coal rationalization, correction in coal grade slippage, availability of 100%
washed coal and crushed coal to reduce the cost of power and in case of availability
through higher capacity utilization, low cost power from NTPC and other CPSUs.
1.6 Operational performance of TANGEDCO
1.6.1 The State has been maintaining almost 24 hours of power supply to all categories of
consumers including agriculture sector. The R&C measures have been completely withdrawn
from June, 2016. The State of Tamil Nadu does not have its own coal resource and has to
source its requirements partly from the Eastern Coal Fields Ltd. (ECL) and Mahanadi Coal
Fields Ltd. (MCL) mines situated in West Bengal and Orissa respectively & during February
last year Chandrabila coal block was allotted to TANGEDCO for ETPS Expansion project,
Ennore SEZ project Udangudi Stage I. TANGEDCO at its end is also trying to tap other power
sources viz hydel potential has been tapped to its fullest potential. Tamil Nadu has a friendly
policy for encouraging non-conventional sources of power such as wind, solar, co-generation
etc. Tamil Nadu has the largest wind power capacity of about 7,617 MW and solar capacity
of 1143.41 MW as on 30th June 2016. However, besides being infirm in nature, the power
from wind sources is available mostly during June to September. Apart from this, the State
has four independent Power Producers (IPP) plants in operation at present.
1.6.2 TANGECO is making continuous efforts to add generation capacity, in spite of constraints on
its financial resources. The increase in power demand is being met by power purchase from
central generating stations such as NLC and joint venture project at Vallur and Tuticorin
implemented along with NTPC and NLC respectively and also the increase in non-
conventional source of power.
1.6.3 Similarly on the own generation end, TANGEDCO had made an addition of 600 MW of
capacity through Mettur Generating Station Stage III during FY 2013-14 and the North
Chennai Thermal Power Station Stage II with an additional capacity of 1200 MW during FY
2014-15.
1.6.4 The distribution network of TANGEDCO comprises of 66kV, 33kV, 22kV and 11kV sub-
transmission system. TANGEDCO owns and operates an extensive distribution network
Petition for Final True-up for FY 2011-12 to FY 2015-16, ARR for FY 2017-18 to FY 2018-19
Page 8
consisting of 7.81 Lakhs Ckt. Kms of lines, of which 1.70 Lakhs Ckt. kms of HT Line Network
and 6.11 Lakhs Ckt. Kms of LT line Network as on 31st March 2016. It also owns and operates
majority of the generation assets in the state and is buyer of power from the Government of
India owned (Central) generating stations and private producers in the state. It also owns
1,395 substations and 2,67,421 distribution transformers with a total capacity of 30,920
MVA as on 30th June 2016. TANGEDCO is also making continuous efforts towards
strengthening the distribution networks to reduce the AT&C losses in the system to a target
level of below 15% by FY 2018-19 through implementation of the following schemes.
a) Re-structured Accelerated Power Development and Reforms Programme (R-APDRP)
b) Integrated Power Development Scheme (IPDS),
c) Deendayal Upadhyaya Gram Jyoti Yojana (DDUGJY)
1.6.5 Re-structured Accelerated Power Development and Reforms Programme (R-APDRP):
1.6.5.1 The objectives of the R-APDRP Scheme are to provide quality and reliable power supply
to the consumers and to bring down the AT&C losses below 15%. The project is taken up
in two parts Part-A and Part-B.
1.6.5.2 Part-A
An amount of Rs.417 Crores towards Part-A (Information Technology) implementation in
110 towns and Rs.182.17 Crores towards Part-A (SCADA) for SCADA / DMS ( Supervisory
Control and Data Acquisition System / Distribution Management System )
implementation in 7 towns has been sanctioned.
1.6.5.3 Scope:
Establishment of IT enabled system for achieving reliable & verifiable baseline data
system in all towns with population greater than 30,000 as per 2001 census 10,000 for
Special Category States) Installation of SCADA/DMS for towns with population greater
than 4 lakhs & annual input energy greater than 350MU is also envisaged under Part-A.
100% loan is provided under R-APDRP for Part-A projects & shall be converted to grant
on completion and verification of same by Third Party independent Evaluating agencies
(TPIEA) appointed by MoP / Nodal Agency.
Scope of Work : Installation and commissioning of Data center at Chennai, Customer
Care Center at Chennai, Disaster Recovery Center at Madurai, 17 Nos software modules,
50961 Nos of Modems, 2332 Feeder Meters, 50136 DT metering, 825 Ring Fencing
Points, IT hardware for 1367 offices, 342 Data concentrator unit and Geographical
information system (GIS) survey for 85.28 Lakhs consumers for an amount of 308.08
Crores.
Petition for Final True-up for FY 2011-12 to FY 2015-16, ARR for FY 2017-18 to FY 2018-19
Page 9
1.6.5.4 Sanctioned Dates
a) Part-A (IT):
(i) DPRS for 27 towns were sanctioned on 27.02.2009 for Rs. 70.04 Crs
(ii) DPRS for 83 towns were sanctioned on 30.06.2009 for Rs. 346.96 Crores.
b) Part-A (SCADA):
DPRs for 7 towns sanctioned on 08.12.2010 for Rs. 182.17 Cr.
1.6.5.5 Scheduled Completion Dates:
i. As per the sanction Part-A projects are to be completed within 3 years from the date
of sanction for getting the loan converted into grant.
ii. In the order dt. 8th July 2013, extension has been given for 2 years i.e upto
30.06.2014.
iii. Subsequently, the due date for completion of the project has been extended upto
30.06.2015.
iv. In the 6th meeting of the Monitoring Committee for implementation of IPDS held on
10th December 2015, extension has been given for 1 year i.e upto 30.06.2016.
v. In the 8th meeting of the IPDS Monitoring Committee for implementation of IPDS
held on 26th July 2016, extension has been given upto 31.03.2017.
1.6.5.6 LOA details for the R-APDRP :
i. A LoA was awarded to IT Consultancy i.e. M/s. Feedback Infrastructure Services Pvt
Lt. in consortium with M/s.Mastek Ltd. for an amount of Rs. 93.75 Lakhs for 4 years.
The contract has been extended for 2 years upto 23.06.15 @ Rs.3 Lakhs per month
as the retainer fees. The contract has been extended for another one year upto
23.06.16. Further the contract has been extended for 1 year upto 23.06.17 @ Rs
2.70 Lakhs per month as the retainer fees.
ii. A LoA was awarded to IT Implementation Agency i.e. M/s. ITI Ltd. in consortium with
M/s.Navayuga Infotech Pvt. Ltd for an amount of Rs. 307.28 Cr. on 14.10.2010
iii. A LoA was awarded to SCADA/DMS Implementation Agency i.e. M/s.
ICSA/Hyderabad in consortium with M/s.Dong Fang Electronics Pvt. Ltd, China for an
amount of Rs.139.79 Cr.
1.6.5.7 Present status of R-APDRP Part-A works:
i. “Go-Live” Status:
Out of 110 towns, 102 towns have been made “Go-Live”. The Balance 8 towns are
proposed to be made ‘Go Live’ in phases.
ii. Part-A (SCADA)
An amount of Rs.182.17 Crores has been sanctioned for Part-A SCADA / DMS
(Supervisory Control and Data Acquisition System / Distribution Management
System) in 7 towns.
Petition for Final True-up for FY 2011-12 to FY 2015-16, ARR for FY 2017-18 to FY 2018-19
Page 10
SCADA/DMS Control Centre equipments have been commissioned in all the 7
towns viz. Chennai, Madurai, Salem, Trippur, Tirunelveli, Trichy & Coimbatore.
SCADA / DMS including field equipments viz., Sub-station RTU (Remote Terminal
Unit) and FRTU (Feeder Remote Terminal Unit) in RMU’s (Ring Main Units) has
been completed in Trichy & Tirunelveli.
Installation & commissioning of SCADA equipments and DMS will be completed
in the balance towns.
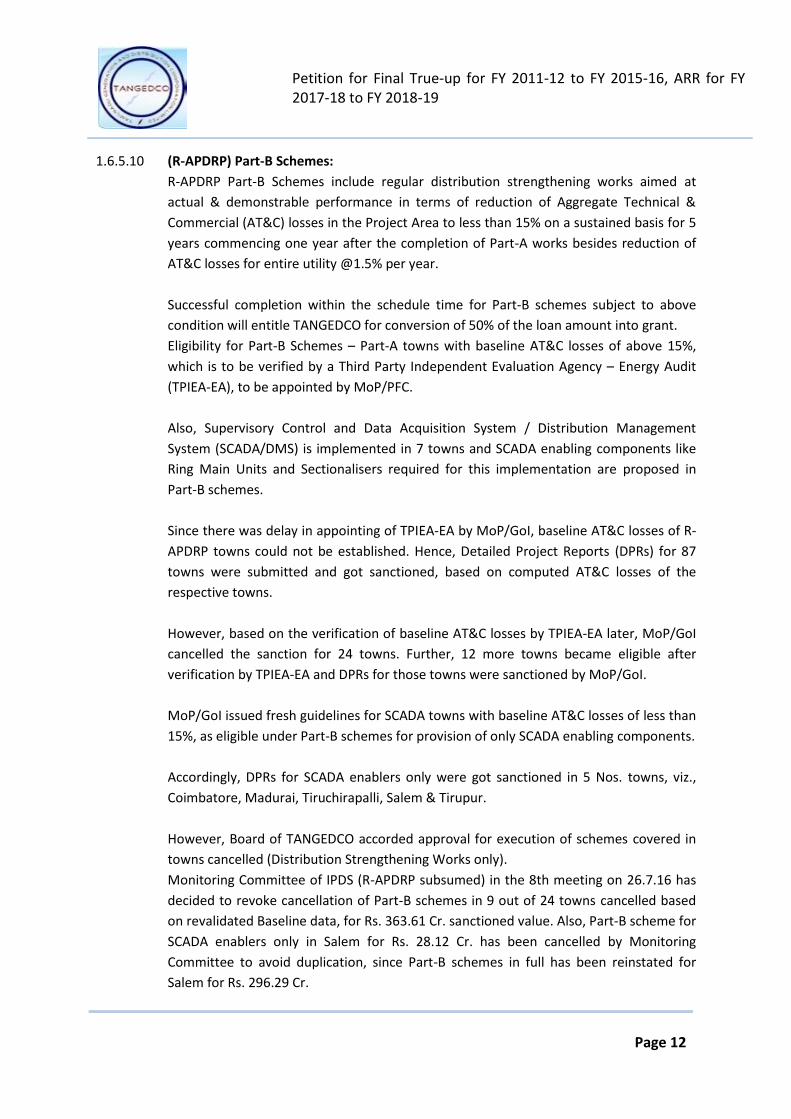
1.6.5.8 RAPDRP – Part –B ( Total 88 towns ) Progress & Program :
i) Part-B scheme works completed - 59 towns
(Nellikuppam, Srivilliputhur, Melvisharam, Tirupathur, Rameswaram, Bodinayakanur, Sivagangai, Periyakulam, Dharapuram, Theni, Kambam, Arni,
Vaniyambadi, Arakkonam, Panruti, Chidambaram, Cuddalore, Devakottai, Palani, Ambur, Gudiyatham, Kallakurichi, Gudalur (Theni), Aruppukottai, Kanchipuram,
Tiruvallur, Mettupalayam, Coonoor, Puliyangudi, Sattur, Virudhunagar, Kollencode, Ramanathapuram, Aranthangi, Tenkasi, Vickramasingapuram, Melur,
Thirumangalam, Namakkal, Rasipuram, Attur, Kadayanallur, Hosur, Valparai, Gudalore, Chinnamanur, Dharmapuri, Krishnagiri, Ambasamudram, Sankarankoil,
Karur, Kumbakonam, Perambalur, Nagapattinam, Paramakudi, Tiruchirapalli, Tirupur, Madurai and Coimbatore towns)
ii) Programme for completion - 29 towns
Dec’16 3 Towns Jul’17 2 Towns
Jan’17 5 Towns Sep’17 5 Towns
Feb’17 5 Towns Dec’17 4 Towns
Mar’17 5 Towns
Total 88 Towns
Sl. No.
Description of Work Completed
Towns (No.) Works Pending Towns
(No.) and Progress (in %)
1 Establishment of new Sub-stations and Sub-station augmentation works (84 towns)
81 towns (100%)
3 towns (80%)
2 Distribution Strengthening Works on turnkey contracts (in 84 towns)
55 towns (100%)
18 towns (80%), 4 towns (75%), 3 towns (45%), 4 towns (to be taken up)
3 Automatic Power Factor Correction (APFC) panels on turnkey contract (in 72 towns)
52 towns (100%)
20 towns (88%)
4 Replacement of Consumer Meters with tamper proof electronic meters departmentally (84 towns)
60 towns (100%)
24 towns (94%)

Petition for Final True-up for FY 2011-12 to FY 2015-16, ARR for FY 2017-18 to FY 2018-19
Page 11
5 Ring Main Units (RMUs) on turnkey contract (in 8 towns)
7 towns (100%) 1 town (98%)
6 Installation of Automated sectionalisers on turnkey contract (7 towns)
7 towns (100%) All towns completed
1.6.5.9 R-APDRP Part-B Funding pattern
Total No. of schemes - 88 towns
Scheme Sanction Cost (88 Towns ) - Rs. 2841.21 Cr.
a. GoI loan portion (88 towns)
Total funding amount - Rs. 710.30 Cr.
Documentation completed - 88 towns
Funds received (72 towns) - Rs. 382.51 Cr.
Utilisation Certificate submitted - Rs. 327.97 Cr.
Funds due to be received (25 towns) - Rs. 43.66 Cr.
b. Counterpart funding from M/s PFC (24 towns)
Total funding amount - Rs. 1328.64 Cr.
Documentation completed - 14 towns
Funds received (14 towns) - Rs. 315.39 Cr.
Utilisation Certificate submitted - Rs. 280.34 Cr.
Documentation pending - 10 towns
c. Counterpart funding from M/s REC (64 towns)
Total funding amount - Rs. 802.28 Cr.
Documentation completed - 64 towns
Utilisation Certificate submitted - Rs. 242.63 Cr.
Funds received (49 towns) - Rs. 242.63 Cr.
d. Amount to be refunded/adjusted to MoP/PFC for
GoI loan released for 15 cancelled towns - Rs. 109.42 Crores
Petition for Final True-up for FY 2011-12 to FY 2015-16, ARR for FY 2017-18 to FY 2018-19
Page 12
1.6.5.10 (R-APDRP) Part-B Schemes:
R-APDRP Part-B Schemes include regular distribution strengthening works aimed at
actual & demonstrable performance in terms of reduction of Aggregate Technical &
Commercial (AT&C) losses in the Project Area to less than 15% on a sustained basis for 5
years commencing one year after the completion of Part-A works besides reduction of
AT&C losses for entire utility @1.5% per year.
Successful completion within the schedule time for Part-B schemes subject to above
condition will entitle TANGEDCO for conversion of 50% of the loan amount into grant.
Eligibility for Part-B Schemes – Part-A towns with baseline AT&C losses of above 15%,
which is to be verified by a Third Party Independent Evaluation Agency – Energy Audit
(TPIEA-EA), to be appointed by MoP/PFC.
Also, Supervisory Control and Data Acquisition System / Distribution Management
System (SCADA/DMS) is implemented in 7 towns and SCADA enabling components like
Ring Main Units and Sectionalisers required for this implementation are proposed in
Part-B schemes.
Since there was delay in appointing of TPIEA-EA by MoP/GoI, baseline AT&C losses of R-
APDRP towns could not be established. Hence, Detailed Project Reports (DPRs) for 87
towns were submitted and got sanctioned, based on computed AT&C losses of the
respective towns.
However, based on the verification of baseline AT&C losses by TPIEA-EA later, MoP/GoI
cancelled the sanction for 24 towns. Further, 12 more towns became eligible after
verification by TPIEA-EA and DPRs for those towns were sanctioned by MoP/GoI.
MoP/GoI issued fresh guidelines for SCADA towns with baseline AT&C losses of less than
15%, as eligible under Part-B schemes for provision of only SCADA enabling components.
Accordingly, DPRs for SCADA enablers only were got sanctioned in 5 Nos. towns, viz.,
Coimbatore, Madurai, Tiruchirapalli, Salem & Tirupur.
However, Board of TANGEDCO accorded approval for execution of schemes covered in
towns cancelled (Distribution Strengthening Works only).
Monitoring Committee of IPDS (R-APDRP subsumed) in the 8th meeting on 26.7.16 has
decided to revoke cancellation of Part-B schemes in 9 out of 24 towns cancelled based
on revalidated Baseline data, for Rs. 363.61 Cr. sanctioned value. Also, Part-B scheme for
SCADA enablers only in Salem for Rs. 28.12 Cr. has been cancelled by Monitoring
Committee to avoid duplication, since Part-B schemes in full has been reinstated for
Salem for Rs. 296.29 Cr.
Petition for Final True-up for FY 2011-12 to FY 2015-16, ARR for FY 2017-18 to FY 2018-19
Page 13
Summarising, 88 Nos. Part-B schemes are being implemented in TANGEDCO for a total
sanction value of Rs. 2841.21 Crores.
Cancellation of Part-B schemes in remaining 15 out of 24 towns has been upheld by
Monitoring Committee and GoI upfront amount (15% of sanctioned cost) received
towards these towns of Rs. 109.42 Cr. along with accrued interest shall be refunded or
adjusted from future releases from GoI / Counterpart funding of PFC.
1.6.6 Integrated Power Development Scheme (IPDS)
1.6.6.1 Coverage:
522 Statutory Towns (as per Census 2011) in 31 districts spread across 37 Electricity
Distribution Circles.
1.6.6.2 Objectives:
(i) 24x7 Power supply for all
(ii) AT&C Losses reduction
(iii) Electrification of all urban households
1.6.6.3 Scope of work:
(i) Strengthening of sub-transmission and distribution network,
(ii) Metering of feeders, boundary points, DTs and all consumers,
(iii) Completion of missing links under the establishment of National Optical Fibre
Network (NOFN) and
(iv) Provision of Solar panels on Government building and Net Metering.
1.6.6.4 Funding:
(i) Grant by MoP/GoI - 60%
(ii) Lending from FIIs - 30%
(iii) Utility own funds - 10%
1.6.6.5 District Electricity Committee (DEC) consultation: DECs have been constituted and
operationlised in all the 31 Districts covering 37 EDCs. Consultation with DECs of 31
Districts is completed as on 31.12.2015 and the MoMs have been furnished to the nodal
agency.
Petition for Final True-up for FY 2011-12 to FY 2015-16, ARR for FY 2017-18 to FY 2018-19
Page 14
1.6.6.6 Distribution Reforms Committee (DRC): TN State DRC, in its meeting held on
24.08.2015, approved and recommended (i) all the 37 DPRs for Rs.1561.31 crores as
above and (ii) execution of IPDS works in partial turnkey and Departmental execution
modes. Approval of DRC is communicated to the nodal agency on 24.08.2015.
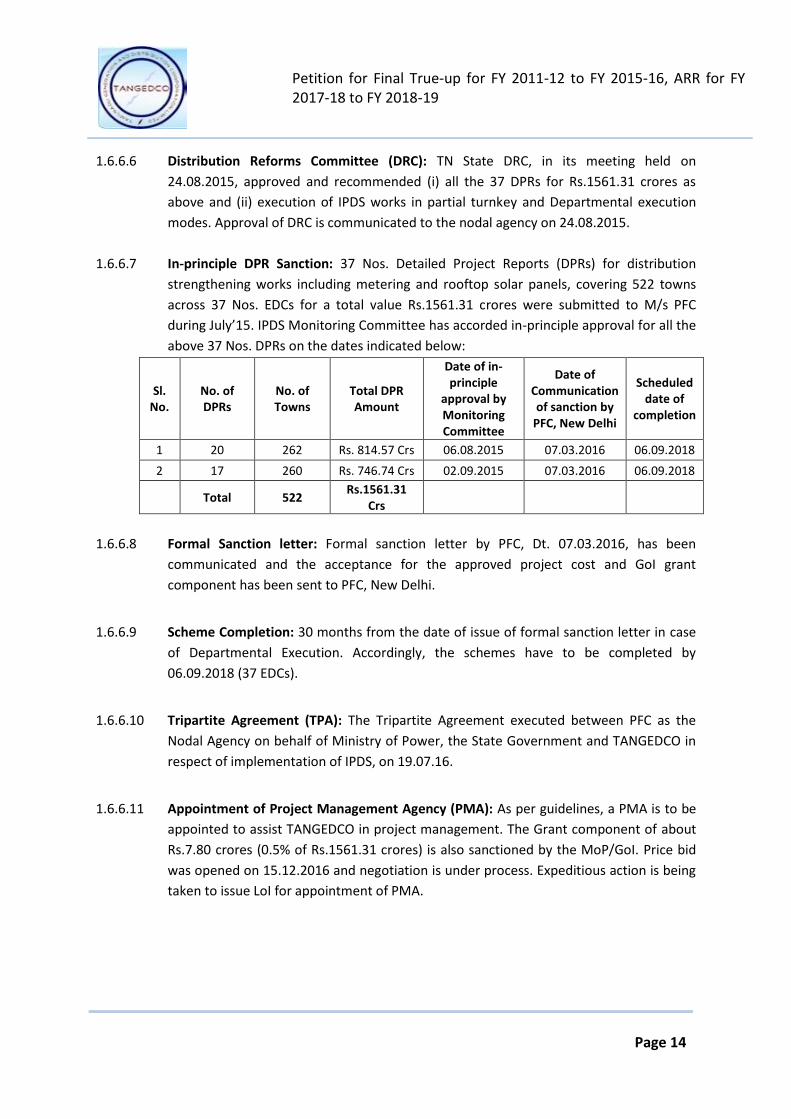
1.6.6.7 In-principle DPR Sanction: 37 Nos. Detailed Project Reports (DPRs) for distribution
strengthening works including metering and rooftop solar panels, covering 522 towns
across 37 Nos. EDCs for a total value Rs.1561.31 crores were submitted to M/s PFC
during July’15. IPDS Monitoring Committee has accorded in-principle approval for all the
above 37 Nos. DPRs on the dates indicated below:
Sl. No.
No. of DPRs
No. of Towns
Total DPR Amount
Date of in-principle
approval by Monitoring Committee
Date of Communication of sanction by
PFC, New Delhi
Scheduled date of
completion
1 20 262 Rs. 814.57 Crs 06.08.2015 07.03.2016 06.09.2018
2 17 260 Rs. 746.74 Crs 02.09.2015 07.03.2016 06.09.2018
Total 522 Rs.1561.31
Crs
1.6.6.8 Formal Sanction letter: Formal sanction letter by PFC, Dt. 07.03.2016, has been
communicated and the acceptance for the approved project cost and GoI grant
component has been sent to PFC, New Delhi.
1.6.6.9 Scheme Completion: 30 months from the date of issue of formal sanction letter in case
of Departmental Execution. Accordingly, the schemes have to be completed by
06.09.2018 (37 EDCs).
1.6.6.10 Tripartite Agreement (TPA): The Tripartite Agreement executed between PFC as the
Nodal Agency on behalf of Ministry of Power, the State Government and TANGEDCO in
respect of implementation of IPDS, on 19.07.16.
1.6.6.11 Appointment of Project Management Agency (PMA): As per guidelines, a PMA is to be
appointed to assist TANGEDCO in project management. The Grant component of about
Rs.7.80 crores (0.5% of Rs.1561.31 crores) is also sanctioned by the MoP/GoI. Price bid
was opened on 15.12.2016 and negotiation is under process. Expeditious action is being
taken to issue LoI for appointment of PMA.

Petition for Final True-up for FY 2011-12 to FY 2015-16, ARR for FY 2017-18 to FY 2018-19
Page 15
1.6.6.12 Execution: Approval has been accorded for TANGEDCO to execute IPDS works Turnkey +
Departmental basis through e-tendering for awarding all works including procurement
of equipments/materials.
TANGEDCO will follow the technical specifications finalized by the Committee-A in
respect of the key high value materials viz., Power Transformers with OLTC, Distribution
Transformers, Meters, UG Cables, HT AB cables and ACSR / AAC Conductors.
S. No. Description % of
Project Cost
Amount
(i) Grant by MoP/GoI 60% Rs. 936 Cr
(ii)
(ii) 50% out of 30% Funding from Financial Institution will be paid as additional grant for successful achievement of milestones stipulated such as timely completion, AT&C Loss Reduction and receiving the subsidy from State Govt.
15% Rs. 234 Cr
Total 75% Rs. 1170 Cr
Cost Item Qty
Unit Cost Rs Lac Existing Proposed
i) 100% Metering (Rs.345.15 cr.)
Consumer Meters 3214898 2245296 No. 23794.93
DT/Feeder/Boundary, Pre-paid/AMI, EM to Static Meters
- 75339 No. 10720.98
ii) 24x7 power supply (Rs.690.79 cr.)
New S/S 292 55 No. 12035.59
New HT Lines 9496.27 4301.13 ckt. Km. 30648.45
New LT Lines 36088.14 2149.17 ckt. Km. 10479.78
Under Ground Cables HT< 347.56 767.25 ckt. Km. 15916.06
iii) Reduction of AT&C losses (Rs.470.43 cr.)
Augmentation of existing S/S - 36 No. 3709.06
Augmentation of existing HT Lines - 26.46 ckt. Km. 433.16
Augmentation of existing LT Lines - 2701.8 ckt. Km. 8934.66
Distribution Transformer (New + Augmentation)
25907 15225 No. 33966.41
iv) Others (Rs.54.92 cr.)
Rooftop Solar panels - 1972 kWp 1380.47
Miscellaneous (Balance) lump sum 4111.73
Total Proposed Cost 156131.27
1.6.7 Deendayal Upadhyaya Gram Jyoti Yojana (DDUGJY)
Petition for Final True-up for FY 2011-12 to FY 2015-16, ARR for FY 2017-18 to FY 2018-19
Page 16
1.6.7.1 Government of India has launched Deendayal Upadhyaya Gram Jyoti Yojana (DDUGJY)
for the rural areas with the following components:
a. Separation of agriculture and non-agriculture feeders.
b. Strengthening and augmentation of sub-transmission & distribution (ST&D).
1.6.7.2 Rural electrification - The approval has been accorded for components a & b above
having scheme cost of Rs,43033 crore including a budgetary support of Rs.33453 crore
from GoI during the entire implementation period for all the states.
1.6.7.3 Total cost of the scheme
S. No.
Component Quantity Proposed Cost in Rs.
Crores
1 Replacement of Electro 1 Phase : 289635
119.66 Mechanical Meters 3 Phase : 28079
2 Feeder Segregation 29nos. 11KV feeders in Villupuram Region
125.94
3 Access to Rural Households 9063 Domestic House Holds (IA & I B)
56.74
4 System Strengthening
New 33/11KV Substations - 108 Nos.
617.18 Enhancement/Additional Power Transformers - 123 Nos.
Total Scheme cost 919.52
Provision for PMA at 0.5% of S.No.6
4.6
Total Cost 924.12
1.6.7.4 District Electricity Committee and State Level Standing Committee
DDUGJY scheme for Tamil Nadu is being implemented in 27nos. Districts covering
29nos. EDC.
District Electricity Committee (DEC) had been formed for all the 27 Districts.
Mop/GoI had requested to ensure wider participation of the Members of parliament
for projects under DDUGJY to chair functions relating to launch and inauguration of
projects under these schemes.
GoTN has been addressed to constitute the State Level Standing Committee (SLSC)
for the DDUGJY scheme headed by the Chief Secretary to GoTN.
Petition for Final True-up for FY 2011-12 to FY 2015-16, ARR for FY 2017-18 to FY 2018-19
Page 17
2. OVERALL APPROACH FOR PRESENT FILING
2.1 Present Approach
2.1.1 The Hon’ble Commission on 03rd August 2005 notified the TNERC (Terms and Conditions for
Determination of Tariff) Regulations, 2005. In the said Regulation, the Commission specified
that the licensee has to file the Aggregate Revenue Requirement (ARR) for each year in the
format prescribed, containing the details of the expected aggregate revenue that the
licensee is permitted to recover at the prevailing tariff and the estimated expenditure.
In line with the same, TANGEDCO is filing its ARR for consideration of the Hon’ble
Commission in the formats laid down for providing information relating to past, current and
future performance.
2.1.2 Further, as per TNERC (Terms and Conditions for Determination of Tariff) Regulations, 2005
the application for determination of tariff for the existing Generating Stations shall be
accompanied by information in the formats provided by the Hon’ble Commission for the
previous years, current year and ensuing years which are part of the control period as
specified in the MYT Regulations. Thus, TANGEDCO is filing the petition for True-up for both
the generation and distribution businesses.
2.1.3 As per the Amendment to Tamil Nadu Electricity Regulatory Commission Terms and
conditions for determination of tariff for intra state transmission / Distribution of Electricity
under MYT framework Regulations 2009 dated 28th November 2012, the control period is
defined as:
“(i) Control Period: The control period under the MYT framework shall be for duration of 3
years. The year preceding the first year of the control period shall be the base year.”
2.1.4 Based on the above amendment, the control period for TANGEDCO will be from FY 2013-14
to FY 2015-16 and then from FY 2016-17 to FY 2018-19.
2.1.5 In line with the same, TANGEDCO filed its MYT Petition for the Control Period (FY 2013-14 to
FY 2015-16) and Tariff Determination for consideration of the Hon’ble Commission. Based on
this petition and after considering views of the State Advisory Committee and the public,
Tamil Nadu Electricity Regulatory Commission passed the Order on 20/06/2013.
2.1.6 Subsequently, the Hon’ble Commission initiated suo-motu proceedings for tariff
determination in accordance with Section 64 of the Act and determined the ARR for FY
2014-15 in its order dated 11/12/2014.
Petition for Final True-up for FY 2011-12 to FY 2015-16, ARR for FY 2017-18 to FY 2018-19
Page 18
2.1.7 In accordance with section 62 of the Electricity Act 2003 and Regulation 5 of the TNERC
(Terms and Conditions for Determination of Tariff) Regulations, 2005, TANGEDCO is now
filing this present petition for approval of the True-up from FY 2011-12 to FY 2015-16 based
on the audited annual accounts. This Petition also includes the Aggregate Revenue
Requirement (ARR) for FY 2016-17 to FY 2018-19.
2.1.8 The approved figures considered for FY 2011-12 to FY2014-15 are in line with suo-moto
order dated 11.12.2014 and for FY 2015-16, the reference considered is in line with the tariff
order dated 20.06.2013.
2.2 Data/Information for ARR
2.2.1 This petition contains the truing-up of the ARR of FY 2011-12 to FY 2015-16, figures of which
are based upon the audited annual accounts which have been submitted to the Hon’ble
Commission earlier. The ARR for FY 2016-17 to FY 2018-19 has been projected based on the
past performance and expected growth in each of the cost element and revenue for the
ensuing year. TANGEDCO has studied the past trends and other internal and external
developments to estimate the projections for FY 2016-17 to FY 2018-19.
2.2.2 The ARR indicated in the given petition, is exclusive of Foreign Exchange Rate Variation (if
applicable), any statutory taxes, levies, duties, cess, filing fees or any other kind of
imposition(s) and/ or other surcharges etc. whatsoever imposed/ charged by any
Government (Central/State) and/ or any other local bodies/authorities/regulatory
authorities in relation to generation and distribution of electricity, environmental protection,
and/ or in respect of any of its installation associated with the Generation and Distribution
system and the same shall be allowed to be claimed by the Applicant in future as and when
such claims are made.
2.3 Regulatory Framework
2.3.1 TANGEDCO has considered the norms as specified by TNERC Tariff Regulations 2005, TNERC
MYT Regulations, 2009 and its subsequent amendment. However certain deviation has been
considered with a justification for the purpose of this petition and it is requested to approve
the same.
2.4 Summary of Assumptions
2.4.1 TANGEDCO has premised its present petition while projecting its revenue requirements on
the following:
a. Estimation of FY 2016-17 figures are based on actual of first eight months i.e. April,
2016 to November, 2016, which in turn forms the base for projection of figures for
FY 2017-18 to FY 2018-19.

Petition for Final True-up for FY 2011-12 to FY 2015-16, ARR for FY 2017-18 to FY 2018-19
Page 19
b. Escalation Factors have been considered for projecting certain expenses on a
realistic basis.
c. The figures mentioned in each of the tables are the amount in Rs. Crores unless
otherwise specified.
d. The impact of the final transfer scheme for FY 2010-11 has been considered in FY
2015-16 as the final transfer scheme was issued in FY 2015-16. The adjustment of
the revenue expenditure has been undertaken in the prior period items in line with
the accounting standard.
e. TANGECO submits that there has been no cost of generation (variable as well as
fixed) considered for own wind generating stations i.e. Tirunelveli Wind and
Udumalpet. However the net generation due to these wind mills has been
considered in total power purchase cost with a transfer price mechanism of Rs. 2.75
/unit as defined by the Hon’ble Commission in tariff order dated 30.03.2012.
f. The T&D loss calculated for the entire control period is without consideration of
wheeling units during the respective years.
Petition for Final True-up for FY 2011-12 to FY 2015-16, ARR for FY 2017-18 to FY 2018-19
Page 20
3. FINAL TRUING UP OF FY 2011-12 TO FY 2015-16
3.1 Preamble
3.1.1 This section outlines the performance of TANGEDCO for FY 2011-12, FY 2012-13, FY 2013-14,
FY 2014-15 and FY 2015-16. TANGEDCO hereby submits Final Truing up of FY 2011-12, FY
2012-13, FY 2013-14, FY 2014-15 and FY 2015-16 by comparing actual audited figures for
respective years with those approved by Hon’ble Commission vide tariff order dated 11th
December 2014.
3.2 Principles for Final Truing Up of FY 2011-12 to FY 2015-16
3.2.1 A comparison of the figures submitted by TANGEDCO in its previous petition, approved by
the Hon’ble Commission and figures based on audited accounts of respective years are
shown in the table under relevant sections discussed herein.
3.3 Operational Performance Parameters – Generation
3.3.1 This section outlines actual operational performance parameters of generation function of
TANGEDCO in order to derive variable cost of own generation, as compared to that
approved by Hon’ble TNERC in tariff order dated 11th December 2014.
3.3.2 The operational parameters like Plant Availability Factor (PAF), Plant Load Factor (PLF)
Station Heat Rate (SHR), Auxiliary Consumption (AC), Specific Oil Consumption etc, achieved
during FY 2011-12, FY 2012-13, FY 2013-14 and FY 2014-15 have been discussed in detail in
subsequent section. For the purpose of examination of performance of TANGEDCO, a
comparison has been made between values approved by the Hon’ble Commission with the
actual values achieved. The reasons for deviations for operational parameters, if any, have
been discussed simultaneously in the respective section.
3.3.3 The actual operating parameters derived during the respective years are dependent of
present condition of the machine. The present operating conditions of the machine is a
function of following factors.
Operation and Maintenance carried out in the plant since commissioning
Degradation due to ageing
Water Chemistry
Conditions of the Auxiliaries
Overloading and Partial Loading of machines
Number of Start/Stop
Temperatures and Pressures Stress-Machines have been subjected to
Automation of C&I

Petition for Final True-up for FY 2011-12 to FY 2015-16, ARR for FY 2017-18 to FY 2018-19
Page 21
Condenser Vacuum
3.3.4 Justification for Proposed Operational Parameters
a) Aging
There are frequent tube failures due to erosion in the old aged machines, which may
be caused by poor quality of coal and other constraints. Heat transfer gets affected
due to various reasons and SHR increases. Auxiliary Consumption & Sp. Oil
Consumption increases due to low load/partial load operation because of some
technical constraints. Also due to many other reasons like vibrations, eccentricity,
high bearing temperature cause failure of the respective auxiliary and cause
deterioration in performance parameters due to frequent start/stops. It happens in
older machines mainly, and newer machine hardly get affected by such reasons and
hence, their performance is found near to or at par with the normative values.
b) Design Constraints
It is submitted that the operational performance parameters for generating stations
defined by the Hon’ble Commission in TNERC (Terms and Conditions of Tariff)
Regulations, 2005 are based on the norms specified in CERC Tariff Regulations,
which in turn is based on design specifications of NTPC Power Plants. Most of the
NTPC power plants are available in the sets of 500 MW units due to which there is a
higher possibility of achieving target performance parameters as specified in the
Regulations.
It is further submitted that the most of the existing plants of TANGEDCO are
available in sets of 110 MW to 210 MW. The units being old and small in size, it
becomes very difficult to achieve the target performance parameters as specified in
the Tariff Regulations. It is therefore submitted that the actual performance
parameters as submitted in the present petition may kindly be approved.
c) Reasons for low performance of Ennore Thermal Power Station (ETPS)
All the Units at Ennore Thermal Power Station (ETPS) are operated under lesser load
due to chloride ingress owing to usage of contaminated cooling water, low
condenser vacuum, condenser tube failure, boiler tube punctures, turbine vibration,
rotor blade failure, etc. Being an old station, outages occur in various equipments
due to various reasons which have decreased the power generation.
The Ennore Thermal Power Station has not achieved the full load capacity since
inception and average Plant Load Factor is also less than 60% due to design
deficiency in 110 MW Units.
The major constraint in achieving higher and sustained generation with reduced
outages of the Units at Ennore Thermal Power Station is the highly contaminated
Petition for Final True-up for FY 2011-12 to FY 2015-16, ARR for FY 2017-18 to FY 2018-19
Page 22
cooling water (i.e.) the sea water available at Ennore creek.
Since contaminated cooling water is being used for the condenser cooling, the
cooling water corrodes the condenser tubes resulting in abnormal condenser tube
failures. Once the tube fails, the chloride in the cooling water mixes up with the De
Mineralized water resulting in scale formation in Boiler tubes and salt deposits on
Turbine blades.
This results in frequent failures of Boiler tubes, high axial shift in turbine and high
vibration of turbine rotors resulting in frequent blade failures. As the quality of
cooling water available is very poor, the condenser tubes are renewed periodically
besides carrying out repair in turbine rotors.
In Units-I&II (60 MW Boiler),the Boiler tube leakages were analyzed and observed
that the tube leakages were mainly due to flue gas erosion on account of high ash
content in the coal. In order to prevent tubes from erosion, shrouds and griddling
bands were provided. Subsequently the tube leakages have reduced.
Units III & IV (110 MW Boilers) have served for more than 9 years after R&M works.
Due to ageing and flue gas ducts erosion, punctures occurred in the R.H. bends. R.H.
bends were renewed partially during AOH period in 2008-09 & 2009-10. Balance RH
bends have been programmed to be renewed during the forthcoming AOH periods.
In Unit-V (110 MW) during R&M period, only partial pressure parts were renewed
(platen S.H. and Cold Reheated tubes). Other areas i.e. Water walls, Economizer,
Ceiling Super heater, Hot Reheated & Exit Super heater were not renewed. Boiler
has served more than 1, 50,000 hrs. Of service and entire boiler replacement was
not done during R&M as carried out in other units 1 to 4. Hence Boiler tube
leakages occur frequently. Subsequently RLA study was carried out during 2009.
Based on the RLA study reports, repair works are proposed to be carried out during
forthcoming capital overhaul. However the weak boiler tubes are being replaced
during every overhaul.
Since ETPS is having low capacity Units which have already served their life and
having perennial cooling water problem, frequent forced outages occur resulting in
low generation.
However rectification works are being taken up then and there to reduce the forced
outages in order to improve the generation and Plant Load Factor.
3.4 Plant Load Factor (PLF)
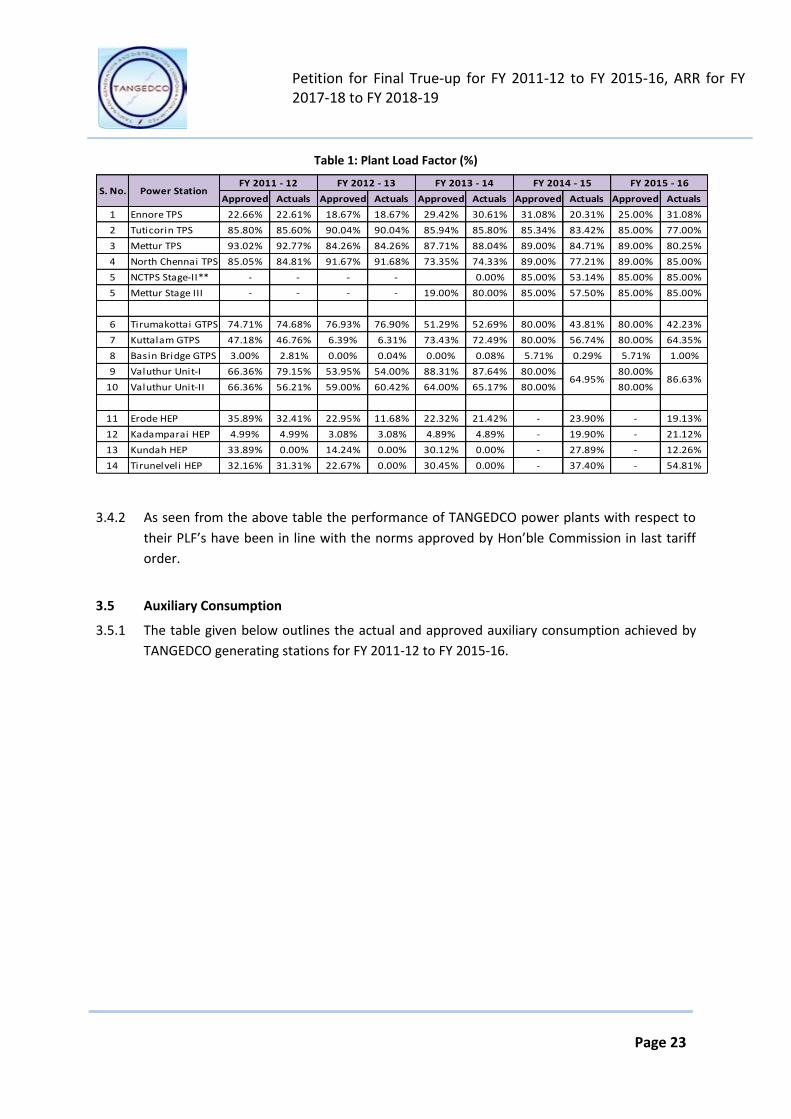
3.4.1 The table given below outlines the actual plant load factor achieved by TANGEDCO
generating stations for FY 2011-12 to FY 2015-16.
Petition for Final True-up for FY 2011-12 to FY 2015-16, ARR for FY 2017-18 to FY 2018-19
Page 23
Table 1: Plant Load Factor (%)
Approved Actuals Approved Actuals Approved Actuals Approved Actuals Approved Actuals
1 Ennore TPS 22.66% 22.61% 18.67% 18.67% 29.42% 30.61% 31.08% 20.31% 25.00% 31.08%
2 Tuticorin TPS 85.80% 85.60% 90.04% 90.04% 85.94% 85.80% 85.34% 83.42% 85.00% 77.00%
3 Mettur TPS 93.02% 92.77% 84.26% 84.26% 87.71% 88.04% 89.00% 84.71% 89.00% 80.25%
4 North Chennai TPS 85.05% 84.81% 91.67% 91.68% 73.35% 74.33% 89.00% 77.21% 89.00% 85.00%
5 NCTPS Stage-II** - - - - 0.00% 85.00% 53.14% 85.00% 85.00%
5 Mettur Stage III - - - - 19.00% 80.00% 85.00% 57.50% 85.00% 85.00%
6 Tirumakottai GTPS 74.71% 74.68% 76.93% 76.90% 51.29% 52.69% 80.00% 43.81% 80.00% 42.23%
7 Kuttalam GTPS 47.18% 46.76% 6.39% 6.31% 73.43% 72.49% 80.00% 56.74% 80.00% 64.35%
8 Basin Bridge GTPS 3.00% 2.81% 0.00% 0.04% 0.00% 0.08% 5.71% 0.29% 5.71% 1.00%
9 Valuthur Unit-I 66.36% 79.15% 53.95% 54.00% 88.31% 87.64% 80.00% 80.00%
10 Valuthur Unit-II 66.36% 56.21% 59.00% 60.42% 64.00% 65.17% 80.00% 80.00%
11 Erode HEP 35.89% 32.41% 22.95% 11.68% 22.32% 21.42% - 23.90% - 19.13%
12 Kadamparai HEP 4.99% 4.99% 3.08% 3.08% 4.89% 4.89% - 19.90% - 21.12%
13 Kundah HEP 33.89% 0.00% 14.24% 0.00% 30.12% 0.00% - 27.89% - 12.26%
14 Tirunelveli HEP 32.16% 31.31% 22.67% 0.00% 30.45% 0.00% - 37.40% - 54.81%
FY 2015 - 16
86.63%
S. No. Power StationFY 2011 - 12 FY 2012 - 13 FY 2013 - 14 FY 2014 - 15
64.95%
3.4.2 As seen from the above table the performance of TANGEDCO power plants with respect to
their PLF’s have been in line with the norms approved by Hon’ble Commission in last tariff
order.
3.5 Auxiliary Consumption
3.5.1 The table given below outlines the actual and approved auxiliary consumption achieved by
TANGEDCO generating stations for FY 2011-12 to FY 2015-16.
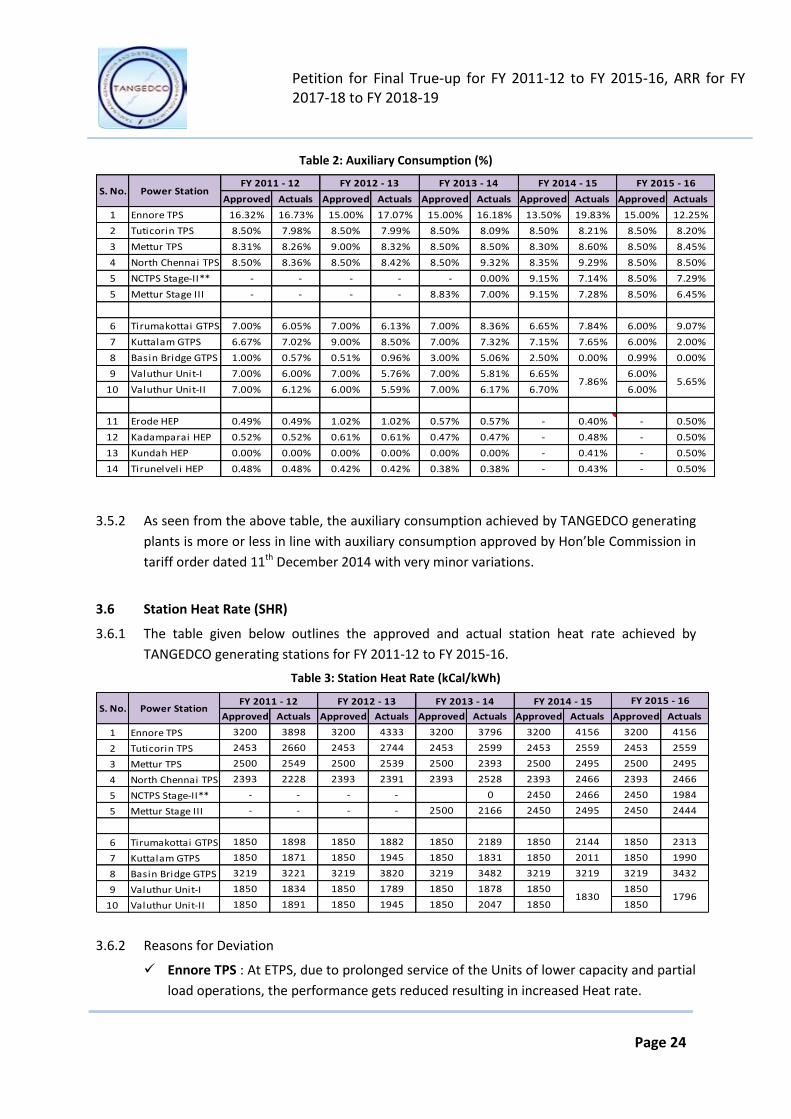
Petition for Final True-up for FY 2011-12 to FY 2015-16, ARR for FY 2017-18 to FY 2018-19
Page 24
Table 2: Auxiliary Consumption (%)
Approved Actuals Approved Actuals Approved Actuals Approved Actuals Approved Actuals
1 Ennore TPS 16.32% 16.73% 15.00% 17.07% 15.00% 16.18% 13.50% 19.83% 15.00% 12.25%
2 Tuticorin TPS 8.50% 7.98% 8.50% 7.99% 8.50% 8.09% 8.50% 8.21% 8.50% 8.20%
3 Mettur TPS 8.31% 8.26% 9.00% 8.32% 8.50% 8.50% 8.30% 8.60% 8.50% 8.45%
4 North Chennai TPS 8.50% 8.36% 8.50% 8.42% 8.50% 9.32% 8.35% 9.29% 8.50% 8.50%
5 NCTPS Stage-II** - - - - - 0.00% 9.15% 7.14% 8.50% 7.29%
5 Mettur Stage III - - - - 8.83% 7.00% 9.15% 7.28% 8.50% 6.45%
6 Tirumakottai GTPS 7.00% 6.05% 7.00% 6.13% 7.00% 8.36% 6.65% 7.84% 6.00% 9.07%
7 Kuttalam GTPS 6.67% 7.02% 9.00% 8.50% 7.00% 7.32% 7.15% 7.65% 6.00% 2.00%
8 Basin Bridge GTPS 1.00% 0.57% 0.51% 0.96% 3.00% 5.06% 2.50% 0.00% 0.99% 0.00%
9 Valuthur Unit-I 7.00% 6.00% 7.00% 5.76% 7.00% 5.81% 6.65% 6.00%
10 Valuthur Unit-II 7.00% 6.12% 6.00% 5.59% 7.00% 6.17% 6.70% 6.00%
11 Erode HEP 0.49% 0.49% 1.02% 1.02% 0.57% 0.57% - 0.40% - 0.50%
12 Kadamparai HEP 0.52% 0.52% 0.61% 0.61% 0.47% 0.47% - 0.48% - 0.50%
13 Kundah HEP 0.00% 0.00% 0.00% 0.00% 0.00% 0.00% - 0.41% - 0.50%
14 Tirunelveli HEP 0.48% 0.48% 0.42% 0.42% 0.38% 0.38% - 0.43% - 0.50%
7.86% 5.65%
FY 2015 - 16S. No. Power Station
FY 2011 - 12 FY 2012 - 13 FY 2013 - 14 FY 2014 - 15
3.5.2 As seen from the above table, the auxiliary consumption achieved by TANGEDCO generating
plants is more or less in line with auxiliary consumption approved by Hon’ble Commission in
tariff order dated 11th December 2014 with very minor variations.
3.6 Station Heat Rate (SHR)
3.6.1 The table given below outlines the approved and actual station heat rate achieved by
TANGEDCO generating stations for FY 2011-12 to FY 2015-16.
Table 3: Station Heat Rate (kCal/kWh)
Approved Actuals Approved Actuals Approved Actuals Approved Actuals Approved Actuals
1 Ennore TPS 3200 3898 3200 4333 3200 3796 3200 4156 3200 4156
2 Tuticorin TPS 2453 2660 2453 2744 2453 2599 2453 2559 2453 2559
3 Mettur TPS 2500 2549 2500 2539 2500 2393 2500 2495 2500 2495
4 North Chennai TPS 2393 2228 2393 2391 2393 2528 2393 2466 2393 2466
5 NCTPS Stage-II** - - - - 0 2450 2466 2450 1984
5 Mettur Stage III - - - - 2500 2166 2450 2495 2450 2444
6 Tirumakottai GTPS 1850 1898 1850 1882 1850 2189 1850 2144 1850 2313
7 Kuttalam GTPS 1850 1871 1850 1945 1850 1831 1850 2011 1850 1990
8 Basin Bridge GTPS 3219 3221 3219 3820 3219 3482 3219 3219 3219 3432
9 Valuthur Unit-I 1850 1834 1850 1789 1850 1878 1850 1850
10 Valuthur Unit-II 1850 1891 1850 1945 1850 2047 1850 18501796
FY 2015 - 16S. No. Power Station
FY 2011 - 12 FY 2012 - 13 FY 2013 - 14 FY 2014 - 15
1830
3.6.2 Reasons for Deviation
Ennore TPS : At ETPS, due to prolonged service of the Units of lower capacity and partial
load operations, the performance gets reduced resulting in increased Heat rate.
Petition for Final True-up for FY 2011-12 to FY 2015-16, ARR for FY 2017-18 to FY 2018-19
Page 25
Tuticorin TPS :
The first three units of TTPS are running for more than 30 years i.e. exceeding their
life period. Because of this ageing and degradation effect, maintaining station heat
rate of 2453 Kcal/Kwh is impractical and could not be achieved. It will be justifiable
to give consideration for this ageing factor since annual maintenance and overhaul
activities will not recoup its original heat rate. (Ageing effect as per CEA 0.2 % per
year of designed unit heat rate).
In addition to this, Unit I, II and III Boilers had been designed for a coal of GCV 5950
KCals and ash content of less than 20% and Unit IV & V Boilers had been designed
for a coal of GCV 3855 KCals and ash content of 40.4 %. But at present the ash
content of coal received at TTPS is around 40%.
Usage of high ash content and inferior coal than designed one lead to increase in gas
flow in Boiler which in turn leads to high exit flue gas temperature. So Boiler
efficiency decreases.
Operational problem & constraints like part load operation due to LDC load
reduction increase the Station Heat Rate.
Due to high ash, mill fitness could not be maintained which leads to un-burnt
bottom & fly ash losses.
During rainy season, both at TTPS and at loading port, more wet coal is received
which increases the Boiler losses.
At TTPS, due to the receipt of poor quality of coal (low CV), more fuel oil has been
consumed to maintain higher load to meet the Grid demand and hence the Overall
Heat Rate has increased with respect to TNERC norms. Generally, due to usage of
lesser calorific value of coal with very high ash content of more than 40% at TTPS,
more ash is generated which deposits over the Boiler tubes resulting in increased
Heat Rate.
Mettur TPS: The variations from the TNERC Norms are due to the Calorific value of coal
received and the ageing factor of the Station. In respect of MTPS, though the Heat Rate
varies to the maximum of about 1.2%, for the past five years, considering the ageing
factor, Calorific Value of coal received nowadays affects the station heat rate of MTPS.
Therefore, the Hon’ble TNERC is requested to revise the Station Heat Rate as submitted
in this petition.
North Chennai TPS: The variation in Station Heat Rate with respect to TNERC Norms is
due to higher heat requirements, variation in coal quality and wet coal.
The Hon’ble TNERC has fixed the norms for Station Heat Rate for new thermal
Stations as 2500 kCal/kWHr as per Regulation 2005. While being so, the Units I, II &

Petition for Final True-up for FY 2011-12 to FY 2015-16, ARR for FY 2017-18 to FY 2018-19
Page 26
III of NCTPS which were commissioned during 1994, 1995 & 1996 respectively, the
Heat Rate has been fixed as 2466 kCal/kWHr only.
Considering the ageing factor and the Calorific Value of coal received, the Hon’ble
TNERC is requested to revise the Station Heat rate of NCTPS to 2500 kCal/kWHr.
Tirumakottai GTPS: The gas availability was observed up to 80% during the period.
Further, due to replacement of damaged condenser tubes in Steam Turbine Generator
for 55 days the plant was operated under open cycle (Gas Turbine was alone in
operation). Hence the heat rate was slightly higher.
Kuttalam GTPS: The heat rate was more than the norms in Kuttalam Gas Turbine Power
Station, since the unit was running at part load.
Basin Bridge GTPS: In Basin Bridge Gas station, Naphtha is being used as main fuel. HSD
is being used for starting and stopping purpose to avoid accident due to presence of un -
burnt Naphtha if any, during starting & stopping. As this station is being operated
intermittently depending upon the Grid demand, consumption of HSD is increased based
on the number of starts & stops. Hence heat rate was slightly higher during FY 2011-12,
FY 2012-13 and FY 2013-14.
Valuthur Unit II: The unit was re commissioned on 7th May 2011 after long breakdown
from 9th January 2010 due to heavy damages in GT rotor. Even after re commissioning,
full load could not be reached due to vibration problems. The vibration problems were
sorted by OEM. Leakage in STG was also attended. Hence the heat rate could not be
maintained within the norms prescribed.
3.6.3 The Hon’ble Commission is hence requested to kindly approve the actual Station heat rate
submitted by TANGEDCO in the above table.
3.7 Specific Oil Consumption
3.7.1 The table given below outlines the approved and actual specific oil consumption achieved by
TANGEDCO generating stations for FY 2011-12 to FY 2015-16.
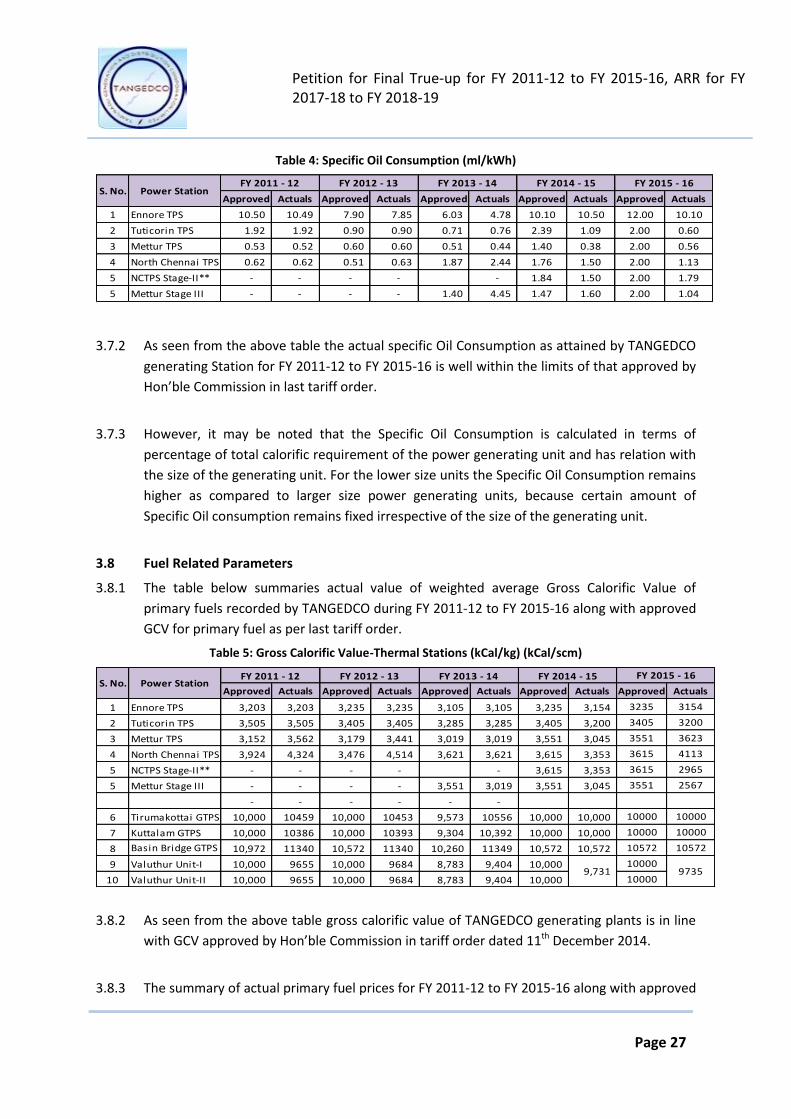
Petition for Final True-up for FY 2011-12 to FY 2015-16, ARR for FY 2017-18 to FY 2018-19
Page 27
Table 4: Specific Oil Consumption (ml/kWh)
Approved Actuals Approved Actuals Approved Actuals Approved Actuals Approved Actuals
1 Ennore TPS 10.50 10.49 7.90 7.85 6.03 4.78 10.10 10.50 12.00 10.10
2 Tuticorin TPS 1.92 1.92 0.90 0.90 0.71 0.76 2.39 1.09 2.00 0.60
3 Mettur TPS 0.53 0.52 0.60 0.60 0.51 0.44 1.40 0.38 2.00 0.56
4 North Chennai TPS 0.62 0.62 0.51 0.63 1.87 2.44 1.76 1.50 2.00 1.13
5 NCTPS Stage-II** - - - - - 1.84 1.50 2.00 1.79
5 Mettur Stage III - - - - 1.40 4.45 1.47 1.60 2.00 1.04
S. No. Power StationFY 2011 - 12 FY 2012 - 13 FY 2013 - 14 FY 2015 - 16FY 2014 - 15
3.7.2 As seen from the above table the actual specific Oil Consumption as attained by TANGEDCO
generating Station for FY 2011-12 to FY 2015-16 is well within the limits of that approved by
Hon’ble Commission in last tariff order.
3.7.3 However, it may be noted that the Specific Oil Consumption is calculated in terms of
percentage of total calorific requirement of the power generating unit and has relation with
the size of the generating unit. For the lower size units the Specific Oil Consumption remains
higher as compared to larger size power generating units, because certain amount of
Specific Oil consumption remains fixed irrespective of the size of the generating unit.
3.8 Fuel Related Parameters
3.8.1 The table below summaries actual value of weighted average Gross Calorific Value of
primary fuels recorded by TANGEDCO during FY 2011-12 to FY 2015-16 along with approved
GCV for primary fuel as per last tariff order.
Table 5: Gross Calorific Value-Thermal Stations (kCal/kg) (kCal/scm)
Approved Actuals Approved Actuals Approved Actuals Approved Actuals Approved Actuals
1 Ennore TPS 3,203 3,203 3,235 3,235 3,105 3,105 3,235 3,154 3235 3154
2 Tuticorin TPS 3,505 3,505 3,405 3,405 3,285 3,285 3,405 3,200 3405 3200
3 Mettur TPS 3,152 3,562 3,179 3,441 3,019 3,019 3,551 3,045 3551 3623
4 North Chennai TPS 3,924 4,324 3,476 4,514 3,621 3,621 3,615 3,353 3615 4113
5 NCTPS Stage-II** - - - - - 3,615 3,353 3615 2965
5 Mettur Stage III - - - - 3,551 3,019 3,551 3,045 3551 2567
- - - - - -
6 Tirumakottai GTPS 10,000 10459 10,000 10453 9,573 10556 10,000 10,000 10000 10000
7 Kuttalam GTPS 10,000 10386 10,000 10393 9,304 10,392 10,000 10,000 10000 10000
8 Basin Bridge GTPS 10,972 11340 10,572 11340 10,260 11349 10,572 10,572 10572 10572
9 Valuthur Unit-I 10,000 9655 10,000 9684 8,783 9,404 10,000 10000
10 Valuthur Unit-II 10,000 9655 10,000 9684 8,783 9,404 10,000 10000
FY 2014 - 15
9,731
S. No. Power StationFY 2011 - 12 FY 2012 - 13 FY 2013 - 14 FY 2015 - 16
9735
3.8.2 As seen from the above table gross calorific value of TANGEDCO generating plants is in line
with GCV approved by Hon’ble Commission in tariff order dated 11th December 2014.
3.8.3 The summary of actual primary fuel prices for FY 2011-12 to FY 2015-16 along with approved

Petition for Final True-up for FY 2011-12 to FY 2015-16, ARR for FY 2017-18 to FY 2018-19
Page 28
values is shown in following table.
Table 6: Price of Primary Fuel-Thermal Stations (Rs. /MT) (Rs. /SCM)
Approved Actuals Approved Actuals Approved Actuals Approved Actuals Approved Actuals
1 Ennore TPS 2507 2508 3020 2813 2434 2495 2434 2796 2841 2951
2 Tuticorin TPS 4057 4040 3551 3679 4013 3734 4013 4163 3659 3795
3 Mettur TPS 4196 3674 4248 4202 3998 4440 3998 4646 3916 4515
4 North Chennai TPS 3188 3264 3491 3609 3623 3922 3623 3900 3407 3673
5 NCTPS Stage-II** - - - - 0 3606 3926 3407 5167
5 Mettur Stage III - - 4826 0 4400 4807 4400 4140 3916 4465
6 Tirumakottai GTPS 8.45 8.11 9.33 9.33 10.84 10.38 10.84 12.53 9.32 12.99
7 Kuttalam GTPS 8.55 8.04 18.80 15.40 11.26 10.90 11.26 13.00 9.32 13.90
8 Basin Bridge GTPS 56.89 57.07 61.21 58.46 67.06 60.64 67.07 15.00 40.63 15.45
9 Valuthur Unit-I 8.00 7.66 8.94 8.50 10.60 9.96 10.60 8.76
10 Valuthur Unit-II 8.00 7.66 8.94 8.50 10.60 9.96 10.60 8.7813.27
FY 2015 - 16S. No. Power Station
FY 2011 - 12 FY 2012 - 13 FY 2013 - 14 FY 2014 - 15
11.91
3.8.4 The Hon’ble Commission is kindly requested to approve any deviation with respect to fuel
related cost as the same is entire pass through.
3.9 Net Generation
3.9.1 Based on plant load factor and auxiliary consumption discussed in aforesaid sections, the net
generation for TANGEDCO stations for FY 2011-12 to FY 2015-16 has been indicated below:
Table 7: Net Generation (in MUs)
Approved Actuals Approved Actuals Approved Actuals Approved Actuals Approved Actuals
1 Ennore TPS 744 744 635 610 1,011 1,011 801 485 653 392
2 Tuticorin TPS 7,262 7,262 7,630 7,620 7,253 7,253 7,183 7,043 7,173 6,501
3 Mettur TPS 6,279 6,280 5,658 5,684 5,928 5,928 6,005 5,697 6,009 5,406
4 North Chennai TPS 4,301 4,301 4,651 4,634 3,720 3,720 4,502 3,865 4,507 4,071
5 NCTPS Stage-II** - - - - 4,059 5,187 8,198 4,468
5 Mettur Stage III - - 1,889 1,840 4,059 2,802 4,099 2,664
6 Tirumakottai GTPS 660 663 678 682 453 456 706 382 713 363
7 Kuttalam GTPS 383 385 51 51 598 594 651 459 667 552
8 Basin Bridge GTPS 29 29 0 0 1 1 59 3 59 11
9 Valuthur Unit-I 514 619 416 424 687 687 621
10 Valuthur Unit-II 514 426 457 461 494 494 621
11 Erode HEP 1,416 1,196 845 464 940 902 1,365 946 756
12 Kadamparai HEP - 1,087 670 670 - 1,063 1,034 891
13 Kundah HEP 2,455 1,920 1,032 1,353 2,187 2,187 2,257 2,028 1,695
14 Tirunelveli HEP 952 583 699 231 922 461 964 1,158 1,096
16 New Hydro Addition - - - - - -
15 Wind 12.00 12.15 13.00 12.66 12.00 12.58 12.00 7.81 12.00 6.79
Total 25,521 25,509 23,436 22,897 26,095 26,609 33,865 32,092 37,711 29,553
FY 2015 - 16S. No. Power Station
FY 2011 - 12 FY 2012 - 13 FY 2013 - 14 FY 2014 - 15
996 1,235
4,386
680
3.9.2 The Net generation for all TANGEDCO power stations is in line with the generation approved

Petition for Final True-up for FY 2011-12 to FY 2015-16, ARR for FY 2017-18 to FY 2018-19
Page 29
by Hon’ble Commission in last tariff order dated 11th December 2014.
3.10 Computation of Fuel Expenses for FY 2011-12 to FY 2015-16
3.10.1 Based on actual operating and fuel related parameters recorded by TANGEDCO during FY
2011-12 to FY 2015-16, plant wise variable cost arrived are tabulated below.
Table 8: Variable Cost for FY 2011-12 to FY 2015-16 (Rs. Crores)
Approved Actuals Approved Actuals Approved Actuals Approved Actuals Approved Actuals
1 Ennore TPS 259.8 313.1 239.7 303.0 391.2 409.8 267.4 245.8 313.3 185.0
2 Tuticorin TPS 2,314.0 2,462.9 2,258.9 2,483.7 2,147.3 2,399.3 2,323.8 2,576.3 2,123.6 2,161.2
3 Mettur TPS 2,058.9 1,810.9 1,758.8 1,936.0 1,832.6 2,329.8 1,871.3 2,381.7 1,857.7 1,846.8
4 North Chennai TPS 979.9 1,013.8 1,184.6 1,271.3 947.5 1,165.4 1,204.2 1,246.7 1,147.9 996.4
5 Mettur TPS Stage III - - - - 1,367.9 1,038.6 1,242.5 1,216.5
NCTPS Stage II - - - - - 1,107.0 1,654.7 2,136.2 1,706.0
6 Tirumakottai GTPS 102.8 115.1 114.1 130.6 160.5 110.2 153.8 111.2 133.0 120.1
7 Kuttalam GTPS 108.8 73.0 221.0 21.8 160.4 131.7 149.4 129.9 124.3 155.8
8 Basin Bridge GTPS 100.5 49.8 112.7 1.0 126.3 1.6 122.6 6.1 74.3 15.8
9 Valuthur Unit-I 79.1 100.9 111.7 89.3 152.2 148.7 134.3 112.2
10 Valuthur Unit-II 60.0 100.9 104.4 89.3 147.5 114.1 130.2 109.0 242.2 236.5
S. No. Power StationFY 2011 - 12 FY 2012 - 13 FY 2013 - 14 FY 2014 - 15 FY 2015 - 16
3.10.2 Based on operating parameters and actual fuel cost, energy charges for FY 2011-12 to FY
2015-16 for TANGEDCO’s power stations are indicated below.
Table 9: Variable Cost per Unit for FY 2011-12 to FY 2015-16 (Rs. /kWh)
Approve
dActuals
Approve
dActuals
Approve
dActuals Approved Actuals Approved Actuals
1 Ennore TPS 3.53 4.21 4.12 4.97 3.25 4.05 3.34 5.07 4.80 4.72
2 Tuticorin TPS 3.17 3.39 2.87 3.26 3.30 3.31 3.24 3.66 2.96 3.32
3 Mettur TPS 3.65 2.88 3.69 3.41 3.63 3.93 3.12 4.18 3.09 3.42
4 North Chennai TPS 2.15 2.36 2.65 2.74 2.67 3.13 2.67 3.23 2.55 2.45
5 Mettur TPS Stage III - - - - 3.44 3.85 3.37 3.71 3.03 4.57
NCTPS Stage II 2.73 3.19 2.61 3.82
6 Tirumakottai GTPS 1.79 1.74 1.87 1.91 2.26 2.41 2.16 2.91 1.86 3.31
7 Kuttalam GTPS 1.81 1.90 3.73 4.28 2.41 2.22 2.25 2.83 1.87 2.82
8 Basin Bridge GTPS 16.74 16.93 18.73 24.86 21.25 19.59 2.06 20.36 12.49 15.01
9 Valuthur Unit-I 1.50 1.63 1.82 2.11 2.43 2.16 2.15
10 Valuthur Unit-II 1.43 2.37 1.76 1.94 2.43 2.31 2.15 2.43 3.48 1.79
S. No. Power Station
FY 2011-12 FY 2012-13 FY 2013-14 FY 2014 - 15 FY 2015 - 16
3.11 Summary of Variable Cost for FY 2011-12 to FY 2015-16
3.11.1 The following tables show the summary of Variable Cost for FY 2011-12 to FY 2015-16.
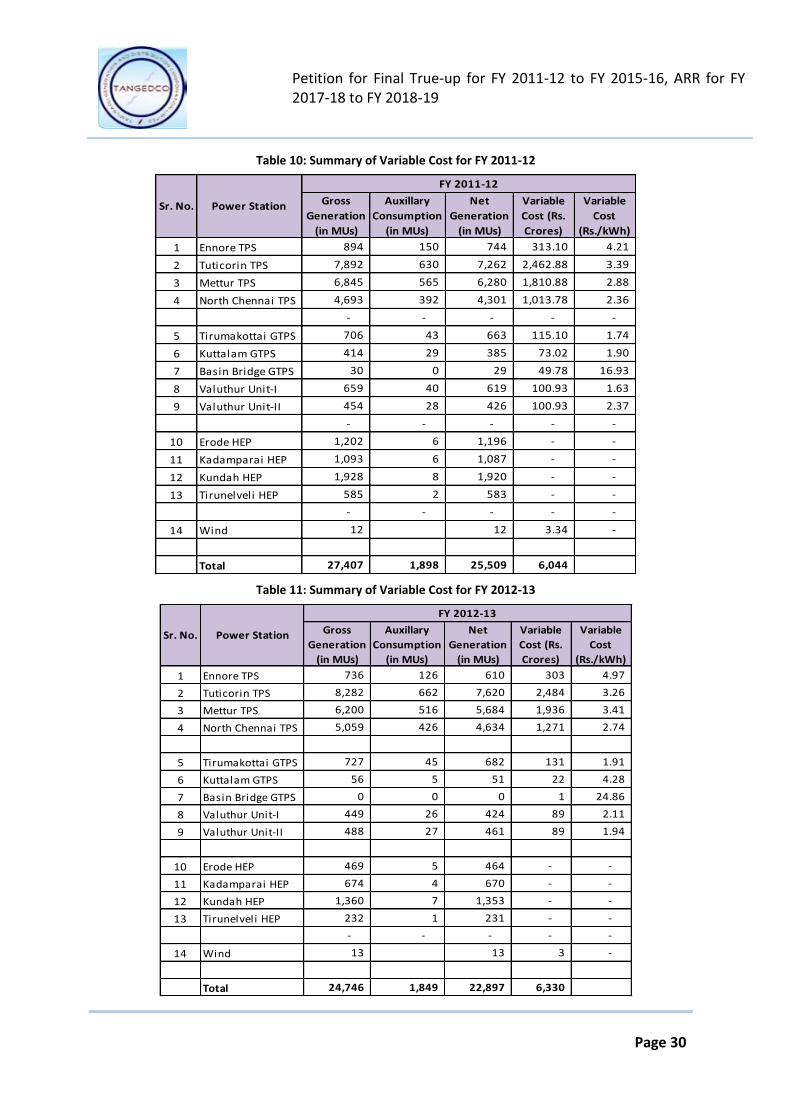
Petition for Final True-up for FY 2011-12 to FY 2015-16, ARR for FY 2017-18 to FY 2018-19
Page 30
Table 10: Summary of Variable Cost for FY 2011-12
Gross
Generation
(in MUs)
Auxillary
Consumption
(in MUs)
Net
Generation
(in MUs)
Variable
Cost (Rs.
Crores)
Variable
Cost
(Rs./kWh)
1 Ennore TPS 894 150 744 313.10 4.21
2 Tuticorin TPS 7,892 630 7,262 2,462.88 3.39
3 Mettur TPS 6,845 565 6,280 1,810.88 2.88
4 North Chennai TPS 4,693 392 4,301 1,013.78 2.36
- - - - -
5 Tirumakottai GTPS 706 43 663 115.10 1.74
6 Kuttalam GTPS 414 29 385 73.02 1.90
7 Basin Bridge GTPS 30 0 29 49.78 16.93
8 Valuthur Unit-I 659 40 619 100.93 1.63
9 Valuthur Unit-II 454 28 426 100.93 2.37
- - - - -
10 Erode HEP 1,202 6 1,196 - -
11 Kadamparai HEP 1,093 6 1,087 - -
12 Kundah HEP 1,928 8 1,920 - -
13 Tirunelveli HEP 585 2 583 - -
- - - - -
14 Wind 12 12 3.34 -
Total 27,407 1,898 25,509 6,044
Sr. No. Power Station
FY 2011-12
Table 11: Summary of Variable Cost for FY 2012-13
Gross
Generation
(in MUs)
Auxillary
Consumption
(in MUs)
Net
Generation
(in MUs)
Variable
Cost (Rs.
Crores)
Variable
Cost
(Rs./kWh)
1 Ennore TPS 736 126 610 303 4.97
2 Tuticorin TPS 8,282 662 7,620 2,484 3.26
3 Mettur TPS 6,200 516 5,684 1,936 3.41
4 North Chennai TPS 5,059 426 4,634 1,271 2.74
5 Tirumakottai GTPS 727 45 682 131 1.91
6 Kuttalam GTPS 56 5 51 22 4.28
7 Basin Bridge GTPS 0 0 0 1 24.86
8 Valuthur Unit-I 449 26 424 89 2.11
9 Valuthur Unit-II 488 27 461 89 1.94
10 Erode HEP 469 5 464 - -
11 Kadamparai HEP 674 4 670 - -
12 Kundah HEP 1,360 7 1,353 - -
13 Tirunelveli HEP 232 1 231 - -
- - - - -
14 Wind 13 13 3 -
Total 24,746 1,849 22,897 6,330
Sr. No. Power Station
FY 2012-13
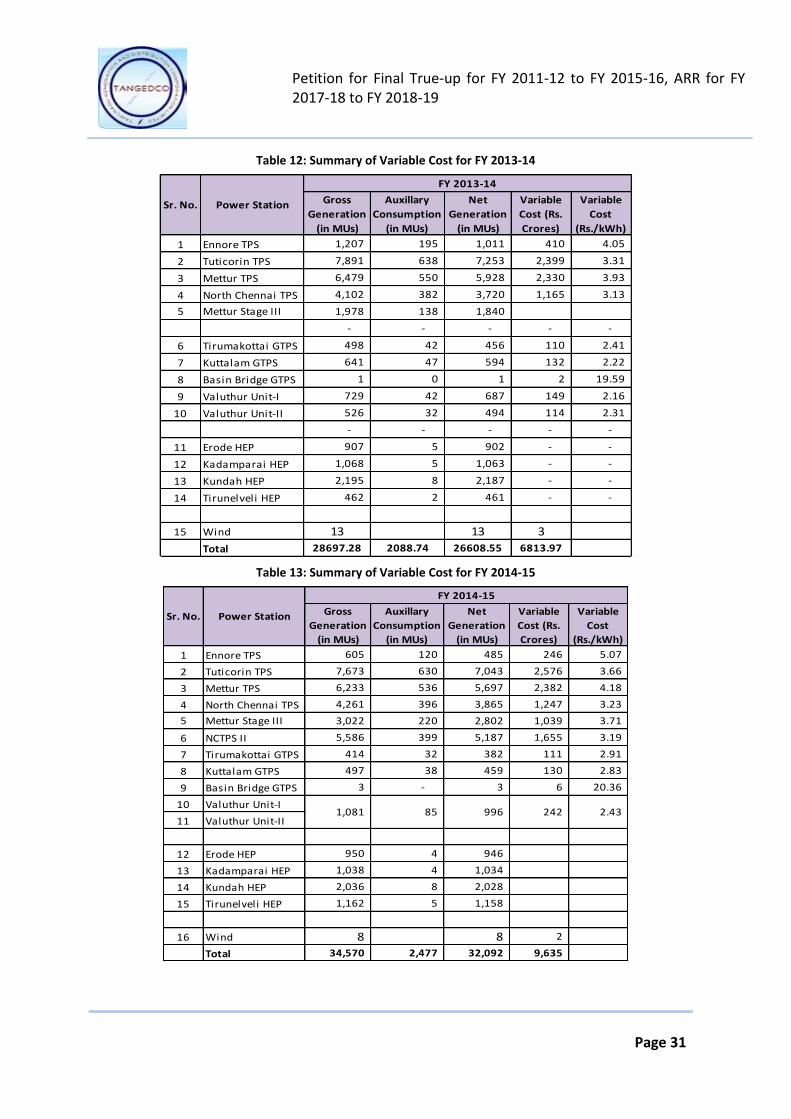
Petition for Final True-up for FY 2011-12 to FY 2015-16, ARR for FY 2017-18 to FY 2018-19
Page 31
Table 12: Summary of Variable Cost for FY 2013-14
Gross
Generation
(in MUs)
Auxillary
Consumption
(in MUs)
Net
Generation
(in MUs)
Variable
Cost (Rs.
Crores)
Variable
Cost
(Rs./kWh)
1 Ennore TPS 1,207 195 1,011 410 4.05
2 Tuticorin TPS 7,891 638 7,253 2,399 3.31
3 Mettur TPS 6,479 550 5,928 2,330 3.93
4 North Chennai TPS 4,102 382 3,720 1,165 3.13
5 Mettur Stage III 1,978 138 1,840
- - - - -
6 Tirumakottai GTPS 498 42 456 110 2.41
7 Kuttalam GTPS 641 47 594 132 2.22
8 Basin Bridge GTPS 1 0 1 2 19.59
9 Valuthur Unit-I 729 42 687 149 2.16
10 Valuthur Unit-II 526 32 494 114 2.31
- - - - -
11 Erode HEP 907 5 902 - -
12 Kadamparai HEP 1,068 5 1,063 - -
13 Kundah HEP 2,195 8 2,187 - -
14 Tirunelveli HEP 462 2 461 - -
15 Wind 13 13 3
Total 28697.28 2088.74 26608.55 6813.97
FY 2013-14
Sr. No. Power Station
Table 13: Summary of Variable Cost for FY 2014-15
Gross
Generation
(in MUs)
Auxillary
Consumption
(in MUs)
Net
Generation
(in MUs)
Variable
Cost (Rs.
Crores)
Variable
Cost
(Rs./kWh)
1 Ennore TPS 605 120 485 246 5.07
2 Tuticorin TPS 7,673 630 7,043 2,576 3.66
3 Mettur TPS 6,233 536 5,697 2,382 4.18
4 North Chennai TPS 4,261 396 3,865 1,247 3.23
5 Mettur Stage III 3,022 220 2,802 1,039 3.71
6 NCTPS II 5,586 399 5,187 1,655 3.19
7 Tirumakottai GTPS 414 32 382 111 2.91
8 Kuttalam GTPS 497 38 459 130 2.83
9 Basin Bridge GTPS 3 - 3 6 20.36
10 Valuthur Unit-I
11 Valuthur Unit-II
12 Erode HEP 950 4 946
13 Kadamparai HEP 1,038 4 1,034
14 Kundah HEP 2,036 8 2,028
15 Tirunelveli HEP 1,162 5 1,158
16 Wind 8 8 2
Total 34,570 2,477 32,092 9,635
FY 2014-15
Sr. No. Power Station
996 242 2.43 1,081 85

Petition for Final True-up for FY 2011-12 to FY 2015-16, ARR for FY 2017-18 to FY 2018-19
Page 32
Table 14: Summary of Variable Cost for FY 2015-16
Gross
Generation
(in MUs)
Auxillary
Consumption
(in MUs)
Net
Generation
(in MUs)
Variable
Cost (Rs.
Crores)
Variable
Cost
(Rs./kWh)
1 Ennore TPS 447 55 392 185 4.72
2 Tuticorin TPS 7,082 581 6,501 2,161 3.32
3 Mettur TPS 5,905 499 5,406 1,847 3.42
4 North Chennai TPS 4,449 378 4,071 996 2.45
5 Mettur Stage III 2,848 184 2,664 1,217 4.57
6 NCTPS II 4,820 351 4,468 1,706 3.82
7 Tirumakottai GTPS 399 36 363 120 3.31
8 Kuttalam GTPS 564 11 552 156 2.82
9 Basin Bridge GTPS 11 - 11 16 15.01
10 Valuthur Unit-I
11 Valuthur Unit-II
12 Erode HEP 760 4 756
13 Kadamparai HEP 895 4 891
14 Kundah HEP 1,704 9 1,695
15 Tirunelveli HEP 1,101 6 1,096
16 Wind 7 7 2
Total 31,712 2,159 29,553 8,642
721 41 680 237 3.48
Sr. No. Power Station
FY 2015-16
3.12 Capital Expenditure and Capitalization
3.12.1 TANGEDCO submits that the expenditure incurred in each of the power station is on account
of regular works like replacement of worn-out machinery, damaged equipments,
transformers, boilers, generators, stators, auxiliary equipments, etc which are necessary
works to be carried out for effective and efficient working of the power station.
3.12.2 TANGEDCO also submits that the expenditure incurred for the distribution function during
the respective years is on account of regular works carried out during the respective years
which were necessary for efficient working of the distribution system.
3.12.3 The works carried out for the distribution function are mainly on account of addition of LT
and HT lines, distribution transformers, services rendered during the respective years and
works carried out under RGGVY scheme.
3.12.4 The capitalization recorded in FY 2011-12 to FY 2015-16 as available in annual audited
accounts is shown in the table below.

Petition for Final True-up for FY 2011-12 to FY 2015-16, ARR for FY 2017-18 to FY 2018-19
Page 33
Table 15: Capitalization for FY 2011-12 to FY 2015-16
1 Ennore TPS 0.21 144.81 26.84 2.46 2907.85
2 Tuticorin TPS 8.97 255.06 90.61 84.53 952.54
3 Mettur TPS 11.89 151.44 19.32 77.54 721.48
4 Mettur Stage III - - 3,154.30 274.61 225.02
5 North Chennai TPS 24.66 272.54 316.59 -1003.34 2291.05
6 NCTPS II - - - 6500.00 1142.29
7 Tirumakottai GTPS 3.79 61.77 0.41 70.58 293.77
8 Kuttalam GTPS 14.79 48.10 121.39 80.92 183.40
9 Basin Bridge GTPS - 75.54 0.01 (1.37) 2,284.90
10 Valuthur GTPS I 11.02 74.10 34.69 123.77 746.14
11 Civil MTCE Madurai - - - (26.11) 142.02
10 Erode HEP 1.59 95.38 554.77 13.57 554.12
11 Kadamparai HEP 2.83 49.81 15.70 6.04 230.12
12 Kundah HEP 4.43 130.97 8.47 12.60 1,047.78
13 Tirunelveli HEP 15.08 52.30 67.61 55.67 374.12
14 L.M.H.E.P Bhavani 51.92
15 Total Generation 99.3 1,411.8 4,410.7 6,271.5 14,148.5
16 Total Distribution 1,021.3 1,088.1 1,161.6 2,077.1 12,245.6
17 Total TANGEDCO 1,120.5 2,499.9 5,572.3 8,348.6 26,394.1
S. No. Power Station FY 2011-12 FY 2012-13 FY 2013-14 FY 2014-15 FY 2015-16
3.12.5 TANGEDCO submits that the additional capitalization incurred by TANGEDCO during the
respective years is in line with the clause 19 of the TNERC Tariff Regulations 2005, which
have been incurred for efficient and successful operation of the Generating Station and
Distribution Network.
3.13 Fixed Cost for FY 2011-12 to FY 2015-16
3.13.1 TANGEDCO has determined actual fixed cost for its generating station on the basis of TNERC
(Terms & Conditions of Tariff) Regulation, 2005 and annual audited accounts for FY 2011-12
to FY 2015-16.
3.13.2 The fixed cost for generating plants for FY 2011-12 to FY 2015-16 categorized under the
following heads may kindly be allowed.
Depreciation
Interest and Finance Charges
Return on Equity
Operation and Maintenance Expenses
Interest on Working Capital
Other Debits
Net Prior Period Expenses
Petition for Final True-up for FY 2011-12 to FY 2015-16, ARR for FY 2017-18 to FY 2018-19
Page 34
Extra Ordinary Items
Other Income
3.14 Depreciation
3.14.1 TANGEDCO submits that the opening gross block for each of the generating plant and for
distribution function of FY 2011-12 to FY 2015-16 is considered as available in annual
accounts of respective years without considering the effect of revaluation reserve.
3.14.2 The additions during the year are considered actual as per audited figures during the period
for FY 2011-12 to FY 2015-16.
3.14.3 The depreciation claimed during the year is based on the actual depreciation reflecting in
accounts for FY 2011-12 to FY 2015-16, which in turn is calculated on the basis on TNERC
approved depreciation rates for each asset class and computed on the Opening GFA of that
particular year.
3.14.4 It is submitted that TANGEDCO has used the weighted average depreciation rate for the
particular group of asset arrived based on depreciation rates specified in the Tariff
Regulation. The depreciation calculated is in line with the clause 24 of the Tariff Regulations.
3.14.5 The actual depreciation for generation and distribution function of TANGEDCO for FY 2011-
12, FY 2012-13, FY 2013-14, FY 2014-15 and FY 2015-16 is Rs. 616.03 Crores, Rs. 647.07
Crores, 722.90 Crores, 1285.45 Crores and Rs. 1608.1 Crores respectively.
3.14.6 The table below shows the comparison of actual plant wise depreciation for FY 2011-12 to
FY 2015-16 with that of approved in tariff order dated 11th December 2014.
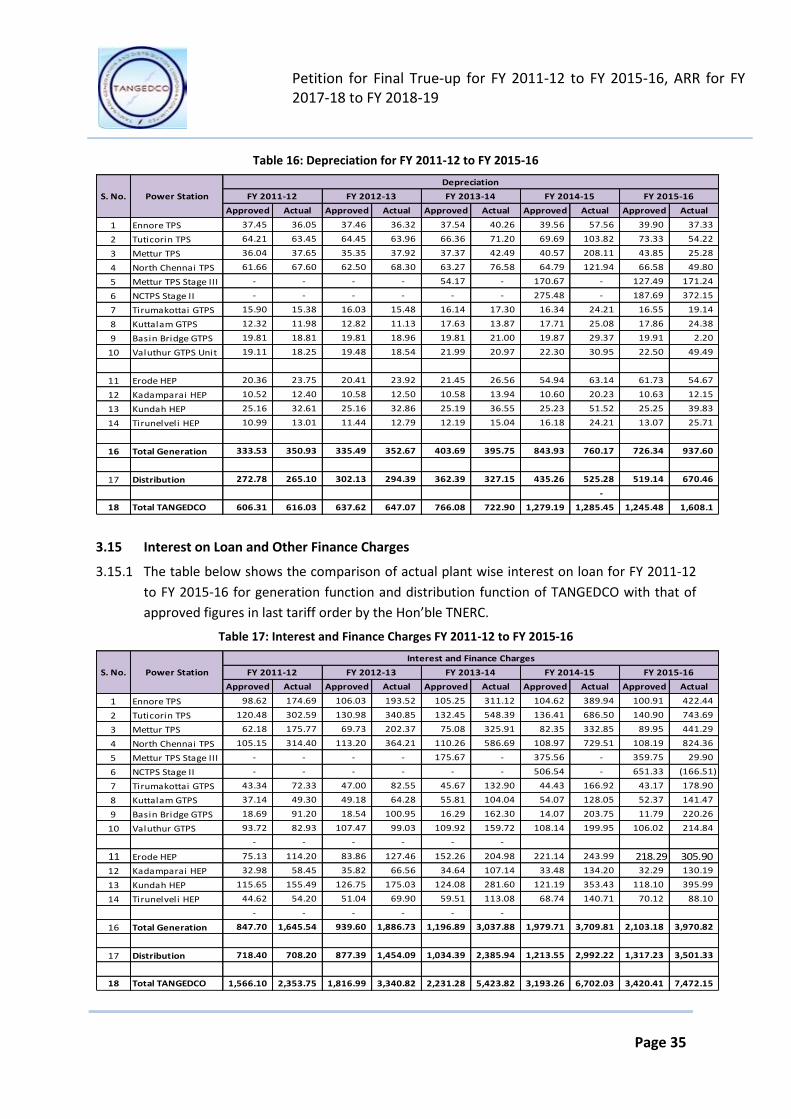
Petition for Final True-up for FY 2011-12 to FY 2015-16, ARR for FY 2017-18 to FY 2018-19
Page 35
Table 16: Depreciation for FY 2011-12 to FY 2015-16
Approved Actual Approved Actual Approved Actual Approved Actual Approved Actual
1 Ennore TPS 37.45 36.05 37.46 36.32 37.54 40.26 39.56 57.56 39.90 37.33
2 Tuticorin TPS 64.21 63.45 64.45 63.96 66.36 71.20 69.69 103.82 73.33 54.22
3 Mettur TPS 36.04 37.65 35.35 37.92 37.37 42.49 40.57 208.11 43.85 25.28
4 North Chennai TPS 61.66 67.60 62.50 68.30 63.27 76.58 64.79 121.94 66.58 49.80
5 Mettur TPS Stage III - - - - 54.17 - 170.67 - 127.49 171.24
6 NCTPS Stage II - - - - - - 275.48 - 187.69 372.15
7 Tirumakottai GTPS 15.90 15.38 16.03 15.48 16.14 17.30 16.34 24.21 16.55 19.14
8 Kuttalam GTPS 12.32 11.98 12.82 11.13 17.63 13.87 17.71 25.08 17.86 24.38
9 Basin Bridge GTPS 19.81 18.81 19.81 18.96 19.81 21.00 19.87 29.37 19.91 2.20
10 Valuthur GTPS Unit 19.11 18.25 19.48 18.54 21.99 20.97 22.30 30.95 22.50 49.49
11 Erode HEP 20.36 23.75 20.41 23.92 21.45 26.56 54.94 63.14 61.73 54.67
12 Kadamparai HEP 10.52 12.40 10.58 12.50 10.58 13.94 10.60 20.23 10.63 12.15
13 Kundah HEP 25.16 32.61 25.16 32.86 25.19 36.55 25.23 51.52 25.25 39.83
14 Tirunelveli HEP 10.99 13.01 11.44 12.79 12.19 15.04 16.18 24.21 13.07 25.71
16 Total Generation 333.53 350.93 335.49 352.67 403.69 395.75 843.93 760.17 726.34 937.60
17 Distribution 272.78 265.10 302.13 294.39 362.39 327.15 435.26 525.28 519.14 670.46
-
18 Total TANGEDCO 606.31 616.03 637.62 647.07 766.08 722.90 1,279.19 1,285.45 1,245.48 1,608.1
FY 2013-14 FY 2014-15
Depreciation
FY 2015-16S. No. Power Station FY 2011-12 FY 2012-13
3.15 Interest on Loan and Other Finance Charges
3.15.1 The table below shows the comparison of actual plant wise interest on loan for FY 2011-12
to FY 2015-16 for generation function and distribution function of TANGEDCO with that of
approved figures in last tariff order by the Hon’ble TNERC.
Table 17: Interest and Finance Charges FY 2011-12 to FY 2015-16
Approved Actual Approved Actual Approved Actual Approved Actual Approved Actual
1 Ennore TPS 98.62 174.69 106.03 193.52 105.25 311.12 104.62 389.94 100.91 422.44
2 Tuticorin TPS 120.48 302.59 130.98 340.85 132.45 548.39 136.41 686.50 140.90 743.69
3 Mettur TPS 62.18 175.77 69.73 202.37 75.08 325.91 82.35 332.85 89.95 441.29
4 North Chennai TPS 105.15 314.40 113.20 364.21 110.26 586.69 108.97 729.51 108.19 824.36
5 Mettur TPS Stage III - - - - 175.67 - 375.56 - 359.75 29.90
6 NCTPS Stage II - - - - - - 506.54 - 651.33 (166.51)
7 Tirumakottai GTPS 43.34 72.33 47.00 82.55 45.67 132.90 44.43 166.92 43.17 178.90
8 Kuttalam GTPS 37.14 49.30 49.18 64.28 55.81 104.04 54.07 128.05 52.37 141.47
9 Basin Bridge GTPS 18.69 91.20 18.54 100.95 16.29 162.30 14.07 203.75 11.79 220.26
10 Valuthur GTPS 93.72 82.93 107.47 99.03 109.92 159.72 108.14 199.95 106.02 214.84
- - - - - -
11 Erode HEP 75.13 114.20 83.86 127.46 152.26 204.98 221.14 243.99 218.29 305.90
12 Kadamparai HEP 32.98 58.45 35.82 66.56 34.64 107.14 33.48 134.20 32.29 130.19
13 Kundah HEP 115.65 155.49 126.75 175.03 124.08 281.60 121.19 353.43 118.10 395.99
14 Tirunelveli HEP 44.62 54.20 51.04 69.90 59.51 113.08 68.74 140.71 70.12 88.10
- - - - - -
16 Total Generation 847.70 1,645.54 939.60 1,886.73 1,196.89 3,037.88 1,979.71 3,709.81 2,103.18 3,970.82
17 Distribution 718.40 708.20 877.39 1,454.09 1,034.39 2,385.94 1,213.55 2,992.22 1,317.23 3,501.33
18 Total TANGEDCO 1,566.10 2,353.75 1,816.99 3,340.82 2,231.28 5,423.82 3,193.26 6,702.03 3,420.41 7,472.15
S. No. Power Station FY 2011-12
Interest and Finance Charges
FY 2015-16FY 2012-13 FY 2013-14 FY 2014-15
Petition for Final True-up for FY 2011-12 to FY 2015-16, ARR for FY 2017-18 to FY 2018-19
Page 36
3.15.2 The opening balance of loans as on 1st November 2010 for TANGEDCO is based on the
provisional transfer scheme notified as on 2nd January 2012 as taking over of loans from
erstwhile Tamil Nadu Electricity Board (TNEB). Therefore TANGEDCO submits that they have
an obligation to service the debt transferred to them as per government notification.
3.15.3 TANGEDCO would like to submit that the loan of a financial institution is not linked with any
particular generating plant or the CAPEX schemes and erstwhile TNEB used to have a basket
of loan which was used to meet the total capital expenditure of erstwhile TNEB. Hence it is
difficult to identify the debt / interest and equity of the generating plant or station wise or
distribution function wise.
3.15.4 TANGEDCO submits that the interest and finance charges claimed in the above table is with
respect to the interest and finance charges reflecting in annual accounts of individual
balance sheet of each station for generating function and consolidated interest and finance
charges figure reflecting in balance sheet of each of the 39 distribution circles of TANGEDCO
for distribution function.
3.15.5 The total interest and finance charges for FY 2011-12, FY 2012-13, FY 2013-14, FY 2014-15
and FY 2015-16 for entire TANGEDCO are Rs. 2353.75 Crores, 3340.82 Crores, Rs. 5423.82
Crores, 6702.03 Crores and 7472.15 Crores respectively.
3.16 Interest on Working Capital
3.16.1 The table below shows the interest on working capital for FY 2011-12 to FY 2015-16 for
generation and distribution function of TANGEDCO.
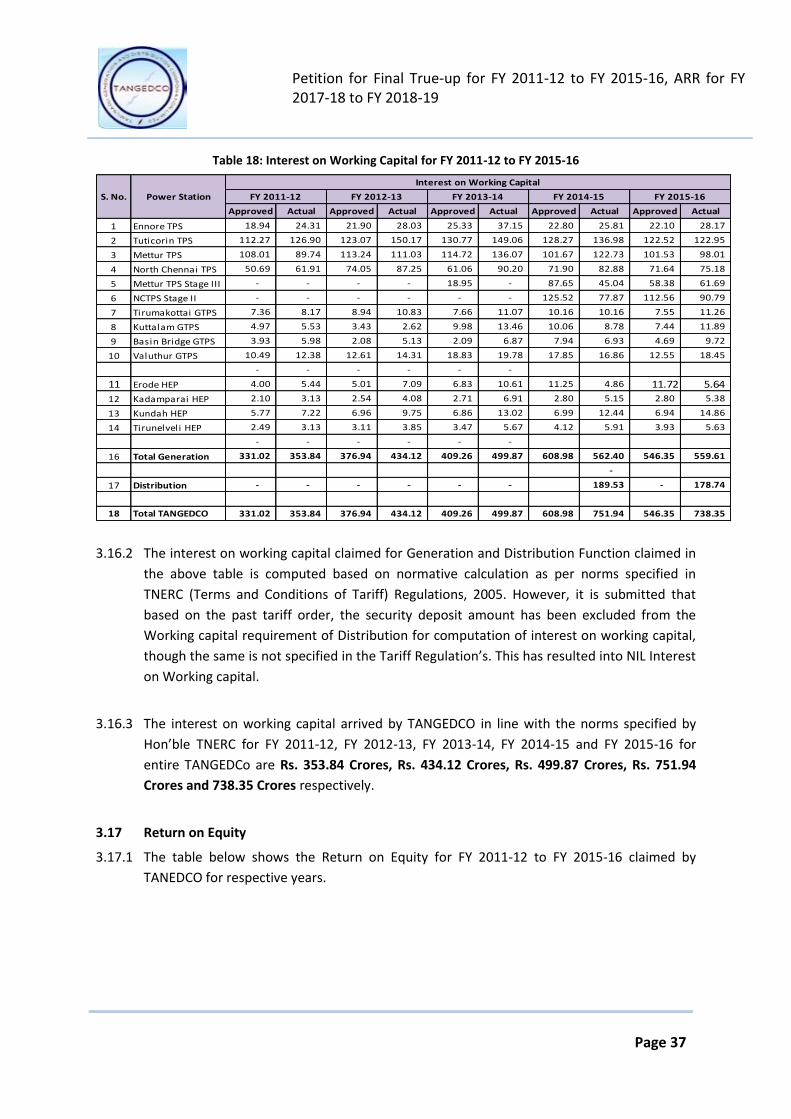
Petition for Final True-up for FY 2011-12 to FY 2015-16, ARR for FY 2017-18 to FY 2018-19
Page 37
Table 18: Interest on Working Capital for FY 2011-12 to FY 2015-16
Approved Actual Approved Actual Approved Actual Approved Actual Approved Actual
1 Ennore TPS 18.94 24.31 21.90 28.03 25.33 37.15 22.80 25.81 22.10 28.17
2 Tuticorin TPS 112.27 126.90 123.07 150.17 130.77 149.06 128.27 136.98 122.52 122.95
3 Mettur TPS 108.01 89.74 113.24 111.03 114.72 136.07 101.67 122.73 101.53 98.01
4 North Chennai TPS 50.69 61.91 74.05 87.25 61.06 90.20 71.90 82.88 71.64 75.18
5 Mettur TPS Stage III - - - - 18.95 - 87.65 45.04 58.38 61.69
6 NCTPS Stage II - - - - - - 125.52 77.87 112.56 90.79
7 Tirumakottai GTPS 7.36 8.17 8.94 10.83 7.66 11.07 10.16 10.16 7.55 11.26
8 Kuttalam GTPS 4.97 5.53 3.43 2.62 9.98 13.46 10.06 8.78 7.44 11.89
9 Basin Bridge GTPS 3.93 5.98 2.08 5.13 2.09 6.87 7.94 6.93 4.69 9.72
10 Valuthur GTPS 10.49 12.38 12.61 14.31 18.83 19.78 17.85 16.86 12.55 18.45
- - - - - -
11 Erode HEP 4.00 5.44 5.01 7.09 6.83 10.61 11.25 4.86 11.72 5.64
12 Kadamparai HEP 2.10 3.13 2.54 4.08 2.71 6.91 2.80 5.15 2.80 5.38
13 Kundah HEP 5.77 7.22 6.96 9.75 6.86 13.02 6.99 12.44 6.94 14.86
14 Tirunelveli HEP 2.49 3.13 3.11 3.85 3.47 5.67 4.12 5.91 3.93 5.63
- - - - - -
16 Total Generation 331.02 353.84 376.94 434.12 409.26 499.87 608.98 562.40 546.35 559.61
-
17 Distribution - - - - - - 189.53 - 178.74
18 Total TANGEDCO 331.02 353.84 376.94 434.12 409.26 499.87 608.98 751.94 546.35 738.35
S. No. Power Station FY 2011-12 FY 2012-13 FY 2013-14 FY 2014-15
Interest on Working Capital
FY 2015-16
3.16.2 The interest on working capital claimed for Generation and Distribution Function claimed in
the above table is computed based on normative calculation as per norms specified in
TNERC (Terms and Conditions of Tariff) Regulations, 2005. However, it is submitted that
based on the past tariff order, the security deposit amount has been excluded from the
Working capital requirement of Distribution for computation of interest on working capital,
though the same is not specified in the Tariff Regulation’s. This has resulted into NIL Interest
on Working capital.
3.16.3 The interest on working capital arrived by TANGEDCO in line with the norms specified by
Hon’ble TNERC for FY 2011-12, FY 2012-13, FY 2013-14, FY 2014-15 and FY 2015-16 for
entire TANGEDCo are Rs. 353.84 Crores, Rs. 434.12 Crores, Rs. 499.87 Crores, Rs. 751.94
Crores and 738.35 Crores respectively.
3.17 Return on Equity
3.17.1 The table below shows the Return on Equity for FY 2011-12 to FY 2015-16 claimed by
TANEDCO for respective years.

Petition for Final True-up for FY 2011-12 to FY 2015-16, ARR for FY 2017-18 to FY 2018-19
Page 38
Table 19: Return on Equity for FY 2011-12, to FY 2015-16
Approved Actual Approved Actual Approved Actual Approved Actual Approved Actual
1 Ennore TPS - 34.69 - 62.69 - 77.23 - 63.82 - 63.82
2 Tuticorin TPS - 61.09 - 110.41 - 136.93 - 115.10 - 115.10
3 Mettur TPS - 36.27 - 65.56 - 80.58 - 66.89 - 66.89
4 North Chennai TPS - 65.28 - 117.98 - 150.93 - 135.19 - 135.19
5 Mettur TPS Stage III - - - - - - - - - 163.83
6 NCTPS Stage II - - - - - - - - - -
7 Tirumakottai GTPS - 14.80 - 26.74 - 32.71 - 26.84 - 26.84
8 Kuttalam GTPS - 11.52 - 20.82 - 28.01 - 27.80 - 27.80
9 Basin Bridge GTPS - 18.09 - 32.70 - 39.99 - 32.56 - 32.56
10 Valuthur GTPS - 17.75 - 32.08 - 39.96 - 34.31 - 34.31
- -
11 Erode HEP - 22.84 - 41.29 - 62.14 - 70.00 - 70.00
12 Kadamparai HEP - 11.93 - 21.56 - 26.70 - 22.43 - 22.43
13 Kundah HEP - 31.37 - 56.70 - 69.52 - 57.12 - 57.12
14 Tirunelveli HEP - 12.53 - 22.64 - 29.11 - 26.84 - 26.84
- - - - - - - -
16 Total Generation - 338.17 - 611.17 - 773.82 - 678.89 - 842.72
- - -
17 Distribution - 260.62 - 471.02 - 600.44 - 582.32 - 582.32
- - -
18 Total TANGEDCO - 598.79 - 1,082.19 - 1,374.26 - 1,261.22 - 1,425.04
S. No. Power Station FY 2011-12 FY 2012-13 FY 2013-14 FY 2014-15
Return on Equity
FY 2015-16
*No approved figures as the Hon’ble Commission disallowed the return on equity in line with its earlier
Orders.
3.17.2 The total equity balance as on 31st March 2011 is bifurcated into generation and distribution
function based on the opening balance of Gross Block allotted to generation and distribution
function of TANGEDCO.
3.17.3 Equity for generation function is further sub-allocated into plant wise based on opening
gross block for each of the plant. The additions and deductions during the year are
considered as per actual for FY 2011-12 to FY 2015-16.
3.17.4 The rate of return on equity has been considered at 14% as specified in TNERC (Terms and
Conditions of Tariff) Regulations, 2005 and has been applied on the average equity balance
of each power station and distribution function.
3.17.5 The Hon’ble Commission in its last tariff order disallowed Return of Equity on the grounds
that loan borrowing is more than the capital expenditure incurred. However, TANGEDCO
would like to submit that a utility is entitled for Return on Equity as the RoE earned is
invested every year to carry out future capacity additions. The relevant extracts of TNERC
(Terms & Conditions of Tariff) Regulation 2005 is reproduced herein:
“21. Debt-Equity Ratio
Petition for Final True-up for FY 2011-12 to FY 2015-16, ARR for FY 2017-18 to FY 2018-19
Page 39
For the purpose of determination of tariff, debt-equity ratio as on the date of commercial
operation of Generating Station and transmission projects, sub-station, distribution lines or
capacity expanded after the notification of these Regulations shall be 70:30. Where equity
employed is more than 30% the amount of equity shall be limited to 30% and the balance
amount shall be considered as loans, advanced at the weighted average rate of interest and
for weighted average tenor of the long term debt component of the investment”
“Provided that in case of a Generating Company or other licensees, where actual equity
employed is less than 30%, the actual debt and equity shall be considered for determination
of return on equity in tariff computation.” (Emphasis Added)
3.17.6 Also TANGEDCO would like to submit that the cost of equity is always higher than the cost of
finance and depriving TANGEDCO from RoE of 14% is resulting in additional cost burdened
on the cash starved utility like TANGEDCO.
3.17.7 TANGEDCO submits that it has claimed ROE in this petition based on the Opening Balance of
actual Equity reflecting in annual accounts of FY 2011-12 to FY 2015-16. Therefore ROE may
be allowed on grounds that actual equity is being infused in the TANGEDCO system during
that respective year.
3.17.8 The normative equity claimed by TANGEDCO based on its actual equity balance for FY 2011-
12, FY 2012-13, FY2013-14, FY 2014-15 and FY 2015-16 for entire TANGEDCo are Rs. 598.79
Crores, Rs. 1082.19 Crores, Rs. 1374.26 Crores, 1261.22 Crores and Rs. 1425.04 Crores
respectively
3.18 Operation and Maintenance Expenses
3.18.1 The table below shows the operation and maintenance expenses for FY 2011-12 to FY 2015-
16 for generation and distribution function.
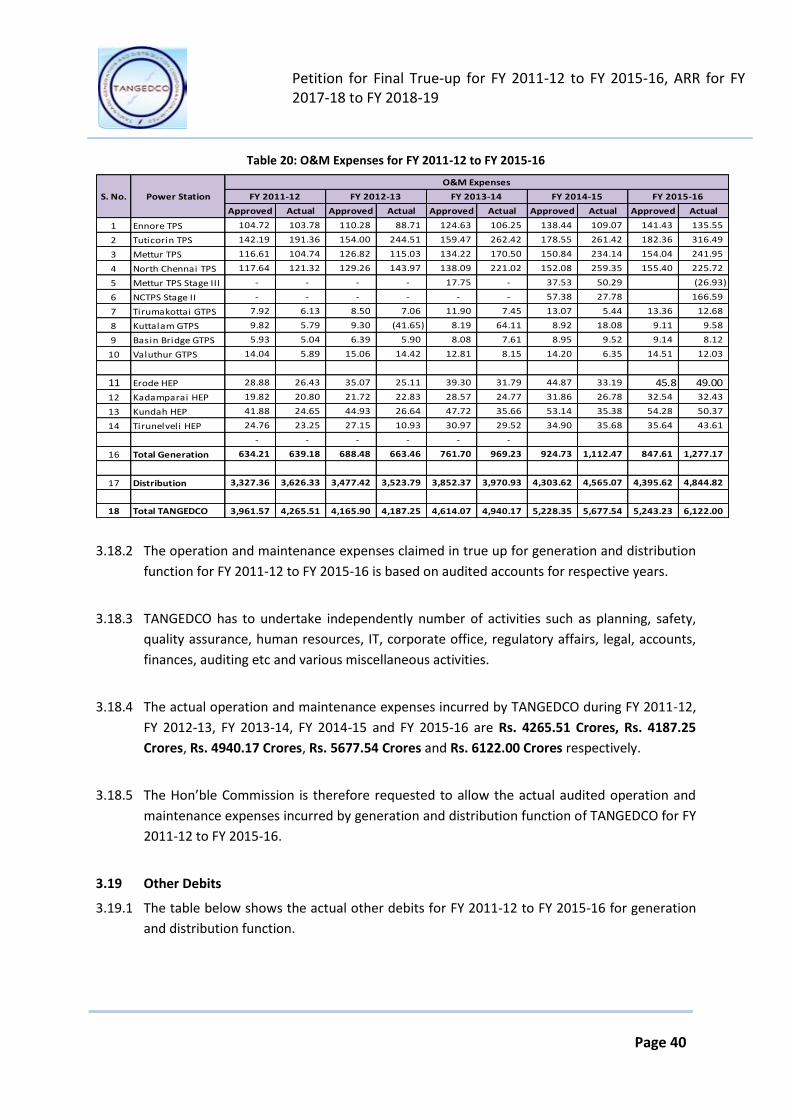
Petition for Final True-up for FY 2011-12 to FY 2015-16, ARR for FY 2017-18 to FY 2018-19
Page 40
Table 20: O&M Expenses for FY 2011-12 to FY 2015-16
Approved Actual Approved Actual Approved Actual Approved Actual Approved Actual
1 Ennore TPS 104.72 103.78 110.28 88.71 124.63 106.25 138.44 109.07 141.43 135.55
2 Tuticorin TPS 142.19 191.36 154.00 244.51 159.47 262.42 178.55 261.42 182.36 316.49
3 Mettur TPS 116.61 104.74 126.82 115.03 134.22 170.50 150.84 234.14 154.04 241.95
4 North Chennai TPS 117.64 121.32 129.26 143.97 138.09 221.02 152.08 259.35 155.40 225.72
5 Mettur TPS Stage III - - - - 17.75 - 37.53 50.29 (26.93)
6 NCTPS Stage II - - - - - - 57.38 27.78 166.59
7 Tirumakottai GTPS 7.92 6.13 8.50 7.06 11.90 7.45 13.07 5.44 13.36 12.68
8 Kuttalam GTPS 9.82 5.79 9.30 (41.65) 8.19 64.11 8.92 18.08 9.11 9.58
9 Basin Bridge GTPS 5.93 5.04 6.39 5.90 8.08 7.61 8.95 9.52 9.14 8.12
10 Valuthur GTPS 14.04 5.89 15.06 14.42 12.81 8.15 14.20 6.35 14.51 12.03
11 Erode HEP 28.88 26.43 35.07 25.11 39.30 31.79 44.87 33.19 45.8 49.00
12 Kadamparai HEP 19.82 20.80 21.72 22.83 28.57 24.77 31.86 26.78 32.54 32.43
13 Kundah HEP 41.88 24.65 44.93 26.64 47.72 35.66 53.14 35.38 54.28 50.37
14 Tirunelveli HEP 24.76 23.25 27.15 10.93 30.97 29.52 34.90 35.68 35.64 43.61
- - - - - -
16 Total Generation 634.21 639.18 688.48 663.46 761.70 969.23 924.73 1,112.47 847.61 1,277.17
17 Distribution 3,327.36 3,626.33 3,477.42 3,523.79 3,852.37 3,970.93 4,303.62 4,565.07 4,395.62 4,844.82
18 Total TANGEDCO 3,961.57 4,265.51 4,165.90 4,187.25 4,614.07 4,940.17 5,228.35 5,677.54 5,243.23 6,122.00
FY 2015-16
O&M Expenses
S. No. Power Station FY 2011-12 FY 2012-13 FY 2013-14 FY 2014-15
3.18.2 The operation and maintenance expenses claimed in true up for generation and distribution
function for FY 2011-12 to FY 2015-16 is based on audited accounts for respective years.
3.18.3 TANGEDCO has to undertake independently number of activities such as planning, safety,
quality assurance, human resources, IT, corporate office, regulatory affairs, legal, accounts,
finances, auditing etc and various miscellaneous activities.
3.18.4 The actual operation and maintenance expenses incurred by TANGEDCO during FY 2011-12,
FY 2012-13, FY 2013-14, FY 2014-15 and FY 2015-16 are Rs. 4265.51 Crores, Rs. 4187.25
Crores, Rs. 4940.17 Crores, Rs. 5677.54 Crores and Rs. 6122.00 Crores respectively.
3.18.5 The Hon’ble Commission is therefore requested to allow the actual audited operation and
maintenance expenses incurred by generation and distribution function of TANGEDCO for FY
2011-12 to FY 2015-16.
3.19 Other Debits
3.19.1 The table below shows the actual other debits for FY 2011-12 to FY 2015-16 for generation
and distribution function.
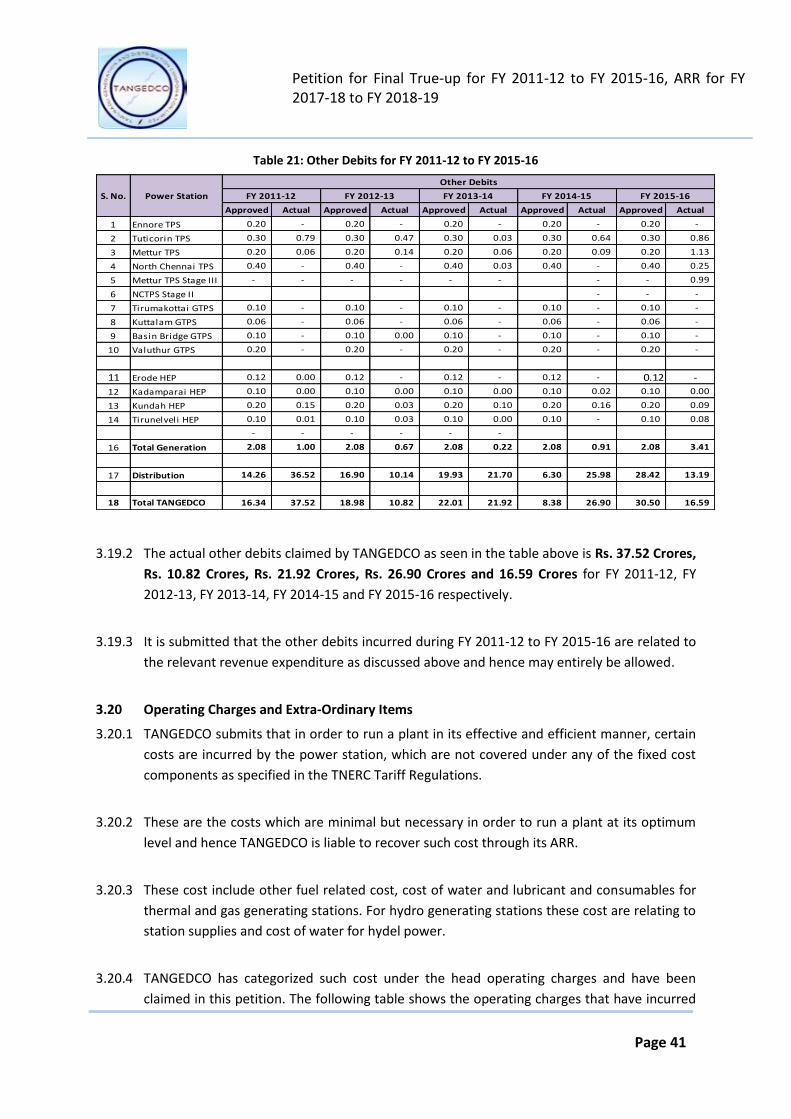
Petition for Final True-up for FY 2011-12 to FY 2015-16, ARR for FY 2017-18 to FY 2018-19
Page 41
Table 21: Other Debits for FY 2011-12 to FY 2015-16
Approved Actual Approved Actual Approved Actual Approved Actual Approved Actual
1 Ennore TPS 0.20 - 0.20 - 0.20 - 0.20 - 0.20 -
2 Tuticorin TPS 0.30 0.79 0.30 0.47 0.30 0.03 0.30 0.64 0.30 0.86
3 Mettur TPS 0.20 0.06 0.20 0.14 0.20 0.06 0.20 0.09 0.20 1.13
4 North Chennai TPS 0.40 - 0.40 - 0.40 0.03 0.40 - 0.40 0.25
5 Mettur TPS Stage III - - - - - - - - 0.99
6 NCTPS Stage II - - -
7 Tirumakottai GTPS 0.10 - 0.10 - 0.10 - 0.10 - 0.10 -
8 Kuttalam GTPS 0.06 - 0.06 - 0.06 - 0.06 - 0.06 -
9 Basin Bridge GTPS 0.10 - 0.10 0.00 0.10 - 0.10 - 0.10 -
10 Valuthur GTPS 0.20 - 0.20 - 0.20 - 0.20 - 0.20 -
11 Erode HEP 0.12 0.00 0.12 - 0.12 - 0.12 - 0.12 -
12 Kadamparai HEP 0.10 0.00 0.10 0.00 0.10 0.00 0.10 0.02 0.10 0.00
13 Kundah HEP 0.20 0.15 0.20 0.03 0.20 0.10 0.20 0.16 0.20 0.09
14 Tirunelveli HEP 0.10 0.01 0.10 0.03 0.10 0.00 0.10 - 0.10 0.08
- - - - - -
16 Total Generation 2.08 1.00 2.08 0.67 2.08 0.22 2.08 0.91 2.08 3.41
17 Distribution 14.26 36.52 16.90 10.14 19.93 21.70 6.30 25.98 28.42 13.19
18 Total TANGEDCO 16.34 37.52 18.98 10.82 22.01 21.92 8.38 26.90 30.50 16.59
S. No. Power Station FY 2011-12 FY 2012-13 FY 2013-14 FY 2014-15
Other Debits
FY 2015-16
3.19.2 The actual other debits claimed by TANGEDCO as seen in the table above is Rs. 37.52 Crores,
Rs. 10.82 Crores, Rs. 21.92 Crores, Rs. 26.90 Crores and 16.59 Crores for FY 2011-12, FY
2012-13, FY 2013-14, FY 2014-15 and FY 2015-16 respectively.
3.19.3 It is submitted that the other debits incurred during FY 2011-12 to FY 2015-16 are related to
the relevant revenue expenditure as discussed above and hence may entirely be allowed.
3.20 Operating Charges and Extra-Ordinary Items
3.20.1 TANGEDCO submits that in order to run a plant in its effective and efficient manner, certain
costs are incurred by the power station, which are not covered under any of the fixed cost
components as specified in the TNERC Tariff Regulations.
3.20.2 These are the costs which are minimal but necessary in order to run a plant at its optimum
level and hence TANGEDCO is liable to recover such cost through its ARR.
3.20.3 These cost include other fuel related cost, cost of water and lubricant and consumables for
thermal and gas generating stations. For hydro generating stations these cost are relating to
station supplies and cost of water for hydel power.
3.20.4 TANGEDCO has categorized such cost under the head operating charges and have been
claimed in this petition. The following table shows the operating charges that have incurred
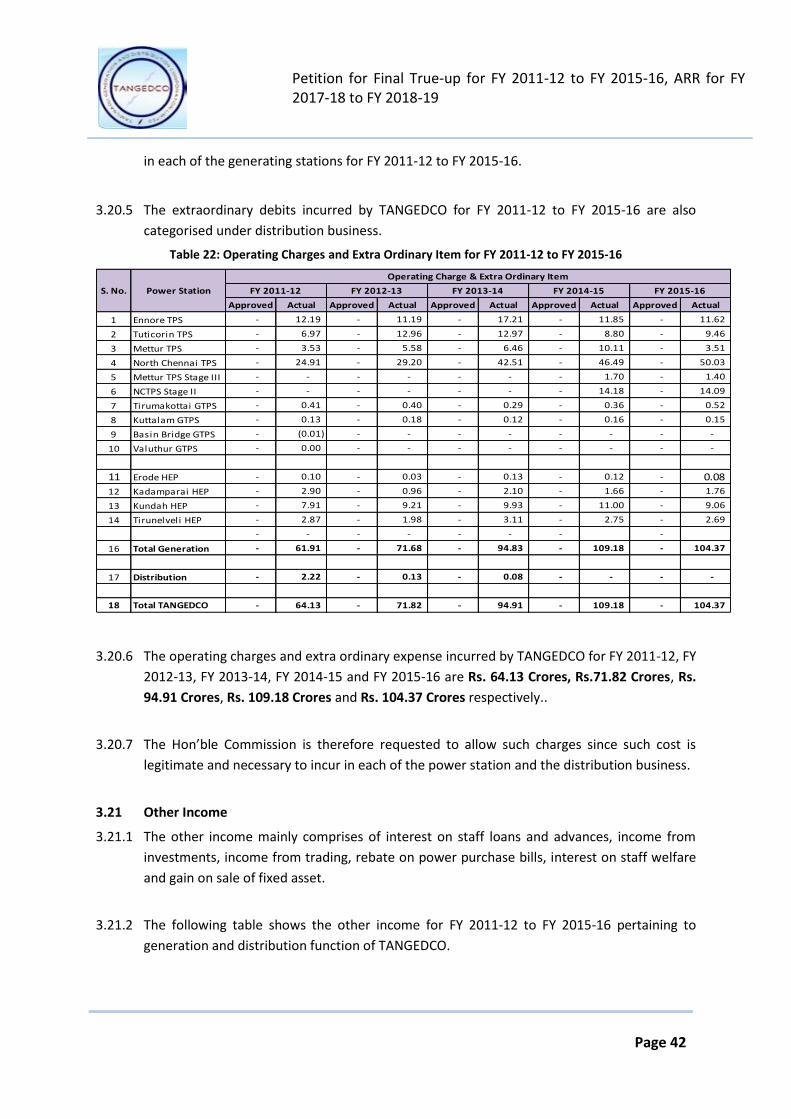
Petition for Final True-up for FY 2011-12 to FY 2015-16, ARR for FY 2017-18 to FY 2018-19
Page 42
in each of the generating stations for FY 2011-12 to FY 2015-16.
3.20.5 The extraordinary debits incurred by TANGEDCO for FY 2011-12 to FY 2015-16 are also
categorised under distribution business.
Table 22: Operating Charges and Extra Ordinary Item for FY 2011-12 to FY 2015-16
Approved Actual Approved Actual Approved Actual Approved Actual Approved Actual
1 Ennore TPS - 12.19 - 11.19 - 17.21 - 11.85 - 11.62
2 Tuticorin TPS - 6.97 - 12.96 - 12.97 - 8.80 - 9.46
3 Mettur TPS - 3.53 - 5.58 - 6.46 - 10.11 - 3.51
4 North Chennai TPS - 24.91 - 29.20 - 42.51 - 46.49 - 50.03
5 Mettur TPS Stage III - - - - - - - 1.70 - 1.40
6 NCTPS Stage II - - - - - - - 14.18 - 14.09
7 Tirumakottai GTPS - 0.41 - 0.40 - 0.29 - 0.36 - 0.52
8 Kuttalam GTPS - 0.13 - 0.18 - 0.12 - 0.16 - 0.15
9 Basin Bridge GTPS - (0.01) - - - - - - - -
10 Valuthur GTPS - 0.00 - - - - - - - -
11 Erode HEP - 0.10 - 0.03 - 0.13 - 0.12 - 0.08
12 Kadamparai HEP - 2.90 - 0.96 - 2.10 - 1.66 - 1.76
13 Kundah HEP - 7.91 - 9.21 - 9.93 - 11.00 - 9.06
14 Tirunelveli HEP - 2.87 - 1.98 - 3.11 - 2.75 - 2.69
- - - - - - - -
16 Total Generation - 61.91 - 71.68 - 94.83 - 109.18 - 104.37
17 Distribution - 2.22 - 0.13 - 0.08 - - - -
18 Total TANGEDCO - 64.13 - 71.82 - 94.91 - 109.18 - 104.37
FY 2015-16
Operating Charge & Extra Ordinary Item
S. No. Power Station FY 2011-12 FY 2012-13 FY 2013-14 FY 2014-15
3.20.6 The operating charges and extra ordinary expense incurred by TANGEDCO for FY 2011-12, FY
2012-13, FY 2013-14, FY 2014-15 and FY 2015-16 are Rs. 64.13 Crores, Rs.71.82 Crores, Rs.
94.91 Crores, Rs. 109.18 Crores and Rs. 104.37 Crores respectively..
3.20.7 The Hon’ble Commission is therefore requested to allow such charges since such cost is
legitimate and necessary to incur in each of the power station and the distribution business.
3.21 Other Income
3.21.1 The other income mainly comprises of interest on staff loans and advances, income from
investments, income from trading, rebate on power purchase bills, interest on staff welfare
and gain on sale of fixed asset.
3.21.2 The following table shows the other income for FY 2011-12 to FY 2015-16 pertaining to
generation and distribution function of TANGEDCO.
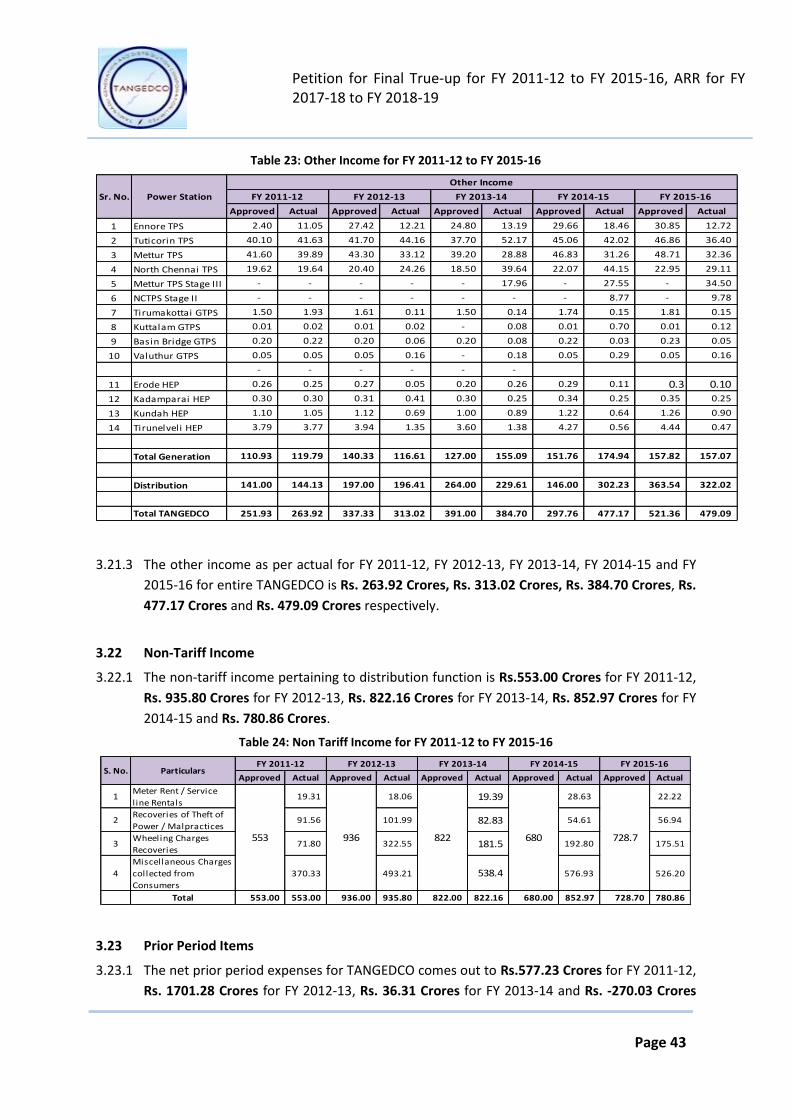
Petition for Final True-up for FY 2011-12 to FY 2015-16, ARR for FY 2017-18 to FY 2018-19
Page 43
Table 23: Other Income for FY 2011-12 to FY 2015-16
Approved Actual Approved Actual Approved Actual Approved Actual Approved Actual
1 Ennore TPS 2.40 11.05 27.42 12.21 24.80 13.19 29.66 18.46 30.85 12.72
2 Tuticorin TPS 40.10 41.63 41.70 44.16 37.70 52.17 45.06 42.02 46.86 36.40
3 Mettur TPS 41.60 39.89 43.30 33.12 39.20 28.88 46.83 31.26 48.71 32.36
4 North Chennai TPS 19.62 19.64 20.40 24.26 18.50 39.64 22.07 44.15 22.95 29.11
5 Mettur TPS Stage III - - - - - 17.96 - 27.55 - 34.50
6 NCTPS Stage II - - - - - - - 8.77 - 9.78
7 Tirumakottai GTPS 1.50 1.93 1.61 0.11 1.50 0.14 1.74 0.15 1.81 0.15
8 Kuttalam GTPS 0.01 0.02 0.01 0.02 - 0.08 0.01 0.70 0.01 0.12
9 Basin Bridge GTPS 0.20 0.22 0.20 0.06 0.20 0.08 0.22 0.03 0.23 0.05
10 Valuthur GTPS 0.05 0.05 0.05 0.16 - 0.18 0.05 0.29 0.05 0.16
- - - - - -
11 Erode HEP 0.26 0.25 0.27 0.05 0.20 0.26 0.29 0.11 0.3 0.10
12 Kadamparai HEP 0.30 0.30 0.31 0.41 0.30 0.25 0.34 0.25 0.35 0.25
13 Kundah HEP 1.10 1.05 1.12 0.69 1.00 0.89 1.22 0.64 1.26 0.90
14 Tirunelveli HEP 3.79 3.77 3.94 1.35 3.60 1.38 4.27 0.56 4.44 0.47
Total Generation 110.93 119.79 140.33 116.61 127.00 155.09 151.76 174.94 157.82 157.07
Distribution 141.00 144.13 197.00 196.41 264.00 229.61 146.00 302.23 363.54 322.02
Total TANGEDCO 251.93 263.92 337.33 313.02 391.00 384.70 297.76 477.17 521.36 479.09
FY 2012-13 FY 2013-14 FY 2014-15 FY 2015-16
Other Income
Sr. No. Power Station FY 2011-12
3.21.3 The other income as per actual for FY 2011-12, FY 2012-13, FY 2013-14, FY 2014-15 and FY
2015-16 for entire TANGEDCO is Rs. 263.92 Crores, Rs. 313.02 Crores, Rs. 384.70 Crores, Rs.
477.17 Crores and Rs. 479.09 Crores respectively.
3.22 Non-Tariff Income
3.22.1 The non-tariff income pertaining to distribution function is Rs.553.00 Crores for FY 2011-12,
Rs. 935.80 Crores for FY 2012-13, Rs. 822.16 Crores for FY 2013-14, Rs. 852.97 Crores for FY
2014-15 and Rs. 780.86 Crores.
Table 24: Non Tariff Income for FY 2011-12 to FY 2015-16
Approved Actual Approved Actual Approved Actual Approved Actual Approved Actual
1Meter Rent / Service
l ine Rentals19.31 18.06 19.39 28.63 22.22
2Recoveries of Theft of
Power / Malpractices91.56 101.99 82.83 54.61 56.94
3Wheeling Charges
Recoveries71.80 322.55 181.5 192.80 175.51
4
Miscellaneous Charges
collected from
Consumers
370.33 493.21 538.4 576.93 526.20
Total 553.00 553.00 936.00 935.80 822.00 822.16 680.00 852.97 728.70 780.86
553 936 822 680
S. No. ParticularsFY 2011-12 FY 2012-13 FY 2013-14 FY 2014-15 FY 2015-16
728.7
3.23 Prior Period Items
3.23.1 The net prior period expenses for TANGEDCO comes out to Rs.577.23 Crores for FY 2011-12,
Rs. 1701.28 Crores for FY 2012-13, Rs. 36.31 Crores for FY 2013-14 and Rs. -270.03 Crores
Petition for Final True-up for FY 2011-12 to FY 2015-16, ARR for FY 2017-18 to FY 2018-19
Page 44
for FY 2014-15 and Rs -1443.47 Crores for FY 2015-16. These are mainly on account of
payments made relating to power purchase, revision in tariff payments and fuel price
adjustment to Central Generating Stations. It also includes employee cost interest and other
administrative expenses relating to prior period.
3.24 Summary of Fixed Cost of TANGEDCO for FY 2011-12 to FY 2015-16
3.24.1 The following table shows the summary of fixed cost for FY 2011-12 for Generation and
Distribution Function of TANGEDCO.
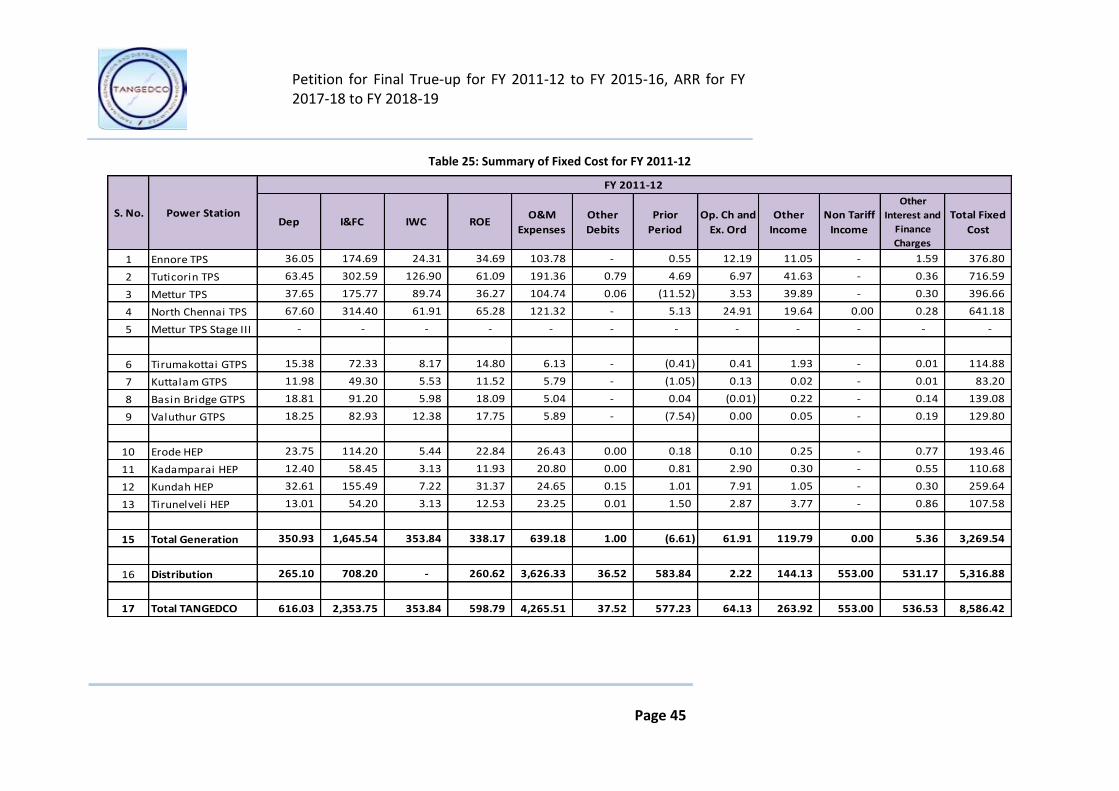
Petition for Final True-up for FY 2011-12 to FY 2015-16, ARR for FY 2017-18 to FY 2018-19
Page 45
Table 25: Summary of Fixed Cost for FY 2011-12
Dep I&FC IWC ROEO&M
Expenses
Other
Debits
Prior
Period
Op. Ch and
Ex. Ord
Other
Income
Non Tariff
Income
Other
Interest and
Finance
Charges
Total Fixed
Cost
1 Ennore TPS 36.05 174.69 24.31 34.69 103.78 - 0.55 12.19 11.05 - 1.59 376.80
2 Tuticorin TPS 63.45 302.59 126.90 61.09 191.36 0.79 4.69 6.97 41.63 - 0.36 716.59
3 Mettur TPS 37.65 175.77 89.74 36.27 104.74 0.06 (11.52) 3.53 39.89 - 0.30 396.66
4 North Chennai TPS 67.60 314.40 61.91 65.28 121.32 - 5.13 24.91 19.64 0.00 0.28 641.18
5 Mettur TPS Stage III - - - - - - - - - - - -
6 Tirumakottai GTPS 15.38 72.33 8.17 14.80 6.13 - (0.41) 0.41 1.93 - 0.01 114.88
7 Kuttalam GTPS 11.98 49.30 5.53 11.52 5.79 - (1.05) 0.13 0.02 - 0.01 83.20
8 Basin Bridge GTPS 18.81 91.20 5.98 18.09 5.04 - 0.04 (0.01) 0.22 - 0.14 139.08
9 Valuthur GTPS 18.25 82.93 12.38 17.75 5.89 - (7.54) 0.00 0.05 - 0.19 129.80
10 Erode HEP 23.75 114.20 5.44 22.84 26.43 0.00 0.18 0.10 0.25 - 0.77 193.46
11 Kadamparai HEP 12.40 58.45 3.13 11.93 20.80 0.00 0.81 2.90 0.30 - 0.55 110.68
12 Kundah HEP 32.61 155.49 7.22 31.37 24.65 0.15 1.01 7.91 1.05 - 0.30 259.64
13 Tirunelveli HEP 13.01 54.20 3.13 12.53 23.25 0.01 1.50 2.87 3.77 - 0.86 107.58
15 Total Generation 350.93 1,645.54 353.84 338.17 639.18 1.00 (6.61) 61.91 119.79 0.00 5.36 3,269.54
16 Distribution 265.10 708.20 - 260.62 3,626.33 36.52 583.84 2.22 144.13 553.00 531.17 5,316.88
17 Total TANGEDCO 616.03 2,353.75 353.84 598.79 4,265.51 37.52 577.23 64.13 263.92 553.00 536.53 8,586.42
S. No. Power Station
FY 2011-12
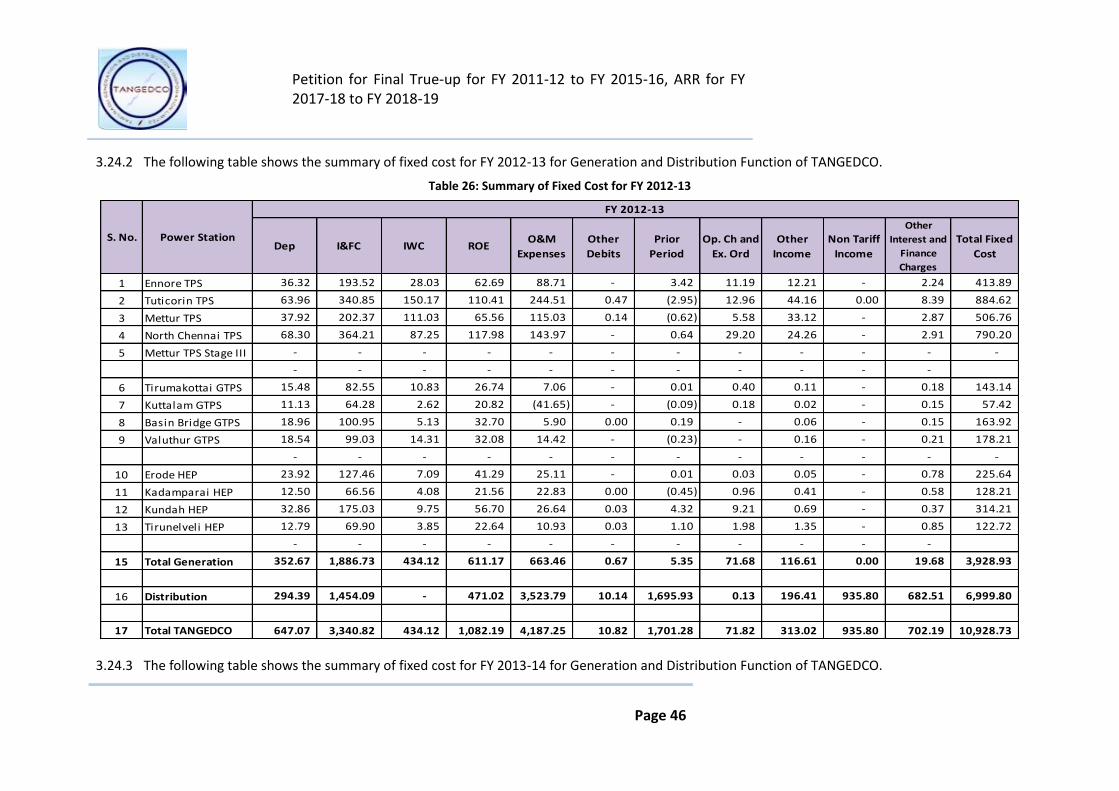
Petition for Final True-up for FY 2011-12 to FY 2015-16, ARR for FY 2017-18 to FY 2018-19
Page 46
3.24.2 The following table shows the summary of fixed cost for FY 2012-13 for Generation and Distribution Function of TANGEDCO.
Table 26: Summary of Fixed Cost for FY 2012-13
Dep I&FC IWC ROEO&M
Expenses
Other
Debits
Prior
Period
Op. Ch and
Ex. Ord
Other
Income
Non Tariff
Income
Other
Interest and
Finance
Charges
Total Fixed
Cost
1 Ennore TPS 36.32 193.52 28.03 62.69 88.71 - 3.42 11.19 12.21 - 2.24 413.89
2 Tuticorin TPS 63.96 340.85 150.17 110.41 244.51 0.47 (2.95) 12.96 44.16 0.00 8.39 884.62
3 Mettur TPS 37.92 202.37 111.03 65.56 115.03 0.14 (0.62) 5.58 33.12 - 2.87 506.76
4 North Chennai TPS 68.30 364.21 87.25 117.98 143.97 - 0.64 29.20 24.26 - 2.91 790.20
5 Mettur TPS Stage III - - - - - - - - - - - -
- - - - - - - - - - -
6 Tirumakottai GTPS 15.48 82.55 10.83 26.74 7.06 - 0.01 0.40 0.11 - 0.18 143.14
7 Kuttalam GTPS 11.13 64.28 2.62 20.82 (41.65) - (0.09) 0.18 0.02 - 0.15 57.42
8 Basin Bridge GTPS 18.96 100.95 5.13 32.70 5.90 0.00 0.19 - 0.06 - 0.15 163.92
9 Valuthur GTPS 18.54 99.03 14.31 32.08 14.42 - (0.23) - 0.16 - 0.21 178.21
- - - - - - - - - - - -
10 Erode HEP 23.92 127.46 7.09 41.29 25.11 - 0.01 0.03 0.05 - 0.78 225.64
11 Kadamparai HEP 12.50 66.56 4.08 21.56 22.83 0.00 (0.45) 0.96 0.41 - 0.58 128.21
12 Kundah HEP 32.86 175.03 9.75 56.70 26.64 0.03 4.32 9.21 0.69 - 0.37 314.21
13 Tirunelveli HEP 12.79 69.90 3.85 22.64 10.93 0.03 1.10 1.98 1.35 - 0.85 122.72
- - - - - - - - - - -
15 Total Generation 352.67 1,886.73 434.12 611.17 663.46 0.67 5.35 71.68 116.61 0.00 19.68 3,928.93
16 Distribution 294.39 1,454.09 - 471.02 3,523.79 10.14 1,695.93 0.13 196.41 935.80 682.51 6,999.80
17 Total TANGEDCO 647.07 3,340.82 434.12 1,082.19 4,187.25 10.82 1,701.28 71.82 313.02 935.80 702.19 10,928.73
S. No. Power Station
FY 2012-13
3.24.3 The following table shows the summary of fixed cost for FY 2013-14 for Generation and Distribution Function of TANGEDCO.
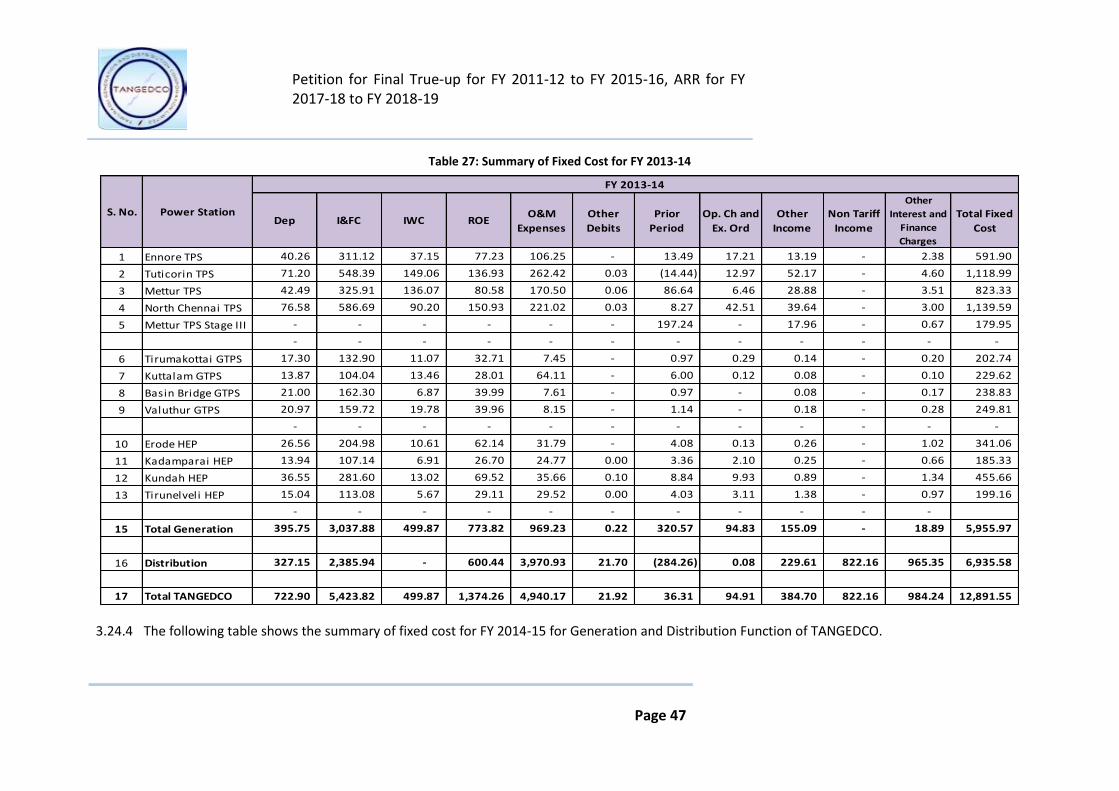
Petition for Final True-up for FY 2011-12 to FY 2015-16, ARR for FY 2017-18 to FY 2018-19
Page 47
Table 27: Summary of Fixed Cost for FY 2013-14
Dep I&FC IWC ROEO&M
Expenses
Other
Debits
Prior
Period
Op. Ch and
Ex. Ord
Other
Income
Non Tariff
Income
Other
Interest and
Finance
Charges
Total Fixed
Cost
1 Ennore TPS 40.26 311.12 37.15 77.23 106.25 - 13.49 17.21 13.19 - 2.38 591.90
2 Tuticorin TPS 71.20 548.39 149.06 136.93 262.42 0.03 (14.44) 12.97 52.17 - 4.60 1,118.99
3 Mettur TPS 42.49 325.91 136.07 80.58 170.50 0.06 86.64 6.46 28.88 - 3.51 823.33
4 North Chennai TPS 76.58 586.69 90.20 150.93 221.02 0.03 8.27 42.51 39.64 - 3.00 1,139.59
5 Mettur TPS Stage III - - - - - - 197.24 - 17.96 - 0.67 179.95
- - - - - - - - - - - -
6 Tirumakottai GTPS 17.30 132.90 11.07 32.71 7.45 - 0.97 0.29 0.14 - 0.20 202.74
7 Kuttalam GTPS 13.87 104.04 13.46 28.01 64.11 - 6.00 0.12 0.08 - 0.10 229.62
8 Basin Bridge GTPS 21.00 162.30 6.87 39.99 7.61 - 0.97 - 0.08 - 0.17 238.83
9 Valuthur GTPS 20.97 159.72 19.78 39.96 8.15 - 1.14 - 0.18 - 0.28 249.81
- - - - - - - - - - - -
10 Erode HEP 26.56 204.98 10.61 62.14 31.79 - 4.08 0.13 0.26 - 1.02 341.06
11 Kadamparai HEP 13.94 107.14 6.91 26.70 24.77 0.00 3.36 2.10 0.25 - 0.66 185.33
12 Kundah HEP 36.55 281.60 13.02 69.52 35.66 0.10 8.84 9.93 0.89 - 1.34 455.66
13 Tirunelveli HEP 15.04 113.08 5.67 29.11 29.52 0.00 4.03 3.11 1.38 - 0.97 199.16
- - - - - - - - - - -
15 Total Generation 395.75 3,037.88 499.87 773.82 969.23 0.22 320.57 94.83 155.09 - 18.89 5,955.97
16 Distribution 327.15 2,385.94 - 600.44 3,970.93 21.70 (284.26) 0.08 229.61 822.16 965.35 6,935.58
17 Total TANGEDCO 722.90 5,423.82 499.87 1,374.26 4,940.17 21.92 36.31 94.91 384.70 822.16 984.24 12,891.55
S. No. Power Station
FY 2013-14
3.24.4 The following table shows the summary of fixed cost for FY 2014-15 for Generation and Distribution Function of TANGEDCO.
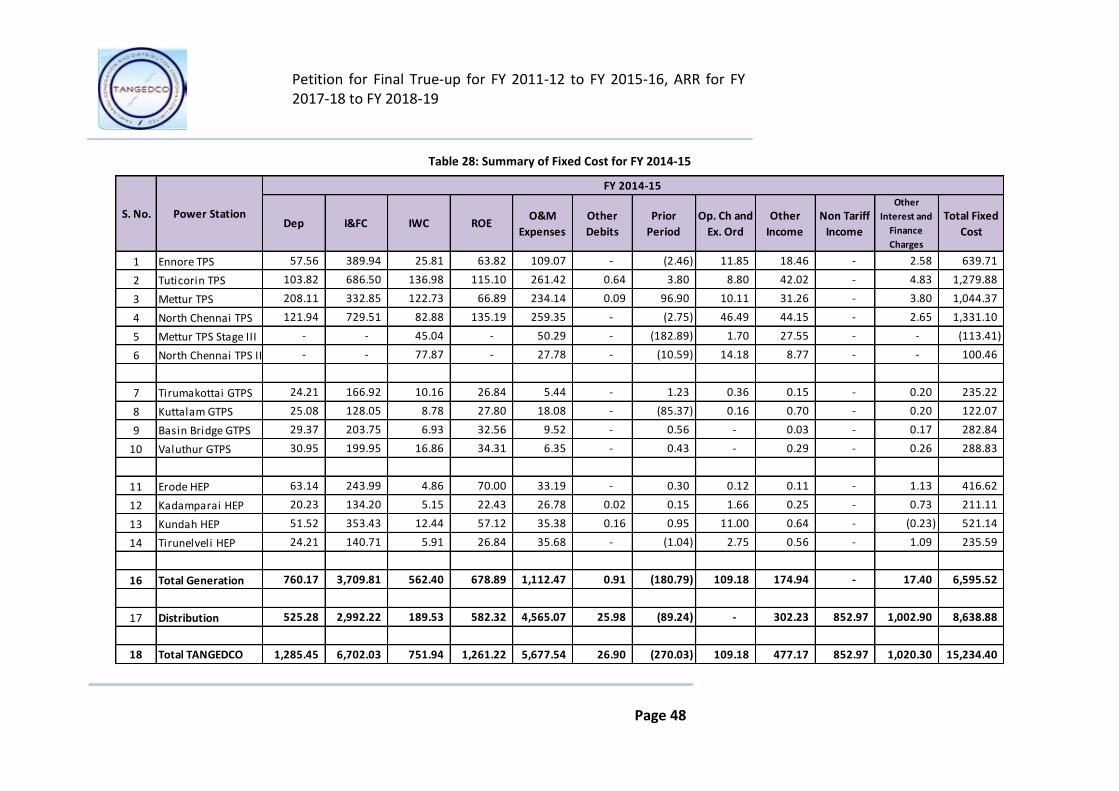
Petition for Final True-up for FY 2011-12 to FY 2015-16, ARR for FY 2017-18 to FY 2018-19
Page 48
Table 28: Summary of Fixed Cost for FY 2014-15
Dep I&FC IWC ROEO&M
Expenses
Other
Debits
Prior
Period
Op. Ch and
Ex. Ord
Other
Income
Non Tariff
Income
Other
Interest and
Finance
Charges
Total Fixed
Cost
1 Ennore TPS 57.56 389.94 25.81 63.82 109.07 - (2.46) 11.85 18.46 - 2.58 639.71
2 Tuticorin TPS 103.82 686.50 136.98 115.10 261.42 0.64 3.80 8.80 42.02 - 4.83 1,279.88
3 Mettur TPS 208.11 332.85 122.73 66.89 234.14 0.09 96.90 10.11 31.26 - 3.80 1,044.37
4 North Chennai TPS 121.94 729.51 82.88 135.19 259.35 - (2.75) 46.49 44.15 - 2.65 1,331.10
5 Mettur TPS Stage III - - 45.04 - 50.29 - (182.89) 1.70 27.55 - - (113.41)
6 North Chennai TPS II - - 77.87 - 27.78 - (10.59) 14.18 8.77 - - 100.46
7 Tirumakottai GTPS 24.21 166.92 10.16 26.84 5.44 - 1.23 0.36 0.15 - 0.20 235.22
8 Kuttalam GTPS 25.08 128.05 8.78 27.80 18.08 - (85.37) 0.16 0.70 - 0.20 122.07
9 Basin Bridge GTPS 29.37 203.75 6.93 32.56 9.52 - 0.56 - 0.03 - 0.17 282.84
10 Valuthur GTPS 30.95 199.95 16.86 34.31 6.35 - 0.43 - 0.29 - 0.26 288.83
11 Erode HEP 63.14 243.99 4.86 70.00 33.19 - 0.30 0.12 0.11 - 1.13 416.62
12 Kadamparai HEP 20.23 134.20 5.15 22.43 26.78 0.02 0.15 1.66 0.25 - 0.73 211.11
13 Kundah HEP 51.52 353.43 12.44 57.12 35.38 0.16 0.95 11.00 0.64 - (0.23) 521.14
14 Tirunelveli HEP 24.21 140.71 5.91 26.84 35.68 - (1.04) 2.75 0.56 - 1.09 235.59
16 Total Generation 760.17 3,709.81 562.40 678.89 1,112.47 0.91 (180.79) 109.18 174.94 - 17.40 6,595.52
17 Distribution 525.28 2,992.22 189.53 582.32 4,565.07 25.98 (89.24) - 302.23 852.97 1,002.90 8,638.88
18 Total TANGEDCO 1,285.45 6,702.03 751.94 1,261.22 5,677.54 26.90 (270.03) 109.18 477.17 852.97 1,020.30 15,234.40
S. No. Power Station
FY 2014-15
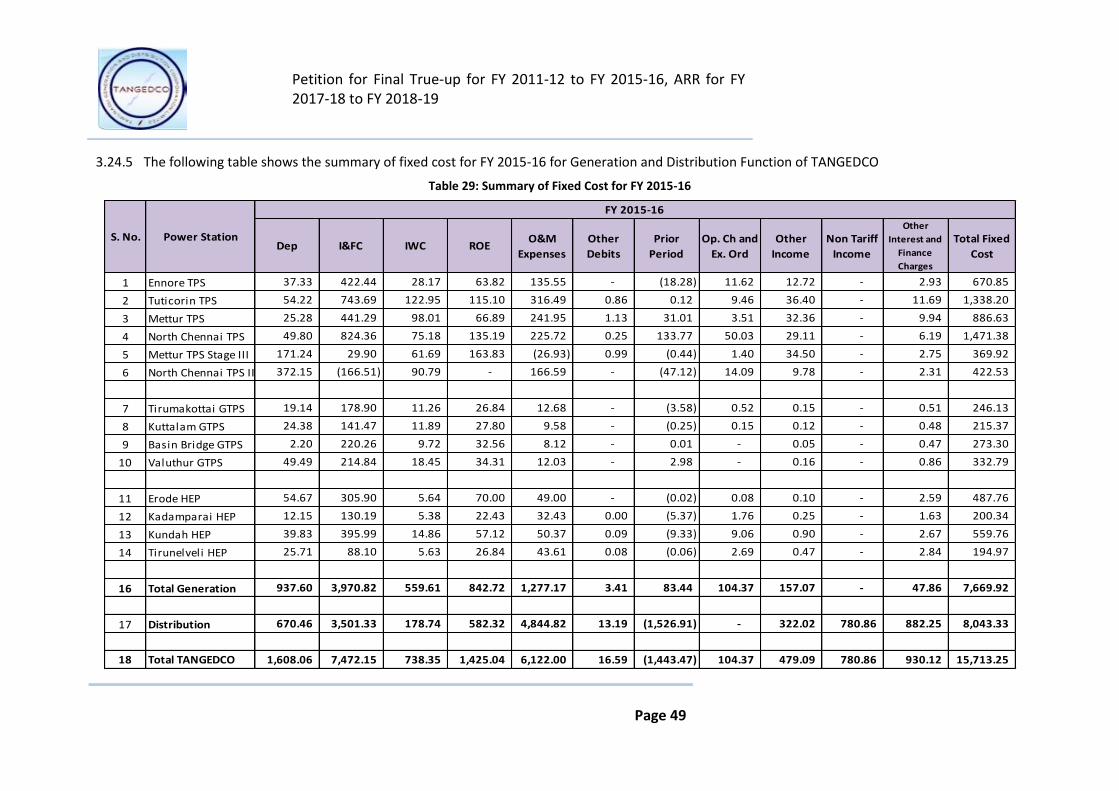
Petition for Final True-up for FY 2011-12 to FY 2015-16, ARR for FY 2017-18 to FY 2018-19
Page 49
3.24.5 The following table shows the summary of fixed cost for FY 2015-16 for Generation and Distribution Function of TANGEDCO
Table 29: Summary of Fixed Cost for FY 2015-16
Dep I&FC IWC ROEO&M
Expenses
Other
Debits
Prior
Period
Op. Ch and
Ex. Ord
Other
Income
Non Tariff
Income
Other
Interest and
Finance
Charges
Total Fixed
Cost
1 Ennore TPS 37.33 422.44 28.17 63.82 135.55 - (18.28) 11.62 12.72 - 2.93 670.85
2 Tuticorin TPS 54.22 743.69 122.95 115.10 316.49 0.86 0.12 9.46 36.40 - 11.69 1,338.20
3 Mettur TPS 25.28 441.29 98.01 66.89 241.95 1.13 31.01 3.51 32.36 - 9.94 886.63
4 North Chennai TPS 49.80 824.36 75.18 135.19 225.72 0.25 133.77 50.03 29.11 - 6.19 1,471.38
5 Mettur TPS Stage III 171.24 29.90 61.69 163.83 (26.93) 0.99 (0.44) 1.40 34.50 - 2.75 369.92
6 North Chennai TPS II 372.15 (166.51) 90.79 - 166.59 - (47.12) 14.09 9.78 - 2.31 422.53
7 Tirumakottai GTPS 19.14 178.90 11.26 26.84 12.68 - (3.58) 0.52 0.15 - 0.51 246.13
8 Kuttalam GTPS 24.38 141.47 11.89 27.80 9.58 - (0.25) 0.15 0.12 - 0.48 215.37
9 Basin Bridge GTPS 2.20 220.26 9.72 32.56 8.12 - 0.01 - 0.05 - 0.47 273.30
10 Valuthur GTPS 49.49 214.84 18.45 34.31 12.03 - 2.98 - 0.16 - 0.86 332.79
11 Erode HEP 54.67 305.90 5.64 70.00 49.00 - (0.02) 0.08 0.10 - 2.59 487.76
12 Kadamparai HEP 12.15 130.19 5.38 22.43 32.43 0.00 (5.37) 1.76 0.25 - 1.63 200.34
13 Kundah HEP 39.83 395.99 14.86 57.12 50.37 0.09 (9.33) 9.06 0.90 - 2.67 559.76
14 Tirunelveli HEP 25.71 88.10 5.63 26.84 43.61 0.08 (0.06) 2.69 0.47 - 2.84 194.97
16 Total Generation 937.60 3,970.82 559.61 842.72 1,277.17 3.41 83.44 104.37 157.07 - 47.86 7,669.92
17 Distribution 670.46 3,501.33 178.74 582.32 4,844.82 13.19 (1,526.91) - 322.02 780.86 882.25 8,043.33
18 Total TANGEDCO 1,608.06 7,472.15 738.35 1,425.04 6,122.00 16.59 (1,443.47) 104.37 479.09 780.86 930.12 15,713.25
S. No. Power Station
FY 2015-16
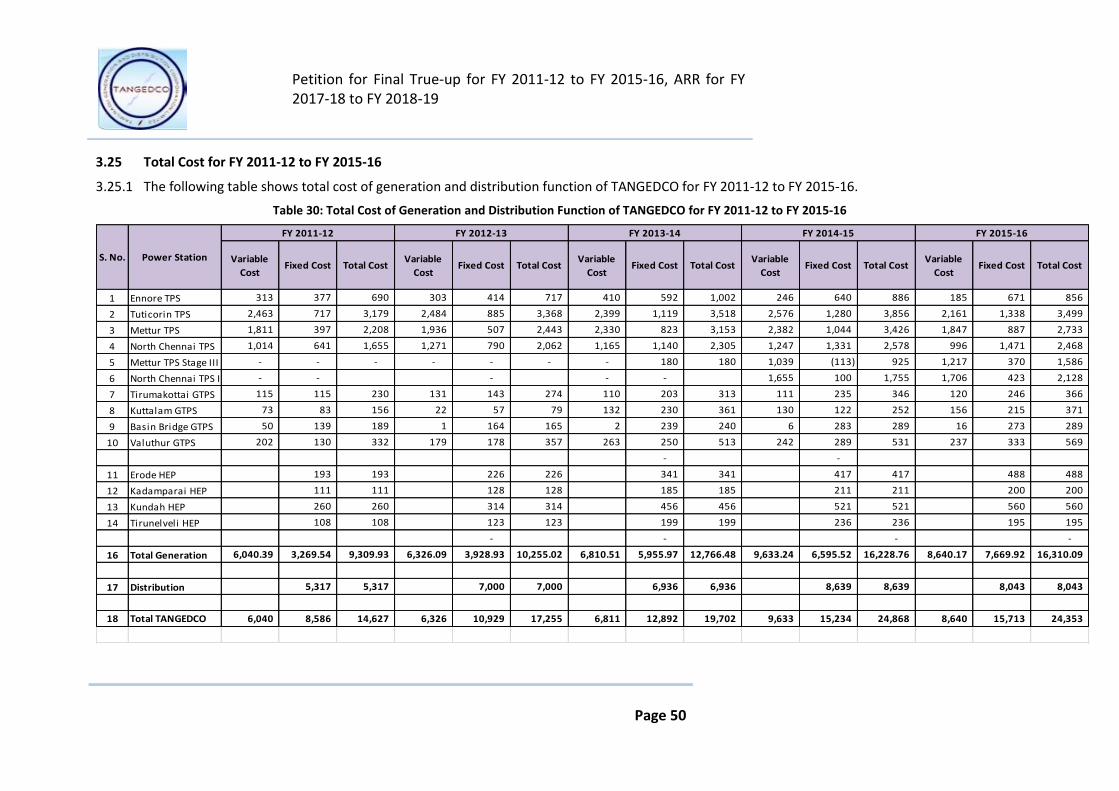
Petition for Final True-up for FY 2011-12 to FY 2015-16, ARR for FY 2017-18 to FY 2018-19
Page 50
3.25 Total Cost for FY 2011-12 to FY 2015-16
3.25.1 The following table shows total cost of generation and distribution function of TANGEDCO for FY 2011-12 to FY 2015-16.
Table 30: Total Cost of Generation and Distribution Function of TANGEDCO for FY 2011-12 to FY 2015-16
Variable
CostFixed Cost Total Cost
Variable
CostFixed Cost Total Cost
Variable
CostFixed Cost Total Cost
Variable
CostFixed Cost Total Cost
Variable
CostFixed Cost Total Cost
1 Ennore TPS 313 377 690 303 414 717 410 592 1,002 246 640 886 185 671 856
2 Tuticorin TPS 2,463 717 3,179 2,484 885 3,368 2,399 1,119 3,518 2,576 1,280 3,856 2,161 1,338 3,499
3 Mettur TPS 1,811 397 2,208 1,936 507 2,443 2,330 823 3,153 2,382 1,044 3,426 1,847 887 2,733
4 North Chennai TPS 1,014 641 1,655 1,271 790 2,062 1,165 1,140 2,305 1,247 1,331 2,578 996 1,471 2,468
5 Mettur TPS Stage III - - - - - - - 180 180 1,039 (113) 925 1,217 370 1,586
6 North Chennai TPS II - - - - - 1,655 100 1,755 1,706 423 2,128
7 Tirumakottai GTPS 115 115 230 131 143 274 110 203 313 111 235 346 120 246 366
8 Kuttalam GTPS 73 83 156 22 57 79 132 230 361 130 122 252 156 215 371
9 Basin Bridge GTPS 50 139 189 1 164 165 2 239 240 6 283 289 16 273 289
10 Valuthur GTPS 202 130 332 179 178 357 263 250 513 242 289 531 237 333 569
- -
11 Erode HEP 193 193 226 226 341 341 417 417 488 488
12 Kadamparai HEP 111 111 128 128 185 185 211 211 200 200
13 Kundah HEP 260 260 314 314 456 456 521 521 560 560
14 Tirunelveli HEP 108 108 123 123 199 199 236 236 195 195
- - - -
16 Total Generation 6,040.39 3,269.54 9,309.93 6,326.09 3,928.93 10,255.02 6,810.51 5,955.97 12,766.48 9,633.24 6,595.52 16,228.76 8,640.17 7,669.92 16,310.09
17 Distribution 5,317 5,317 7,000 7,000 6,936 6,936 8,639 8,639 8,043 8,043
18 Total TANGEDCO 6,040 8,586 14,627 6,326 10,929 17,255 6,811 12,892 19,702 9,633 15,234 24,868 8,640 15,713 24,353
FY 2015-16FY 2012-13 FY 2013-14 FY 2014-15
S. No. Power Station
FY 2011-12
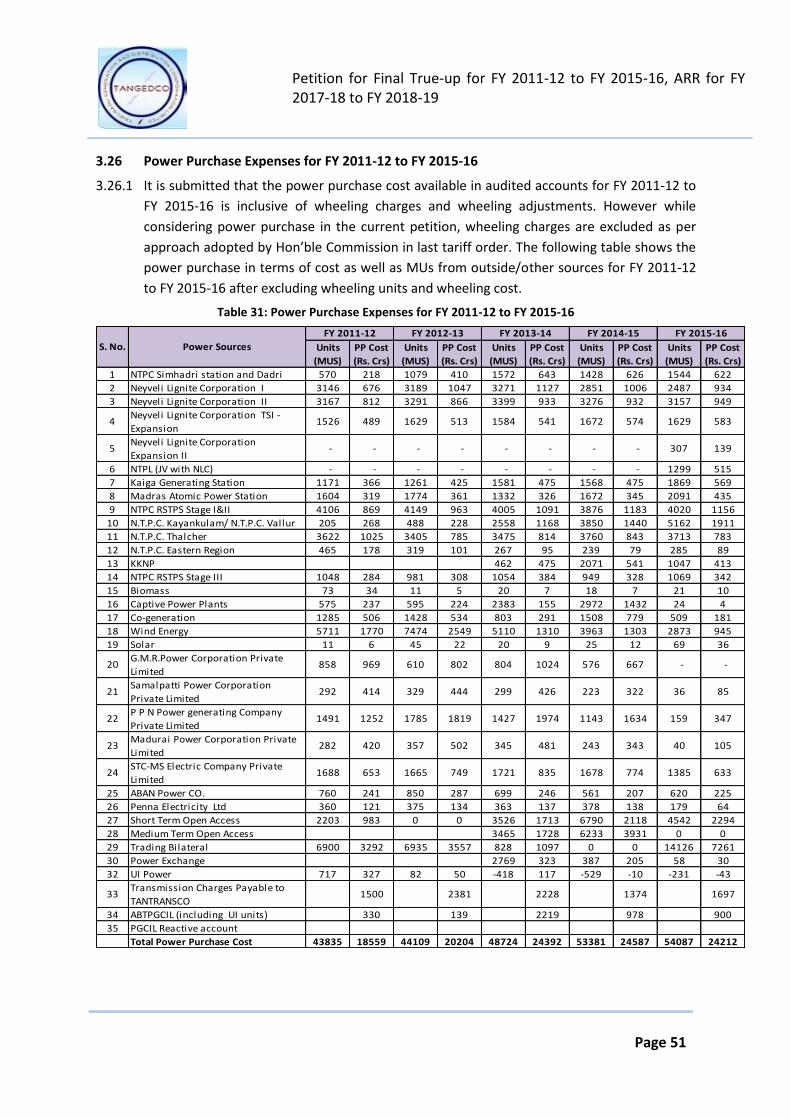
Petition for Final True-up for FY 2011-12 to FY 2015-16, ARR for FY 2017-18 to FY 2018-19
Page 51
3.26 Power Purchase Expenses for FY 2011-12 to FY 2015-16
3.26.1 It is submitted that the power purchase cost available in audited accounts for FY 2011-12 to
FY 2015-16 is inclusive of wheeling charges and wheeling adjustments. However while
considering power purchase in the current petition, wheeling charges are excluded as per
approach adopted by Hon’ble Commission in last tariff order. The following table shows the
power purchase in terms of cost as well as MUs from outside/other sources for FY 2011-12
to FY 2015-16 after excluding wheeling units and wheeling cost.
Table 31: Power Purchase Expenses for FY 2011-12 to FY 2015-16
Units
(MUS)
PP Cost
(Rs. Crs)
Units
(MUS)
PP Cost
(Rs. Crs)
Units
(MUS)
PP Cost
(Rs. Crs)
Units
(MUS)
PP Cost
(Rs. Crs)
Units
(MUS)
PP Cost
(Rs. Crs)
1 NTPC Simhadri station and Dadri 570 218 1079 410 1572 643 1428 626 1544 622
2 Neyveli Lignite Corporation I 3146 676 3189 1047 3271 1127 2851 1006 2487 934
3 Neyveli Lignite Corporation II 3167 812 3291 866 3399 933 3276 932 3157 949
4Neyveli Lignite Corporation TSI -
Expansion1526 489 1629 513 1584 541 1672 574 1629 583
5Neyveli Lignite Corporation
Expansion II- - - - - - - - 307 139
6 NTPL (JV with NLC) - - - - - - - - 1299 515
7 Kaiga Generating Station 1171 366 1261 425 1581 475 1568 475 1869 569
8 Madras Atomic Power Station 1604 319 1774 361 1332 326 1672 345 2091 435
9 NTPC RSTPS Stage I&II 4106 869 4149 963 4005 1091 3876 1183 4020 1156
10 N.T.P.C. Kayankulam/ N.T.P.C. Vallur 205 268 488 228 2558 1168 3850 1440 5162 1911
11 N.T.P.C. Thalcher 3622 1025 3405 785 3475 814 3760 843 3713 783
12 N.T.P.C. Eastern Region 465 178 319 101 267 95 239 79 285 89
13 KKNP 462 475 2071 541 1047 413
14 NTPC RSTPS Stage III 1048 284 981 308 1054 384 949 328 1069 342
15 Biomass 73 34 11 5 20 7 18 7 21 10
16 Captive Power Plants 575 237 595 224 2383 155 2972 1432 24 4
17 Co-generation 1285 506 1428 534 803 291 1508 779 509 181
18 Wind Energy 5711 1770 7474 2549 5110 1310 3963 1303 2873 945
19 Solar 11 6 45 22 20 9 25 12 69 36
20G.M.R.Power Corporation Private
Limited858 969 610 802 804 1024 576 667 - -
21Samalpatti Power Corporation
Private Limited292 414 329 444 299 426 223 322 36 85
22P P N Power generating Company
Private Limited1491 1252 1785 1819 1427 1974 1143 1634 159 347
23Madurai Power Corporation Private
Limited282 420 357 502 345 481 243 343 40 105
24STC-MS Electric Company Private
Limited1688 653 1665 749 1721 835 1678 774 1385 633
25 ABAN Power CO. 760 241 850 287 699 246 561 207 620 225
26 Penna Electricity Ltd 360 121 375 134 363 137 378 138 179 64
27 Short Term Open Access 2203 983 0 0 3526 1713 6790 2118 4542 2294
28 Medium Term Open Access 3465 1728 6233 3931 0 0
29 Trading Bilateral 6900 3292 6935 3557 828 1097 0 0 14126 7261
30 Power Exchange 2769 323 387 205 58 30
32 UI Power 717 327 82 50 -418 117 -529 -10 -231 -43
33Transmission Charges Payable to
TANTRANSCO1500 2381 2228 1374 1697
34 ABTPGCIL (including UI units) 330 139 2219 978 900
35 PGCIL Reactive account
Total Power Purchase Cost 43835 18559 44109 20204 48724 24392 53381 24587 54087 24212
FY 2015-16
S. No. Power Sources
FY 2011-12 FY 2012-13 FY 2013-14 FY 2014-15
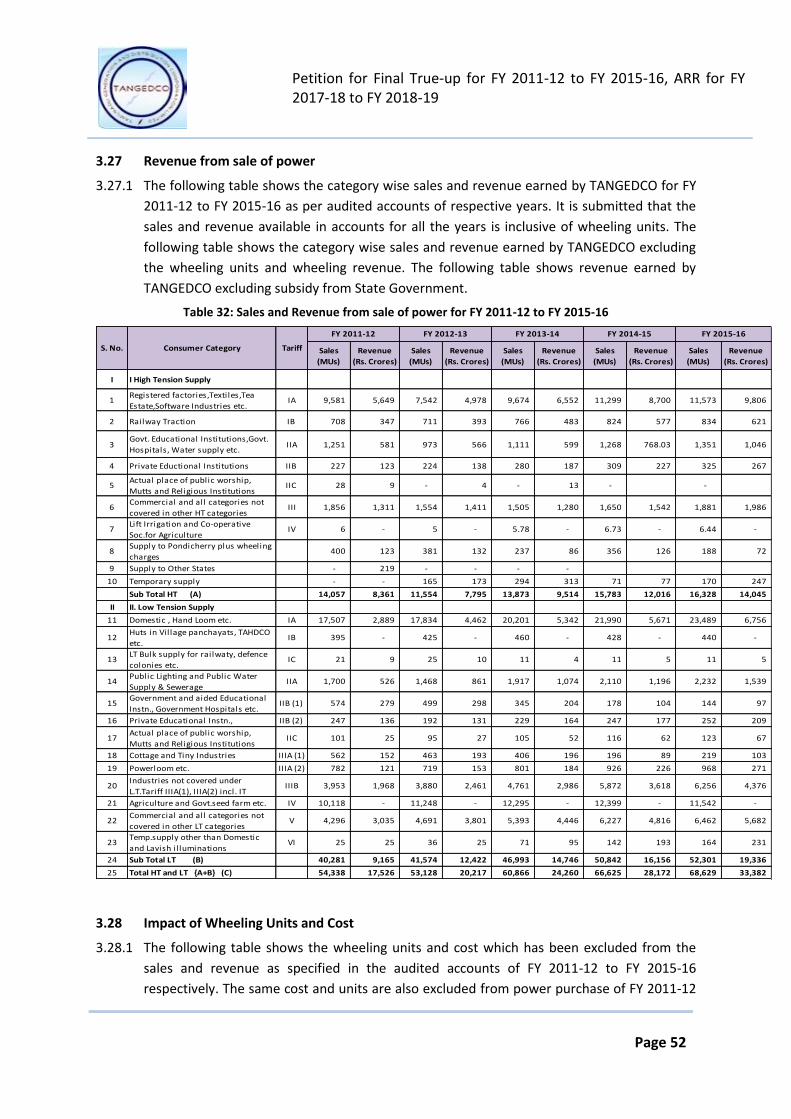
Petition for Final True-up for FY 2011-12 to FY 2015-16, ARR for FY 2017-18 to FY 2018-19
Page 52
3.27 Revenue from sale of power
3.27.1 The following table shows the category wise sales and revenue earned by TANGEDCO for FY
2011-12 to FY 2015-16 as per audited accounts of respective years. It is submitted that the
sales and revenue available in accounts for all the years is inclusive of wheeling units. The
following table shows the category wise sales and revenue earned by TANGEDCO excluding
the wheeling units and wheeling revenue. The following table shows revenue earned by
TANGEDCO excluding subsidy from State Government.
Table 32: Sales and Revenue from sale of power for FY 2011-12 to FY 2015-16
Sales
(MUs)
Revenue
(Rs. Crores)
Sales
(MUs)
Revenue
(Rs. Crores)
Sales
(MUs)
Revenue
(Rs. Crores)
Sales
(MUs)
Revenue
(Rs. Crores)
Sales
(MUs)
Revenue
(Rs. Crores)
I I High Tension Supply
1Registered factories,Textiles,Tea
Estate,Software Industries etc.IA 9,581 5,649 7,542 4,978 9,674 6,552 11,299 8,700 11,573 9,806
2 Railway Traction IB 708 347 711 393 766 483 824 577 834 621
3Govt. Educational Institutions,Govt.
Hospitals, Water supply etc.IIA 1,251 581 973 566 1,111 599 1,268 768.03 1,351 1,046
4 Private Eductional Institutions IIB 227 123 224 138 280 187 309 227 325 267
5Actual place of public worship,
Mutts and Religious InstitutionsIIC 28 9 - 4 - 13 - -
6Commercial and all categories not
covered in other HT categoriesIII 1,856 1,311 1,554 1,411 1,505 1,280 1,650 1,542 1,881 1,986
7Lift Irrigation and Co-operative
Soc.for AgricultureIV 6 - 5 - 5.78 - 6.73 - 6.44 -
8Supply to Pondicherry plus wheeling
charges400 123 381 132 237 86 356 126 188 72
9 Supply to Other States - 219 - - - -
10 Temporary supply - - 165 173 294 313 71 77 170 247
Sub Total HT (A) 14,057 8,361 11,554 7,795 13,873 9,514 15,783 12,016 16,328 14,045
II II. Low Tension Supply
11 Domestic , Hand Loom etc. IA 17,507 2,889 17,834 4,462 20,201 5,342 21,990 5,671 23,489 6,756
12Huts in Vil lage panchayats, TAHDCO
etc.IB 395 - 425 - 460 - 428 - 440 -
13LT Bulk supply for railwaty, defence
colonies etc. IC 21 9 25 10 11 4 11 5 11 5
14Public Lighting and Public Water
Supply & SewerageIIA 1,700 526 1,468 861 1,917 1,074 2,110 1,196 2,232 1,539
15Government and aided Educational
Instn., Government Hospitals etc.IIB (1) 574 279 499 298 345 204 178 104 144 97
16 Private Educational Instn., IIB (2) 247 136 192 131 229 164 247 177 252 209
17Actual place of public worship,
Mutts and Religious InstitutionsIIC 101 25 95 27 105 52 116 62 123 67
18 Cottage and Tiny Industries IIIA (1) 562 152 463 193 406 196 196 89 219 103
19 Powerloom etc. IIIA (2) 782 121 719 153 801 184 926 226 968 271
20Industries not covered under
L.T.Tariff IIIA(1), IIIA(2) incl. ITIIIB 3,953 1,968 3,880 2,461 4,761 2,986 5,872 3,618 6,256 4,376
21 Agriculture and Govt.seed farm etc. IV 10,118 - 11,248 - 12,295 - 12,399 - 11,542 -
22Commercial and all categories not
covered in other LT categoriesV 4,296 3,035 4,691 3,801 5,393 4,446 6,227 4,816 6,462 5,682
23Temp.supply other than Domestic
and Lavish i l luminationsVI 25 25 36 25 71 95 142 193 164 231
24 Sub Total LT (B) 40,281 9,165 41,574 12,422 46,993 14,746 50,842 16,156 52,301 19,336
25 Total HT and LT {A+B} (C) 54,338 17,526 53,128 20,217 60,866 24,260 66,625 28,172 68,629 33,382
S. No. Consumer Category Tariff
FY 2011-12 FY 2012-13 FY 2013-14 FY 2015-16FY 2014-15
3.28 Impact of Wheeling Units and Cost
3.28.1 The following table shows the wheeling units and cost which has been excluded from the
sales and revenue as specified in the audited accounts of FY 2011-12 to FY 2015-16
respectively. The same cost and units are also excluded from power purchase of FY 2011-12
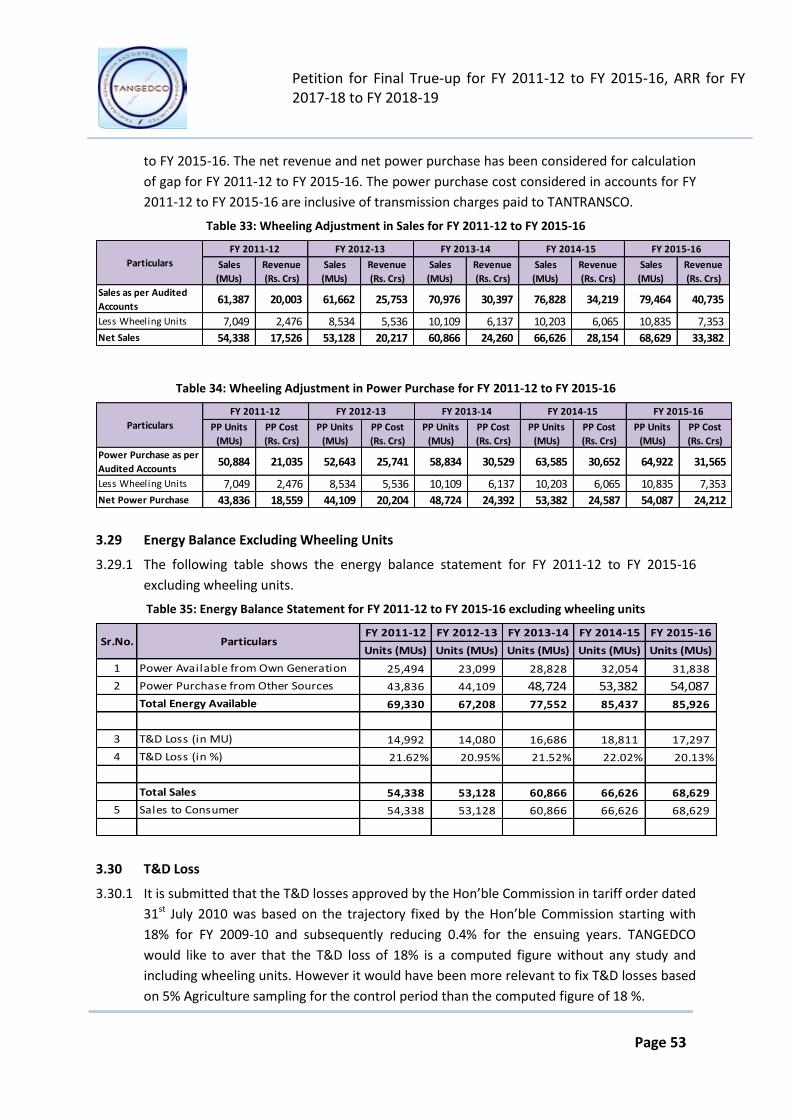
Petition for Final True-up for FY 2011-12 to FY 2015-16, ARR for FY 2017-18 to FY 2018-19
Page 53
to FY 2015-16. The net revenue and net power purchase has been considered for calculation
of gap for FY 2011-12 to FY 2015-16. The power purchase cost considered in accounts for FY
2011-12 to FY 2015-16 are inclusive of transmission charges paid to TANTRANSCO.
Table 33: Wheeling Adjustment in Sales for FY 2011-12 to FY 2015-16
Sales
(MUs)
Revenue
(Rs. Crs)
Sales
(MUs)
Revenue
(Rs. Crs)
Sales
(MUs)
Revenue
(Rs. Crs)
Sales
(MUs)
Revenue
(Rs. Crs)
Sales
(MUs)
Revenue
(Rs. Crs)
Sales as per Audited
Accounts61,387 20,003 61,662 25,753 70,976 30,397 76,828 34,219 79,464 40,735
Less Wheeling Units 7,049 2,476 8,534 5,536 10,109 6,137 10,203 6,065 10,835 7,353
Net Sales 54,338 17,526 53,128 20,217 60,866 24,260 66,626 28,154 68,629 33,382
Particulars
FY 2011-12 FY 2012-13 FY 2013-14 FY 2014-15 FY 2015-16
Table 34: Wheeling Adjustment in Power Purchase for FY 2011-12 to FY 2015-16
PP Units
(MUs)
PP Cost
(Rs. Crs)
PP Units
(MUs)
PP Cost
(Rs. Crs)
PP Units
(MUs)
PP Cost
(Rs. Crs)
PP Units
(MUs)
PP Cost
(Rs. Crs)
PP Units
(MUs)
PP Cost
(Rs. Crs)
Power Purchase as per
Audited Accounts50,884 21,035 52,643 25,741 58,834 30,529 63,585 30,652 64,922 31,565
Less Wheeling Units 7,049 2,476 8,534 5,536 10,109 6,137 10,203 6,065 10,835 7,353
Net Power Purchase 43,836 18,559 44,109 20,204 48,724 24,392 53,382 24,587 54,087 24,212
Particulars
FY 2011-12 FY 2012-13 FY 2013-14 FY 2014-15 FY 2015-16
3.29 Energy Balance Excluding Wheeling Units
3.29.1 The following table shows the energy balance statement for FY 2011-12 to FY 2015-16
excluding wheeling units.
Table 35: Energy Balance Statement for FY 2011-12 to FY 2015-16 excluding wheeling units
FY 2011-12 FY 2012-13 FY 2013-14 FY 2014-15 FY 2015-16
Units (MUs) Units (MUs) Units (MUs) Units (MUs) Units (MUs)
1 Power Available from Own Generation 25,494 23,099 28,828 32,054 31,838
2 Power Purchase from Other Sources 43,836 44,109 48,724 53,382 54,087
Total Energy Available 69,330 67,208 77,552 85,437 85,926
3 T&D Loss (in MU) 14,992 14,080 16,686 18,811 17,297
4 T&D Loss (in %) 21.62% 20.95% 21.52% 22.02% 20.13%
Total Sales 54,338 53,128 60,866 66,626 68,629
5 Sales to Consumer 54,338 53,128 60,866 66,626 68,629
Sr.No. Particulars
3.30 T&D Loss
3.30.1 It is submitted that the T&D losses approved by the Hon’ble Commission in tariff order dated
31st July 2010 was based on the trajectory fixed by the Hon’ble Commission starting with
18% for FY 2009-10 and subsequently reducing 0.4% for the ensuing years. TANGEDCO
would like to aver that the T&D loss of 18% is a computed figure without any study and
including wheeling units. However it would have been more relevant to fix T&D losses based
on 5% Agriculture sampling for the control period than the computed figure of 18 %.

Petition for Final True-up for FY 2011-12 to FY 2015-16, ARR for FY 2017-18 to FY 2018-19
Page 54
3.30.2 TANGEDCO would like to submit that in the Report “Loss Reduction Strategies Review of
Provisions in Act and Policies” issued by Forum of Regulators in September 2008, FOR Group
has specified in para 8.4.1 of page no. 21 of the report that
3.30.3 “The group felt that the trajectory for loss reduction should be determined keeping in view
the actual loss levels, the capital expenditure made in the past for improving the network
infrastructure, and the future capital expenditure plans for the purpose. This was important
keeping in view the Orissa experience, where the loss level allowed in tariff at the beginning
of the reforms process was much below the actual loss level and this completely distorted
the revenue requirement and the utility went into a perennial loss”.
3.30.4 It is submitted that the Hon'ble Commission has maintained the T&D loss, i.e., 16.80%
approved for 2012-13 in the previous Tariff Order. However, the Hon'ble Commission has
grossed up the total sales approved for FY 2012-13 by the T&D loss approved for FY 2012-13
in order to arrive at energy requirement during the year 2012-13 which has resulted into a
lower energy requirement compared to realistic situation.
3.30.5 The additional energy sales approved for the year 2012-13 was 4976 Million units when
compared to 2011-12, whereas the net energy requirement needs to be in line with the
realistic T&D Loss (Page 115 of tariff order No 1 of 2012 dated 30.03.2012). Therefore, T&D
loss for the year 2012-13 should be based on the actual sales approved by the Hon’ble
Commission.
3.30.6 Further, if the loss trajectory as per the Hon'ble Commission is considered, i.e. 22.13%, it
shall result into a reduction of 5.33% loss (22.13% - 16.80%) which is an uphill task and the
same needs to be brought down to a reasonable. TANGEDCO would like to submit that
measurement of the T&D losses and thereafter specifying a reduction target is an important
component of the whole exercise of revenue requirement.
3.30.7 TANGEDCO humbly submit that the T&D loss arrived without any support data and thus
requests the Hon'ble Commission to kindly approve revised T&D loss for FY 2011-12 to FY
2015-16.
3.30.8 It is submitted that computed consumption without sample study was higher than the
computed consumption with sample study. The reduced agriculture consumption is due to
lesser hours of supply under restriction & control measure and good monsoon.
3.30.9 It is submitted that due to lesser computed agriculture consumption for control period 2010-

Petition for Final True-up for FY 2011-12 to FY 2015-16, ARR for FY 2017-18 to FY 2018-19
Page 55
11 to 2011-13, T&D loss is increased more than the trajectory fixed in tariff order dated
31.07.2010 and revised T&D loss trajectory is to be fixed for the control period of 2010-11 to
2012-13 and TANGEDCO need not be penalised by disallowance of additional power
purchase cost to a higher T&D loss than trajectory fixed.
3.30.10 TANGEDCO here by request the Hon’ble Commission to approve the T&D arrived excluding
wheeling as shown in the table above.
3.31 Summarized ARR and Revenue Gap for FY 2011-12 to FY 2015-16
3.31.1 Based on the above discussion on variable and fixed cost component for Generation
function and Fixed Cost related to distribution function following is the table showing ARR
and Revenue Gap summary for FY 2011-12 to FY 2015-16.

Petition for Final True-up for FY 2011-12 to FY 2015-16, ARR for FY 2017-18 to FY 2018-19
Page 56
Table 36: Annual Revenue Requirement of TANGEDCO for FY 2011-12 to FY 2015-16
Actuals Actuals Actuals Actuals Actuals
1 Expenses with respect to Generation (Variable Cost) 6,043.73 6,329.57 6,813.97 9,635.39 8,642.03
2 Expenses with respect to Generation (Fixed Cost) 3,269.54 3,928.93 5,955.97 6,595.52 7,669.92
3 Power Purchase Cost from Other Sources 17,058.63 17,823.20 22,163.96 23,212.93 22,515.38
4 Transmission Charges paid to TANTRANSCO 1,500.00 2,381.18 2,228.01 1,373.63 1,696.89
5 Net Operation & Maintenance Expenses 3,626.33 3,523.79 3,970.93 4,565.07 4,844.82
6 Depreciation 265.10 294.39 327.15 525.28 670.46
7 Interest & Finance Charges 1,239.38 2,136.60 3,351.30 3,995.12 4,383.58
8 Interest on Working Capital - - - 189.53 178.74
9 Extra Ordinary Items 2.22 0.13 0.08
10 Other Debits 36.52 10.14 21.70 25.98 13.19
11 Net Prior Period Expenses/(Income) 583.84 1,695.93 (284.26) (89.24) (1,526.91)
12 Less Cap of Cost of Generation during Trial Stage (1,042.80) (17.76)
Sub Total 33,625 38,124 43,506 50,011.46 49,088.12
13 Return on Equity 260.62 471.02 600.44 582.32 582.32
14 Provision for Tax / Tax Paid - - -
Total Expenditure 33,885.91 38,594.89 44,106.46 50,593.79 49,670.44
15 Less: Non Tariff Income 553.00 935.80 822.16 852.97 780.86
16 Less: Other Income 144.13 196.41 229.61 302.23 322.02
Aggregate Revenue Requirement 33,188.78 37,462.68 43,054.69 49,438.59 48,567.56
17 Revenue from sale of power 17,526.70 20,216.56 24,260.14 28,171.86 33,381.68
18 Other income Consumer related - -
Total Revenue before Subsidy 17,526.70 20,216.56 24,260.14 28,171.86 33,381.68
19 Subsidy 2,071.41 4,457.23 4,985.09 5,953.00 6,695.10
Total Revenue after Subsidy 19,598.11 24,673.79 29,245.23 34,124.86 40,076.78
20 Other Govt. Subsidy (FRP bond takeover) 1,000.00 1,000.00
21 Gap/(Surplus) 13,590.67 12,788.89 13,809.46 14,313.73 7,490.78
Sr. No. ParticularsFY 2011-12 FY 2012-13 FY 2013-14 FY 2014-15 FY 2015-16
3.31.2 It is therefore requested to the Hon’ble Commission to approve the additional revenue gap
arrived after truing up of FY 2011-12 to FY 2015-16.

Petition for Final True-up for FY 2011-12 to FY 2015-16, ARR for FY 2017-18 to FY 2018-19
Page 57
4. ANNUAL AGGREGATE REVENUE REQUIREMENT FOR FY 2016-17 TO FY 2018-19
4.1 Preamble
4.1.1 This section deals with the determination of ARR for FY 2016-17 to FY 2018-19. The basis of
projection of ARR for FY 2016-17 to FY 2018-19 is also discussed in detail in this chapter.
4.2 Operational Performance
4.2.1 The operational parameters like Plant Availability Factor (PAF), Plant Load Factor (PLF)
Station Heat Rate (SHR), Auxiliary Consumption (AC), Specific Oil Consumption etc, for the
generating plants during the year FY 2016-17 to FY 2018-19 are outlined in this section.
4.2.2 The actual operating parameters derived during the year are dependent on present
condition of the machine. The present operating conditions of the machine is a function of
following factors:
Operation and Maintenance carried out in the plant since commissioning
Degradation due to ageing
Water Chemistry
Conditions of the Auxiliaries
Overloading and Partial Loading of machines
Number of Start/Stop
Temperatures and Pressures Stress-Machines have been subjected to
Automation of C&I
Condenser Vacuum
4.3 Plant Load Factor
4.3.1 The table below showcases the PLF for FY 2016-17 to FY 2018-19 based on the actual loading
of TANGEDCO plants for the year FY 2015-16.
Table 37: Plant Load Factor - FY 2016-17 to 2018-19
FY 2016-17 FY 2017-18 FY 2018-19
Projected Projected Projected
1 Ennore TPS 31.08% - -
2 Tuticorin TPS 80.00% 80.00% 81.60%
3 Mettur TPS 80.00% 80.00% 81.60%
4 North Chennai TPS 80.00% 87.44% 89.17%
5 NCTPS Stage II 80.00% 80.00% 81.60%
6 MTPS Stage III 80.00% 80.00% 81.60%
7 Ennore Expansion II - - 32.80%
8 Tirumakottai GTPS 80.00% 85.20% 87.00%
9 Kuttalam GTPS 80.00% 85.80% 87.50%
10 Basin Bridge GTPS 0.60% 0.60% 0.60%
11 Valathur GTPS 80.00% 83.56% 85.30%
S.No Power Station

Petition for Final True-up for FY 2011-12 to FY 2015-16, ARR for FY 2017-18 to FY 2018-19
Page 58
4.4 Auxiliary Consumption
4.4.1 The auxiliary consumption for TANGEDCO plants for FY 2016-17 to 2018-19 are projected on
the basis of FY 2015-16 actual data. The table is attached below and figures are in terms of
percentage.
Table 38: Auxiliary Consumption - FY 2016-17 to FY2018-19
FY 2016-17 FY 2017-18 FY 2018-19
Projected Projected Projected
1 Ennore TPS 15.00% - -
2 Tuticorin TPS 8.50% 8.50% 8.50%
3 Mettur TPS 8.50% 8.50% 8.50%
4 North Chennai TPS 8.50% 8.50% 8.50%
5 NCTPS Stage II 8.50% 8.83% 8.83%
6 MTPS Stage III 8.83% 8.83% 8.83%
7 Ennore Expansion II - - 8.50%
8 Tirumakottai GTPS 6.00% 6.00% 6.00%
9 Kuttalam GTPS 6.00% 6.00% 6.00%
10 Basin Bridge GTPS 0.99% 0.99% 0.99%
11 Valathur GTPS 6.00% 6.00% 6.00%
S.No Power Station
4.5 Station Heat Rate (SHR)
4.5.1 The table below shows the Projected station heat rate for thermal (coal and gas) power
plants for TANGEDCO for the year FY 2016-17 to FY 2018-19 on the basis of actual data of FY
2015-16:
Table 39: Station Heat Rates of Thermal Power Plants – FY 2016-17 to FY 2018-19 (k Cal/kWh)
FY 2016-17 FY 2017-18 FY 2018-19
Projected Projected Projected
1 Ennore TPS 3200 - -
2 Tuticorin TPS 2450 2453 2453
3 Mettur TPS 2450 2500 2500
4 North Chennai TPS 2393 2393 2393
5 NCTPS Stage II 1984 2450 2450
6 MTPS Stage III 2450 2450 2450
7 Ennore Expansion II - - 2450
8 Tirumakottai GTPS 1850 1850 1850
9 Kuttalam GTPS 1850 1850 1850
10 Basin Bridge GTPS 3219 3219 3219
11 Valathur GTPS 1850 1850 1850
S.No Power Station
4.5.2 ETPS: At ETPS, due to prolonged service of the Units of lower capacity and partial load
operations, the performance gets reduced resulting in increased Heat rate.
4.6 Specific Oil Consumption
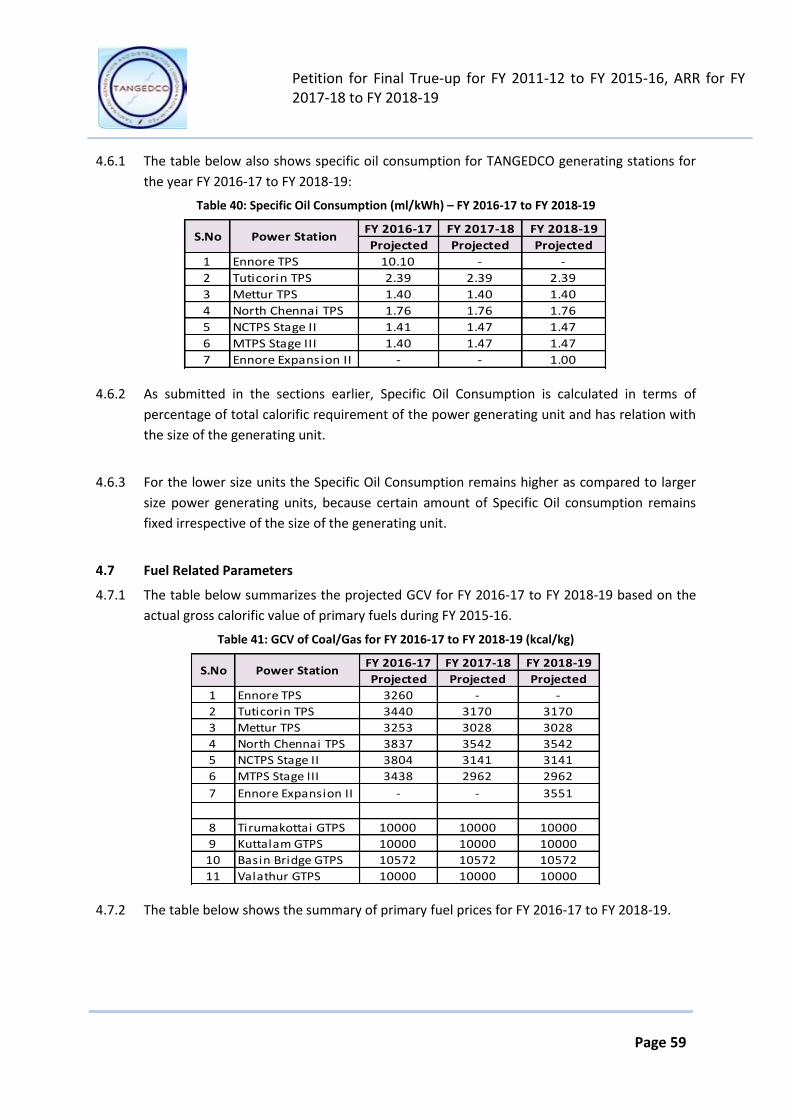
Petition for Final True-up for FY 2011-12 to FY 2015-16, ARR for FY 2017-18 to FY 2018-19
Page 59
4.6.1 The table below also shows specific oil consumption for TANGEDCO generating stations for
the year FY 2016-17 to FY 2018-19:
Table 40: Specific Oil Consumption (ml/kWh) – FY 2016-17 to FY 2018-19
FY 2016-17 FY 2017-18 FY 2018-19
Projected Projected Projected
1 Ennore TPS 10.10 - -
2 Tuticorin TPS 2.39 2.39 2.39
3 Mettur TPS 1.40 1.40 1.40
4 North Chennai TPS 1.76 1.76 1.76
5 NCTPS Stage II 1.41 1.47 1.47
6 MTPS Stage III 1.40 1.47 1.47
7 Ennore Expansion II - - 1.00
S.No Power Station
4.6.2 As submitted in the sections earlier, Specific Oil Consumption is calculated in terms of
percentage of total calorific requirement of the power generating unit and has relation with
the size of the generating unit.
4.6.3 For the lower size units the Specific Oil Consumption remains higher as compared to larger
size power generating units, because certain amount of Specific Oil consumption remains
fixed irrespective of the size of the generating unit.
4.7 Fuel Related Parameters
4.7.1 The table below summarizes the projected GCV for FY 2016-17 to FY 2018-19 based on the
actual gross calorific value of primary fuels during FY 2015-16.
Table 41: GCV of Coal/Gas for FY 2016-17 to FY 2018-19 (kcal/kg)
FY 2016-17 FY 2017-18 FY 2018-19
Projected Projected Projected
1 Ennore TPS 3260 - -
2 Tuticorin TPS 3440 3170 3170
3 Mettur TPS 3253 3028 3028
4 North Chennai TPS 3837 3542 3542
5 NCTPS Stage II 3804 3141 3141
6 MTPS Stage III 3438 2962 2962
7 Ennore Expansion II - - 3551
8 Tirumakottai GTPS 10000 10000 10000
9 Kuttalam GTPS 10000 10000 10000
10 Basin Bridge GTPS 10572 10572 10572
11 Valathur GTPS 10000 10000 10000
Power StationS.No
4.7.2 The table below shows the summary of primary fuel prices for FY 2016-17 to FY 2018-19.

Petition for Final True-up for FY 2011-12 to FY 2015-16, ARR for FY 2017-18 to FY 2018-19
Page 60
Table 42: Price of Coal/Gas for FY 2016-17 to FY 2018-19 (Rs. /MT) (Rs. /SCM)
FY 2016-17 FY 2017-18 FY 2018-19
Projected Projected Projected
1 Ennore TPS 3205 - -
2 Tuticorin TPS 4265 3771 3884
3 Mettur TPS 4610 3756 3869
4 North Chennai TPS 3837 3542 3542
5 NCTPS Stage II 3420 3046 3147
6 MTPS Stage III 4610 3756 3869
7 Ennore Expansion II - - 3470
8 Tirumakottai GTPS 11.72 12.07 12.43
9 Kuttalam GTPS 11.89 12.25 12.61
10 Basin Bridge GTPS 7.11 7.32 7.54
11 Valathur GTPS 11.21 11.55 11.89
S.No Power Station
4.7.3 It is requested to the Hon’ble Commission to kindly approve the price of fuel as projected by
TANGEDCO for FY 2016-17 to FY 2018-19
4.8 Performance trajectories to determine variable cost of the own generation plant
4.8.1 The performance trajectories such as PAF, PLF, SHR, Auxiliary consumption are based on the
current condition of the existing plant, the age of the plant, current issues pertaining to the
coal quality and quantity of coal received, usage of imported coal, etc. TANGEDCO would like
to submit that so far as the performance of Hydro plant is concerned, they are dependent on
the quantum of rainfall received in the catchment areas as well as the actual water release
from the connected dam.
4.8.2 The variable cost of the power plant has been calculated based on the operational
parameter as outlined in the following table and has applied an escalation factor on the base
price to project the future fuel cost for the FY 2016-17 to FY 2018-19
4.8.3 The performance parameters of the existing plant of TANGEDCO have been highlighted
below for the FY 2016-17 to FY 2018-19:
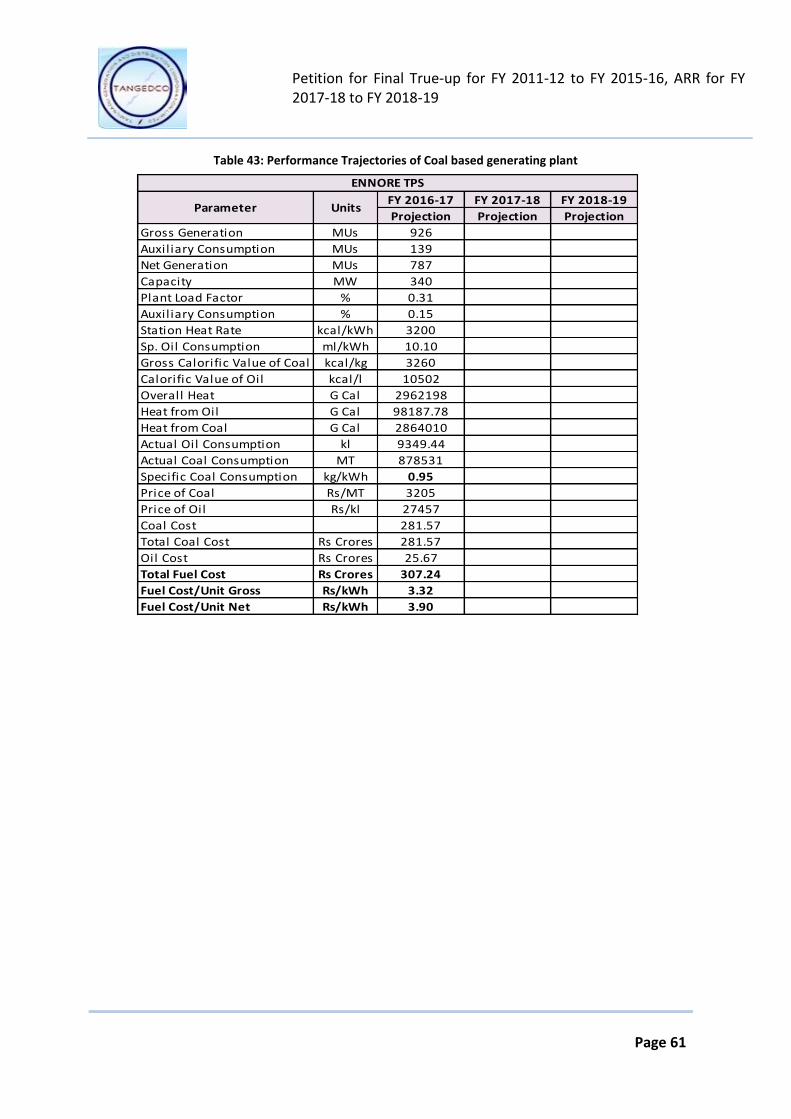
Petition for Final True-up for FY 2011-12 to FY 2015-16, ARR for FY 2017-18 to FY 2018-19
Page 61
Table 43: Performance Trajectories of Coal based generating plant
FY 2016-17 FY 2017-18 FY 2018-19
Projection Projection Projection
Gross Generation MUs 926
Auxiliary Consumption MUs 139
Net Generation MUs 787
Capacity MW 340
Plant Load Factor % 0.31
Auxiliary Consumption % 0.15
Station Heat Rate kcal/kWh 3200
Sp. Oil Consumption ml/kWh 10.10
Gross Calorific Value of Coal kcal/kg 3260
Calorific Value of Oil kcal/l 10502
Overall Heat G Cal 2962198
Heat from Oil G Cal 98187.78
Heat from Coal G Cal 2864010
Actual Oil Consumption kl 9349.44
Actual Coal Consumption MT 878531
Specific Coal Consumption kg/kWh 0.95
Price of Coal Rs/MT 3205
Price of Oil Rs/kl 27457
Coal Cost 281.57
Total Coal Cost Rs Crores 281.57
Oil Cost Rs Crores 25.67
Total Fuel Cost Rs Crores 307.24
Fuel Cost/Unit Gross Rs/kWh 3.32
Fuel Cost/Unit Net Rs/kWh 3.90
ENNORE TPS
Parameter Units

Petition for Final True-up for FY 2011-12 to FY 2015-16, ARR for FY 2017-18 to FY 2018-19
Page 62
FY 2016-17 FY 2017-18 FY 2018-19
Projected Projected Projected
Gross Generation MUs 7358 7358 7506
Auxiliary Consumption MUs 625 625 638
Net Generation MUs 6733 6733 6868
Capacity MW 1050 1050 1050
Plant Load Factor % 0.80 0.80 0.82
Auxiliary Consumption % 0.09 0.09 0.09
Station Heat Rate kcal/kWh 2450 2453 2453
Sp. Oil Consumption ml/kWh 2.39 2.39 2.39
Gross Calorific Value of Coal kcal/kg 3440 3170 3170
Calorific Value of Oil kcal/l 10639 10639 10639
Overall Heat G Cal 18028080 18050155 18411158
Heat from Oil G Cal 187104 187104 190846
Heat from Coal G Cal 17840976 17863052 18220313
Actual Oil Consumption kl 17587 17587 17938
Actual Coal Consumption MT 5185615 5635032 5747733
Specific Coal Consumption kg/kWh 0.70 0.77 0.77
Price of Coal Rs/MT 4265 3771 3884
Price of Oil Rs/kl 41231 42468 43742
Coal Cost 2212 2125 2232
Total Coal Cost Rs Crores 2212 2125 2232
Oil Cost Rs Crores 73 75 78
Total Fuel Cost Rs Crores 2284.18 2199.38 2310.66
Fuel Cost/Unit Gross Rs/kWh 3.10 2.99 3.08
Fuel Cost/Unit Net Rs/kWh 3.39 3.27 3.36
Tuticorin TPS
Parameter Units
FY 2016-17 FY 2017-18 FY 2018-19
Projected Projected Projected
Gross Generation MUs 5886.72 5886.72 6004.45
Auxiliary Consumption MUs 500.37 500.37 510.38
Net Generation MUs 5386.35 5386.35 5494.08
Capacity MW 840.00 840.00 840.00
Plant Load Factor % 0.80 0.80 0.82
Auxiliary Consumption % 0.09 0.09 0.09
Station Heat Rate kcal/kWh 2450.00 2500.00 2500.00
Sp. Oil Consumption ml/kWh 1.40 1.40 1.40
Gross Calorific Value of Coal kcal/kg 3253.15 3028.00 3028.00
Calorific Value of Oil kcal/l 9797.17 9797.17 9797.17
Overall Heat G Cal 14422464 14716800 15011136
Heat from Oil G Cal 80742.45 80742.45 82357.30
Heat from Coal G Cal 14341722 14636058 14928779
Actual Oil Consumption kl 8241.41 8241.41 8406.24
Actual Coal Consumption MT 4408564 4833573 4930244
Specific Coal Consumption kg/kWh 0.75 0.82 0.82
Price of Coal Rs/MT 4610.43 3756.00 3868.68
Price of Oil Rs/kl 40668.33 41888.38 43145.03
Coal Cost 2032.54 1815.49 1907.35
Total Coal Cost Rs Crores 2032.54 1815.49 1907.35
Oil Cost Rs Crores 33.52 34.52 36.27
Total Fuel Cost Rs Crores 2066.05 1850.01 1943.62
Fuel Cost/Unit Gross Rs/kWh 3.51 3.14 3.24
Fuel Cost/Unit Net Rs/kWh 3.84 3.43 3.54
Mettur TPS
Parameter Units
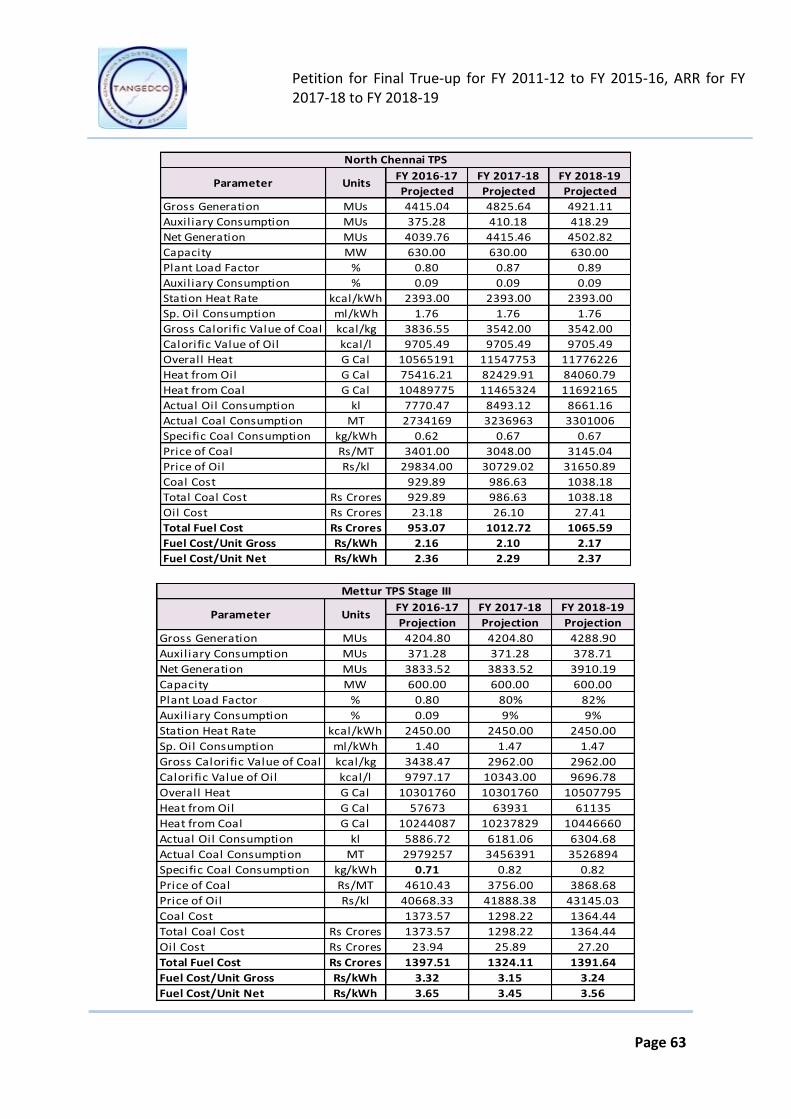
Petition for Final True-up for FY 2011-12 to FY 2015-16, ARR for FY 2017-18 to FY 2018-19
Page 63
FY 2016-17 FY 2017-18 FY 2018-19
Projected Projected Projected
Gross Generation MUs 4415.04 4825.64 4921.11
Auxiliary Consumption MUs 375.28 410.18 418.29
Net Generation MUs 4039.76 4415.46 4502.82
Capacity MW 630.00 630.00 630.00
Plant Load Factor % 0.80 0.87 0.89
Auxiliary Consumption % 0.09 0.09 0.09
Station Heat Rate kcal/kWh 2393.00 2393.00 2393.00
Sp. Oil Consumption ml/kWh 1.76 1.76 1.76
Gross Calorific Value of Coal kcal/kg 3836.55 3542.00 3542.00
Calorific Value of Oil kcal/l 9705.49 9705.49 9705.49
Overall Heat G Cal 10565191 11547753 11776226
Heat from Oil G Cal 75416.21 82429.91 84060.79
Heat from Coal G Cal 10489775 11465324 11692165
Actual Oil Consumption kl 7770.47 8493.12 8661.16
Actual Coal Consumption MT 2734169 3236963 3301006
Specific Coal Consumption kg/kWh 0.62 0.67 0.67
Price of Coal Rs/MT 3401.00 3048.00 3145.04
Price of Oil Rs/kl 29834.00 30729.02 31650.89
Coal Cost 929.89 986.63 1038.18
Total Coal Cost Rs Crores 929.89 986.63 1038.18
Oil Cost Rs Crores 23.18 26.10 27.41
Total Fuel Cost Rs Crores 953.07 1012.72 1065.59
Fuel Cost/Unit Gross Rs/kWh 2.16 2.10 2.17
Fuel Cost/Unit Net Rs/kWh 2.36 2.29 2.37
North Chennai TPS
Parameter Units
FY 2016-17 FY 2017-18 FY 2018-19
Projection Projection Projection
Gross Generation MUs 4204.80 4204.80 4288.90
Auxiliary Consumption MUs 371.28 371.28 378.71
Net Generation MUs 3833.52 3833.52 3910.19
Capacity MW 600.00 600.00 600.00
Plant Load Factor % 0.80 80% 82%
Auxiliary Consumption % 0.09 9% 9%
Station Heat Rate kcal/kWh 2450.00 2450.00 2450.00
Sp. Oil Consumption ml/kWh 1.40 1.47 1.47
Gross Calorific Value of Coal kcal/kg 3438.47 2962.00 2962.00
Calorific Value of Oil kcal/l 9797.17 10343.00 9696.78
Overall Heat G Cal 10301760 10301760 10507795
Heat from Oil G Cal 57673 63931 61135
Heat from Coal G Cal 10244087 10237829 10446660
Actual Oil Consumption kl 5886.72 6181.06 6304.68
Actual Coal Consumption MT 2979257 3456391 3526894
Specific Coal Consumption kg/kWh 0.71 0.82 0.82
Price of Coal Rs/MT 4610.43 3756.00 3868.68
Price of Oil Rs/kl 40668.33 41888.38 43145.03
Coal Cost 1373.57 1298.22 1364.44
Total Coal Cost Rs Crores 1373.57 1298.22 1364.44
Oil Cost Rs Crores 23.94 25.89 27.20
Total Fuel Cost Rs Crores 1397.51 1324.11 1391.64
Fuel Cost/Unit Gross Rs/kWh 3.32 3.15 3.24
Fuel Cost/Unit Net Rs/kWh 3.65 3.45 3.56
Mettur TPS Stage III
Parameter Units
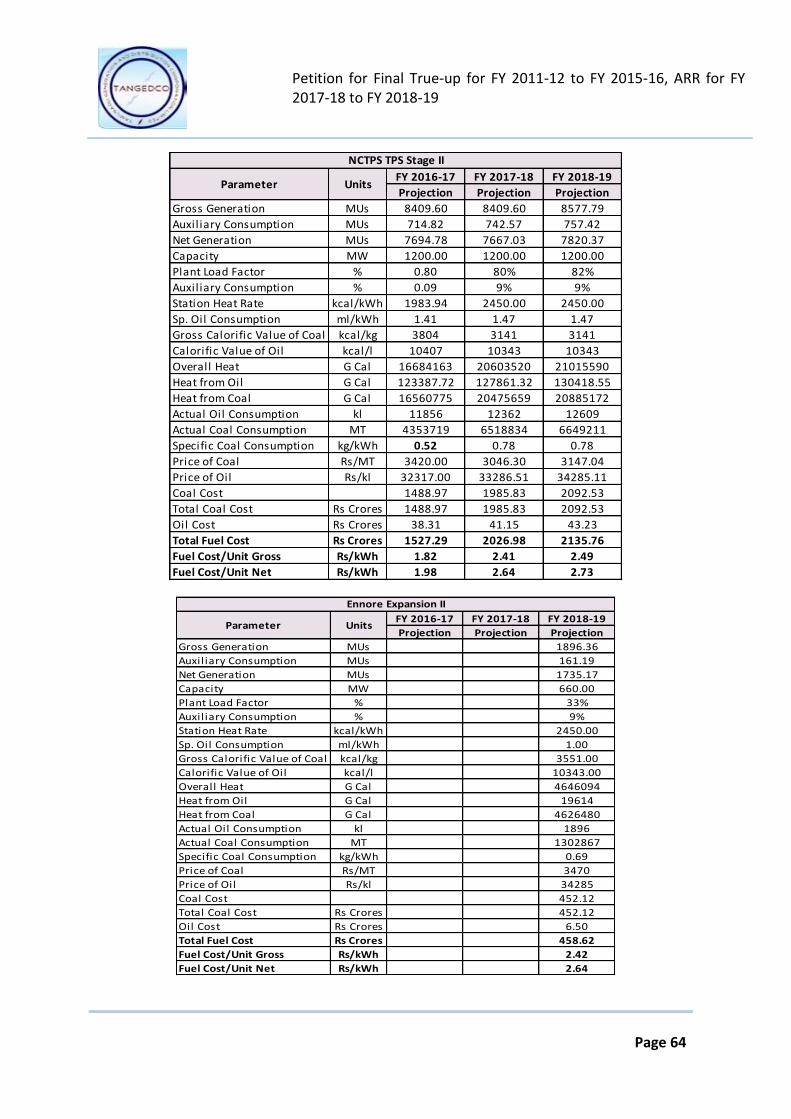
Petition for Final True-up for FY 2011-12 to FY 2015-16, ARR for FY 2017-18 to FY 2018-19
Page 64
FY 2016-17 FY 2017-18 FY 2018-19
Projection Projection Projection
Gross Generation MUs 8409.60 8409.60 8577.79
Auxiliary Consumption MUs 714.82 742.57 757.42
Net Generation MUs 7694.78 7667.03 7820.37
Capacity MW 1200.00 1200.00 1200.00
Plant Load Factor % 0.80 80% 82%
Auxiliary Consumption % 0.09 9% 9%
Station Heat Rate kcal/kWh 1983.94 2450.00 2450.00
Sp. Oil Consumption ml/kWh 1.41 1.47 1.47
Gross Calorific Value of Coal kcal/kg 3804 3141 3141
Calorific Value of Oil kcal/l 10407 10343 10343
Overall Heat G Cal 16684163 20603520 21015590
Heat from Oil G Cal 123387.72 127861.32 130418.55
Heat from Coal G Cal 16560775 20475659 20885172
Actual Oil Consumption kl 11856 12362 12609
Actual Coal Consumption MT 4353719 6518834 6649211
Specific Coal Consumption kg/kWh 0.52 0.78 0.78
Price of Coal Rs/MT 3420.00 3046.30 3147.04
Price of Oil Rs/kl 32317.00 33286.51 34285.11
Coal Cost 1488.97 1985.83 2092.53
Total Coal Cost Rs Crores 1488.97 1985.83 2092.53
Oil Cost Rs Crores 38.31 41.15 43.23
Total Fuel Cost Rs Crores 1527.29 2026.98 2135.76
Fuel Cost/Unit Gross Rs/kWh 1.82 2.41 2.49
Fuel Cost/Unit Net Rs/kWh 1.98 2.64 2.73
NCTPS TPS Stage II
Parameter Units
FY 2016-17 FY 2017-18 FY 2018-19
Projection Projection Projection
Gross Generation MUs 1896.36
Auxiliary Consumption MUs 161.19
Net Generation MUs 1735.17
Capacity MW 660.00
Plant Load Factor % 33%
Auxiliary Consumption % 9%
Station Heat Rate kcal/kWh 2450.00
Sp. Oil Consumption ml/kWh 1.00
Gross Calorific Value of Coal kcal/kg 3551.00
Calorific Value of Oil kcal/l 10343.00
Overall Heat G Cal 4646094
Heat from Oil G Cal 19614
Heat from Coal G Cal 4626480
Actual Oil Consumption kl 1896
Actual Coal Consumption MT 1302867
Specific Coal Consumption kg/kWh 0.69
Price of Coal Rs/MT 3470
Price of Oil Rs/kl 34285
Coal Cost 452.12
Total Coal Cost Rs Crores 452.12
Oil Cost Rs Crores 6.50
Total Fuel Cost Rs Crores 458.62
Fuel Cost/Unit Gross Rs/kWh 2.42
Fuel Cost/Unit Net Rs/kWh 2.64
Ennore Expansion II
Parameter Units
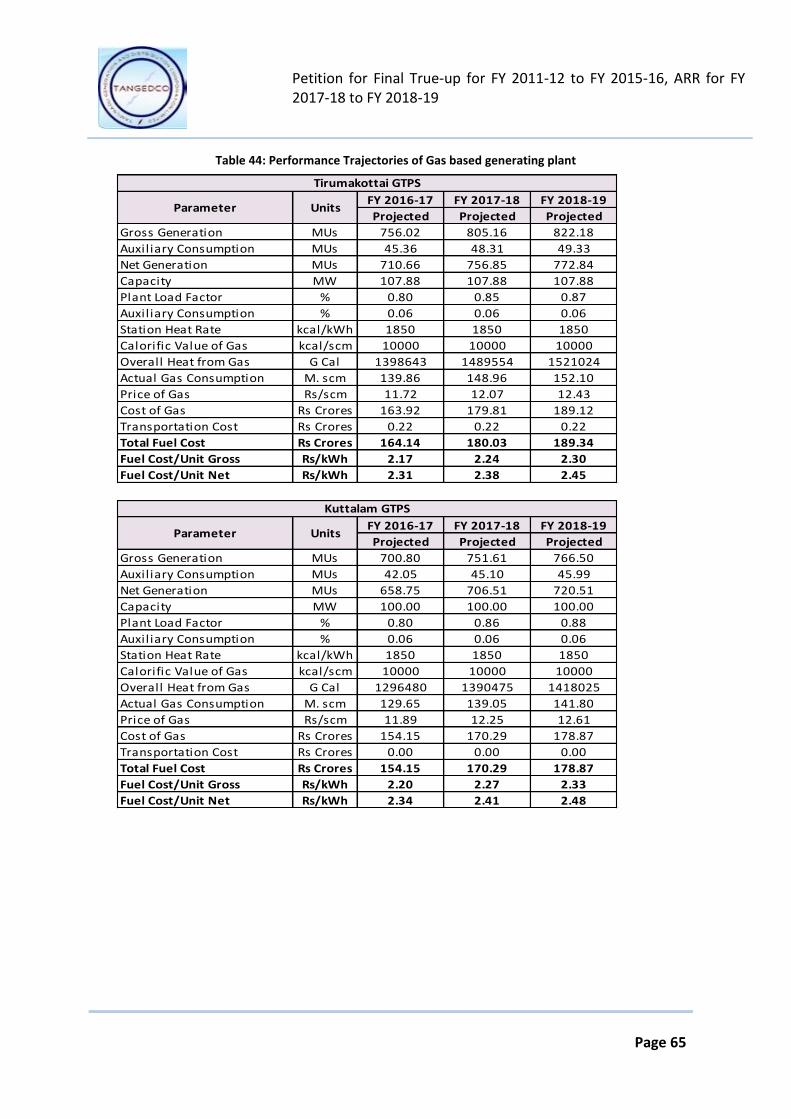
Petition for Final True-up for FY 2011-12 to FY 2015-16, ARR for FY 2017-18 to FY 2018-19
Page 65
Table 44: Performance Trajectories of Gas based generating plant
FY 2016-17 FY 2017-18 FY 2018-19
Projected Projected Projected
Gross Generation MUs 756.02 805.16 822.18
Auxiliary Consumption MUs 45.36 48.31 49.33
Net Generation MUs 710.66 756.85 772.84
Capacity MW 107.88 107.88 107.88
Plant Load Factor % 0.80 0.85 0.87
Auxiliary Consumption % 0.06 0.06 0.06
Station Heat Rate kcal/kWh 1850 1850 1850
Calorific Value of Gas kcal/scm 10000 10000 10000
Overall Heat from Gas G Cal 1398643 1489554 1521024
Actual Gas Consumption M. scm 139.86 148.96 152.10
Price of Gas Rs/scm 11.72 12.07 12.43
Cost of Gas Rs Crores 163.92 179.81 189.12
Transportation Cost Rs Crores 0.22 0.22 0.22
Total Fuel Cost Rs Crores 164.14 180.03 189.34
Fuel Cost/Unit Gross Rs/kWh 2.17 2.24 2.30
Fuel Cost/Unit Net Rs/kWh 2.31 2.38 2.45
Tirumakottai GTPS
Parameter Units
FY 2016-17 FY 2017-18 FY 2018-19
Projected Projected Projected
Gross Generation MUs 700.80 751.61 766.50
Auxiliary Consumption MUs 42.05 45.10 45.99
Net Generation MUs 658.75 706.51 720.51
Capacity MW 100.00 100.00 100.00
Plant Load Factor % 0.80 0.86 0.88
Auxiliary Consumption % 0.06 0.06 0.06
Station Heat Rate kcal/kWh 1850 1850 1850
Calorific Value of Gas kcal/scm 10000 10000 10000
Overall Heat from Gas G Cal 1296480 1390475 1418025
Actual Gas Consumption M. scm 129.65 139.05 141.80
Price of Gas Rs/scm 11.89 12.25 12.61
Cost of Gas Rs Crores 154.15 170.29 178.87
Transportation Cost Rs Crores 0.00 0.00 0.00
Total Fuel Cost Rs Crores 154.15 170.29 178.87
Fuel Cost/Unit Gross Rs/kWh 2.20 2.27 2.33
Fuel Cost/Unit Net Rs/kWh 2.34 2.41 2.48
Kuttalam GTPS
Parameter Units
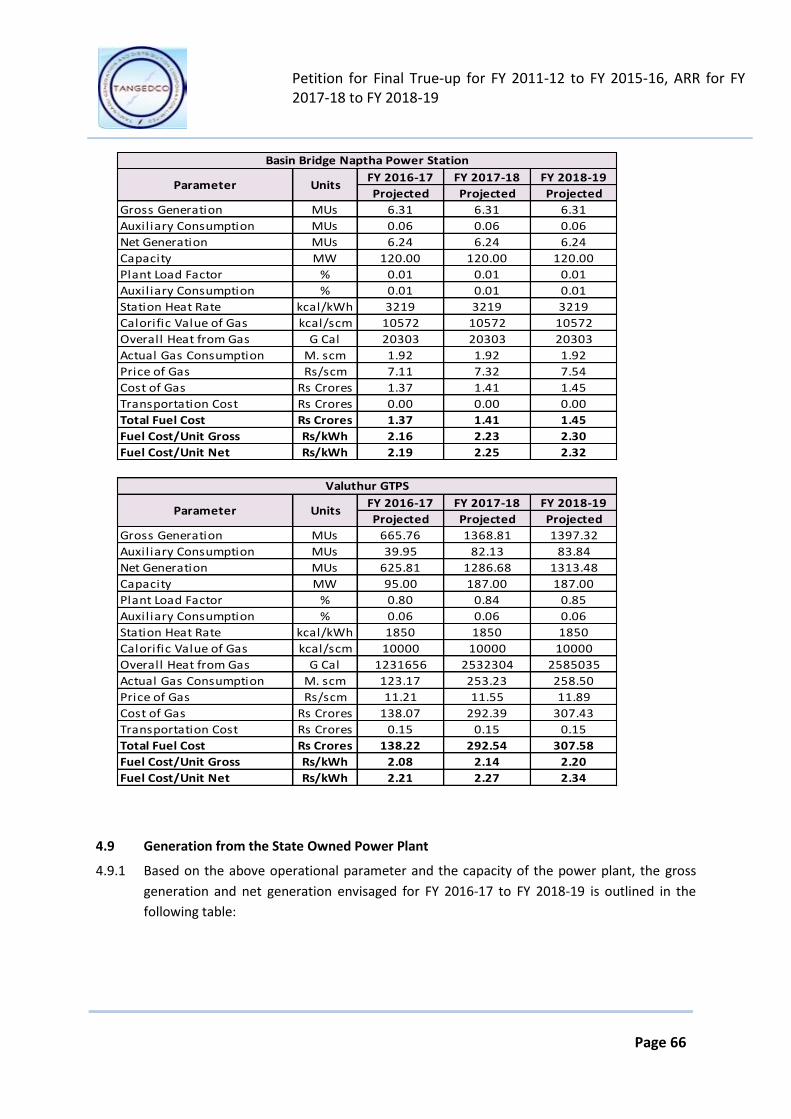
Petition for Final True-up for FY 2011-12 to FY 2015-16, ARR for FY 2017-18 to FY 2018-19
Page 66
FY 2016-17 FY 2017-18 FY 2018-19
Projected Projected Projected
Gross Generation MUs 6.31 6.31 6.31
Auxiliary Consumption MUs 0.06 0.06 0.06
Net Generation MUs 6.24 6.24 6.24
Capacity MW 120.00 120.00 120.00
Plant Load Factor % 0.01 0.01 0.01
Auxiliary Consumption % 0.01 0.01 0.01
Station Heat Rate kcal/kWh 3219 3219 3219
Calorific Value of Gas kcal/scm 10572 10572 10572
Overall Heat from Gas G Cal 20303 20303 20303
Actual Gas Consumption M. scm 1.92 1.92 1.92
Price of Gas Rs/scm 7.11 7.32 7.54
Cost of Gas Rs Crores 1.37 1.41 1.45
Transportation Cost Rs Crores 0.00 0.00 0.00
Total Fuel Cost Rs Crores 1.37 1.41 1.45
Fuel Cost/Unit Gross Rs/kWh 2.16 2.23 2.30
Fuel Cost/Unit Net Rs/kWh 2.19 2.25 2.32
Basin Bridge Naptha Power Station
Parameter Units
FY 2016-17 FY 2017-18 FY 2018-19
Projected Projected Projected
Gross Generation MUs 665.76 1368.81 1397.32
Auxiliary Consumption MUs 39.95 82.13 83.84
Net Generation MUs 625.81 1286.68 1313.48
Capacity MW 95.00 187.00 187.00
Plant Load Factor % 0.80 0.84 0.85
Auxiliary Consumption % 0.06 0.06 0.06
Station Heat Rate kcal/kWh 1850 1850 1850
Calorific Value of Gas kcal/scm 10000 10000 10000
Overall Heat from Gas G Cal 1231656 2532304 2585035
Actual Gas Consumption M. scm 123.17 253.23 258.50
Price of Gas Rs/scm 11.21 11.55 11.89
Cost of Gas Rs Crores 138.07 292.39 307.43
Transportation Cost Rs Crores 0.15 0.15 0.15
Total Fuel Cost Rs Crores 138.22 292.54 307.58
Fuel Cost/Unit Gross Rs/kWh 2.08 2.14 2.20
Fuel Cost/Unit Net Rs/kWh 2.21 2.27 2.34
Valuthur GTPS
Parameter Units
4.9 Generation from the State Owned Power Plant
4.9.1 Based on the above operational parameter and the capacity of the power plant, the gross
generation and net generation envisaged for FY 2016-17 to FY 2018-19 is outlined in the
following table:
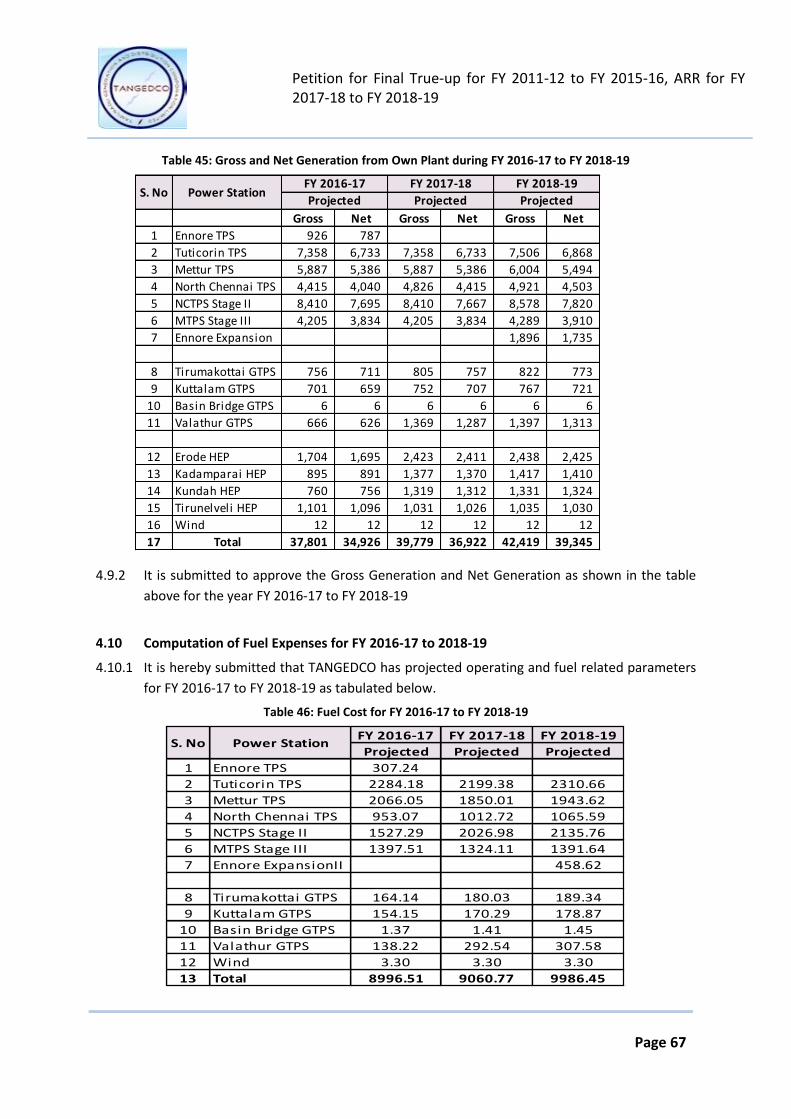
Petition for Final True-up for FY 2011-12 to FY 2015-16, ARR for FY 2017-18 to FY 2018-19
Page 67
Table 45: Gross and Net Generation from Own Plant during FY 2016-17 to FY 2018-19
Gross Net Gross Net Gross Net
1 Ennore TPS 926 787
2 Tuticorin TPS 7,358 6,733 7,358 6,733 7,506 6,868
3 Mettur TPS 5,887 5,386 5,887 5,386 6,004 5,494
4 North Chennai TPS 4,415 4,040 4,826 4,415 4,921 4,503
5 NCTPS Stage II 8,410 7,695 8,410 7,667 8,578 7,820
6 MTPS Stage III 4,205 3,834 4,205 3,834 4,289 3,910
7 Ennore Expansion 1,896 1,735
8 Tirumakottai GTPS 756 711 805 757 822 773
9 Kuttalam GTPS 701 659 752 707 767 721
10 Basin Bridge GTPS 6 6 6 6 6 6
11 Valathur GTPS 666 626 1,369 1,287 1,397 1,313
12 Erode HEP 1,704 1,695 2,423 2,411 2,438 2,425
13 Kadamparai HEP 895 891 1,377 1,370 1,417 1,410
14 Kundah HEP 760 756 1,319 1,312 1,331 1,324
15 Tirunelveli HEP 1,101 1,096 1,031 1,026 1,035 1,030
16 Wind 12 12 12 12 12 12
17 Total 37,801 34,926 39,779 36,922 42,419 39,345
S. No Power StationFY 2016-17 FY 2017-18 FY 2018-19
Projected Projected Projected
4.9.2 It is submitted to approve the Gross Generation and Net Generation as shown in the table
above for the year FY 2016-17 to FY 2018-19
4.10 Computation of Fuel Expenses for FY 2016-17 to 2018-19
4.10.1 It is hereby submitted that TANGEDCO has projected operating and fuel related parameters
for FY 2016-17 to FY 2018-19 as tabulated below.
Table 46: Fuel Cost for FY 2016-17 to FY 2018-19
FY 2016-17 FY 2017-18 FY 2018-19
Projected Projected Projected
1 Ennore TPS 307.24
2 Tuticorin TPS 2284.18 2199.38 2310.66
3 Mettur TPS 2066.05 1850.01 1943.62
4 North Chennai TPS 953.07 1012.72 1065.59
5 NCTPS Stage II 1527.29 2026.98 2135.76
6 MTPS Stage III 1397.51 1324.11 1391.64
7 Ennore ExpansionII 458.62
8 Tirumakottai GTPS 164.14 180.03 189.34
9 Kuttalam GTPS 154.15 170.29 178.87
10 Basin Bridge GTPS 1.37 1.41 1.45
11 Valathur GTPS 138.22 292.54 307.58
12 Wind 3.30 3.30 3.30
13 Total 8996.51 9060.77 9986.45
S. No Power Station
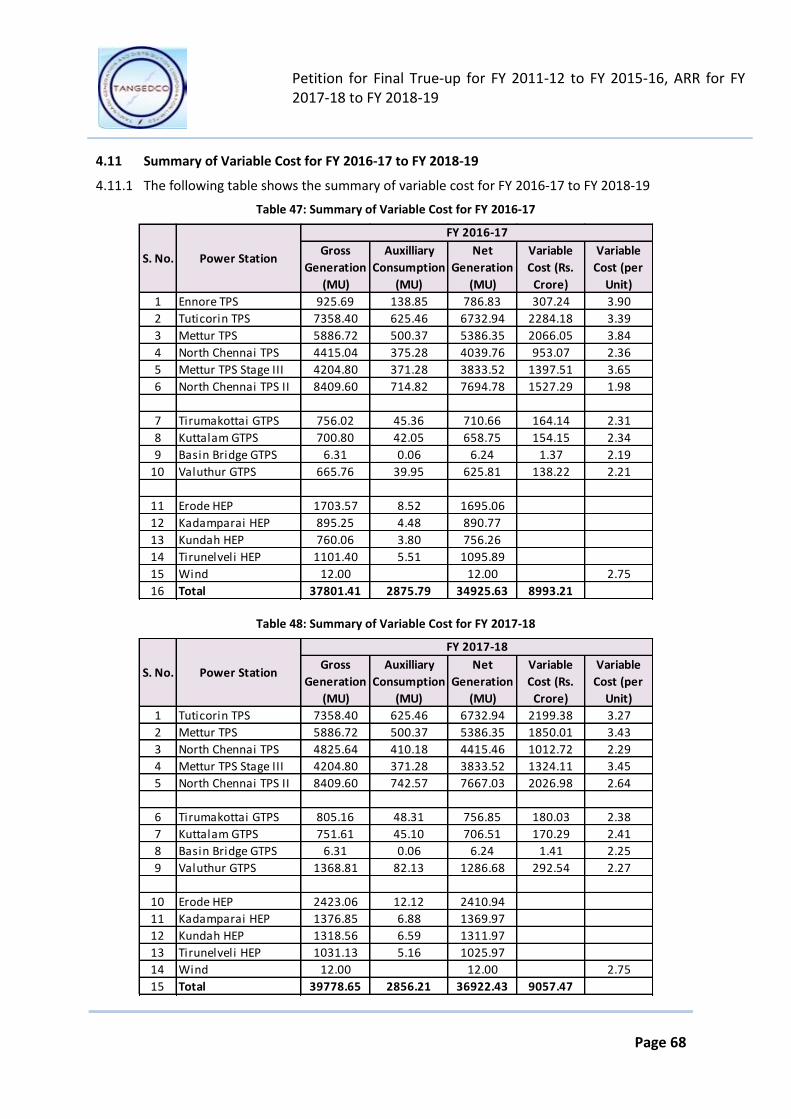
Petition for Final True-up for FY 2011-12 to FY 2015-16, ARR for FY 2017-18 to FY 2018-19
Page 68
4.11 Summary of Variable Cost for FY 2016-17 to FY 2018-19
4.11.1 The following table shows the summary of variable cost for FY 2016-17 to FY 2018-19
Table 47: Summary of Variable Cost for FY 2016-17
Gross
Generation
(MU)
Auxilliary
Consumption
(MU)
Net
Generation
(MU)
Variable
Cost (Rs.
Crore)
Variable
Cost (per
Unit)
1 Ennore TPS 925.69 138.85 786.83 307.24 3.90
2 Tuticorin TPS 7358.40 625.46 6732.94 2284.18 3.39
3 Mettur TPS 5886.72 500.37 5386.35 2066.05 3.84
4 North Chennai TPS 4415.04 375.28 4039.76 953.07 2.36
5 Mettur TPS Stage III 4204.80 371.28 3833.52 1397.51 3.65
6 North Chennai TPS II 8409.60 714.82 7694.78 1527.29 1.98
7 Tirumakottai GTPS 756.02 45.36 710.66 164.14 2.31
8 Kuttalam GTPS 700.80 42.05 658.75 154.15 2.34
9 Basin Bridge GTPS 6.31 0.06 6.24 1.37 2.19
10 Valuthur GTPS 665.76 39.95 625.81 138.22 2.21
11 Erode HEP 1703.57 8.52 1695.06
12 Kadamparai HEP 895.25 4.48 890.77
13 Kundah HEP 760.06 3.80 756.26
14 Tirunelveli HEP 1101.40 5.51 1095.89
15 Wind 12.00 12.00 2.75
16 Total 37801.41 2875.79 34925.63 8993.21
S. No. Power Station
FY 2016-17
Table 48: Summary of Variable Cost for FY 2017-18
Gross
Generation
(MU)
Auxilliary
Consumption
(MU)
Net
Generation
(MU)
Variable
Cost (Rs.
Crore)
Variable
Cost (per
Unit)
1 Tuticorin TPS 7358.40 625.46 6732.94 2199.38 3.27
2 Mettur TPS 5886.72 500.37 5386.35 1850.01 3.43
3 North Chennai TPS 4825.64 410.18 4415.46 1012.72 2.29
4 Mettur TPS Stage III 4204.80 371.28 3833.52 1324.11 3.45
5 North Chennai TPS II 8409.60 742.57 7667.03 2026.98 2.64
6 Tirumakottai GTPS 805.16 48.31 756.85 180.03 2.38
7 Kuttalam GTPS 751.61 45.10 706.51 170.29 2.41
8 Basin Bridge GTPS 6.31 0.06 6.24 1.41 2.25
9 Valuthur GTPS 1368.81 82.13 1286.68 292.54 2.27
10 Erode HEP 2423.06 12.12 2410.94
11 Kadamparai HEP 1376.85 6.88 1369.97
12 Kundah HEP 1318.56 6.59 1311.97
13 Tirunelveli HEP 1031.13 5.16 1025.97
14 Wind 12.00 12.00 2.75
15 Total 39778.65 2856.21 36922.43 9057.47
S. No. Power Station
FY 2017-18

Petition for Final True-up for FY 2011-12 to FY 2015-16, ARR for FY 2017-18 to FY 2018-19
Page 69
Table 49: Summary of Variable Cost for FY 2018-19
Gross
Generation
(MU)
Auxilliary
Consumption
(MU)
Net
Generation
(MU)
Variable
Cost (Rs.
Crore)
Variable
Cost (per
Unit)
1 Tuticorin TPS 7505.57 637.97 6867.59 2310.66 3.36
2 Mettur TPS 6004.45 510.38 5494.08 1943.62 3.54
3 North Chennai TPS 4921.11 418.29 4502.82 1065.59 2.37
4 Mettur TPS Stage III 4288.90 378.71 3910.19 1391.64 3.56
5 North Chennai TPS II 8577.79 757.42 7820.37 2135.76 2.73
6 Ennore Expansio 1896.36 161.19 1735.17 458.62 2.64
7 Tirumakottai GTPS 822.18 49.33 772.84 189.34 2.45
8 Kuttalam GTPS 766.50 45.99 720.51 178.87 2.48
9 Basin Bridge GTPS 6.31 0.06 6.24 1.45 2.32
10 Valuthur GTPS 1397.32 83.84 1313.48 307.58 2.34
11 Erode HEP 2437.59 12.19 2425.41
12 Kadamparai HEP 1416.78 7.08 1409.69
13 Kundah HEP 1331.09 6.66 1324.43
14 Tirunelveli HEP 1035.25 5.18 1030.08
15 Wind 12.00 12.00 2.75
16 Total 42419.20 3074.29 39344.91 9983.15
S. No. Power Station
FY 2018-19
4.12 Capital Expenditure and Capitalization
4.12.1 TANGEDCO submits that the expenditure incurred in each of the existing power station is on
account of regular repairs and maintenance works like replacement of worn-out machinery,
damaged equipment’s, transformers, boilers, generators, stators, auxiliary equipment’s, etc.
which are necessary works to be carried out for effective and efficient working of the power
station.
4.12.2 TANGEDCO submits that the additional expenditure incurred on the generation plant is in
line with the clause 19 of the TNERC Tariff Regulations which have been incurred for
efficient and successful operation of the Generating Station, and for the commercial
operation of the plant.
4.12.3 TANGEDCO also submits that the expenditure incurred for the distribution function during
the respective years is on account of regular operational and maintenance works carried out
during the respective years which were necessary for efficient working of the distribution
system.
4.12.4 The works carried out for the distribution function are mainly on account of addition of LT
and HT lines, distribution transformers, services rendered during the respective years and
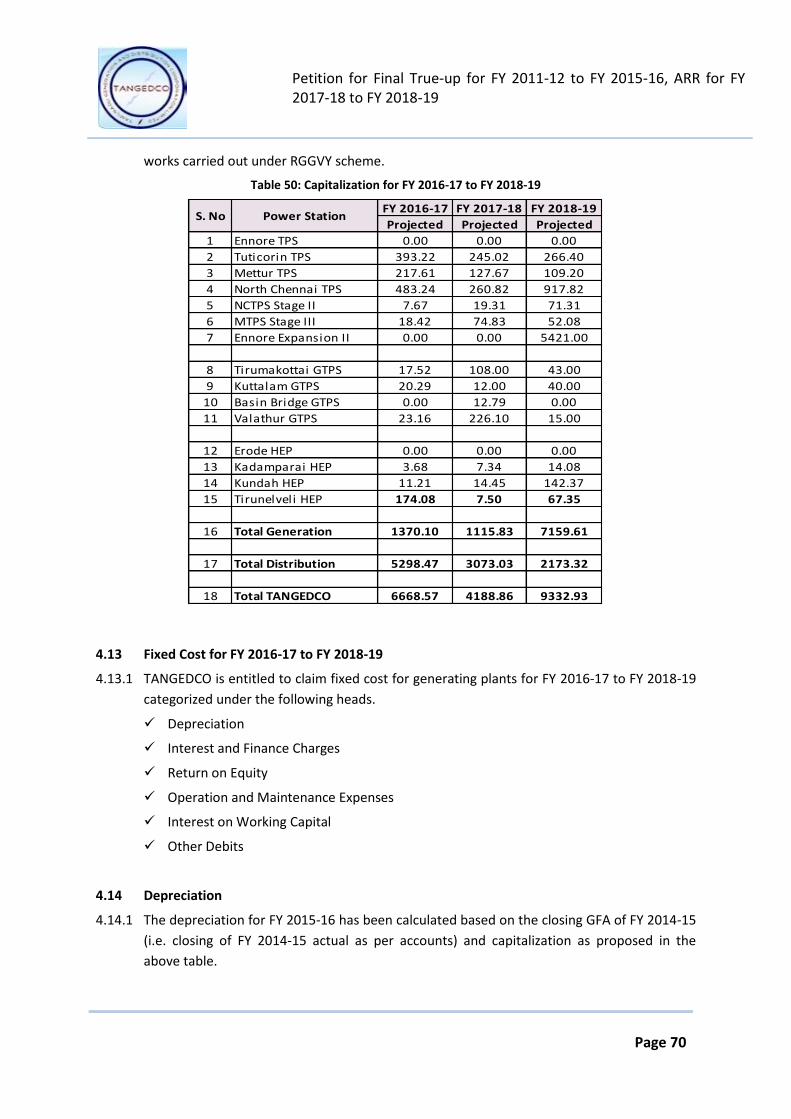
Petition for Final True-up for FY 2011-12 to FY 2015-16, ARR for FY 2017-18 to FY 2018-19
Page 70
works carried out under RGGVY scheme.
Table 50: Capitalization for FY 2016-17 to FY 2018-19
FY 2016-17 FY 2017-18 FY 2018-19
Projected Projected Projected
1 Ennore TPS 0.00 0.00 0.00
2 Tuticorin TPS 393.22 245.02 266.40
3 Mettur TPS 217.61 127.67 109.20
4 North Chennai TPS 483.24 260.82 917.82
5 NCTPS Stage II 7.67 19.31 71.31
6 MTPS Stage III 18.42 74.83 52.08
7 Ennore Expansion II 0.00 0.00 5421.00
8 Tirumakottai GTPS 17.52 108.00 43.00
9 Kuttalam GTPS 20.29 12.00 40.00
10 Basin Bridge GTPS 0.00 12.79 0.00
11 Valathur GTPS 23.16 226.10 15.00
12 Erode HEP 0.00 0.00 0.00
13 Kadamparai HEP 3.68 7.34 14.08
14 Kundah HEP 11.21 14.45 142.37
15 Tirunelveli HEP 174.08 7.50 67.35
16 Total Generation 1370.10 1115.83 7159.61
17 Total Distribution 5298.47 3073.03 2173.32
18 Total TANGEDCO 6668.57 4188.86 9332.93
S. No Power Station
4.13 Fixed Cost for FY 2016-17 to FY 2018-19
4.13.1 TANGEDCO is entitled to claim fixed cost for generating plants for FY 2016-17 to FY 2018-19
categorized under the following heads.
Depreciation
Interest and Finance Charges
Return on Equity
Operation and Maintenance Expenses
Interest on Working Capital
Other Debits
4.14 Depreciation
4.14.1 The depreciation for FY 2015-16 has been calculated based on the closing GFA of FY 2014-15
(i.e. closing of FY 2014-15 actual as per accounts) and capitalization as proposed in the
above table.
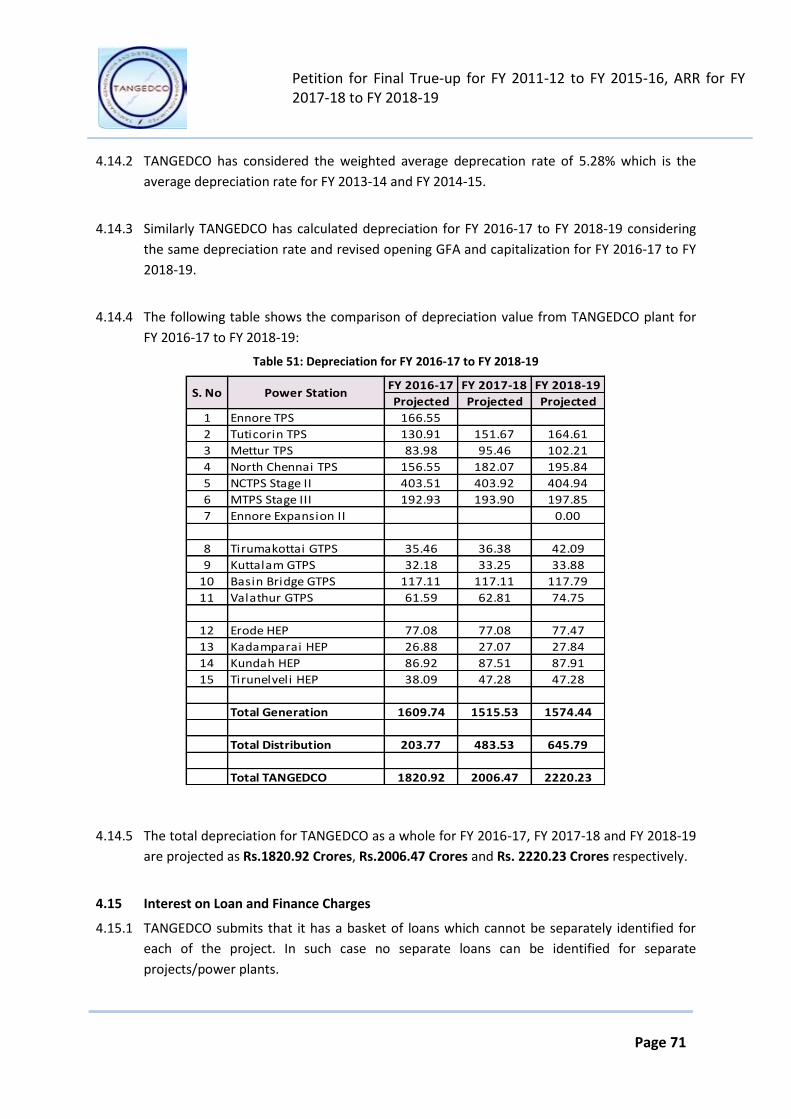
Petition for Final True-up for FY 2011-12 to FY 2015-16, ARR for FY 2017-18 to FY 2018-19
Page 71
4.14.2 TANGEDCO has considered the weighted average deprecation rate of 5.28% which is the
average depreciation rate for FY 2013-14 and FY 2014-15.
4.14.3 Similarly TANGEDCO has calculated depreciation for FY 2016-17 to FY 2018-19 considering
the same depreciation rate and revised opening GFA and capitalization for FY 2016-17 to FY
2018-19.
4.14.4 The following table shows the comparison of depreciation value from TANGEDCO plant for
FY 2016-17 to FY 2018-19:
Table 51: Depreciation for FY 2016-17 to FY 2018-19
FY 2016-17 FY 2017-18 FY 2018-19
Projected Projected Projected
1 Ennore TPS 166.55
2 Tuticorin TPS 130.91 151.67 164.61
3 Mettur TPS 83.98 95.46 102.21
4 North Chennai TPS 156.55 182.07 195.84
5 NCTPS Stage II 403.51 403.92 404.94
6 MTPS Stage III 192.93 193.90 197.85
7 Ennore Expansion II 0.00
8 Tirumakottai GTPS 35.46 36.38 42.09
9 Kuttalam GTPS 32.18 33.25 33.88
10 Basin Bridge GTPS 117.11 117.11 117.79
11 Valathur GTPS 61.59 62.81 74.75
12 Erode HEP 77.08 77.08 77.47
13 Kadamparai HEP 26.88 27.07 27.84
14 Kundah HEP 86.92 87.51 87.91
15 Tirunelveli HEP 38.09 47.28 47.28
Total Generation 1609.74 1515.53 1574.44
Total Distribution 203.77 483.53 645.79
Total TANGEDCO 1820.92 2006.47 2220.23
S. No Power Station
4.14.5 The total depreciation for TANGEDCO as a whole for FY 2016-17, FY 2017-18 and FY 2018-19
are projected as Rs.1820.92 Crores, Rs.2006.47 Crores and Rs. 2220.23 Crores respectively.
4.15 Interest on Loan and Finance Charges
4.15.1 TANGEDCO submits that it has a basket of loans which cannot be separately identified for
each of the project. In such case no separate loans can be identified for separate
projects/power plants.
Petition for Final True-up for FY 2011-12 to FY 2015-16, ARR for FY 2017-18 to FY 2018-19
Page 72
4.15.2 In such a scenario TANGEDCO has taken the entire loan balance available in the accounts of
FY 2015-16 except working capital loans (closing outstanding loans of FY 2015-16) and the
same has been segregated to each of the project based on the Opening GFA of FY 2016-17
to arrive at the Opening Loan balance for each of the project for FY 2016-17.
4.15.3 The loan additions and deductions during the year are based on estimated projections for
upcoming works for generation and distribution in the ensuing years.
4.15.4 TANGEDCO as discussed in the earlier chapter has joined the Government of India initiated
Ujwal Discom Assurance Yojna (UDAY) for revival of Discoms and has entered in to a
tripartite Memorandum of Understanding (MoU) between Government of Tamilnadu,
Government of India and TANGEDCO on 09th January, 2017.
4.15.5 Total Loan Outstanding as on 31st March 2017 is estimated to be Rs. 81782Cr and
Government of TN will take over 75% of the distribution function loan of Rs. 30420 Cr. This
will result in an interest savings of approximately Rs 2882 Cr at a weighted average interest
rate of 12.25%. The average interest rate of 12.25% is arrived based on the actual net
average interest rate of FY 2013-14 and FY 2014-15.
4.15.6 The interest rate considered for FY 2016-17 is 11.29% and 10.50% for FY 2017-18 & FY 2018-
19.
4.15.7 The other finance charges have been estimated based on the actual of FY 2015-16 reflecting
in accounts of individual projects.
4.15.8 The following table shows Interest and Finance Charges for the year FY 2016-17 to FY 2018-
19 (Projected) for TANGEDCO.

Petition for Final True-up for FY 2011-12 to FY 2015-16, ARR for FY 2017-18 to FY 2018-19
Page 73
Table 52: Interest & Finance Charges for FY 2016-17 to FY 2018-19
FY 2016-17 FY 2017-18 FY 2018-19
Projected Projected Projected
1 Ennore TPS 399.78
2 Tuticorin TPS 701.32 285.04 332.29
3 Mettur TPS 419.88 180.13 199.59
4 North Chennai TPS 727.19 330.02 462.03
5 NCTPS Stage II 237.14 565.72 542.40
6 MTPS Stage III 197.29 257.87 255.69
7 Ennore Expansion 163.36
8 Tirumakottai GTPS 168.27 72.63 86.05
9 Kuttalam GTPS 140.61 57.38 61.03
10 Basin Bridge GTPS 209.48 199.32 190.54
11 Valathur GTPS 207.83 129.58 148.92
12 Erode HEP 264.43 133.54 129.61
13 Kadamparai HEP 155.16 48.82 66.81
14 Kundah HEP 338.40 150.99 153.22
15 Tirunelveli HEP 232.16 79.01 75.07
16 Total Generation 4399.84 2489.85 2866.00
17 Total Distribution 3807.19 3345.74 3945.15
18 Total TANGEDCO 8207.03 5835.59 6811.16
S. No Power Station
4.16 Interest on Woking Capital
4.16.1 The interest on working capital claimed during FY 2016-17 to FY 2018-19 is based on
normative calculation as specified in the TNERC (Terms and Conditions of Tariff) Regulations,
2005.
4.16.2 The interest considered for computation of interest on working capital is 12.25% in FY 2016-
17 and 11.50% for FY 2017-18 and FY 2018-19. The interest on working capital computed for
FY 2016-17 to FY 2018-19 for generation and distribution function is given in the table
below.
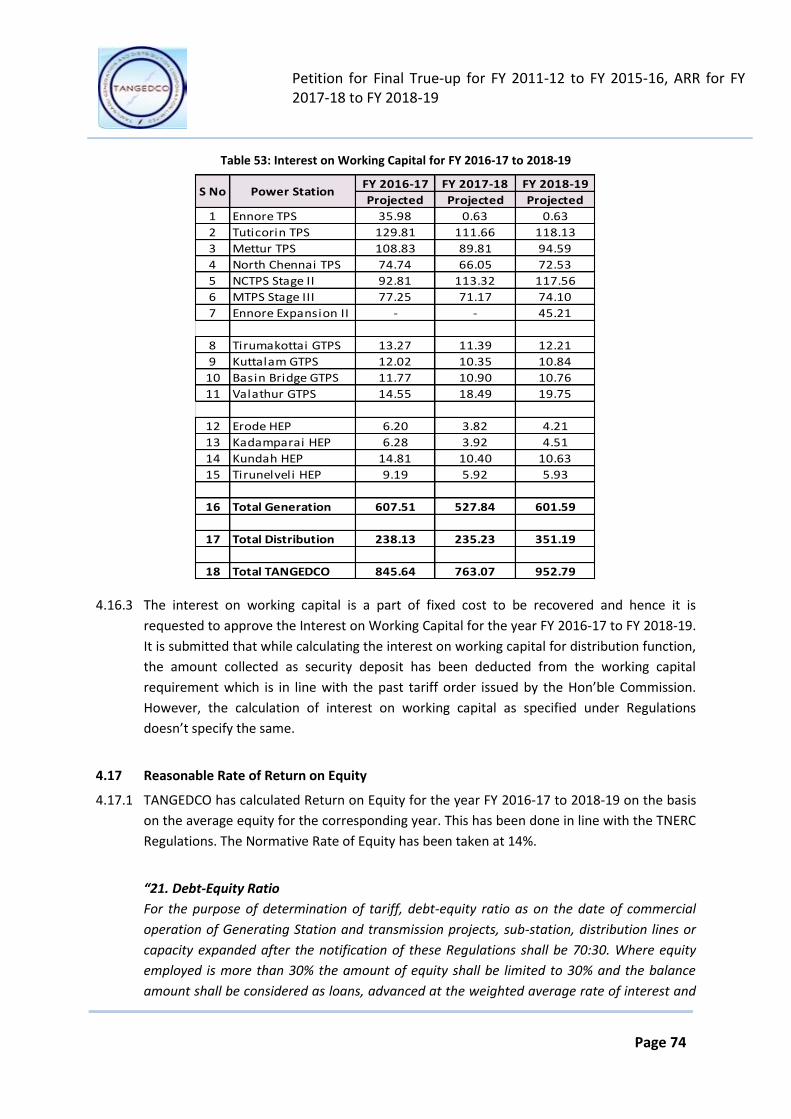
Petition for Final True-up for FY 2011-12 to FY 2015-16, ARR for FY 2017-18 to FY 2018-19
Page 74
Table 53: Interest on Working Capital for FY 2016-17 to 2018-19
FY 2016-17 FY 2017-18 FY 2018-19
Projected Projected Projected
1 Ennore TPS 35.98 0.63 0.63
2 Tuticorin TPS 129.81 111.66 118.13
3 Mettur TPS 108.83 89.81 94.59
4 North Chennai TPS 74.74 66.05 72.53
5 NCTPS Stage II 92.81 113.32 117.56
6 MTPS Stage III 77.25 71.17 74.10
7 Ennore Expansion II - - 45.21
8 Tirumakottai GTPS 13.27 11.39 12.21
9 Kuttalam GTPS 12.02 10.35 10.84
10 Basin Bridge GTPS 11.77 10.90 10.76
11 Valathur GTPS 14.55 18.49 19.75
12 Erode HEP 6.20 3.82 4.21
13 Kadamparai HEP 6.28 3.92 4.51
14 Kundah HEP 14.81 10.40 10.63
15 Tirunelveli HEP 9.19 5.92 5.93
16 Total Generation 607.51 527.84 601.59
17 Total Distribution 238.13 235.23 351.19
18 Total TANGEDCO 845.64 763.07 952.79
S No Power Station
4.16.3 The interest on working capital is a part of fixed cost to be recovered and hence it is
requested to approve the Interest on Working Capital for the year FY 2016-17 to FY 2018-19.
It is submitted that while calculating the interest on working capital for distribution function,
the amount collected as security deposit has been deducted from the working capital
requirement which is in line with the past tariff order issued by the Hon’ble Commission.
However, the calculation of interest on working capital as specified under Regulations
doesn’t specify the same.
4.17 Reasonable Rate of Return on Equity
4.17.1 TANGEDCO has calculated Return on Equity for the year FY 2016-17 to 2018-19 on the basis
on the average equity for the corresponding year. This has been done in line with the TNERC
Regulations. The Normative Rate of Equity has been taken at 14%.
“21. Debt-Equity Ratio
For the purpose of determination of tariff, debt-equity ratio as on the date of commercial
operation of Generating Station and transmission projects, sub-station, distribution lines or
capacity expanded after the notification of these Regulations shall be 70:30. Where equity
employed is more than 30% the amount of equity shall be limited to 30% and the balance
amount shall be considered as loans, advanced at the weighted average rate of interest and
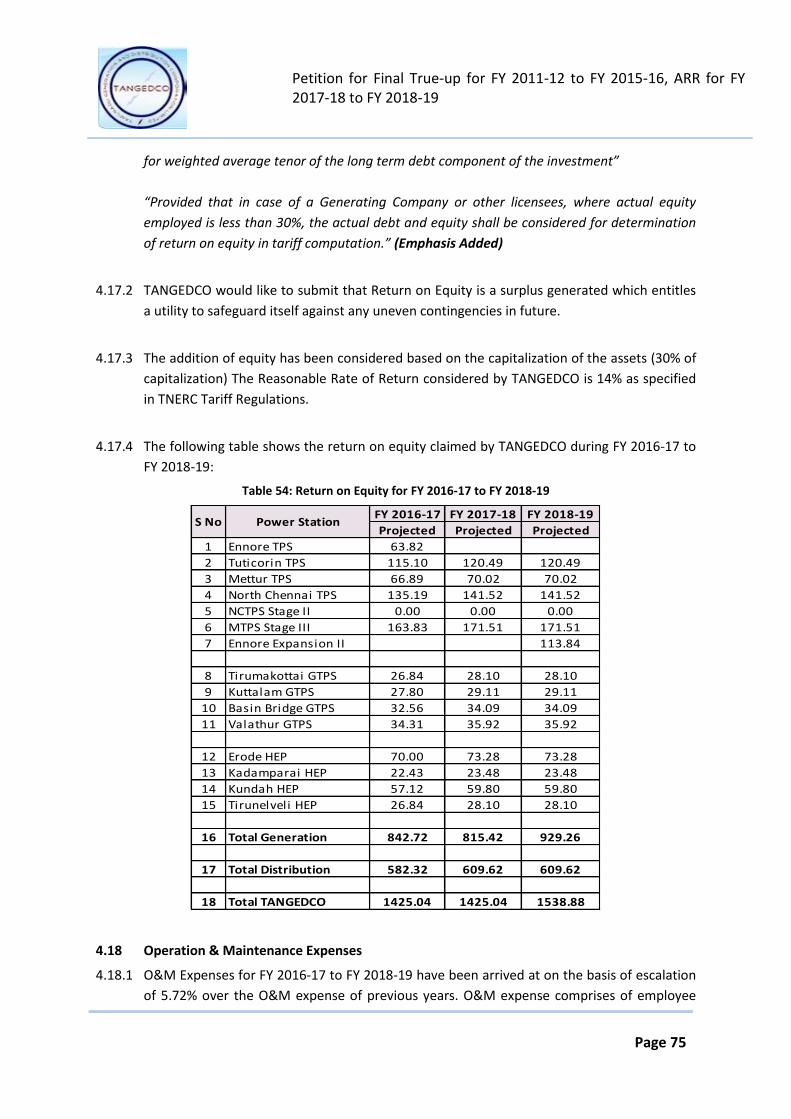
Petition for Final True-up for FY 2011-12 to FY 2015-16, ARR for FY 2017-18 to FY 2018-19
Page 75
for weighted average tenor of the long term debt component of the investment”
“Provided that in case of a Generating Company or other licensees, where actual equity
employed is less than 30%, the actual debt and equity shall be considered for determination
of return on equity in tariff computation.” (Emphasis Added)
4.17.2 TANGEDCO would like to submit that Return on Equity is a surplus generated which entitles
a utility to safeguard itself against any uneven contingencies in future.
4.17.3 The addition of equity has been considered based on the capitalization of the assets (30% of
capitalization) The Reasonable Rate of Return considered by TANGEDCO is 14% as specified
in TNERC Tariff Regulations.
4.17.4 The following table shows the return on equity claimed by TANGEDCO during FY 2016-17 to
FY 2018-19:
Table 54: Return on Equity for FY 2016-17 to FY 2018-19
FY 2016-17 FY 2017-18 FY 2018-19
Projected Projected Projected
1 Ennore TPS 63.82
2 Tuticorin TPS 115.10 120.49 120.49
3 Mettur TPS 66.89 70.02 70.02
4 North Chennai TPS 135.19 141.52 141.52
5 NCTPS Stage II 0.00 0.00 0.00
6 MTPS Stage III 163.83 171.51 171.51
7 Ennore Expansion II 113.84
8 Tirumakottai GTPS 26.84 28.10 28.10
9 Kuttalam GTPS 27.80 29.11 29.11
10 Basin Bridge GTPS 32.56 34.09 34.09
11 Valathur GTPS 34.31 35.92 35.92
12 Erode HEP 70.00 73.28 73.28
13 Kadamparai HEP 22.43 23.48 23.48
14 Kundah HEP 57.12 59.80 59.80
15 Tirunelveli HEP 26.84 28.10 28.10
16 Total Generation 842.72 815.42 929.26
17 Total Distribution 582.32 609.62 609.62
18 Total TANGEDCO 1425.04 1425.04 1538.88
S No Power Station
4.18 Operation & Maintenance Expenses
4.18.1 O&M Expenses for FY 2016-17 to FY 2018-19 have been arrived at on the basis of escalation
of 5.72% over the O&M expense of previous years. O&M expense comprises of employee

Petition for Final True-up for FY 2011-12 to FY 2015-16, ARR for FY 2017-18 to FY 2018-19
Page 76
expense, A&G expense and R&M expense. As per TNERC (Terms & Conditions for
determination of tariff) Regulations 2005, O&M expenses are to be derived on the basis of
actual O&M expenses for the last 5 years based on the audited accounts. However,
TANGEDCO would like to submit that TANGEDCO was unbundled from the erstwhile TNEB
only on 30th Oct 2010. As such, it is difficult for it to derive the O&M expenses pertaining to
transmission activities for the last 5 years.
4.18.2 Although the TNERC (Terms & Conditions for determination of tariff) Regulations 2005
provides for an escalation of 4% on O&M expenses for previous year; TANGEDCO has
considered escalation rates on the basis of certain ground realities. The rationale for
considering the rates for certain particulars is given below:
a. Employee Cost:
i. Salaries
TANGEDCO would like to submit that it has considered normal escalation of 5.72% on basic
salaries for the entire control period. However an escalation of 15% has been considered for
the FY 2015-16 considering the impact of 7th Pay Commission.
ii. Dearness Allowance
During FY 2013-14 dearness allowances is estimated at 90% of the basic salaries during that
year. From FY 16 to FY 19 growth rates of 5.72% is taken on the amount estimated for FY
2013-14. For ensuing years hence forth additional escalation of 15% has been considered to
that of the previous year.
iii. Bonus and Exgratia
An escalation of 5.72% is considered for the entire control period.
iv. Other components of Employee cost
All other components of employee cost are escalated at 5.72% in line with Tariff Regulations.
b. Administration & General Expenses
All the components of Administration and general expenses have been considered at an
escalation of TNERC approved rate of 5.72%.
c. Repair & Maintenance Expenses
i. Plant and Machinery and Lines and Cable Network
Plant and Machinery and Lines and Cable Network is considered an escalation of
5.72% for FY 2015-16 to FY 2018-19.
ii. Civil works
On similar lines civil works have been considered at 5.72% escalation for FY 2015-16
to FY 2018-19
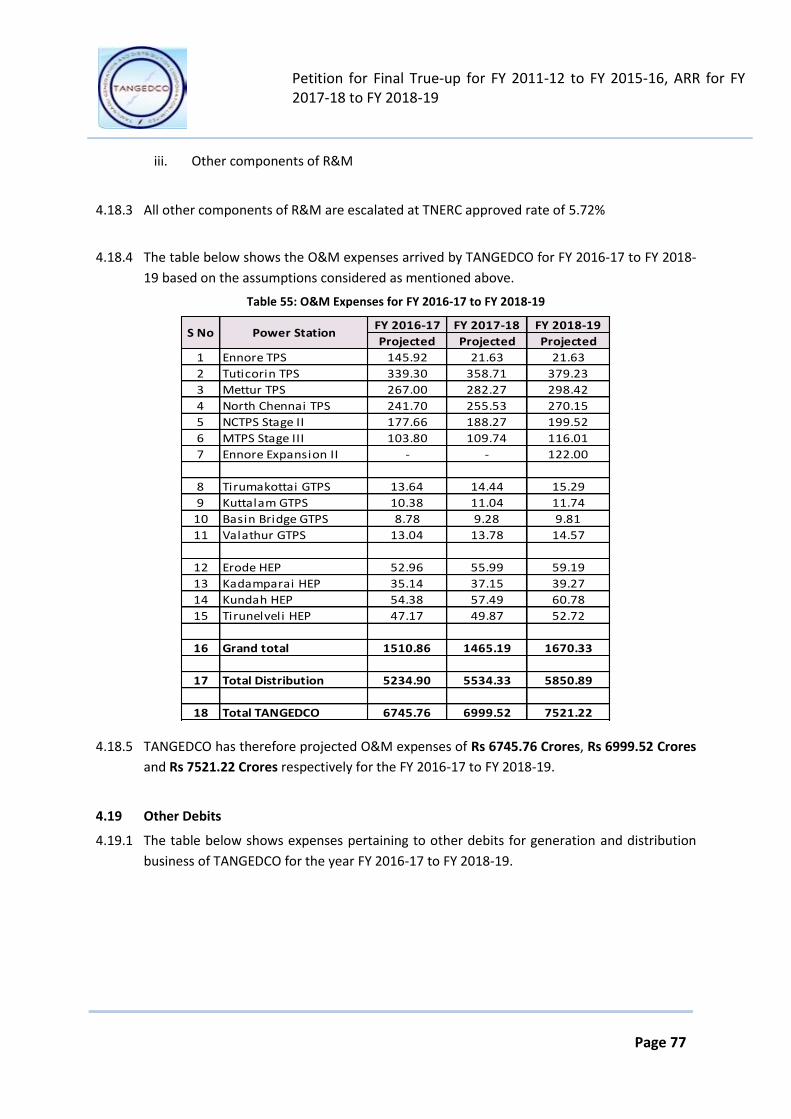
Petition for Final True-up for FY 2011-12 to FY 2015-16, ARR for FY 2017-18 to FY 2018-19
Page 77
iii. Other components of R&M
4.18.3 All other components of R&M are escalated at TNERC approved rate of 5.72%
4.18.4 The table below shows the O&M expenses arrived by TANGEDCO for FY 2016-17 to FY 2018-
19 based on the assumptions considered as mentioned above.
Table 55: O&M Expenses for FY 2016-17 to FY 2018-19
FY 2016-17 FY 2017-18 FY 2018-19
Projected Projected Projected
1 Ennore TPS 145.92 21.63 21.63
2 Tuticorin TPS 339.30 358.71 379.23
3 Mettur TPS 267.00 282.27 298.42
4 North Chennai TPS 241.70 255.53 270.15
5 NCTPS Stage II 177.66 188.27 199.52
6 MTPS Stage III 103.80 109.74 116.01
7 Ennore Expansion II - - 122.00
8 Tirumakottai GTPS 13.64 14.44 15.29
9 Kuttalam GTPS 10.38 11.04 11.74
10 Basin Bridge GTPS 8.78 9.28 9.81
11 Valathur GTPS 13.04 13.78 14.57
12 Erode HEP 52.96 55.99 59.19
13 Kadamparai HEP 35.14 37.15 39.27
14 Kundah HEP 54.38 57.49 60.78
15 Tirunelveli HEP 47.17 49.87 52.72
16 Grand total 1510.86 1465.19 1670.33
17 Total Distribution 5234.90 5534.33 5850.89
18 Total TANGEDCO 6745.76 6999.52 7521.22
S No Power Station
4.18.5 TANGEDCO has therefore projected O&M expenses of Rs 6745.76 Crores, Rs 6999.52 Crores
and Rs 7521.22 Crores respectively for the FY 2016-17 to FY 2018-19.
4.19 Other Debits
4.19.1 The table below shows expenses pertaining to other debits for generation and distribution
business of TANGEDCO for the year FY 2016-17 to FY 2018-19.
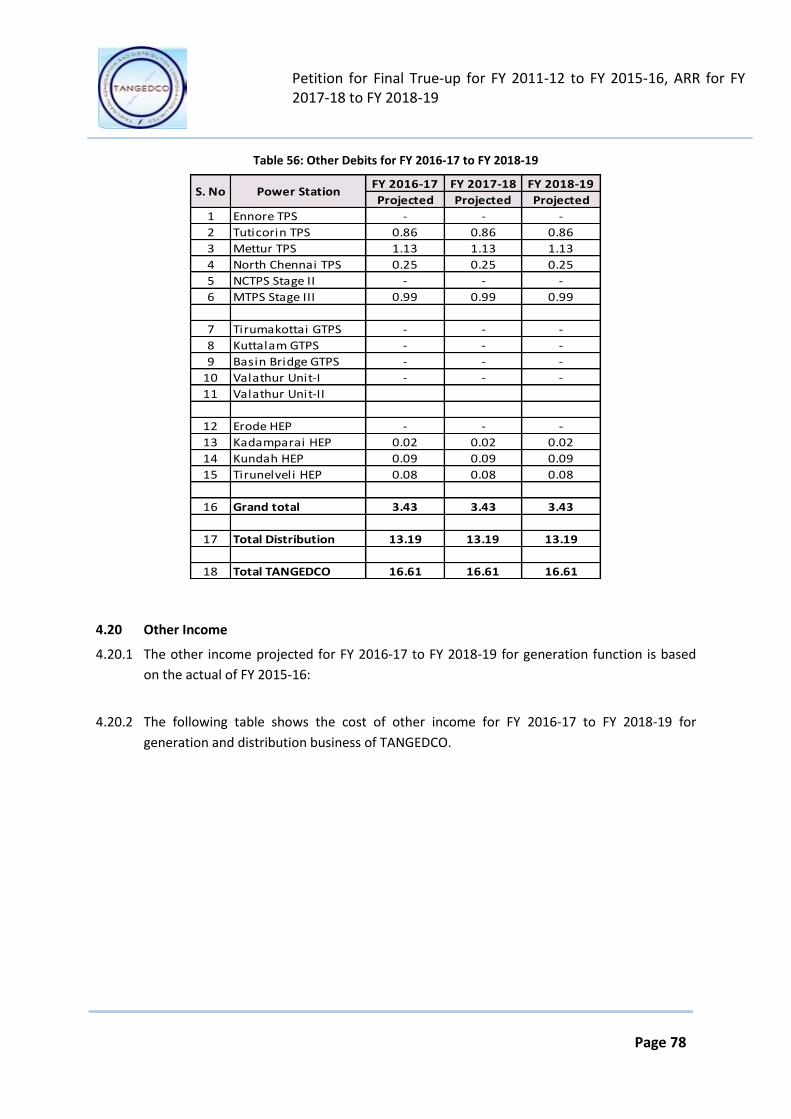
Petition for Final True-up for FY 2011-12 to FY 2015-16, ARR for FY 2017-18 to FY 2018-19
Page 78
Table 56: Other Debits for FY 2016-17 to FY 2018-19
FY 2016-17 FY 2017-18 FY 2018-19
Projected Projected Projected
1 Ennore TPS - - -
2 Tuticorin TPS 0.86 0.86 0.86
3 Mettur TPS 1.13 1.13 1.13
4 North Chennai TPS 0.25 0.25 0.25
5 NCTPS Stage II - - -
6 MTPS Stage III 0.99 0.99 0.99
7 Tirumakottai GTPS - - -
8 Kuttalam GTPS - - -
9 Basin Bridge GTPS - - -
10 Valathur Unit-I - - -
11 Valathur Unit-II
12 Erode HEP - - -
13 Kadamparai HEP 0.02 0.02 0.02
14 Kundah HEP 0.09 0.09 0.09
15 Tirunelveli HEP 0.08 0.08 0.08
16 Grand total 3.43 3.43 3.43
17 Total Distribution 13.19 13.19 13.19
18 Total TANGEDCO 16.61 16.61 16.61
S. No Power Station
4.20 Other Income
4.20.1 The other income projected for FY 2016-17 to FY 2018-19 for generation function is based
on the actual of FY 2015-16:
4.20.2 The following table shows the cost of other income for FY 2016-17 to FY 2018-19 for
generation and distribution business of TANGEDCO.
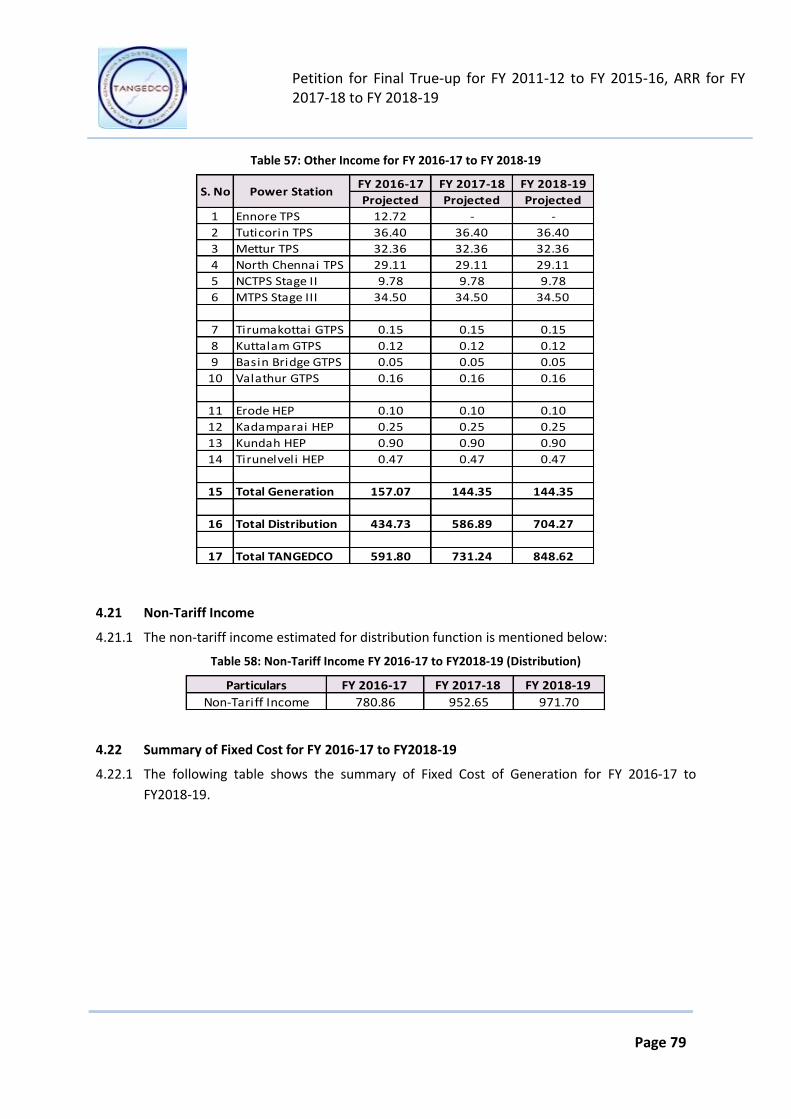
Petition for Final True-up for FY 2011-12 to FY 2015-16, ARR for FY 2017-18 to FY 2018-19
Page 79
Table 57: Other Income for FY 2016-17 to FY 2018-19
FY 2016-17 FY 2017-18 FY 2018-19
Projected Projected Projected
1 Ennore TPS 12.72 - -
2 Tuticorin TPS 36.40 36.40 36.40
3 Mettur TPS 32.36 32.36 32.36
4 North Chennai TPS 29.11 29.11 29.11
5 NCTPS Stage II 9.78 9.78 9.78
6 MTPS Stage III 34.50 34.50 34.50
7 Tirumakottai GTPS 0.15 0.15 0.15
8 Kuttalam GTPS 0.12 0.12 0.12
9 Basin Bridge GTPS 0.05 0.05 0.05
10 Valathur GTPS 0.16 0.16 0.16
11 Erode HEP 0.10 0.10 0.10
12 Kadamparai HEP 0.25 0.25 0.25
13 Kundah HEP 0.90 0.90 0.90
14 Tirunelveli HEP 0.47 0.47 0.47
15 Total Generation 157.07 144.35 144.35
16 Total Distribution 434.73 586.89 704.27
17 Total TANGEDCO 591.80 731.24 848.62
S. No Power Station
4.21 Non-Tariff Income
4.21.1 The non-tariff income estimated for distribution function is mentioned below:
Table 58: Non-Tariff Income FY 2016-17 to FY2018-19 (Distribution)
Particulars FY 2016-17 FY 2017-18 FY 2018-19
Non-Tariff Income 780.86 952.65 971.70
4.22 Summary of Fixed Cost for FY 2016-17 to FY2018-19
4.22.1 The following table shows the summary of Fixed Cost of Generation for FY 2016-17 to
FY2018-19.
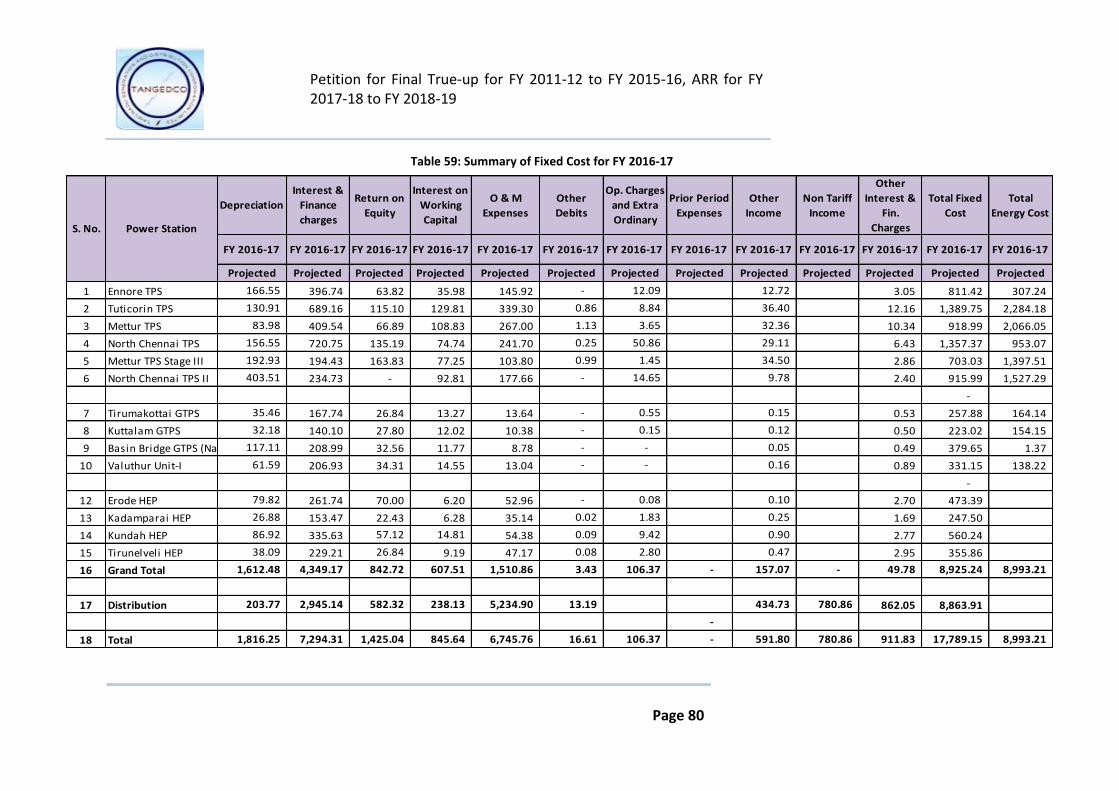
Petition for Final True-up for FY 2011-12 to FY 2015-16, ARR for FY 2017-18 to FY 2018-19
Page 80
Table 59: Summary of Fixed Cost for FY 2016-17
Projected Projected Projected Projected Projected Projected Projected Projected Projected Projected Projected Projected Projected
1 Ennore TPS 166.55 396.74 63.82 35.98 145.92 - 12.09 12.72 3.05 811.42 307.24
2 Tuticorin TPS 130.91 689.16 115.10 129.81 339.30 0.86 8.84 36.40 12.16 1,389.75 2,284.18
3 Mettur TPS 83.98 409.54 66.89 108.83 267.00 1.13 3.65 32.36 10.34 918.99 2,066.05
4 North Chennai TPS 156.55 720.75 135.19 74.74 241.70 0.25 50.86 29.11 6.43 1,357.37 953.07
5 Mettur TPS Stage III 192.93 194.43 163.83 77.25 103.80 0.99 1.45 34.50 2.86 703.03 1,397.51
6 North Chennai TPS II 403.51 234.73 - 92.81 177.66 - 14.65 9.78 2.40 915.99 1,527.29
-
7 Tirumakottai GTPS 35.46 167.74 26.84 13.27 13.64 - 0.55 0.15 0.53 257.88 164.14
8 Kuttalam GTPS 32.18 140.10 27.80 12.02 10.38 - 0.15 0.12 0.50 223.02 154.15
9 Basin Bridge GTPS (Naptha) 117.11 208.99 32.56 11.77 8.78 - - 0.05 0.49 379.65 1.37
10 Valuthur Unit-I 61.59 206.93 34.31 14.55 13.04 - - 0.16 0.89 331.15 138.22
-
12 Erode HEP 79.82 261.74 70.00 6.20 52.96 - 0.08 0.10 2.70 473.39
13 Kadamparai HEP 26.88 153.47 22.43 6.28 35.14 0.02 1.83 0.25 1.69 247.50
14 Kundah HEP 86.92 335.63 57.12 14.81 54.38 0.09 9.42 0.90 2.77 560.24
15 Tirunelveli HEP 38.09 229.21 26.84 9.19 47.17 0.08 2.80 0.47 2.95 355.86
16 Grand Total 1,612.48 4,349.17 842.72 607.51 1,510.86 3.43 106.37 - 157.07 - 49.78 8,925.24 8,993.21
17 Distribution 203.77 2,945.14 582.32 238.13 5,234.90 13.19 434.73 780.86 862.05 8,863.91
-
18 Total 1,816.25 7,294.31 1,425.04 845.64 6,745.76 16.61 106.37 - 591.80 780.86 911.83 17,789.15 8,993.21
S. No. Power Station
Depreciation
Interest &
Finance
charges
Return on
Equity
FY 2016-17 FY 2016-17 FY 2016-17
Other
Income
FY 2016-17
Non Tariff
Income
Other
Interest &
Fin.
Charges
Total Fixed
Cost
Total
Energy Cost
Interest on
Working
Capital
O & M
Expenses
Other
Debits
Op. Charges
and Extra
Ordinary
Prior Period
Expenses
FY 2016-17 FY 2016-17 FY 2016-17 FY 2016-17FY 2016-17 FY 2016-17 FY 2016-17 FY 2016-17 FY 2016-17

Petition for Final True-up for FY 2011-12 to FY 2015-16, ARR for FY 2017-18 to FY 2018-19
Page 81
Table 60: Summary of Fixed Cost for FY 2017-18
Projected Projected Projected Projected Projected Projected Projected Projected Projected Projected Projected Projected Projected
1 Ennore TPS - - - 0.63 21.63 - - - - 22.26 -
2 Tuticorin TPS 151.67 272.40 120.49 111.66 358.71 0.86 9.20 36.40 12.64 1,001.24 2,199.38
3 Mettur TPS 95.46 169.38 70.02 89.81 282.27 1.13 3.80 32.36 10.75 690.26 1,850.01
4 North Chennai TPS 182.07 323.33 141.52 66.05 255.53 0.25 52.89 29.11 6.69 999.23 1,012.72
5 Mettur TPS Stage III 193.90 254.90 171.51 71.17 109.74 0.99 1.51 34.50 2.97 772.19 1,324.11
6 North Chennai TPS II 403.92 563.22 - 113.32 188.27 - 15.24 9.78 2.50 1,276.68 2,026.98
7 Ennore Expansion - - - - - - - - - -
8 Ennore SEZ - - - - - - - - - -
-
9 Tirumakottai GTPS 36.38 72.07 28.10 11.39 14.44 - 0.57 0.15 0.56 163.36 180.03
10 Kuttalam GTPS 33.25 56.86 29.11 10.35 11.04 - 0.16 0.12 0.52 141.17 170.29
11 Basin Bridge GTPS 117.11 198.80 34.09 10.90 9.28 - - 0.05 0.51 370.64 1.41
12 Valuthur Unit-I 62.81 128.65 35.92 18.49 13.78 - - 0.16 0.93 260.43 292.54
-
14 Erode HEP 79.82 130.73 73.28 3.82 55.99 - 0.08 0.10 2.81 346.43
15 Kadamparai HEP 27.07 47.06 23.48 3.92 37.15 0.02 1.90 0.25 1.76 142.11
16 Kundah HEP 87.51 148.10 59.80 10.40 57.49 0.09 9.80 0.90 2.89 375.17
17 Tirunelveli HEP 47.28 75.95 28.10 5.92 49.87 0.08 2.91 0.47 3.07 212.70
18 Grand Total 1,518.27 2,441.45 815.42 527.84 1,465.19 3.43 98.06 - 144.35 - 48.60 6,773.89 9,057.47
17 Distribution 483.53 2,440.64 609.62 235.23 5,534.33 13.19 586.89 952.65 905.10 8,682.11
-
18 Total 2,001.80 4,882.09 1,425.04 763.07 6,999.52 16.61 98.06 - 731.24 952.65 953.70 15,456.00 9,057.47
Non Tariff
Income
Other
Interest &
Fin.
Total Fixed
Cost
Total
Energy Cost
Interest on
Working
Capital
O & M
Expenses
Other
Debits
Op. Charges
and Extra
Ordinary
Prior Period
Expenses
FY 2017-18 FY 2017-18 FY 2017-18 FY 2017-18FY 2017-18 FY 2017-18 FY 2017-18 FY 2017-18 FY 2017-18 FY 2017-18S. No. Power Station
Depreciation
Interest &
Finance
charges
Return on
Equity
FY 2017-18 FY 2017-18 FY 2017-18
Other
Income
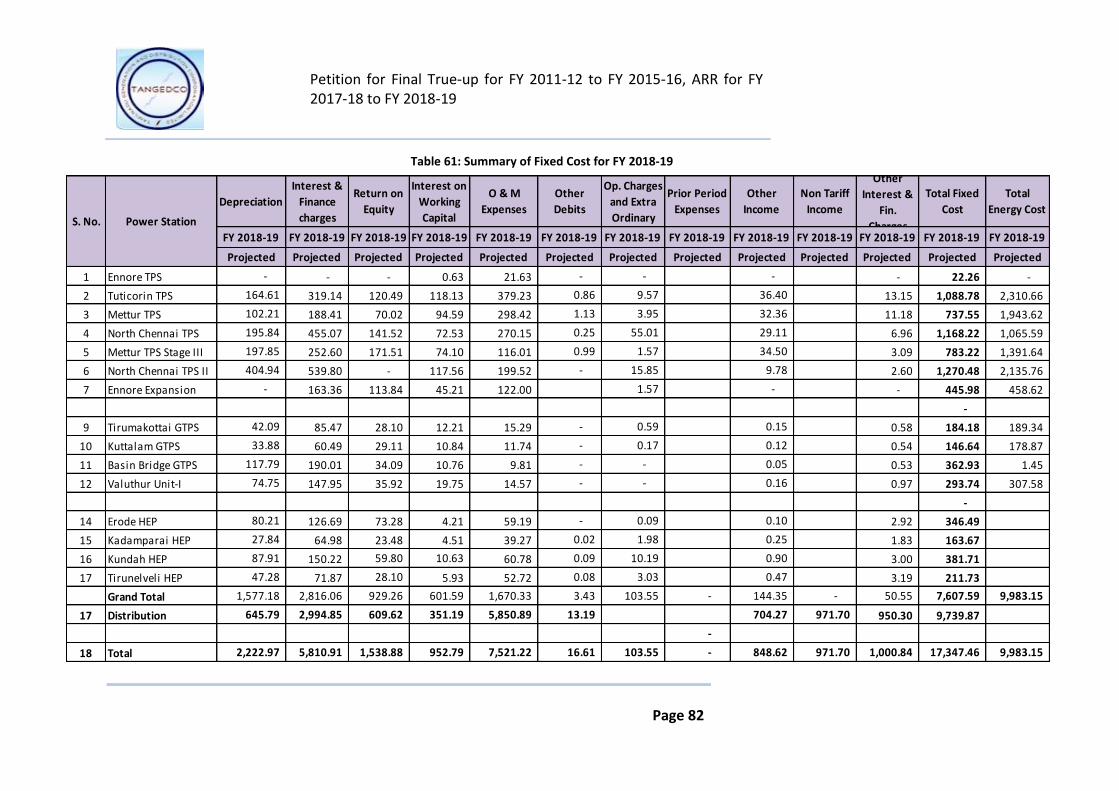
Petition for Final True-up for FY 2011-12 to FY 2015-16, ARR for FY 2017-18 to FY 2018-19
Page 82
Table 61: Summary of Fixed Cost for FY 2018-19
Projected Projected Projected Projected Projected Projected Projected Projected Projected Projected Projected Projected Projected
1 Ennore TPS - - - 0.63 21.63 - - - - 22.26 -
2 Tuticorin TPS 164.61 319.14 120.49 118.13 379.23 0.86 9.57 36.40 13.15 1,088.78 2,310.66
3 Mettur TPS 102.21 188.41 70.02 94.59 298.42 1.13 3.95 32.36 11.18 737.55 1,943.62
4 North Chennai TPS 195.84 455.07 141.52 72.53 270.15 0.25 55.01 29.11 6.96 1,168.22 1,065.59
5 Mettur TPS Stage III 197.85 252.60 171.51 74.10 116.01 0.99 1.57 34.50 3.09 783.22 1,391.64
6 North Chennai TPS II 404.94 539.80 - 117.56 199.52 - 15.85 9.78 2.60 1,270.48 2,135.76
7 Ennore Expansion - 163.36 113.84 45.21 122.00 1.57 - - 445.98 458.62
-
9 Tirumakottai GTPS 42.09 85.47 28.10 12.21 15.29 - 0.59 0.15 0.58 184.18 189.34
10 Kuttalam GTPS 33.88 60.49 29.11 10.84 11.74 - 0.17 0.12 0.54 146.64 178.87
11 Basin Bridge GTPS 117.79 190.01 34.09 10.76 9.81 - - 0.05 0.53 362.93 1.45
12 Valuthur Unit-I 74.75 147.95 35.92 19.75 14.57 - - 0.16 0.97 293.74 307.58
-
14 Erode HEP 80.21 126.69 73.28 4.21 59.19 - 0.09 0.10 2.92 346.49
15 Kadamparai HEP 27.84 64.98 23.48 4.51 39.27 0.02 1.98 0.25 1.83 163.67
16 Kundah HEP 87.91 150.22 59.80 10.63 60.78 0.09 10.19 0.90 3.00 381.71
17 Tirunelveli HEP 47.28 71.87 28.10 5.93 52.72 0.08 3.03 0.47 3.19 211.73
Grand Total 1,577.18 2,816.06 929.26 601.59 1,670.33 3.43 103.55 - 144.35 - 50.55 7,607.59 9,983.15
17 Distribution 645.79 2,994.85 609.62 351.19 5,850.89 13.19 704.27 971.70 950.30 9,739.87
-
18 Total 2,222.97 5,810.91 1,538.88 952.79 7,521.22 16.61 103.55 - 848.62 971.70 1,000.84 17,347.46 9,983.15
S. No. Power Station
Depreciation
Interest &
Finance
charges
Return on
Equity
FY 2018-19 FY 2018-19 FY 2018-19
Other
Income
FY 2018-19
Non Tariff
Income
Other
Interest &
Fin.
Charges
Total Fixed
Cost
Total
Energy Cost
Interest on
Working
Capital
O & M
Expenses
Other
Debits
Op. Charges
and Extra
Ordinary
Prior Period
Expenses
FY 2018-19 FY 2018-19 FY 2018-19 FY 2018-19FY 2018-19 FY 2018-19 FY 2018-19 FY 2018-19 FY 2018-19

Petition for Final True-up for FY 2011-12 to FY 2015-16, ARR for FY 2017-18 to FY 2018-19
Page 83
Table 62: Projected Total Cost from FY 2016-17 to FY 2018-19
Total Fixed Cost Total Variable Cost Total Cost
Projected Projected Projected
1 Ennore TPS 811.42 307.24 1118.66
2 Tuticorin TPS 1389.75 2284.18 3673.92
3 Mettur TPS 918.99 2066.05 2985.05
4 North Chennai TPS 1357.37 953.07 2310.44
5 Mettur TPS Stage III 703.03 1397.51 2100.54
6 North Chennai TPS II 915.99 1527.29 2443.27
7 Tirumakottai GTPS 257.88 164.14 422.02
8 Kuttalam GTPS 223.02 154.15 377.17
9 Basin Bridge GTPS 379.65 1.37 381.02
10 Valuthur GTPS 331.15 138.22 469.38
12 Erode HEP 473.39 473.39
13 Kadamparai HEP 247.50 247.50
14 Kundah HEP 560.24 560.24
15 Tirunelveli HEP 355.86 355.86
16 Wind 3.30 3.30
Grand Total 8925.24 8996.51 17921.75
Distribution 8863.91 8863.91
Total 17789.15 8996.51 26785.66
S. No Power Station
Total Fixed Cost Total Variable Cost Total Cost
Projected Projected Projected
1 Ennore TPS 22.26 0.00 22.26
2 Tuticorin TPS 1001.24 2199.38 3200.62
3 Mettur TPS 690.26 1850.01 2540.28
4 North Chennai TPS 999.23 1012.72 2011.95
5 Mettur TPS Stage III 772.19 1324.11 2096.30
6 North Chennai TPS II 1276.68 2026.98 3303.66
7 Tirumakottai GTPS 163.36 180.03 343.39
8 Kuttalam GTPS 141.17 170.29 311.46
9 Basin Bridge GTPS 370.64 1.41 372.05
10 Valuthur GTPS 260.43 292.54 552.97
12 Erode HEP 346.43 0.00 346.43
13 Kadamparai HEP 142.11 0.00 142.11
14 Kundah HEP 375.17 0.00 375.17
15 Tirunelveli HEP 212.70 0.00 212.70
16 Wind 3.30 3.30
Grand Total 6773.89 9060.77 15834.65
Distribution 8682.11 8682.11
Total 15456.00 9060.77 24516.77
S. No Power Station
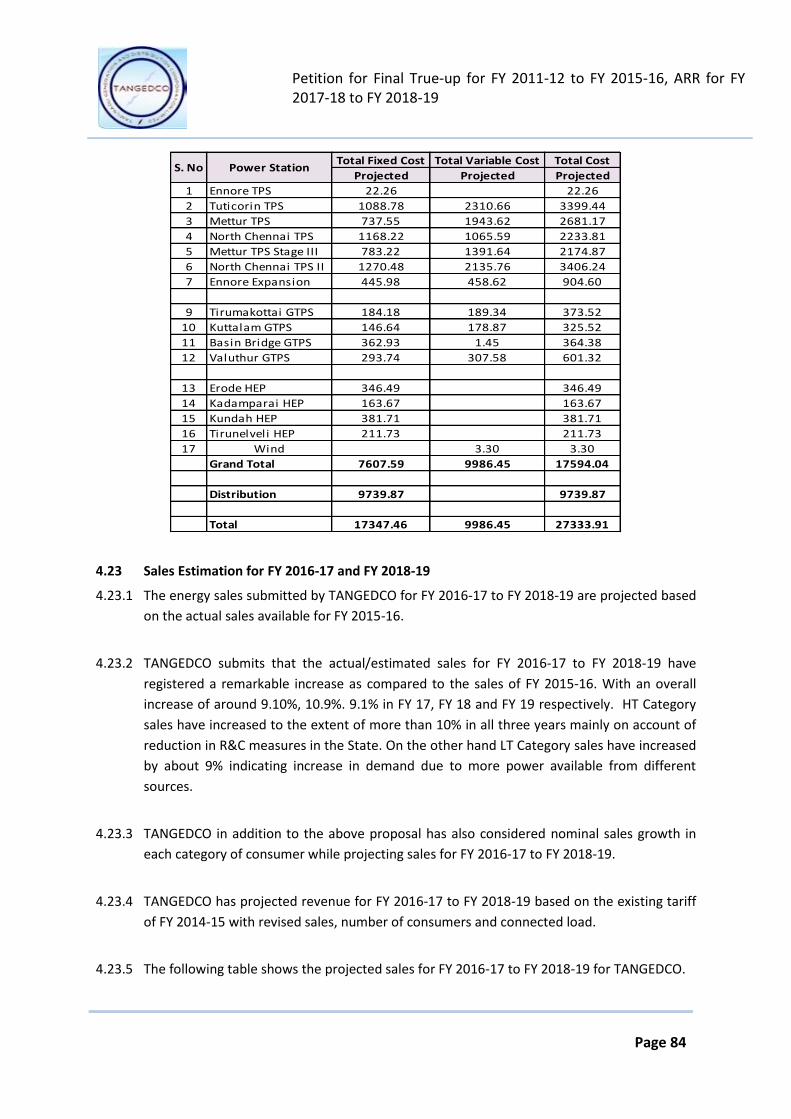
Petition for Final True-up for FY 2011-12 to FY 2015-16, ARR for FY 2017-18 to FY 2018-19
Page 84
Total Fixed Cost Total Variable Cost Total Cost
Projected Projected Projected
1 Ennore TPS 22.26 22.26
2 Tuticorin TPS 1088.78 2310.66 3399.44
3 Mettur TPS 737.55 1943.62 2681.17
4 North Chennai TPS 1168.22 1065.59 2233.81
5 Mettur TPS Stage III 783.22 1391.64 2174.87
6 North Chennai TPS II 1270.48 2135.76 3406.24
7 Ennore Expansion 445.98 458.62 904.60
9 Tirumakottai GTPS 184.18 189.34 373.52
10 Kuttalam GTPS 146.64 178.87 325.52
11 Basin Bridge GTPS 362.93 1.45 364.38
12 Valuthur GTPS 293.74 307.58 601.32
13 Erode HEP 346.49 346.49
14 Kadamparai HEP 163.67 163.67
15 Kundah HEP 381.71 381.71
16 Tirunelveli HEP 211.73 211.73
17 Wind 3.30 3.30
Grand Total 7607.59 9986.45 17594.04
Distribution 9739.87 9739.87
Total 17347.46 9986.45 27333.91
S. No Power Station
4.23 Sales Estimation for FY 2016-17 and FY 2018-19
4.23.1 The energy sales submitted by TANGEDCO for FY 2016-17 to FY 2018-19 are projected based
on the actual sales available for FY 2015-16.
4.23.2 TANGEDCO submits that the actual/estimated sales for FY 2016-17 to FY 2018-19 have
registered a remarkable increase as compared to the sales of FY 2015-16. With an overall
increase of around 9.10%, 10.9%. 9.1% in FY 17, FY 18 and FY 19 respectively. HT Category
sales have increased to the extent of more than 10% in all three years mainly on account of
reduction in R&C measures in the State. On the other hand LT Category sales have increased
by about 9% indicating increase in demand due to more power available from different
sources.
4.23.3 TANGEDCO in addition to the above proposal has also considered nominal sales growth in
each category of consumer while projecting sales for FY 2016-17 to FY 2018-19.
4.23.4 TANGEDCO has projected revenue for FY 2016-17 to FY 2018-19 based on the existing tariff
of FY 2014-15 with revised sales, number of consumers and connected load.
4.23.5 The following table shows the projected sales for FY 2016-17 to FY 2018-19 for TANGEDCO.
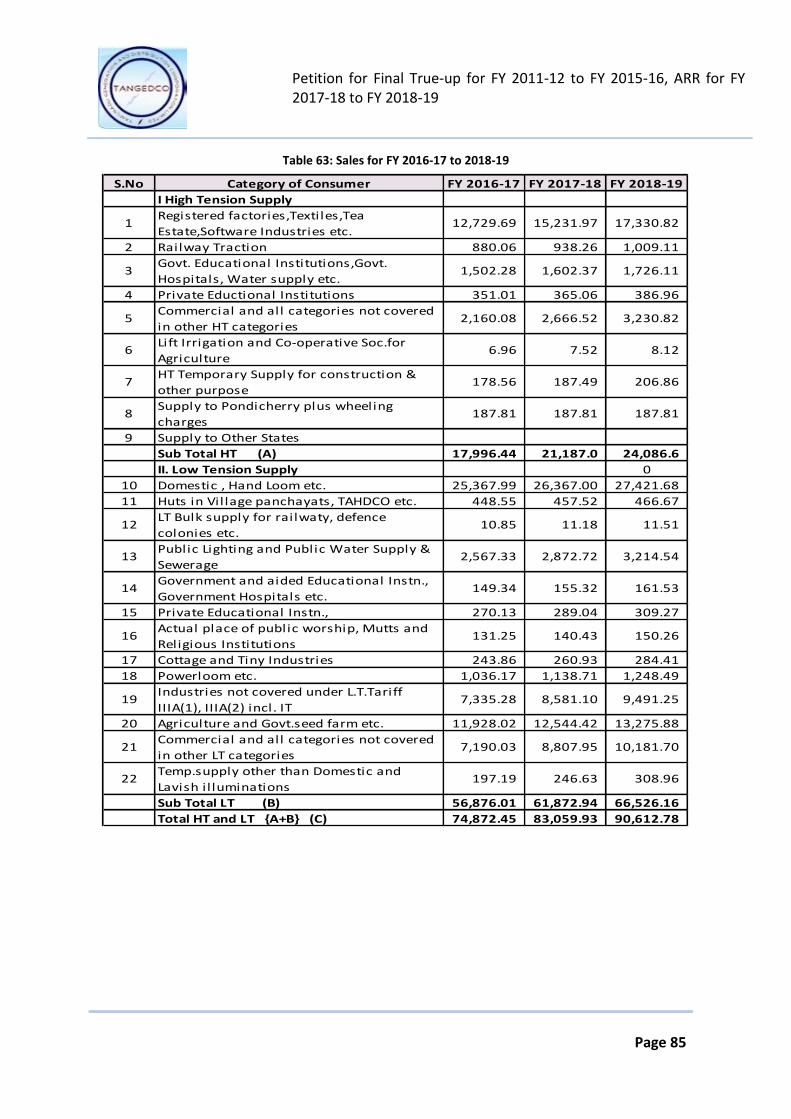
Petition for Final True-up for FY 2011-12 to FY 2015-16, ARR for FY 2017-18 to FY 2018-19
Page 85
Table 63: Sales for FY 2016-17 to 2018-19
S.No Category of Consumer FY 2016-17 FY 2017-18 FY 2018-19
I High Tension Supply
1Registered factories,Textiles,Tea
Estate,Software Industries etc.12,729.69 15,231.97 17,330.82
2 Railway Traction 880.06 938.26 1,009.11
3Govt. Educational Institutions,Govt.
Hospitals, Water supply etc.1,502.28 1,602.37 1,726.11
4 Private Eductional Institutions 351.01 365.06 386.96
5Commercial and all categories not covered
in other HT categories2,160.08 2,666.52 3,230.82
6Lift Irrigation and Co-operative Soc.for
Agriculture6.96 7.52 8.12
7HT Temporary Supply for construction &
other purpose178.56 187.49 206.86
8Supply to Pondicherry plus wheeling
charges187.81 187.81 187.81
9 Supply to Other States
Sub Total HT (A) 17,996.44 21,187.0 24,086.6
II. Low Tension Supply 0
10 Domestic , Hand Loom etc. 25,367.99 26,367.00 27,421.68
11 Huts in Vil lage panchayats, TAHDCO etc. 448.55 457.52 466.67
12LT Bulk supply for railwaty, defence
colonies etc. 10.85 11.18 11.51
13Public Lighting and Public Water Supply &
Sewerage2,567.33 2,872.72 3,214.54
14Government and aided Educational Instn.,
Government Hospitals etc.149.34 155.32 161.53
15 Private Educational Instn., 270.13 289.04 309.27
16Actual place of public worship, Mutts and
Religious Institutions131.25 140.43 150.26
17 Cottage and Tiny Industries 243.86 260.93 284.41
18 Powerloom etc. 1,036.17 1,138.71 1,248.49
19Industries not covered under L.T.Tariff
IIIA(1), IIIA(2) incl. IT7,335.28 8,581.10 9,491.25
20 Agriculture and Govt.seed farm etc. 11,928.02 12,544.42 13,275.88
21Commercial and all categories not covered
in other LT categories7,190.03 8,807.95 10,181.70
22Temp.supply other than Domestic and
Lavish i l luminations197.19 246.63 308.96
Sub Total LT (B) 56,876.01 61,872.94 66,526.16
Total HT and LT {A+B} (C) 74,872.45 83,059.93 90,612.78
Petition for Final True-up for FY 2011-12 to FY 2015-16, ARR for FY 2017-18 to FY 2018-19
Page 86
4.23.6 It is submitted that no wheeling units have been considered in the total sales MUs projected
for FY 2016-17 to FY 2018-19.However revenue projected for all the three years is inclusive
of subsidy provided by Government of Tamil Nadu (GoTN).
4.24 Transmission Charges
4.24.1 The Transmission charges considered in ARR for Distribution function for FY 2016-17 to FY
2018-19 is with an escalation of 5% based on transmission charges of FY 2015-16.
4.25 Power Purchase Expenses for FY 2016-17 to FY 2018-19
4.25.1 The power purchase expenses estimated to be incurred for FY 2016-17 to FY 2018-19 is
tabulated below.

Petition for Final True-up for FY 2011-12 to FY 2015-16, ARR for FY 2017-18 to FY 2018-19
Page 87
Table 64: Power Purchase Expenses for FY 2016-17 to FY 2018-19
Qty in MU Total Cost Qty in MU Total Cost Qty in MU Total Cost
NLC Stations
1 Neyveli TS-I 2,675.00 1,024.35 3,942.00 1,539.72 3,942.00 1,570.52
2 Neyveli TS-II Stage I 3,260.00 999.67 3,596.42 1,124.89 3,596.42 1,147.39
3 Neyveli TS-I Expansion 1,675.00 610.90 1,675.00 623.12 1,675.00 635.58
4 Neyveli Expansion Unit II 1,302.00 599.98 1,302.00 611.98 1,302.00 624.22
5 NTPL JV with NLC 2,375.00 960.18 2,375.00 979.38 2,375.00 998.97
Total NLCs 11,287.00 4,195.08 12,890.42 4,879.09 12,890.42 4,976.67
NTPC Stations
6 Ramagundam I&II 4,050.00 1,187.87 4,050.00 1,211.63 4,050.00 1,235.86
7 Ramagundam III 1,095.00 357.09 967.10 321.69 967.10 328.12
8 Simhadri Stage II -Unit III 1,525.00 626.37 1,673.86 701.26 1,673.86 715.29
9 NTPC_TNEB JV Vallur 7,192.84 2,715.35 7,866.70 3,029.14 7,866.70 3,089.72
10 Talcher 3,810.00 819.43 3,925.37 851.72 3,925.37 869.15
11 NTPC ER 325.00 103.68 325.00 105.75 325.00 107.87
Total NTPC 17,997.84 5,809.79 18,808.04 6,221.19 18,808.04 6,346.01
Nuclear Stations
12 Madras APS 2,371.00 503.60 2,471.64 535.47 2,479.52 537.67
13 Kaiga APS 1,825.00 567.03 1,653.89 524.14 1,653.89 524.47
14 Kudankulam Unit I 3,776.54 1,491.72 3,776.54 1,491.72 3,776.54 1,492.10
15 Kudankulam Unit II 944.14 372.93 3,776.54 1,491.72 3,776.54 1,492.10
16 PFBR Kalppakam 458.00 178.62 1,170.34 456.43
Total Nuclear Stations 8,916.68 2,935.27 12,136.62 4,221.67 12,856.83 4,502.77
IPPs
17 Pillaiperumalnallur 159.18 346.98 159.18 353.92 159.18 361.00
18 TAQA (STCMS) 1,104.94 515.45 1,104.94 525.76 1,104.94 536.27
19 LANCO Power (Aban co) 793.31 292.98 793.40 298.88 793.31 304.82
20 PIONEER Power co. (Penna) 370.02 134.45 370.35 137.26 370.02 139.88
Total IPP 2,427.44 1,289.86 2,427.86 1,315.82 2,427.44 1,341.97
21 Windmill 6,944.49 2,263.90 6,149.52 2,044.84 6,346.62 2,152.59
22 Co-generation 970.00 399.64 970.44 407.82 970.44 415.97
23 Biomass 20.00 - 20.00 6.30 20.00 6.43
24 Captive generation 38.50 9.24 38.50 9.42 35.00 8.74
25 Solar 1,505.50 1,031.60 2,293.90 1,406.09 2,525.13 1,451.95
26 Traders-MTOA 1,840.40 554.33
27 Traders-LTOA 8,822.84 3,923.08 8,044.49 3,830.79 15,230.28 7,045.83
28 Traders -STOA 250.62 96.49
29Transmission - PGCIL, POSOCO,
STOA charges- 945.52 - 992.80 - 1,042.44
30 TANTRANSCO Charges 1,781.74 1,870.82 1,964.37
Grand Total 59,180.91 24,681.20 65,620.19 27,760.97 72,110.19 31,255.73
FY 2018-19S. No Name of Station
FY 2016-17 FY 2017-18
Petition for Final True-up for FY 2011-12 to FY 2015-16, ARR for FY 2017-18 to FY 2018-19
Page 88
4.26 Energy Availability for FY 2016-17 to FY 2018-19
4.26.1 TANGEDCO has projected energy availability for FY 2016-17 to FY 2018-19 based on the
energy sources available to TANGEDCO during the year, upcoming Central Generating
stations and the other sources with which it has tied up power during the respective year.
4.26.2 The following table shows the energy availability projected by TANGEDCO during FY 2016-17
to FY 2018-19.
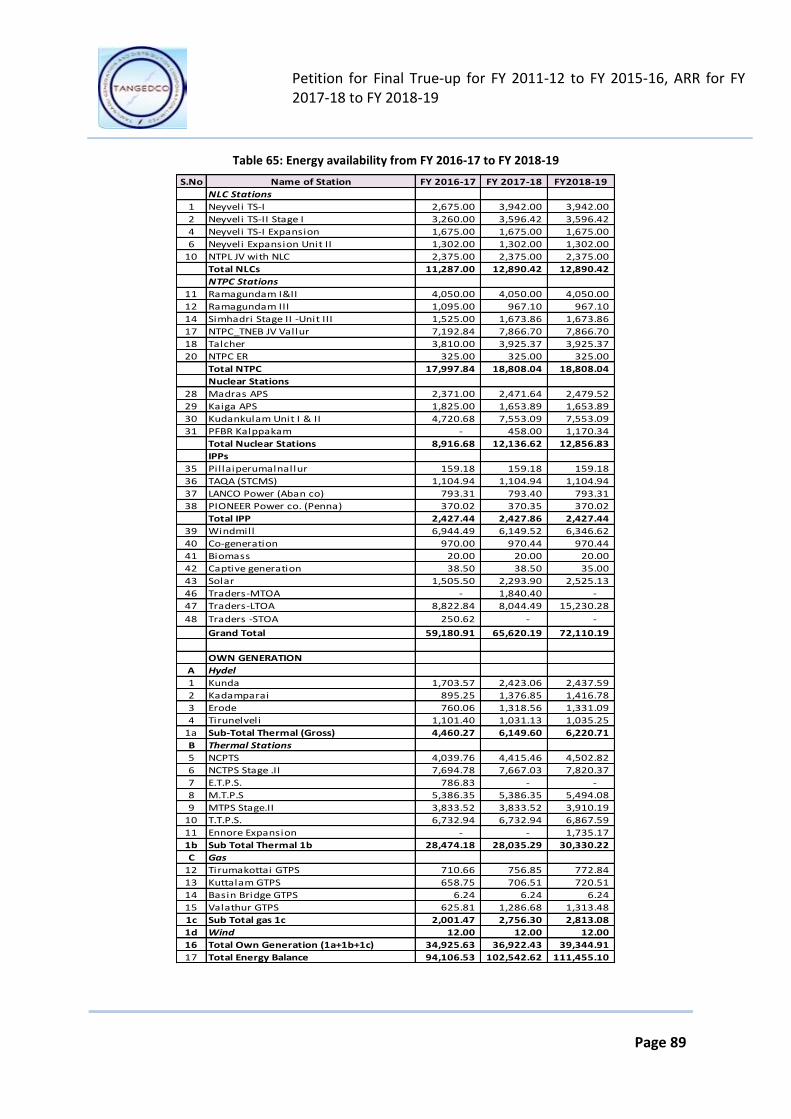
Petition for Final True-up for FY 2011-12 to FY 2015-16, ARR for FY 2017-18 to FY 2018-19
Page 89
Table 65: Energy availability from FY 2016-17 to FY 2018-19
S.No Name of Station FY 2016-17 FY 2017-18 FY2018-19
NLC Stations
1 Neyveli TS-I 2,675.00 3,942.00 3,942.00
2 Neyveli TS-II Stage I 3,260.00 3,596.42 3,596.42
4 Neyveli TS-I Expansion 1,675.00 1,675.00 1,675.00
6 Neyveli Expansion Unit II 1,302.00 1,302.00 1,302.00
10 NTPL JV with NLC 2,375.00 2,375.00 2,375.00
Total NLCs 11,287.00 12,890.42 12,890.42
NTPC Stations
11 Ramagundam I&II 4,050.00 4,050.00 4,050.00
12 Ramagundam III 1,095.00 967.10 967.10
14 Simhadri Stage II -Unit III 1,525.00 1,673.86 1,673.86
17 NTPC_TNEB JV Vallur 7,192.84 7,866.70 7,866.70
18 Talcher 3,810.00 3,925.37 3,925.37
20 NTPC ER 325.00 325.00 325.00
Total NTPC 17,997.84 18,808.04 18,808.04
Nuclear Stations
28 Madras APS 2,371.00 2,471.64 2,479.52
29 Kaiga APS 1,825.00 1,653.89 1,653.89
30 Kudankulam Unit I & II 4,720.68 7,553.09 7,553.09
31 PFBR Kalppakam - 458.00 1,170.34
Total Nuclear Stations 8,916.68 12,136.62 12,856.83
IPPs
35 Pillaiperumalnallur 159.18 159.18 159.18
36 TAQA (STCMS) 1,104.94 1,104.94 1,104.94
37 LANCO Power (Aban co) 793.31 793.40 793.31
38 PIONEER Power co. (Penna) 370.02 370.35 370.02
Total IPP 2,427.44 2,427.86 2,427.44
39 Windmill 6,944.49 6,149.52 6,346.62
40 Co-generation 970.00 970.44 970.44
41 Biomass 20.00 20.00 20.00
42 Captive generation 38.50 38.50 35.00
43 Solar 1,505.50 2,293.90 2,525.13
46 Traders-MTOA - 1,840.40 -
47 Traders-LTOA 8,822.84 8,044.49 15,230.28
48 Traders -STOA 250.62 - -
Grand Total 59,180.91 65,620.19 72,110.19
OWN GENERATION
A Hydel
1 Kunda 1,703.57 2,423.06 2,437.59
2 Kadamparai 895.25 1,376.85 1,416.78
3 Erode 760.06 1,318.56 1,331.09
4 Tirunelveli 1,101.40 1,031.13 1,035.25
1a Sub-Total Thermal (Gross) 4,460.27 6,149.60 6,220.71
B Thermal Stations
5 NCPTS 4,039.76 4,415.46 4,502.82
6 NCTPS Stage .II 7,694.78 7,667.03 7,820.37
7 E.T.P.S. 786.83 - -
8 M.T.P.S 5,386.35 5,386.35 5,494.08
9 MTPS Stage.II 3,833.52 3,833.52 3,910.19
10 T.T.P.S. 6,732.94 6,732.94 6,867.59
11 Ennore Expansion - - 1,735.17
1b Sub Total Thermal 1b 28,474.18 28,035.29 30,330.22
C Gas
12 Tirumakottai GTPS 710.66 756.85 772.84
13 Kuttalam GTPS 658.75 706.51 720.51
14 Basin Bridge GTPS 6.24 6.24 6.24
15 Valathur GTPS 625.81 1,286.68 1,313.48
1c Sub Total gas 1c 2,001.47 2,756.30 2,813.08
1d Wind 12.00 12.00 12.00
16 Total Own Generation (1a+1b+1c) 34,925.63 36,922.43 39,344.91
17 Total Energy Balance 94,106.53 102,542.62 111,455.10

Petition for Final True-up for FY 2011-12 to FY 2015-16, ARR for FY 2017-18 to FY 2018-19
Page 90
4.27 Energy Balance for FY 2016-17 to FY 2018-19
4.27.1 The following table shows the energy balance statement for FY 2016-17 to FY 2018-19
excluding wheeling units.
4.27.2 Based on the T&D loss and sales projected power purchase units are arrived by TANGEDCO.
Table 66: Energy Balance Statement for FY 2016-17 to FY 2018-19
S.No. Particulars Unit FY 2016-17 FY 2017-18 FY 2018-19
1 Total Demand/Sales as Projected in MU 74,872.45 83,059.93 90,612.78
2 Distribution Loss in MU 19,234.52 19,483.19 20,842.05
3 Distribution Loss Percentage in % 20.44% 19.00% 18.70%
4 Total Energy required to meet the demand in MU 94,106.97 102,543.12 111,454.83
5 Power Available from own Generation in MU 34,925.63 36,922.43 39,344.91
6 Power to be sourced from outside sources in MU 59,181.35 65,620.69 72,109.92
4.27.3 As seen from the above table energy required to meet the demand for FY 2016-17, FY 2017-
18 and FY 2018-19 based on the T&D loss considered is 94,106.97 MUs, 1,02,543.12 MUs
and 1,11,454.83 MUs respectively.
4.28 Merit Order Dispatch
4.28.1 TANGEDCO has applied Merit order dispatch for FY 2016-17 to FY 2018-19 and ranked all the
outside sources based on the increasing order of their variable cost per unit.
4.28.2 TANGEDCO has not considered merit order dispatch on its own generation and therefore
has considered entire power available from its own generation in power purchase cost.
4.28.3 Based on Merit Order dispatch, TANGEDCO has proposed power purchase from different
source for FY 2016-17 to FY 2018-19.

Petition for Final True-up for FY 2011-12 to FY 2015-16, ARR for FY 2017-18 to FY 2018-19
Page 91
4.29 Summarized ARR and Revenue Gap for FY 2016-17 to FY 2018-19
4.29.1 Based on the above discussion on variable and fixed cost component for generation and
distribution function of TANGEDCO, following is the table showing ARR and Revenue Gap
summary for FY 2016-17 to 2018-19
Table 67: Annual Revenue Requirement for FY 2016-17 to FY 2018-19
FY 2016-17 FY 2017-18 FY 2018-19
Projected Projected Projected
1 Expenses with respect to Generation (Variable Cost) 8,996.51 9,060.77 9,986.45
2 Expenses with respect to Generation (Fixed Cost) 8,925.24 6,773.89 7,607.59
3 Power Purchase Cost from Other Sources 22,899.46 25,890.14 29,291.36
4 Transmission Charges paid to TANTRANSCO 1,781.74 1,870.82 1,964.37
5 Net Operation & Maintenance Expenses 5,234.90 5,534.33 5,850.89
6 Depreciation 203.77 483.53 645.79
7 Interest & Finance Charges 3,807.19 3,345.74 3,945.15
8 Interest on Working Capital 238.13 235.23 351.19
9 Other Debits and Extra Ordinary Items 13.19 13.19 13.19
10 Net Prior Period Expenses/(Income) - - -
11 Less Cap of Cost of Generation during Trial Stage - - -
12 Sub Total 52,100.13 53,207.65 59,655.98
13 Return on Equity 582.32 609.62 609.62
14 Total Expenditure 52,682.46 53,817.27 60,265.60
15 Less: Non Tariff Income 780.86 952.65 971.70
16 Less: Other Income 434.73 586.89 704.27
17 Aggregate Revenue Requirement 51,466.87 52,277.74 58,589.63
18 Revenue from sale of power 36,050.50 40,942.42 45,329.26
19 Total Revenue before Subsidy 36,050.50 40,942.42 45,329.26
20 Subsidy 8,644.35 8,884.71 9,139.94
21 Other Govt. Subsidy (FRP bond takeover) 2,000.00 2,343.49 -
22 Total Revenue after Subsidy 46,694.85 52,170.62 54,469.20
23 Gap/(Surplus) 4,772.01 107.12 4,120.43
S. No. Particulars
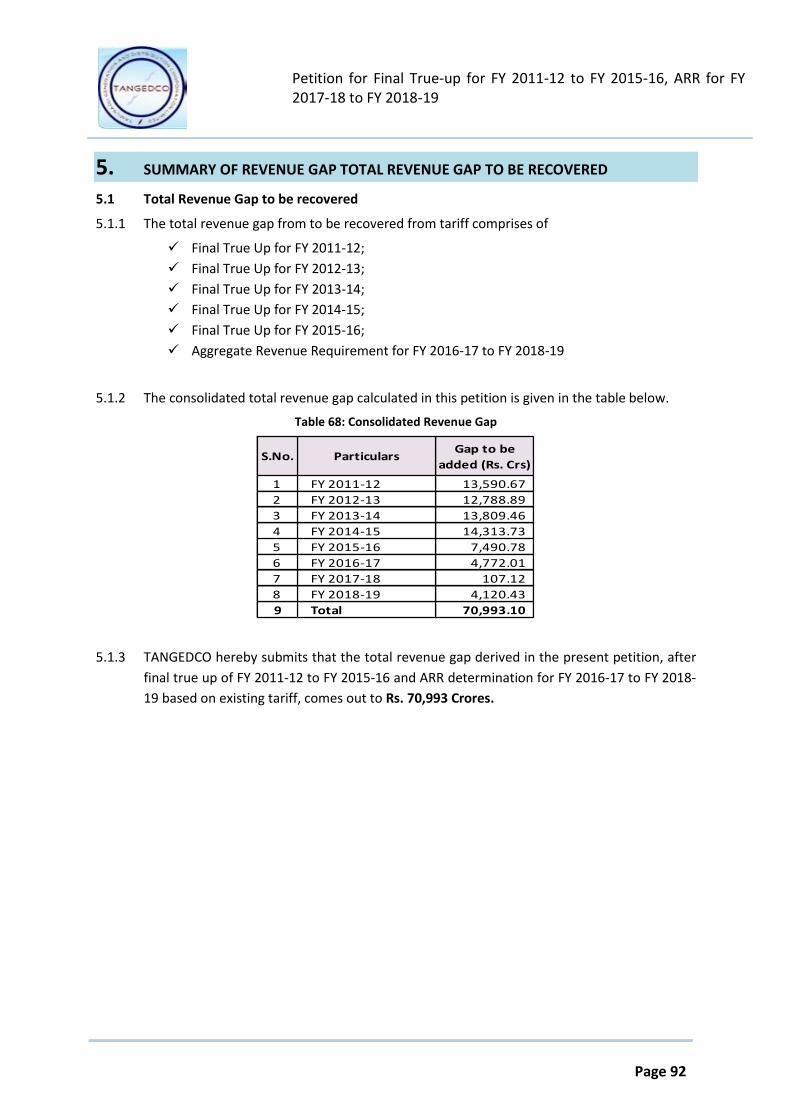
Petition for Final True-up for FY 2011-12 to FY 2015-16, ARR for FY 2017-18 to FY 2018-19
Page 92
5. SUMMARY OF REVENUE GAP TOTAL REVENUE GAP TO BE RECOVERED
5.1 Total Revenue Gap to be recovered
5.1.1 The total revenue gap from to be recovered from tariff comprises of
Final True Up for FY 2011-12;
Final True Up for FY 2012-13;
Final True Up for FY 2013-14;
Final True Up for FY 2014-15;
Final True Up for FY 2015-16;
Aggregate Revenue Requirement for FY 2016-17 to FY 2018-19
5.1.2 The consolidated total revenue gap calculated in this petition is given in the table below.
Table 68: Consolidated Revenue Gap
S.No. ParticularsGap to be
added (Rs. Crs)
1 FY 2011-12 13,590.67
2 FY 2012-13 12,788.89
3 FY 2013-14 13,809.46
4 FY 2014-15 14,313.73
5 FY 2015-16 7,490.78
6 FY 2016-17 4,772.01
7 FY 2017-18 107.12
8 FY 2018-19 4,120.43
9 Total 70,993.10
5.1.3 TANGEDCO hereby submits that the total revenue gap derived in the present petition, after
final true up of FY 2011-12 to FY 2015-16 and ARR determination for FY 2016-17 to FY 2018-
19 based on existing tariff, comes out to Rs. 70,993 Crores.
Petition for Final True-up for FY 2011-12 to FY 2015-16, ARR for FY 2017-18 to FY 2018-19
Page 93
6. PRAYERS
6.1 TANGEDCO respectfully prays to the Hon'ble Commission:
6.1.1 To admit the petition seeking Final True up of FY 2011-12 to FY 2015-16 and determination
of Aggregate Revenue Requirement for FY 2016-17 to FY 2018-19 as per the provisions of
TNERC (Terms and Conditions of Tariff) Regulations, 2005 and MYT Regulations, 2009;
6.1.2 To approve the total recovery of Final True up of FY 2011-12 to FY 2015-16 and Aggregate
Revenue Requirement for FY 2016-17 to FY 2018-19 and other claims as proposed by
TANGEDCO.
6.1.3 To allow TANGEDCO to make claim in the present petition as per notification of the Final
Transfer Scheme, 2015.
6.1.4 To allow recovering the additional charges in case of any variation in the fixed cost of the
Central Government Power Stations as approved by CERC in line with the CERC (Terms &
Conditions of Tariff) Regulations, 2014-19.
6.1.5 To grant any other relief as the Hon'ble Commission may consider appropriate.
6.1.6 To pass any other order as the Hon’ble Commission may deem fit and appropriate under the
circumstances of the case and in the interest of justice.
6.1.7 To condone any error/omission and to give opportunity to rectify the same.
6.1.8 To permit the Petitioner to make further submissions, addition and alteration to this Petition
as may be necessary from time to time.