Beam Diagnostics Lecture 1.ppt - CERN · Beam Diagnostics Lecture 1 Ulrich Raich CERN AB - BI (B I...
57
Beam Diagnostics Lecture 1 Ulrich Raich CERN AB - BI (B I t t ti ) (Beam Instrumentation) U. Raich CAS Frascati 2008 Beam Diagnostics 1
-
Upload
duongnguyet -
Category
Documents
-
view
224 -
download
0
Transcript of Beam Diagnostics Lecture 1.ppt - CERN · Beam Diagnostics Lecture 1 Ulrich Raich CERN AB - BI (B I...

Beam DiagnosticsgLecture 1
Ulrich RaichCERN AB - BI
(B I t t ti )(Beam Instrumentation)
U. Raich CAS Frascati 2008Beam Diagnostics
1

Overview
• First hour: Introduction– Introduction
– Overview of measurement instruments• Faraday Cupy p• Beam Current Transformer• Beam Position Monitor• Profile Detectors• Profile Detectors
– SEMGrids– Wire Scanners
• Beam Loss Monitors
• Second hour– Some depicted examples of beam parameter measurements
U. Raich CAS Frascati 2008Beam Diagnostics
2
– Some depicted examples of beam parameter measurements
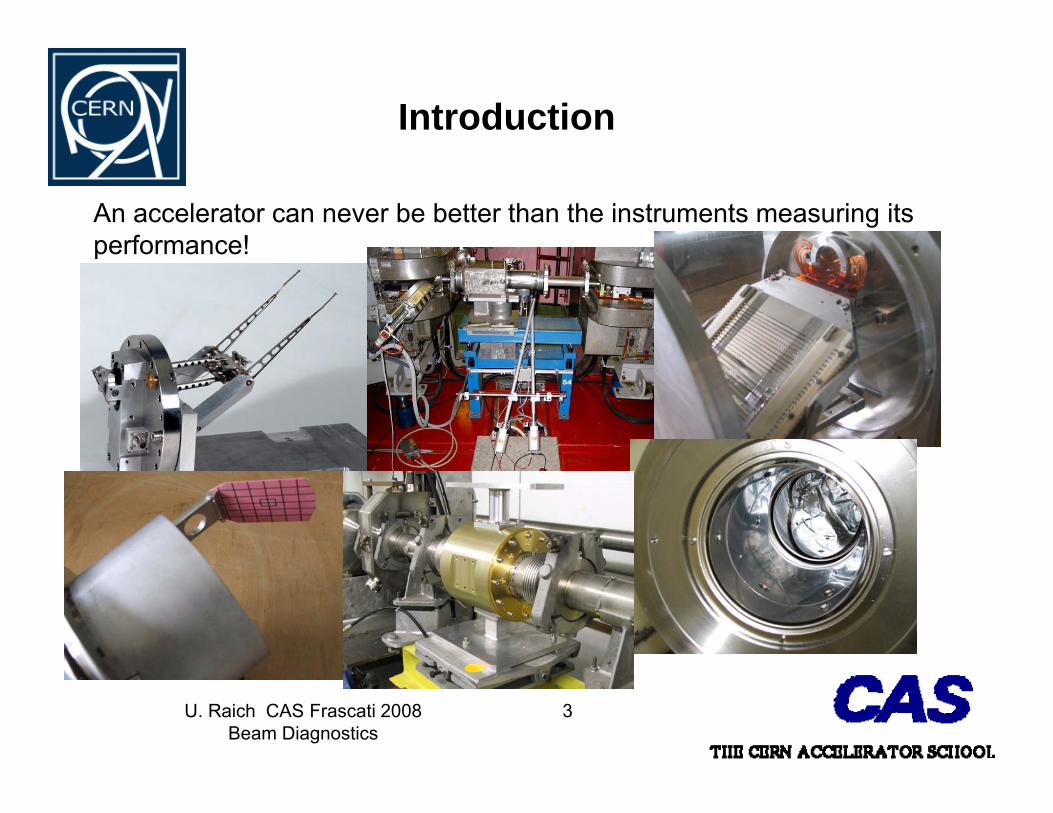
Introduction
An accelerator can never be better than the instruments measuring its performance!performance!
U. Raich CAS Frascati 2008Beam Diagnostics
3

Different uses of beam diagnostics
Regular crude checks of accelerator performanceBeam Intensity– Beam Intensity
– Radiation levelsStandard regular measurementsStandard regular measurements– Emittance measurement– Trajectories– Tune
Sophisticated measurements e.g. during machine d l t idevelopment sessions– May require offline evaluation– May be less comfortable
U. Raich CAS Frascati 2008Beam Diagnostics
4
– May be less comfortable

Diagnostic devices and quantity measured
Instrument Physical Effect Measured Quantity Effect on beamFaraday Cup Charge collection Intensity DestructiveCurrent Transformer
Magnetic field Intensity Non destructive
Wall current monitor
Image Current IntensityLongitudinal beam shape
Non destructive
Pick-up Electric/magnetic field
Position Non destructive
Secondary emission monitor
Secondary electron emission
Transverse size/shape, emittance
Disturbing, can be destructive at lowemission monitor emission emittance destructive at low energies
Wire Scanner Secondary particle creation
Transverse size/shape Slightly disturbing
Scintillator screen Atomic excitation Transverse size/shape DestructiveScintillator screen Atomic excitation with light emission
Transverse size/shape (position)
Destructive
Residual Gas monitor
Ionization Transverse size/shape Non destructive
U. Raich CAS Frascati 2008Beam Diagnostics
5
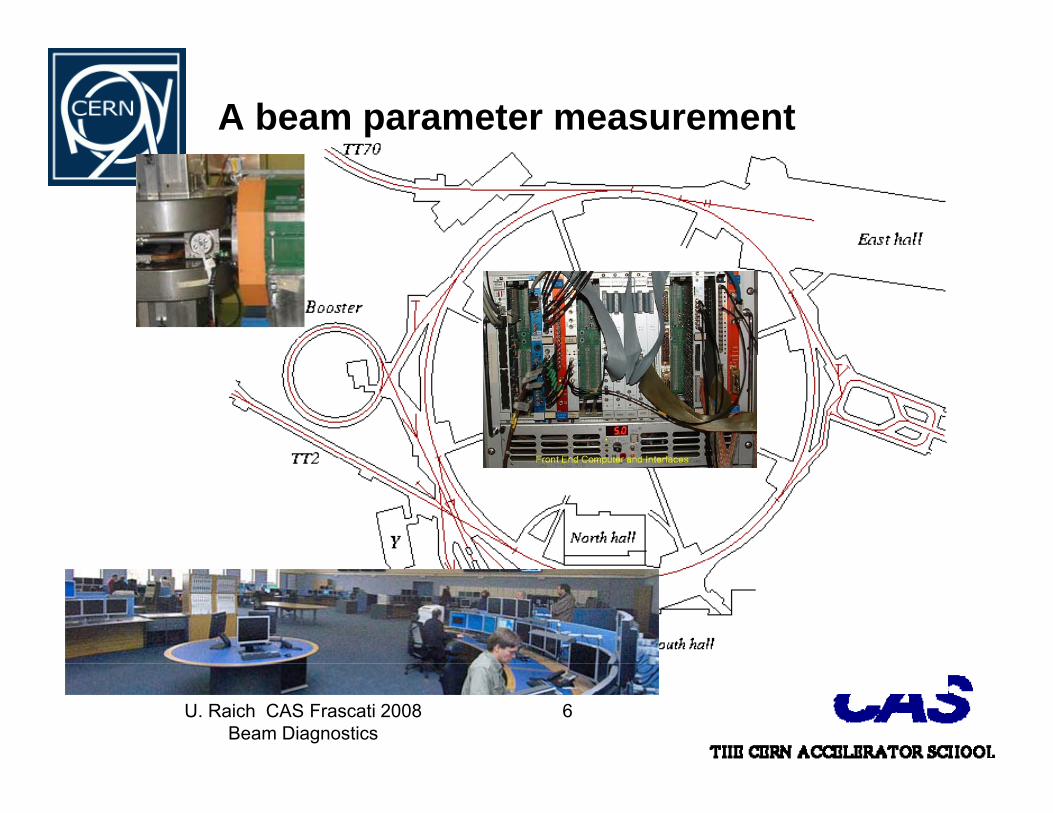
A beam parameter measurement
U. Raich CAS Frascati 2008Beam Diagnostics
6
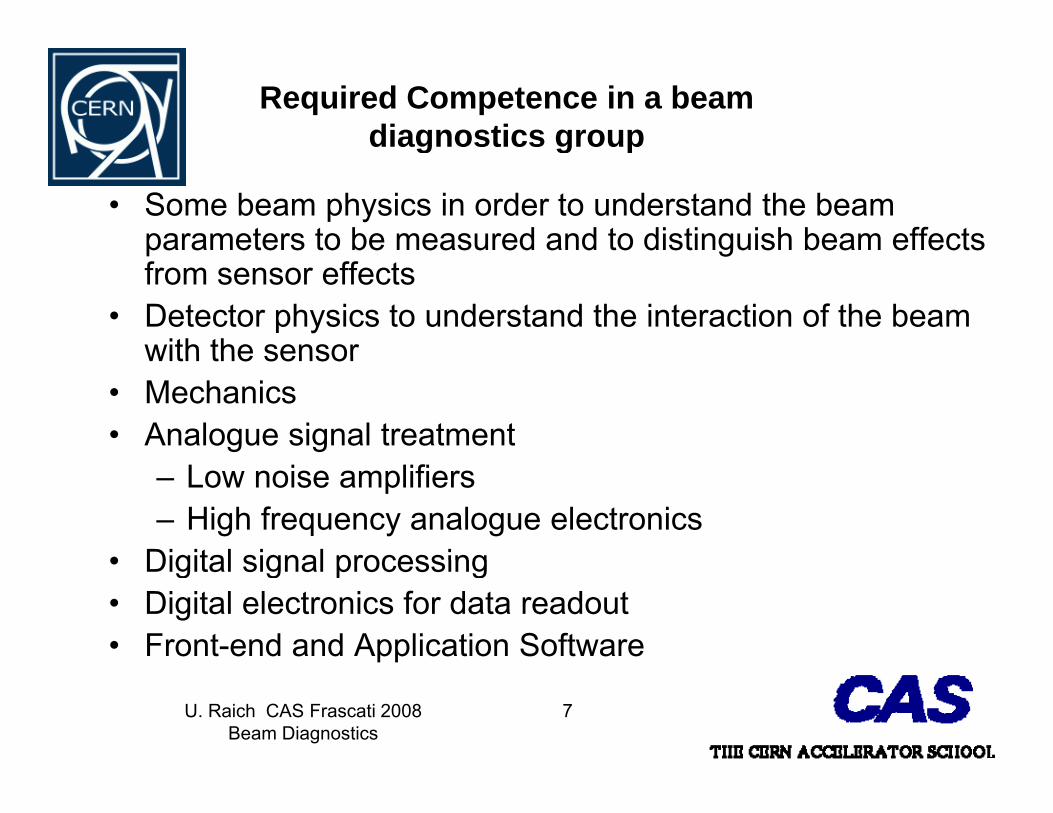
Required Competence in a beam diagnostics groupg g p
• Some beam physics in order to understand the beam parameters to be measured and to distinguish beam effects p gfrom sensor effects
• Detector physics to understand the interaction of the beam with the sensorwith the sensor
• Mechanics• Analogue signal treatment
– Low noise amplifiers– High frequency analogue electronics
• Digital signal processing• Digital signal processing• Digital electronics for data readout• Front-end and Application Software
U. Raich CAS Frascati 2008Beam Diagnostics
7
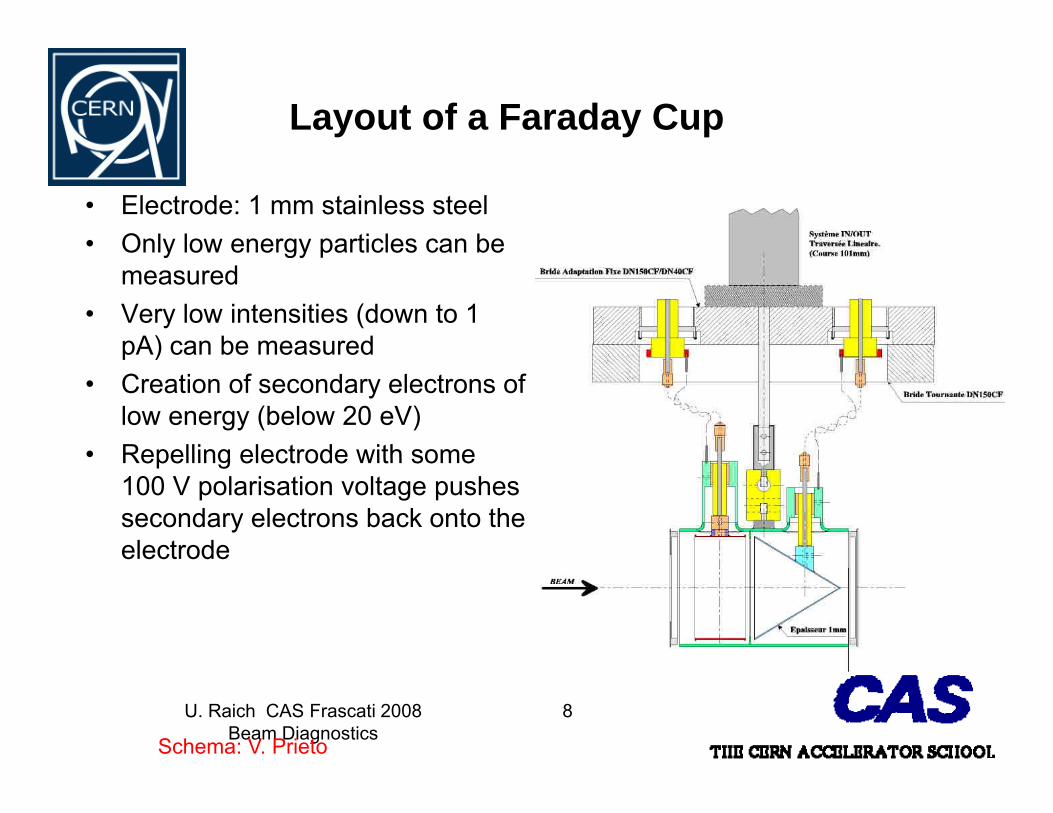
Layout of a Faraday Cup
• Electrode: 1 mm stainless steel• Only low energy particles can be y gy p
measured• Very low intensities (down to 1
pA) can be measuredp )• Creation of secondary electrons of
low energy (below 20 eV) • Repelling electrode with someRepelling electrode with some
100 V polarisation voltage pushes secondary electrons back onto the electrode
U. Raich CAS Frascati 2008Beam Diagnostics
8
Schema: V. Prieto
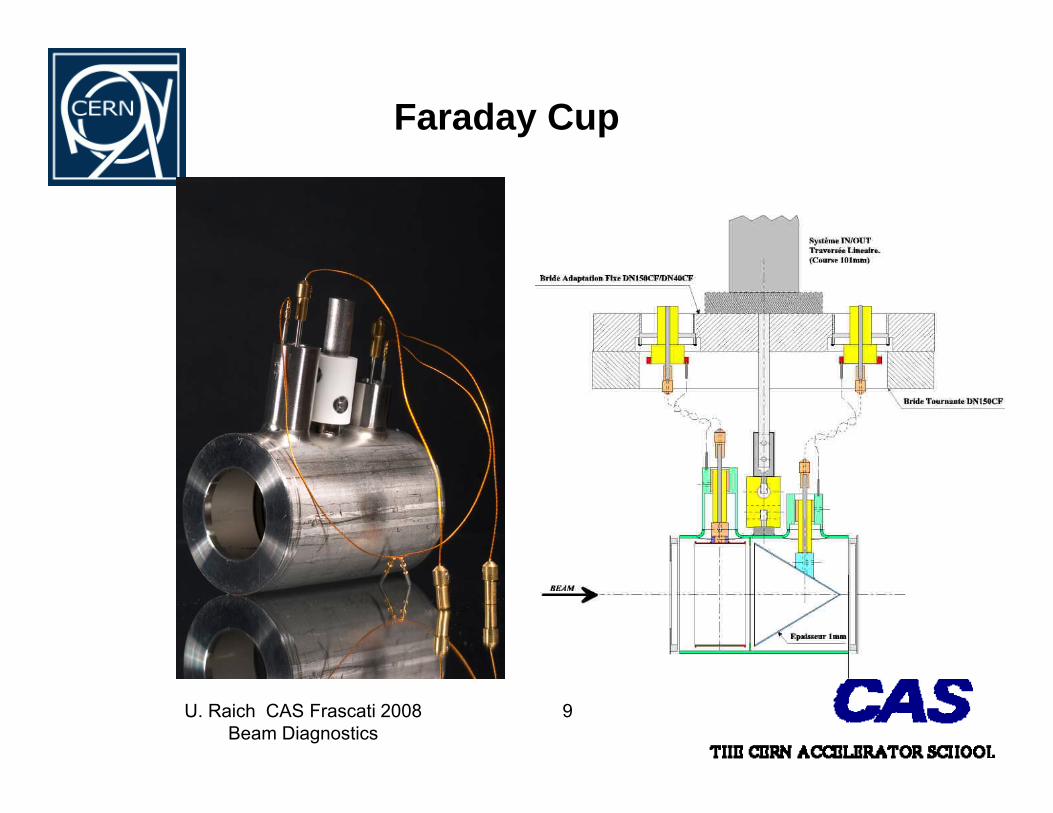
Faraday Cup
U. Raich CAS Frascati 2008Beam Diagnostics
9
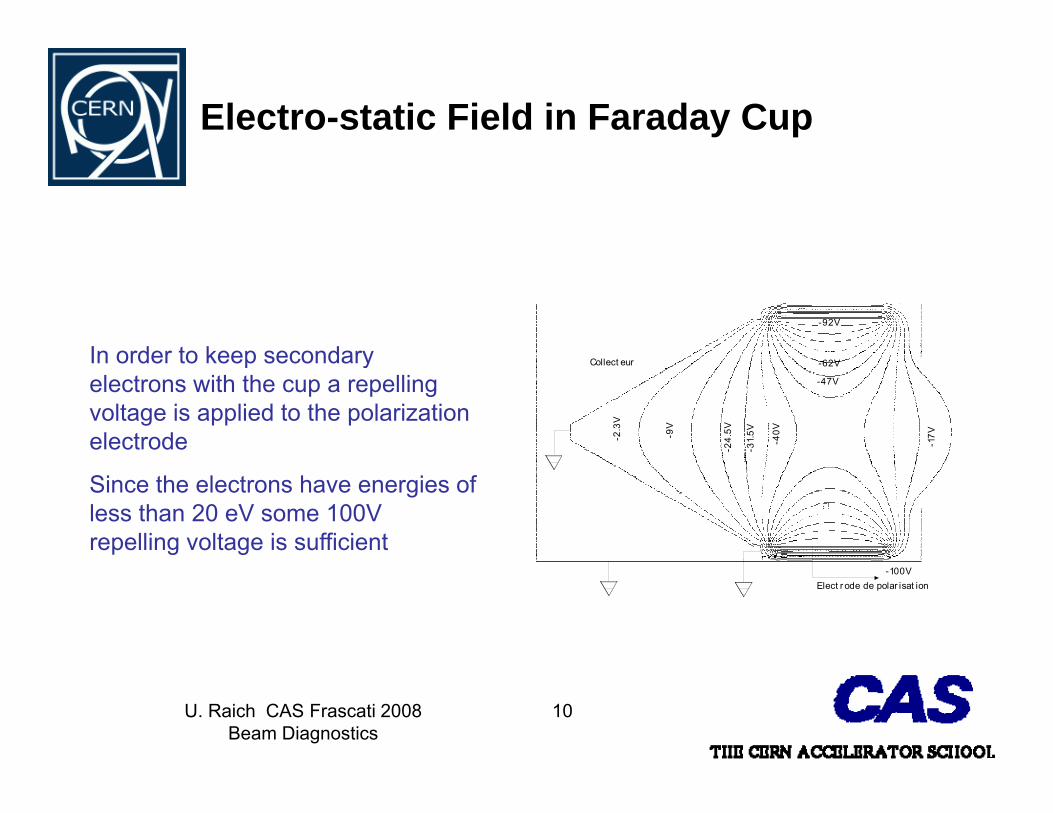
Electro-static Field in Faraday Cup
-92V
In order to keep secondary Collect eur
-2.3
V
-9V
-24.
5V
-31.
5V
-40V
-17V
-47V
-62VIn order to keep secondary electrons with the cup a repelling voltage is applied to the polarization electrode
Since the electrons have energies of less than 20 eV some 100Vrepelling voltage is sufficient
Elect r ode de polar isat ion-100V
U. Raich CAS Frascati 2008Beam Diagnostics
10
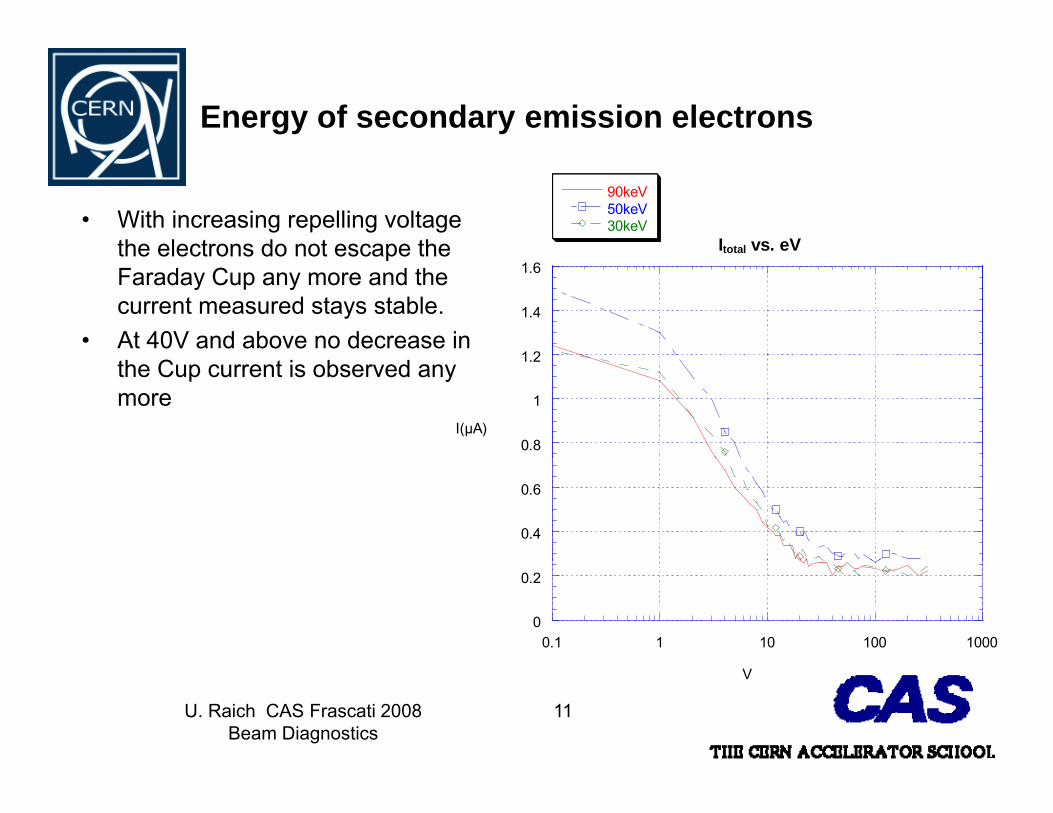
Energy of secondary emission electrons
• With increasing repelling voltage the electrons do not escape the Itotal vs. eV
90keV50keV30keV
the electrons do not escape the Faraday Cup any more and the current measured stays stable.
• At 40V and above no decrease in 1 2
1.4
1.6total
the Cup current is observed any more
0.8
1
1.2
I(µA)
0.4
0.6
0
0.2
0.1 1 10 100 1000
U. Raich CAS Frascati 2008Beam Diagnostics
11
V

Faraday Cup with water cooling
For higher intensitiesFor higher intensities water cooling may be needed
U. Raich CAS Frascati 2008Beam Diagnostics
12
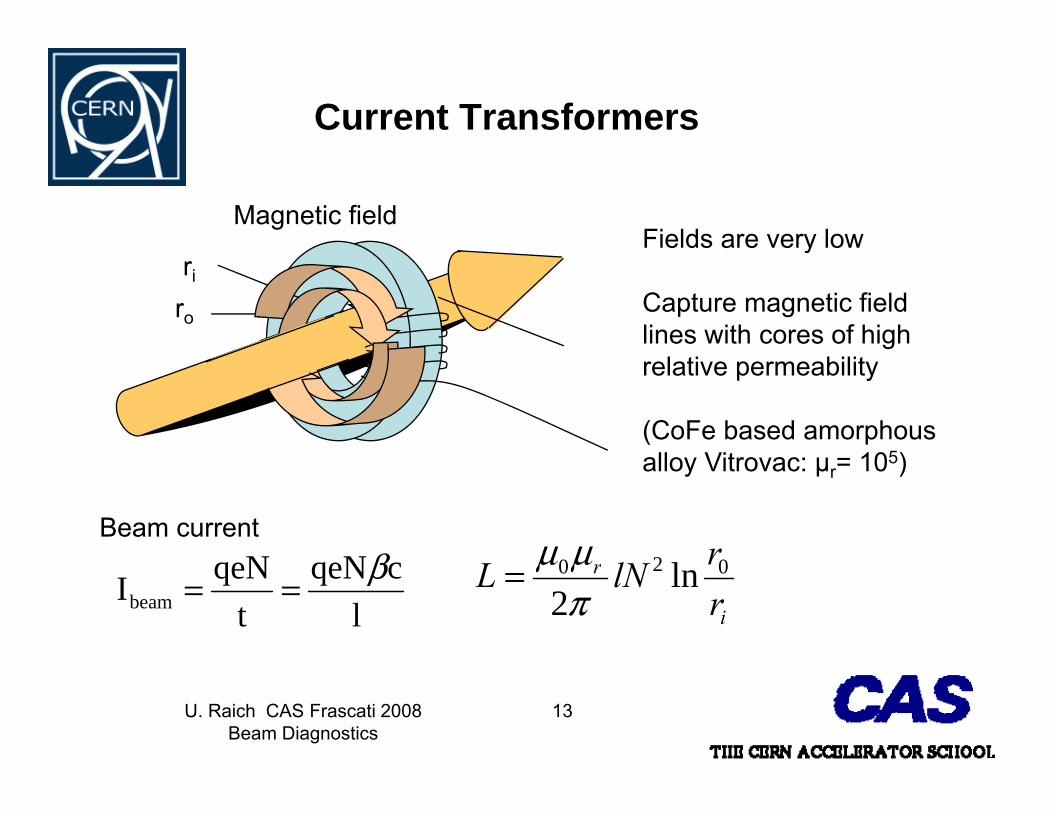
Current Transformers
Magnetic fieldFields are very low
ri
ro
y
Capture magnetic field lines with cores of highrelative permeability
(CoFe based amorphous alloy Vitrovac: μ = 105)
Beam currentNN β r020μμ
alloy Vitrovac: μr= 105)
lcqeN
tqeNIbeam
β==i
r
rrlNL 020 ln
2πμμ=
U. Raich CAS Frascati 2008Beam Diagnostics
13
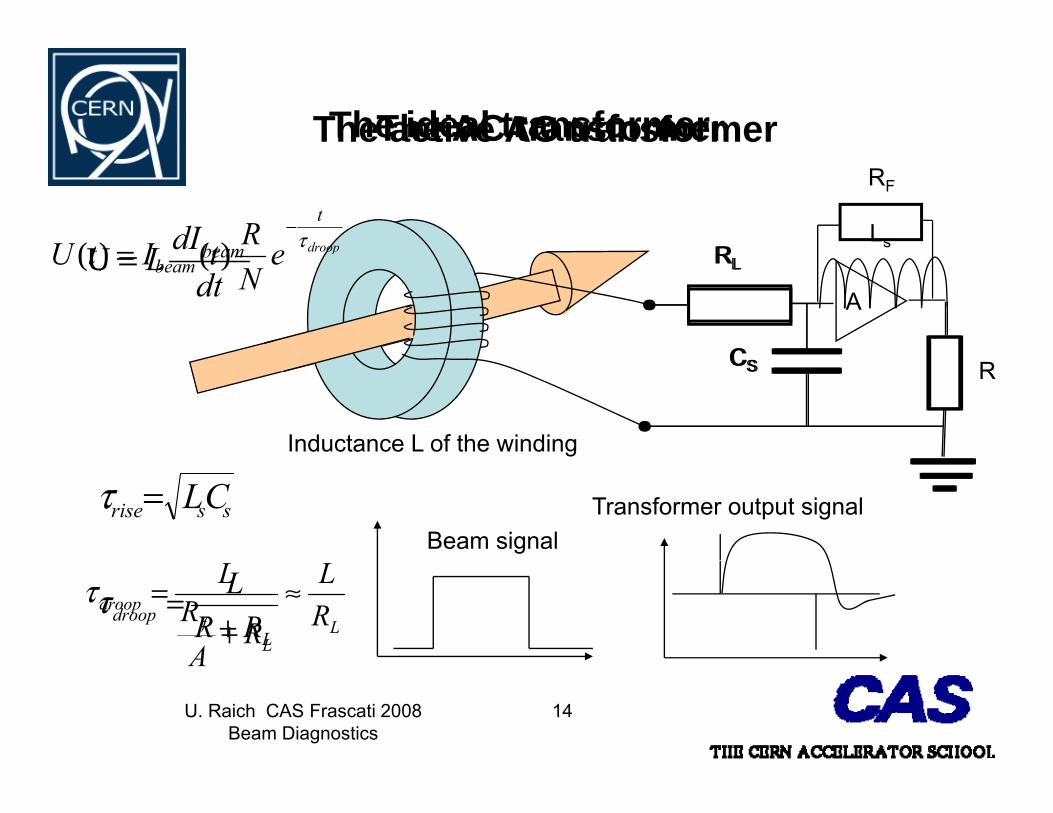
The ideal transformerThe AC transformerThe active AC transformer
dIL beamU droop
t
eRtItU τ−
= )()(
RF
RLs
Rdt
L beam=U pbeam e
NtItU = )()( RL
C
A
RL
C
Inductance L of the winding
CSCS R
Beam signalTransformer output signalssrise CL=τ
Ldroop RR
L+
=τL
Lf
droop RL
RA
RL ≈+
=τ
U. Raich CAS Frascati 2008Beam Diagnostics
14
A
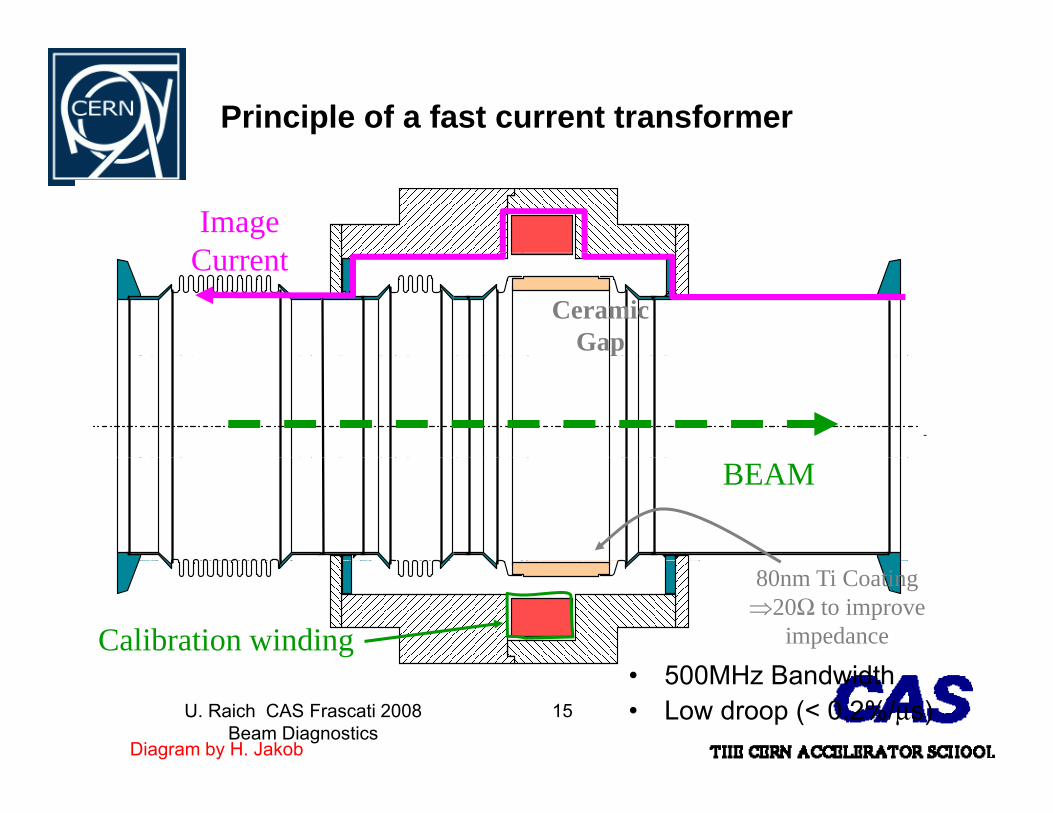
Principle of a fast current transformer
ImageC tCurrent
Ceramic Gapp
BEAM
Calibration winding
80nm Ti Coating⇒20Ω to improve
impedance
U. Raich CAS Frascati 2008Beam Diagnostics
15
Diagram by H. Jakob
• 500MHz Bandwidth• Low droop (< 0.2%/μs)

Fast current transformers for the LHC
U. Raich CAS Frascati 2008Beam Diagnostics
16
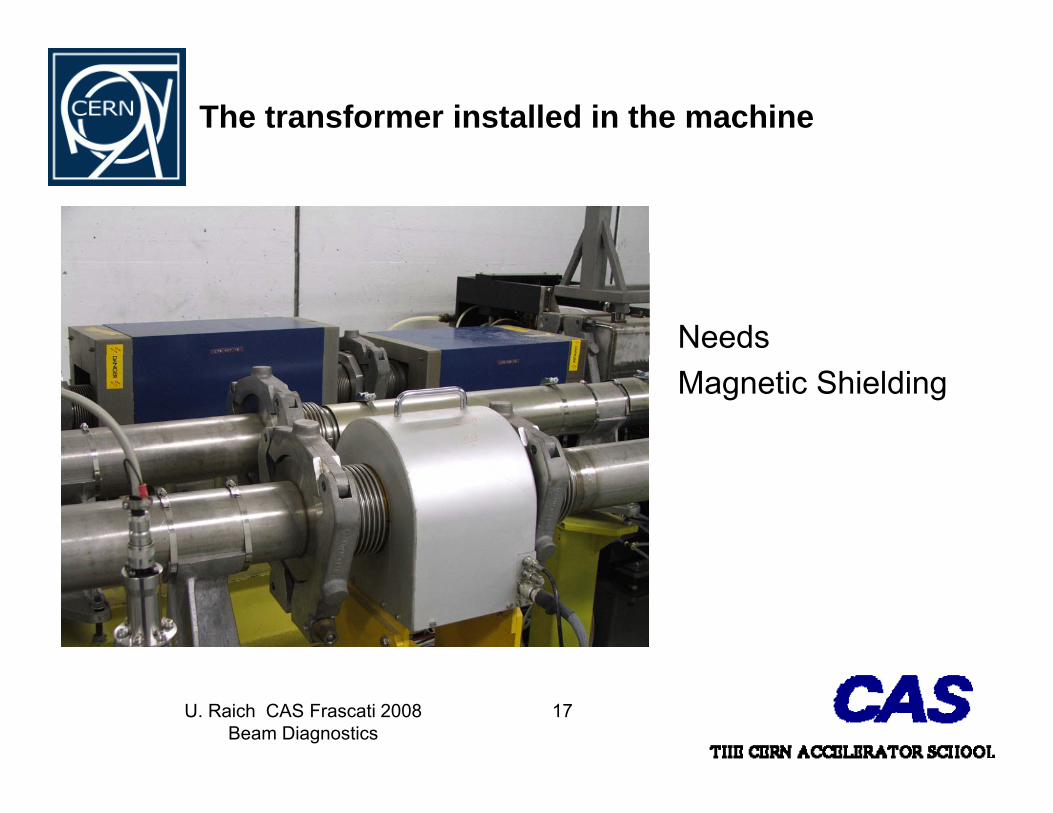
The transformer installed in the machine
NeedsMagnetic Shielding
U. Raich CAS Frascati 2008Beam Diagnostics
17
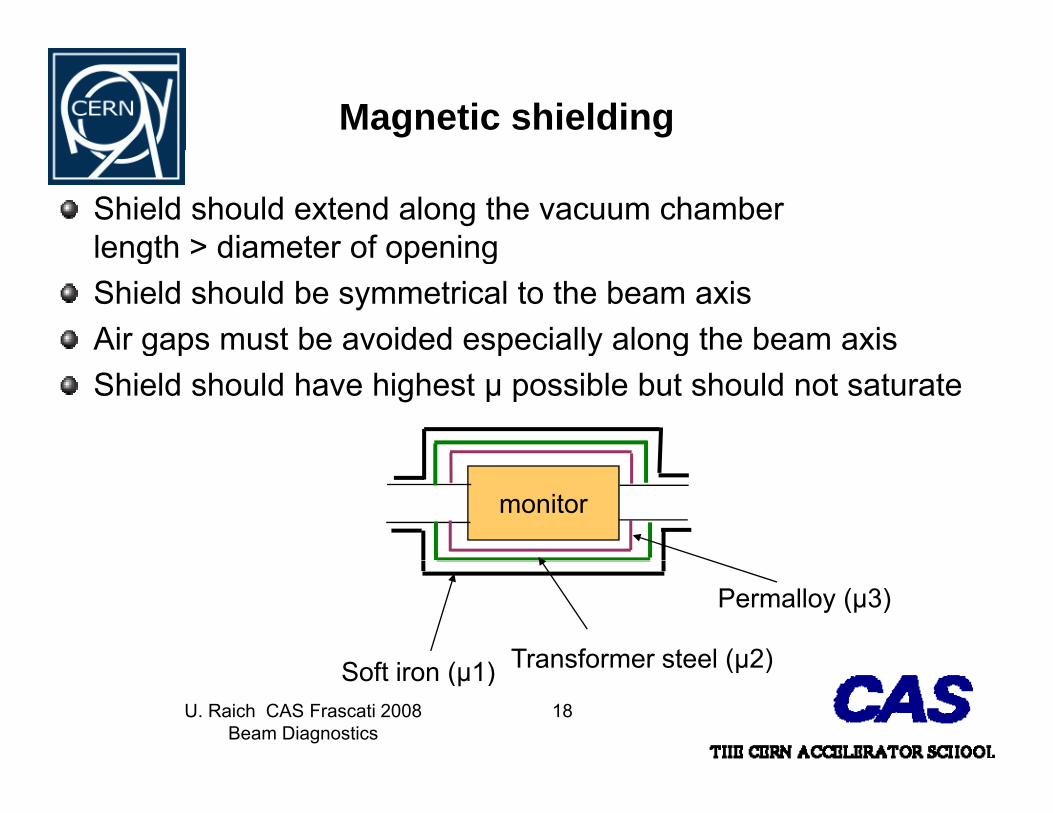
Magnetic shielding
Shield should extend along the vacuum chamber length > diameter of openinglength > diameter of openingShield should be symmetrical to the beam axisAir gaps must be avoided especially along the beam axisg p p y gShield should have highest μ possible but should not saturate
monitor
S ft i ( 1) Transformer steel (μ2)
Permalloy (μ3)
U. Raich CAS Frascati 2008Beam Diagnostics
18
Soft iron (μ1) Transformer steel (μ2)
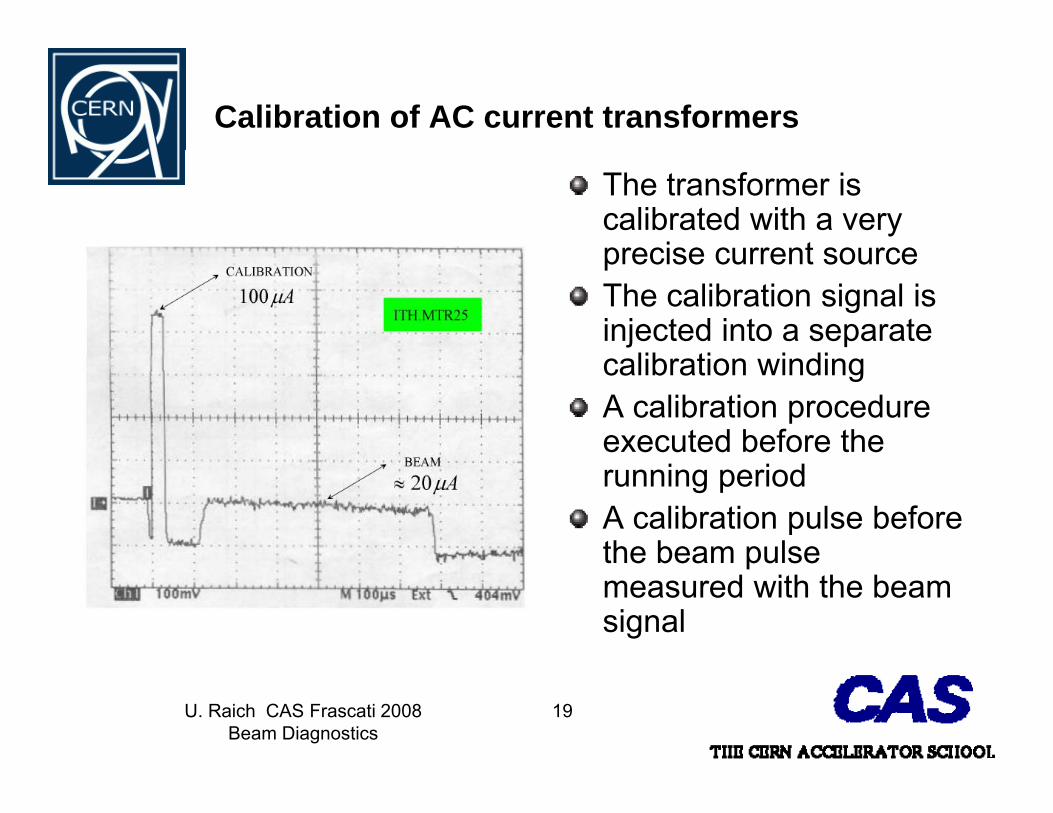
Calibration of AC current transformers
The transformer is calibrated with a very precise current sourceprecise current sourceThe calibration signal is injected into a separate
lib ti i dicalibration windingA calibration procedure executed before the running periodA calibration pulse before the beam pulsethe beam pulse measured with the beam signal
U. Raich CAS Frascati 2008Beam Diagnostics
19
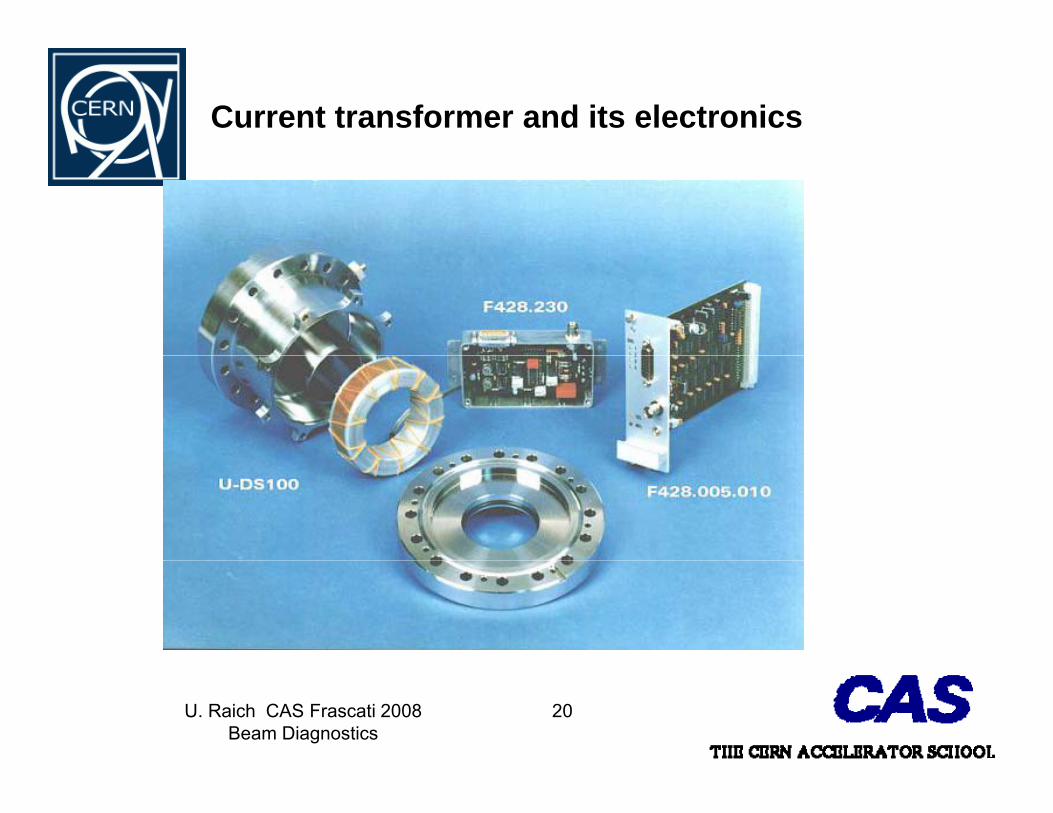
Current transformer and its electronics
U. Raich CAS Frascati 2008Beam Diagnostics
20

Display of transformer readings
Transformers ina transfer lineCalculated lossestrigger a watchdogDisplay distributed via video signal
U. Raich CAS Frascati 2008Beam Diagnostics
21

The DC current transformer
AC current transformer can be extended to very long droop times but not to DCMeasuring DC currents is needed in storage ringsMust provide a modulation frequencyTakes advantage of non/linear magnetisation curve
B
H
U. Raich CAS Frascati 2008Beam Diagnostics
22

Principle of DCCTV V
Synchronousdetector
Va-Vb
VVa
modulatorPower supply
Vb
beam
pp y
Compensationcurrent Ifeedback=-IbeamV=RIbeam
R
U. Raich CAS Frascati 2008Beam Diagnostics
23
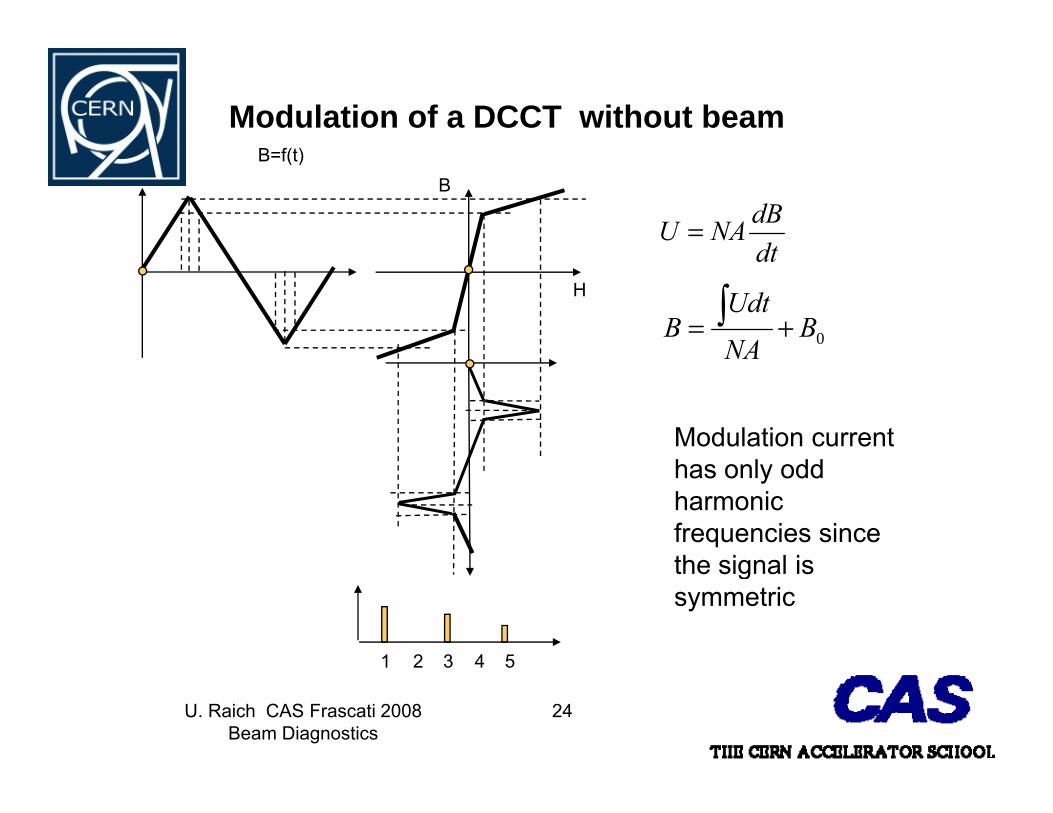
Modulation of a DCCT without beamB f(t)B=f(t)
B
dtdBNAU =
H
dt
0BNA
UdtB += ∫
Modulation current
NA
has only odd harmonic frequencies since the signal is
1 2 53 4
the signal is symmetric
U. Raich CAS Frascati 2008Beam Diagnostics
24
1 2 53 4
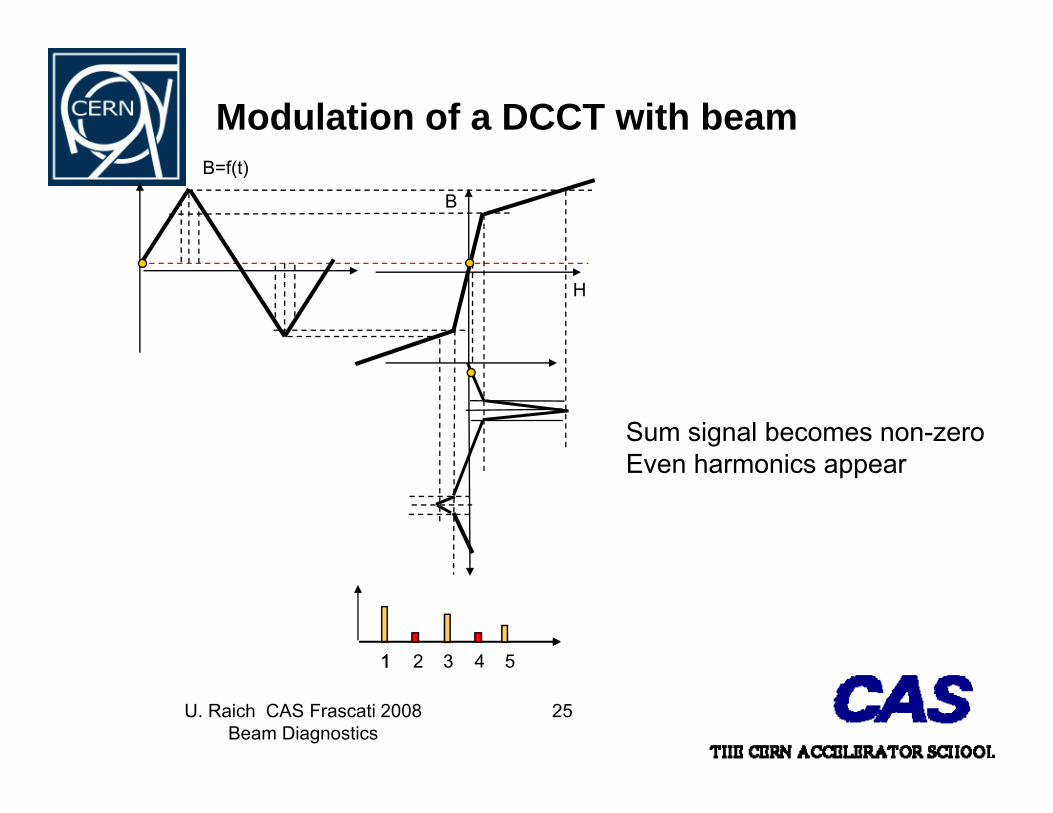
Modulation of a DCCT with beamB=f(t)
B
H
Sum signal becomes non-zeroE h iEven harmonics appear
11 2 53 4
U. Raich CAS Frascati 2008Beam Diagnostics
25
11 2 53 4

Modulation current difference signal with beam
• Difference signal has 2ωm
• ωm typically 200 Hz – 10 kHz• Use low pass filter with
ωc<<ωm
Provide a 3rd core normal• Provide a 3rd core, normal AC transformer to extend to higher frequencies
U. Raich CAS Frascati 2008Beam Diagnostics
26

Photo of DCCT internals
U. Raich CAS Frascati 2008Beam Diagnostics
27

Measuring Beam Position – The Principle
-- - - -+
+ + ++- +
+ +- -+ -++-
- +-- +
+- + -
- -- - - -+
+ + ++- +
+ +- -+ -++-
- +-- +
+- + -
- -- - - -+
+ ++- +
+ +- -+ -++-
- +-- +
+-
U. Raich CAS Frascati 2008Beam Diagnostics
28Slide by R. Jones

Wall Current Monitor – The Principle
V
-- - - -+
+ + ++- +
+ +- -+ -++-
- +-- +
+- + -
- +-
- -- - - -+
+ ++- +
+ +- -+ -++-
- +-- +
+-Ceramic Insert
U. Raich CAS Frascati 2008Beam Diagnostics
29
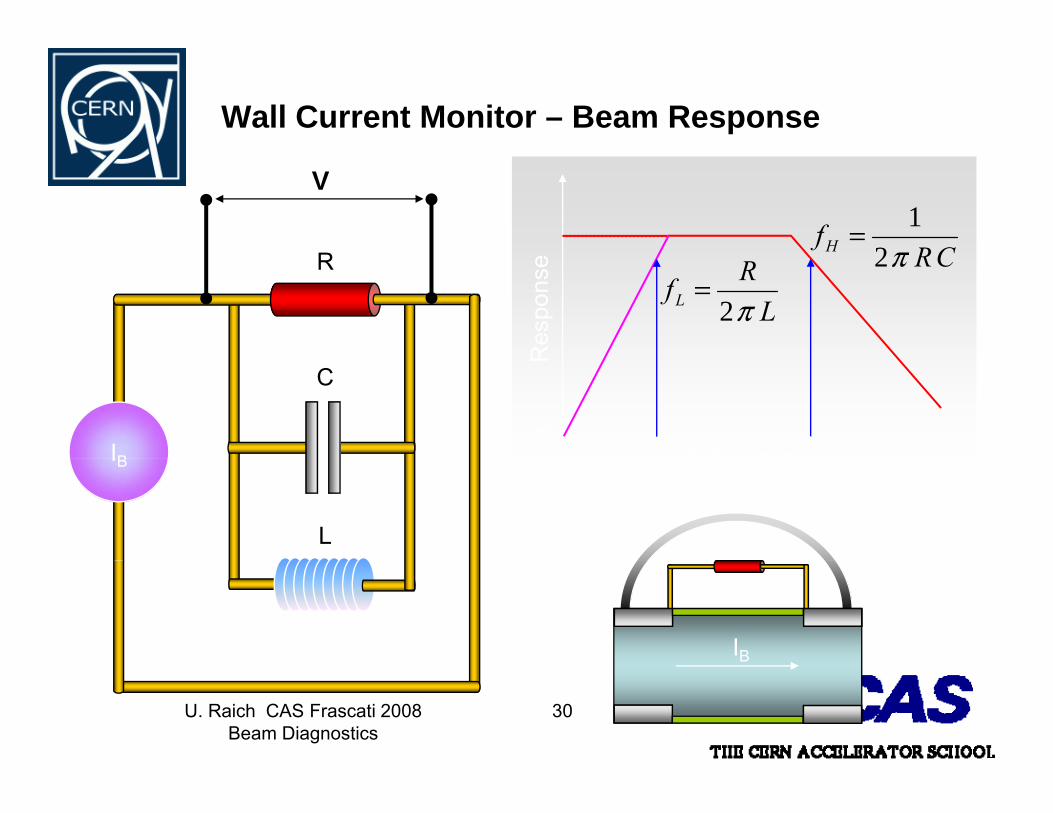
Wall Current Monitor – Beam Response
V
R CRfH π2
1=R
Res
pons
e CRπ2
LRfL π2
=
IB
C
Frequency
R
00
L
IB Frequency0
IB
U. Raich CAS Frascati 2008Beam Diagnostics
30

Electrostatic Monitor – The Principle
V
-- - - -+
+ + ++- +
+ +- -+ -++-
- +-- +
+- + -
-- - - - -+ +
++- ++ +- -+ -+ +- -+ -+ -
- -- - - -+
+ ++- +
+ +- -+ -++-
- +-- +
+-+-- - - - - - -
U. Raich CAS Frascati 2008Beam Diagnostics
31

Electrostatic Monitor – Beam Response
C V)
1
espo
nse
(V
CRf L π2
1=
VB V Frequency (Hz)
Re
00
VB VRFrequency (Hz)0
U. Raich CAS Frascati 2008Beam Diagnostics
32

Position measurements
wU
U
Ud
dd
If the beam is much smaller than w, all field lines are captured andU is a linear function with replacementelse: Linear cut (projection to measurement plane must be linear)
U. Raich CAS Frascati 2008Beam Diagnostics
33
(p j p )
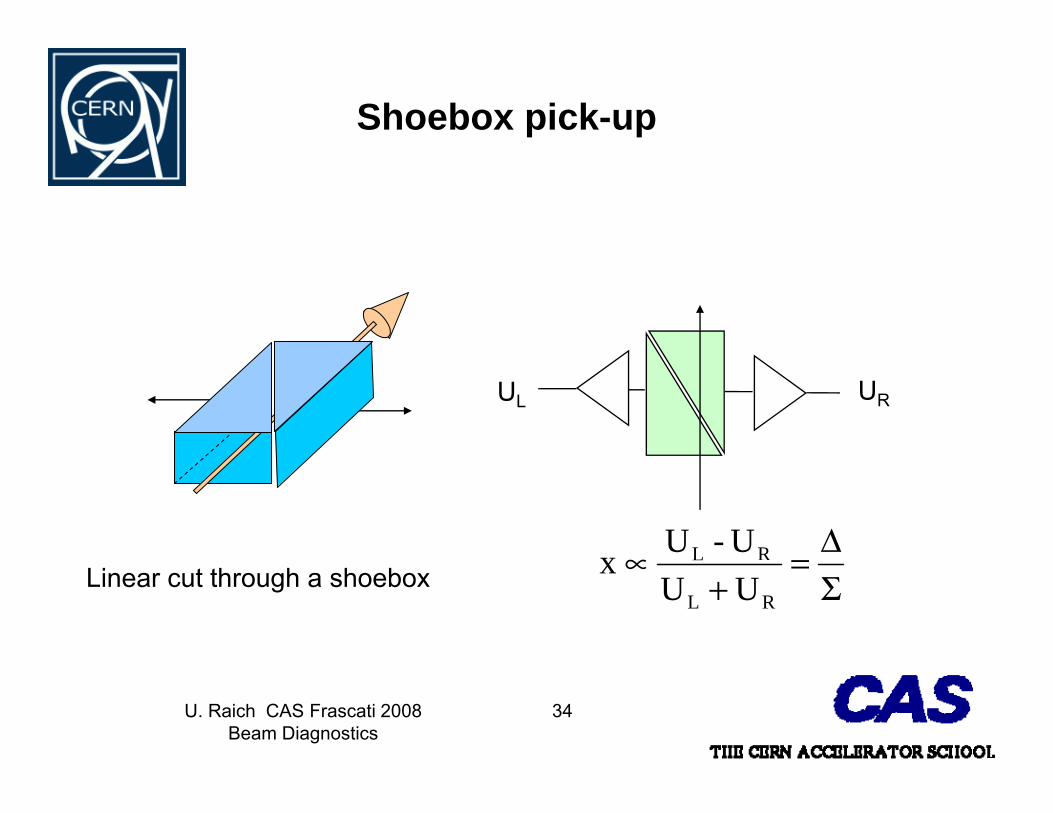
Shoebox pick-up
UL UR
Δ=∝ RL U-UxLinear cut through a shoebox Σ=
+∝
RL UUx
U. Raich CAS Frascati 2008Beam Diagnostics
34

Doubly cut shoebox
• Can measure horizontal and vertical position at once• Has 4 electrodes• Has 4 electrodes
ab
cdd
U. Raich CAS Frascati 2008Beam Diagnostics
35
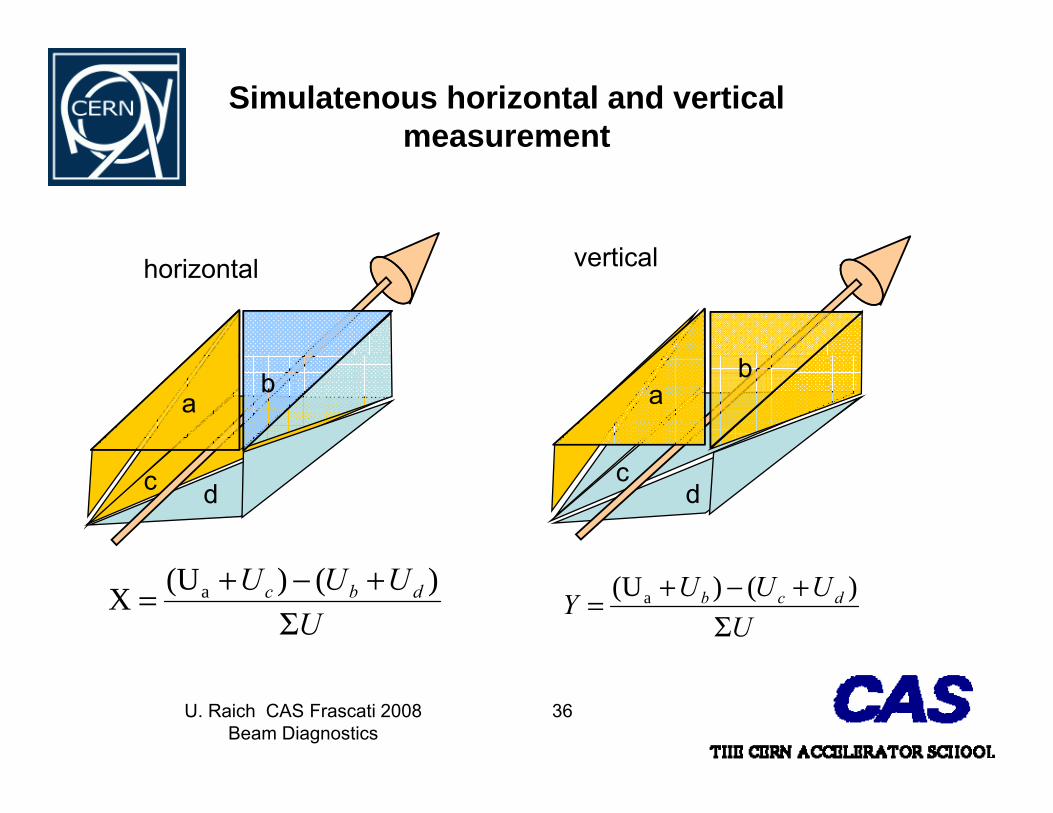
Simulatenous horizontal and vertical measurement
verticalhorizontal vertical
ab a
b
c dc
d
UUUU dbc
Σ+−+= )()(UX a
UUUUY dcb
Σ+−+= )()(Ua
U. Raich CAS Frascati 2008Beam Diagnostics
36

Interaction of particles with matter
Coulomb interactionAverage force in s-direction=0Average force in s-direction=0Average force in transverse direction <> 0
s
b
Beam particle
Mostly large impact parameter => low energy of ejected electron
Atomic shell electronF
electronElectron mostly ejection transversely to the particle motion
U. Raich CAS Frascati 2008Beam Diagnostics
37
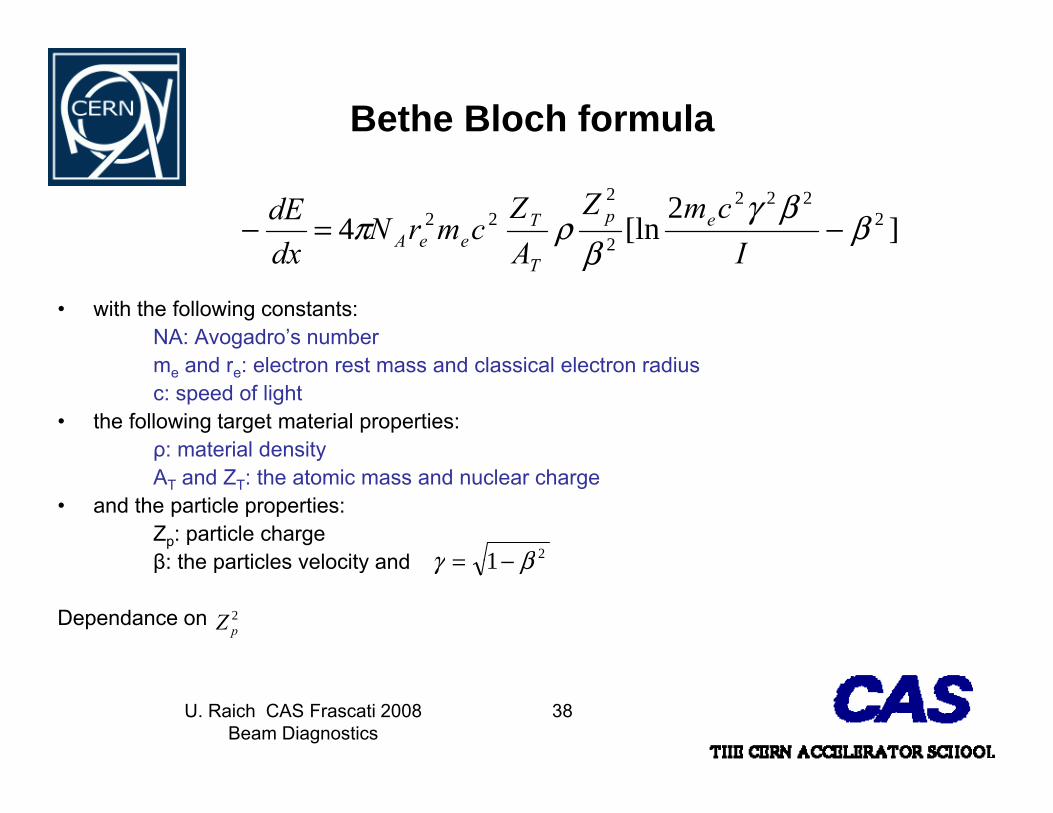
Bethe Bloch formula
]2
[ln4 2222
2
222 ββγ
βρπ −=−
IcmZ
AZ
cmrNdxdE epT
eeA
• with the following constants:NA: Avogadro’s number
β IAdx T
me and re: electron rest mass and classical electron radiusc: speed of light
• the following target material properties:ρ: material densityρ yAT and ZT: the atomic mass and nuclear charge
• and the particle properties:Zp: particle chargeβ: the particles velocity and 21 βγ =β: the particles velocity and
Dependance on
1 βγ −=
2pZ
U. Raich CAS Frascati 2008Beam Diagnostics
38

High energy loss a low energies
50 ][ MeVdE
10
20
]/
[ 2cmgdx
2
5
10
gas
solid
1 0.1 0.01 1
2
Ekin[GeV]10 100 1000
Heavy ions at low energy are stopped within a few micro-metersAll energy is deposited in a very small volume
U. Raich CAS Frascati 2008Beam Diagnostics
39
All energy is deposited in a very small volume
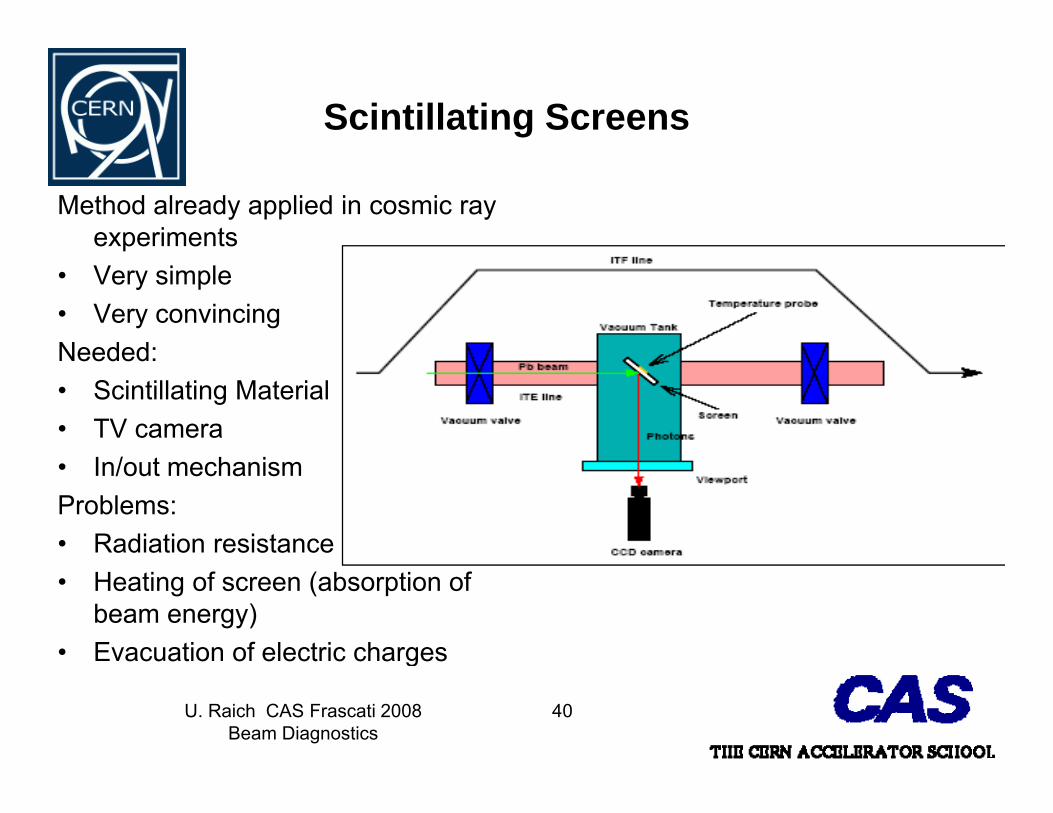
Scintillating Screens
Method already applied in cosmic ray experiments
• Very simple• Very convincingNeeded:Needed: • Scintillating Material • TV camera
I / t h i• In/out mechanismProblems:• Radiation resistance of TV camera• Heating of screen (absorption of
beam energy)• Evacuation of electric charges
U. Raich CAS Frascati 2008Beam Diagnostics
40
g
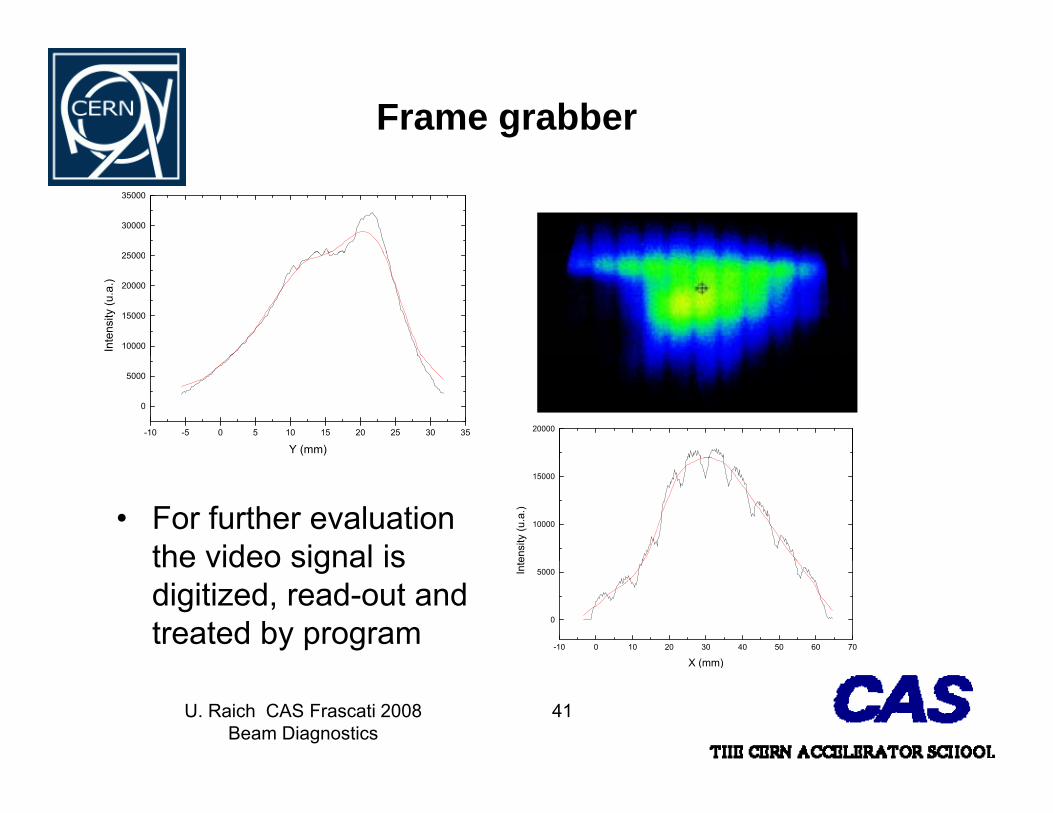
Frame grabber
25000
30000
35000
10000
15000
20000
25000
Inte
nsity
(u.a
.)
-10 -5 0 5 10 15 20 25 30 35
0
5000
Y (mm)
20000
• For further evaluation the video signal is
10000
15000
ensi
ty (u
.a.)
the video signal is digitized, read-out and treated by program
-10 0 10 20 30 40 50 60 70
0
5000Inte
X (mm)
U. Raich CAS Frascati 2008Beam Diagnostics
41
X (mm)

Test for resistance against heat-shock
Materialρ cp at 20ºC
J/gK
k at 100ºC
W/mK
Tmax R at 400 ºC
Ωg/cm3 ºC Ω.cm
Al2O3 3.9 0.9 30 1600 1012
ZrO2 6 0.4 2 1200 103 Better for electrical conductivity (>400ºC)
BN 2 1.6 35 2400 1014 Better for thermal properties(higher conductivity, higher heat capacity)
100
1000
10000
sity
(u.a
.)30000
40000
50000
Start 90μC (30min) 450μC (2h30min) 585μC (3h15min) 720μC (4h)
ensi
ty (u
.a.)
-10 0 10 20 30 40
0.1
1
10 Test start +2min +3min +1h30 +3h
Ligh
t int
en
-10 0 10 20 30
10000
20000
Ligh
t int
e
Y (mm)
U. Raich CAS Frascati 2008Beam Diagnostics
42
Y (mm)

Degradation of screen
Degradation clearly visibleHowever sensitivity stays essentially the same
U. Raich CAS Frascati 2008Beam Diagnostics
43
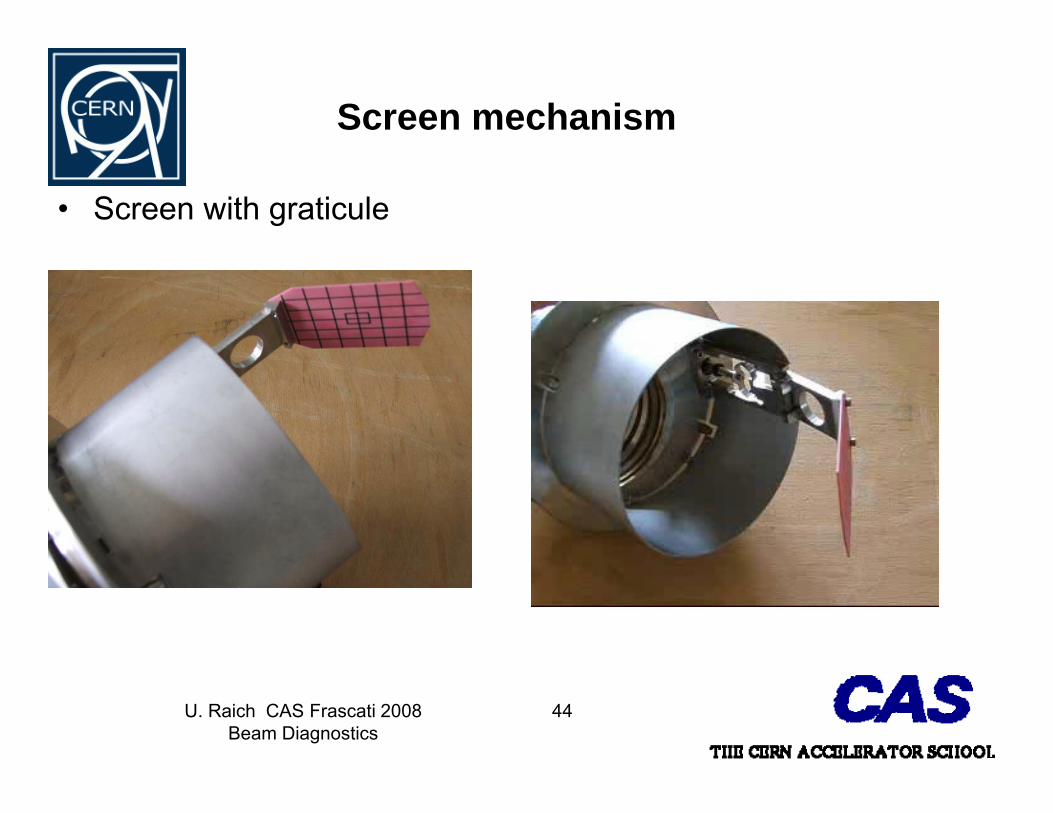
Screen mechanism
• Screen with graticule
U. Raich CAS Frascati 2008Beam Diagnostics
44

Profile measurements
• Secondary emission grids (SEMgrids)
When the beam passessecondary electrons areejected from the ribbons
The current flowing back onto the ribbons is measuredmeasured
Electrons are taken awayby polarization voltageby po a a o o age
One amplifier/ADC chainchannel per ribbon
U. Raich CAS Frascati 2008Beam Diagnostics
45

SEMgrids with wires
U. Raich CAS Frascati 2008Beam Diagnostics
46

Profiles from SEMgrids
Projection of charge densityprojected to x or y axis is Measured
O lifi /ADC iOne amplifier/ADC per wireLarge dynamic range
Resolution is given by wireResolution is given by wire distance
Used only in transfer linesUsed only in transfer lines
U. Raich CAS Frascati 2008Beam Diagnostics
47

Wire Scanners
A thin wire is quickly moved across the beamSecondary particle shower is detected outside the vacuum chamberSecondary particle shower is detected outside the vacuum chamberon a scintillator/photo-multiplier assembly Position and photo-multiplier signal are recorded simultaneously
U. Raich CAS Frascati 2008Beam Diagnostics
48

Wire scanner profile
High speed neededbecause of heating.because of heating.
Adiabatic damping
Current increase due toSpeed increase
Speeds of up to 20m/s=> 200g acceleration
U. Raich CAS Frascati 2008Beam Diagnostics
49
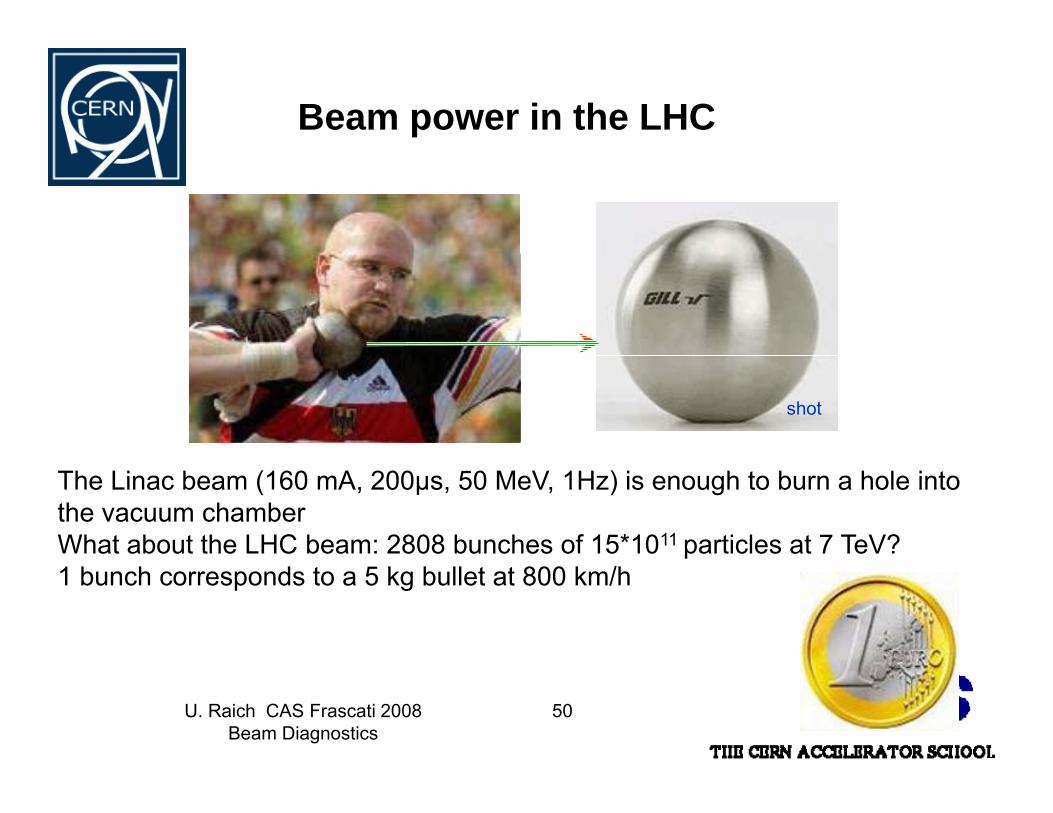
Beam power in the LHC
shotshot
The Linac beam (160 mA, 200μs, 50 MeV, 1Hz) is enough to burn a hole intothe vacuum chamberWhat about the LHC beam: 2808 bunches of 15*1011 particles at 7 TeV?1 bunch corresponds to a 5 kg bullet at 800 km/h
U. Raich CAS Frascati 2008Beam Diagnostics
50
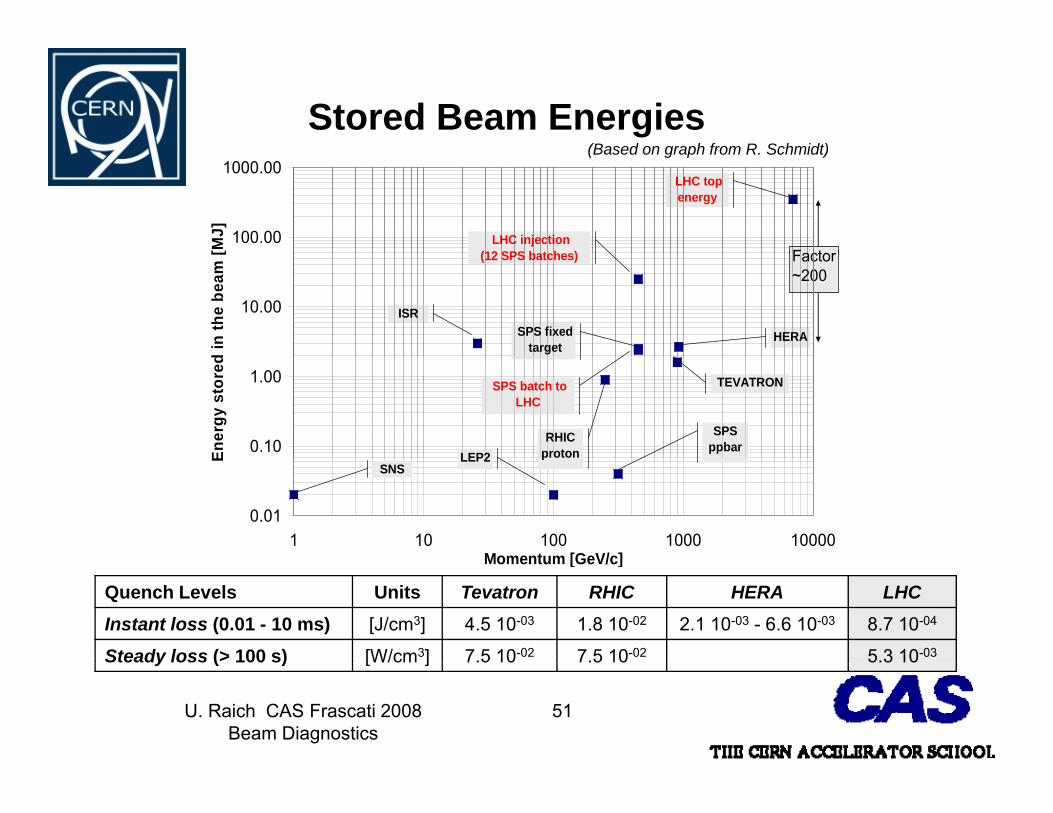
Stored Beam Energies(Based on graph from R Schmidt)
100.00
1000.00
[MJ]
LHC topenergy
LHC injection(12 SPS b t h ) Factor
(Based on graph from R. Schmidt)
10.00
d in
the
beam
[ (12 SPS batches)
ISR SPS fixed
targetHERA
Factor~200
0.10
1.00
Ener
gy s
tore
d
LEP2
TEVATRON
SPSppbar
SPS batch to LHC
RHIC proton
0.011 10 100 1000 10000
Momentum [GeV/c]
E
SNSLEP2 p
Momentum [GeV/c]
Quench Levels Units Tevatron RHIC HERA LHCInstant loss (0.01 - 10 ms) [J/cm3] 4.5 10-03 1.8 10-02 2.1 10-03 - 6.6 10-03 8.7 10-04
Steady loss (> 100 s) [W/cm3] 7.5 10-02 7.5 10-02 5.3 10-03
U. Raich CAS Frascati 2008Beam Diagnostics
51
y ( ) [ ]

Beam Dammage
primary collimatorprimary collimator
Fermi Lab‘sTevatron has 200 times less beam power than LHC!
U. Raich CAS Frascati 2008Beam Diagnostics
52
p
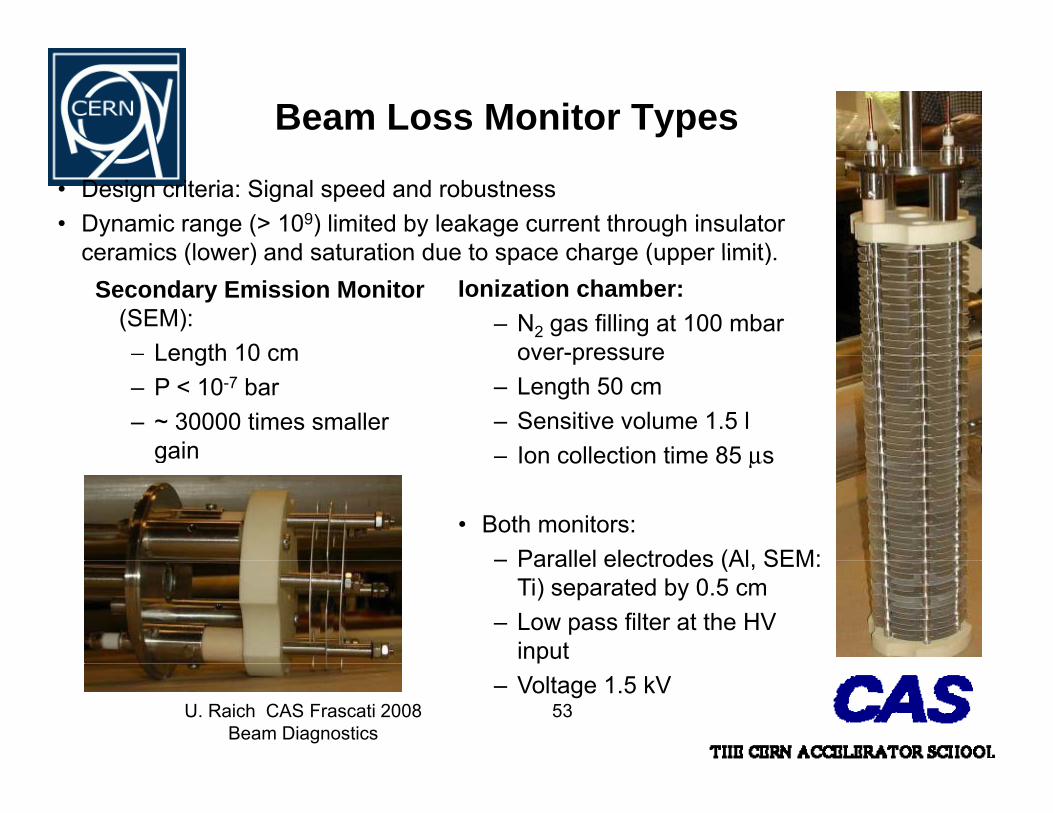
Beam Loss Monitor Types
• Design criteria: Signal speed and robustness• Dynamic range (> 109) limited by leakage current through insulator
ceramics (lower) and saturation due to space charge (upper limit)ceramics (lower) and saturation due to space charge (upper limit).Ionization chamber:
– N2 gas filling at 100 mbar over-pressure
Secondary Emission Monitor(SEM):– Length 10 cm over pressure
– Length 50 cm– Sensitive volume 1.5 l– Ion collection time 85 μs
Length 10 cm– P < 10-7 bar– ~ 30000 times smaller
gain Ion collection time 85 μs
• Both monitors:– Parallel electrodes (Al SEM:
gain
– Parallel electrodes (Al, SEM: Ti) separated by 0.5 cm
– Low pass filter at the HV input
U. Raich CAS Frascati 2008Beam Diagnostics
53
p– Voltage 1.5 kV
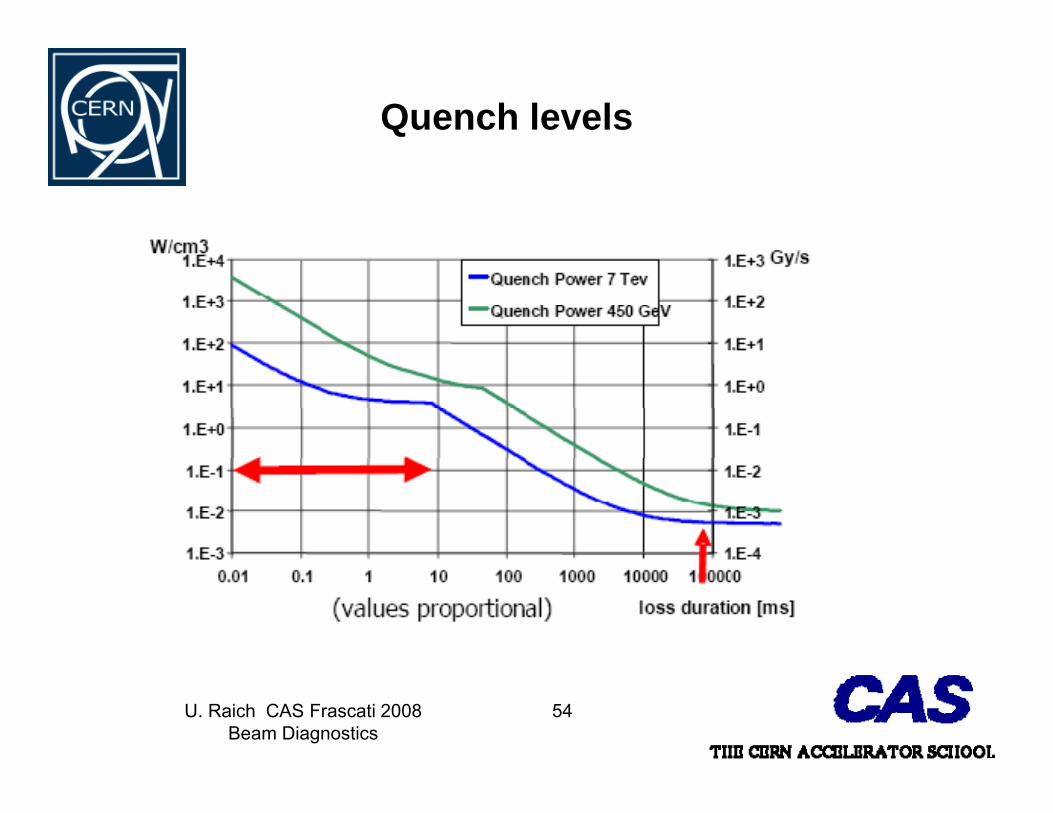
Quench levels
U. Raich CAS Frascati 2008Beam Diagnostics
54

Industrial production of chambers
Beam loss must bed ll dmeasured all around
the ring=> 4000 sensors!
U. Raich CAS Frascati 2008Beam Diagnostics
55
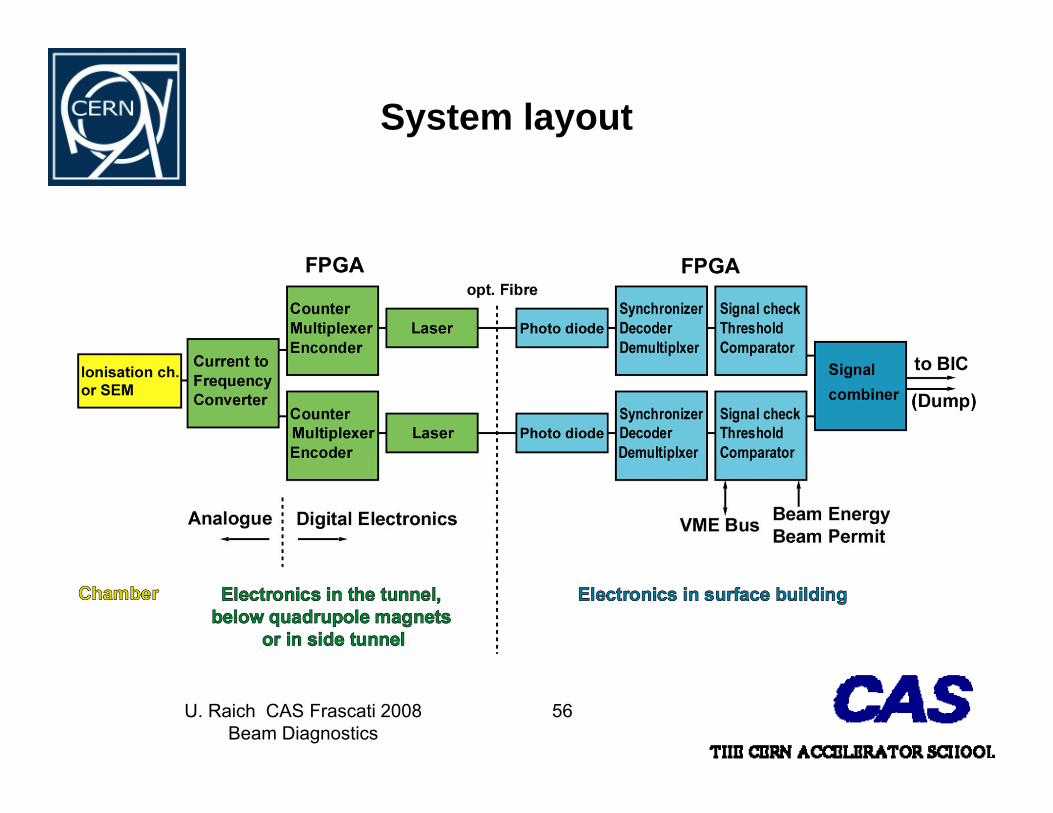
System layout
U. Raich CAS Frascati 2008Beam Diagnostics
56

Successive running sums
U. Raich CAS Frascati 2008Beam Diagnostics
57