
Beach_FSP
21
2016 Claire Beach University of Arkansas 7/25/2016 Profitability of Tourism Businesses in Indonesia An independent honors research project conducted under the School for International Training.
-
Upload
claire-beach -
Category
Documents
-
view
16 -
download
0
Transcript of Beach_FSP

2016
Claire Beach
University of Arkansas
7/25/2016
Profitability of Tourism Businesses in Indonesia
An independent honors research project conducted under the School for International Training.

INTRODUCTION
Many developing countries focus on tourism as a way to grow their economies. These
countries are often rich with natural resources and face a tradeoff between developing the
economy and protecting their natural assets. Several countries which were more focused on rapid
growth, or which had few regulations for tourism development, became hotspots for mass
tourism causing significant damage to the environment.
Mass tourism, even when planned, is often largely unregulated. The goal is simply to
bring in as many people as possible with hopes of enticing them to spend as much as possible.
Often local and foreign entrepreneurs take advantage of the burgeoning industry and tourist
shops, accommodation and restaurants start popping up. The market can rapidly become
saturated, creating a market with numerous companies competing on price instead of quality.
As more budget travelers are brought in companies face a downward price pressure to
remain competitive as new businesses open. In the past this has led to cutting corners on safety
and environmental concerns in order to maintain the low prices which appeal to budget travelers.
There have been numerous cases in recent years over the amount of damage unchecked tourism
can do to the environment. According to the United Nations Environmental Program, tourism
depletes natural resources, increases pollution levels and develops previously untouched areas
(2001).
Tourists are known for intensive water usage, noise pollution and the large amounts of
waste creation. These are problematic in all areas, but for developing countries which often do
not have the necessary infrastructure to cope with their current populations, adding in large
numbers of tourists places a serious burden on the community, infrastructure and environment.
As these issues are drawn into the public spotlight, many people are making initiatives to change
the way people travel. Thus, eco-tourism, an idea about travelling responsibly has emerged.
Eco-tourism, which is short for ecological tourism, embodies many different aspects. The
primary pillars include minimizing environmental impact and supporting locally owned and
operated businesses as much as possible. This approach has been embraced by companies in
many parts of the tourism industry- hoteling, restaurants and adventure companies. They have
developed guidelines to help conserve precious resources and to minimize their negative
impacts. These include efficient and renewable utilities, water awareness and encouraging guests
to reduce their water usage in hotels. For restaurants the most common trends are organic and
locally sourced foods, and for recreation companies using locally produced supplies when
possible.
For the whole industry, using reclaimed and recycled materials in building and for
furniture has become very popular. Many try to use organic cleaning products and biodegradable
materials any time trash has to be created. Other initiatives include community based programs
for hiring local and providing local communities with access to tourist resources. For Indonesia,
which is currently trying to grow its tourist industry from 9% of GDP to 15% in the space of five
years, these pressures are very real (Rachman, 2015).
With this amount of expansion it is vital for Indonesia to implement measures to protect
the environment and to reduce the amount of strain that will be created on the existing
infrastructure. The first step is to find out where the current industry stands, and if there are any
potential examples of green businesses that are currently operating at a profit to demonstrate the
positives as well as the profitability of eco-tourism businesses.
METHODS
To evaluate this, several sets of surveys were developed asking questions about
profitability, customer bases, growth potential and any existing environmental programs that
companies had. The largest portion of the data collected was by the general survey which was
designed for general market data and administered to each participant. A separate survey was
created for each subsection: hotel, restaurants and adventure companies. After receiving
University of Arkansas Institutional Review Board approval, the proposal and data collection
devices were submitted to the School of International Training (SIT) for review. Approval was
granted from SIT, as well.
While on the SIT program, the primary researcher interviewed companies that were
located in the surrounding areas. This primarily included the islands of Nusa Lembongan, Nusa

Penida and Cenigan. Businesses that were asked to participate were chosen based on the
following criteria:
Claimed to be eco-friendly
Advertised environmental programs or initiatives
Were located on sites of environmental interest
o Next to important water ways, on the beach
o Located within protected areas or national parks
As part of the survey, companies were asked about any initiatives that they had to
minimize their impact on the environment. Their responses were used to evaluate how
ecologically diligent they actually were. There were ten options available on the form to choose
from, and an area for writing any other initiatives that were missing from the check boxes. To be
qualified as most responsible companies had to have noted or written at least five initiatives. The
next rung was responsible included companies that noted at least three programs. Any companies
that had two or less programs were categorized as irresponsible, which was further divided into
two categories. The first were companies with only one or two initiatives, and the lowest
classification for companies with no programs.
The target sample size was thirty completed interviews for each category. The surveys
were provided in both Bahasa and English, which allowed for a wider sample size that included
both local and foreign owned operations. During the two weeks in which SIT was based at Nusa
Penida, the principal researcher travelled to Nusa Lembongan once for two days, and to Cenigan
once for a day. A total of $35 dollars was spent on this project- for printing, pens, clipboards, and
transportation to and around the islands. In total, around 100 hours were spent conducting
interviews for this project.
DATA
A total of seventy five surveys were collected over the duration of this project. Between
these, thirty four were accommodation providers, twenty three were restaurants, and the
remaining eighteen were recreational providers. Once surveys were complete, they were
transferred to a digital record in Excel. From there the results were aggregated into a matrix that

could compare the responses overall, by categories and subgroupings. The data was analyzed
under several different sets of criteria that approach the topic of ecotourism in different ways.
RESULTS
This research looked at many different aspects of businesses within the tourism industry, to
answer specific questions.
How ecologically responsible are businesses in the tourist industry in Indonesia?
Very few businesses which claim to be ecologically responsible actually are. This study
found that of all the companies interviewed, only thirteen had significant programs or
initiatives to minimize environmental impact or for sustainable expansion; thirty five
companies had no environmental checks at all.
Is eco-tourism profitable?
Yes. According to the data collected, eco-tourism is significantly more profitable than mass
tourism. On average, eco-companies made $10,000 more annually than non-eco-companies. The
eco-companies surveyed had combined profits of more than $330,000 annually.
How profitable is the tourism industry?
In this specific study, the companies surveyed had total aggregate profits of $1.23 million
USD annually. These companies represent only a small portion of the businesses in the industry.
Although the majority of the operations are relatively small scale with modest profits, the
number of operators within the industry and their aggregated profits account for more than $10
billion annually (American Chamber of Commerce).
Consumer spend also varied widely between groups of domestic and foreign tourists (See
Figure 1). The data collected shows that companies who cater primarily to foreign tourists have
profits 3.58 times higher than companies who focus on domestic tourists. Just over one-fifth of
companies reported having a mix of both foreign and domestic clients. However, the profit gap

remained large. Foreign based clienteles gave companies three times as many profits as
compared to a mixed base.
Is there any growth within the (eco) tourist industry?
Yes, however there is not as much growth as in mass tourism. The average age of eco-
tourist businesses was 6.2 years, whereas the least environmentally conscious businesses were
much younger at 4.5 years on average. Overall, the majority of these businesses were started
within the last 1-5 years. There is also a significant number of businesses which have been
opened in the last year. Roughly 16% of the companies surveyed were in this categories.
How do businesses attract customers?
The majority of these businesses are trying to connect to their customers via internet and
social media. Almost two thirds of the companies have website, use third parties such as booking
cites, or manage social media pages to draw in customers. Just under 20% of the companies
relied solely on walk-ins to generate interest and customers. Other common methods for reaching
consumers included word of mouth and printed advertisements such as fliers.
Is there a target demographic?
Although there may not be a target demographic, over 70% of companies reported that their
main customers range between 20-30 years of age, and travel in groups of two to four people.
Businesses also fell into three groups based on their most common customers- domestic tourists,
foreign tourists, or an even mix of both.
Consumer Spend
Customer Base Foreign Mixed Domestic
Aggregate Spend $795,000 $265,000 $220,000
Average Spend Per Company $19,390 $16,560 $12,940
Figure 1: Consumer spend per customer base.
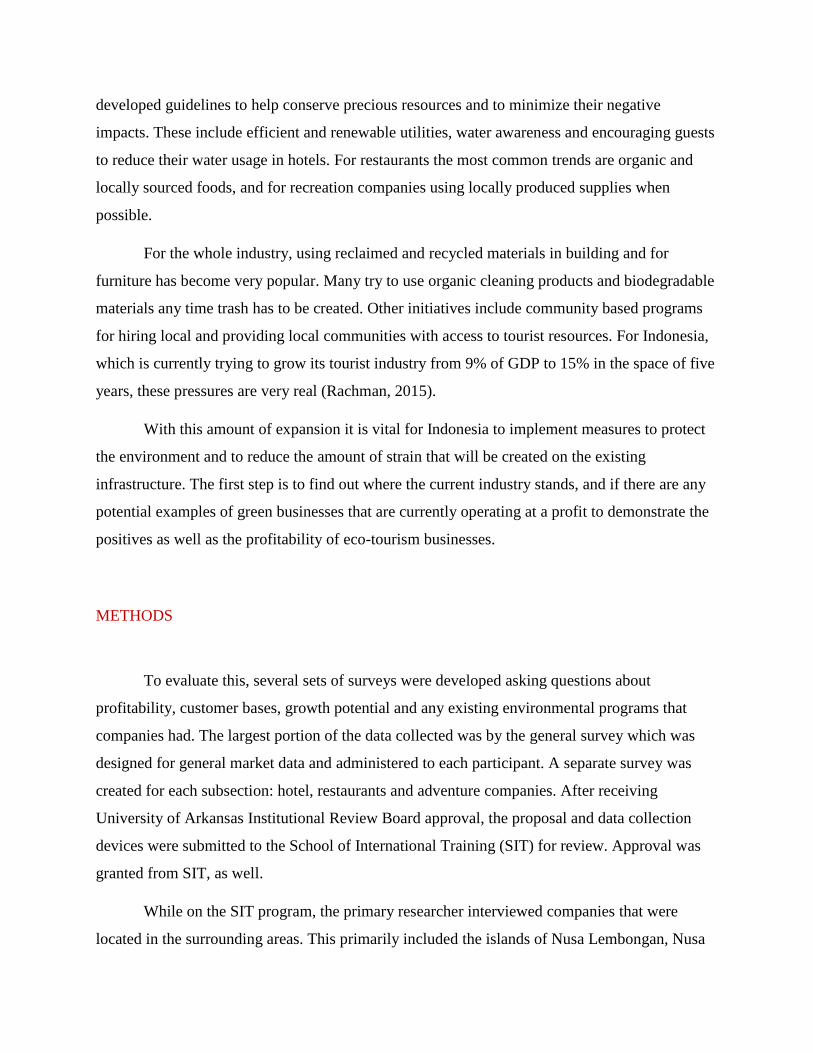
Figure 2: Percent of companies that reported clients in each age group.
Figure 3: Percent market share of companies reporting either more
domestic or foreign tourists, or a mix.
What does the tourist industry look like over all, and what do the individual sectors look
like?
The majority of businesses were accommodation, followed by restaurants and then
recreational companies. These businesses serve only a small portion of the 2 million visitors to
Bali each year. Overall, ranking the sectors in order of highest share eco-friendly businesses,
reflects a different trend in relation of eco-friendly businesses to market share. Recreational
23%
55%
23%
C U S TO M E R O R I G I N S
Domestic Foreign Mixed
0%
10%
20%
30%
40%
50%
60%
70%
80%
2 1 T O 3 0 3 1 T O 4 0 4 1 T O 5 0 5 1 T O 6 0 > 6 0
C U S TO M E R A G E D I S T R I B U T I O N Another interesting point of
consideration is where the majority
of tourists are from. Previously, the
largest percent were foreign
travelers. However, recently there
has been increases in both the
domestic and foreign tourist
numbers. Part of this study asked
companies to report where the
majority of their customers were
from (See Figure 3).
For companies who reported
either more foreign customers or a
mix, they were also asked where the
majority of their foreign customers
came from. In comparison to
previous year’s data taken from the
Bali Regional Government, it seems
that the number of European and
Chinese tourists are increasing the
most, replacing Australians as the
top travelers.

companies had the largest share at 18%, followed by hotels at 17% with restaurants lagging
behind at 8%.
Accommodation (thirty four companies surveyed)
Accommodation included many different forms from resorts to homestays and everything in
between. Often the locations were clustered near one another, located close to the beach or to
temples. A small portion of these business were located in more remote areas- to appeal to those
trying to “get away from it all”. Many of the hotels also had several other businesses under their
umbrella; dive shops, excursions and tours, spas and restaurants. The majority of these ventures
did not separate profits from the individual services.
Restaurants (twenty three companies surveyed)
Restaurants had much less variation than hoteling. The majority of restaurants were casual
dining. There locations were more varied; in shopping areas, on the beach, or hidden away on
side streets. Very few were in what could be considered remote areas. Restaurants were either
standalone businesses or part of a hotel.
Recreation (eighteen companies surveyed)
Recreation companies were the least diverse. The three main types of recreation providers
include activity organizers (diving, snorkeling, parasailing, etc.), rentals (boats, kayaks,
watersport, etc.), and spas. The majority of businesses in the first two groups had two locations-
a small one right on the beach front. They often rented out space from a hotel or restaurant.
Many had a second location which was larger and more set back from the sea. Spas were often
located in areas by hotels if they were not a part of the hotel themselves.
DISCUSSION
How ecologically responsible are businesses in the tourist industry in Indonesia?
The purpose of this study was to collect data on how profitable eco-tourist companies were in
Indonesia. However, there were a number of problems with this approach. Of the seventy five
companies that were interviewed, only thirteen could be considered ecologically responsible. A
much larger number had no initiatives whatsoever. The small sample size of businesses that fit
the requirements set to be considered ecologically responsible is a significant limit to the depth
of this study.
Eco-tourism tends to be characterized by a longer pay off period, which may be a large
deterrent for many tourist operations. Initial costs are higher, and in saturated markets this means
that budget conscious market segments will be less likely to use the company’s services or
products. A large number of these companies were price competitors, targeting budget travelers.
In contrast, the responsible companies were more competitive on quality.
All but sixteen percent of the companies interviewed claimed to be eco-friendly. However,
the number of claims substantiated was disparate with the number of companies who had programs
to minimize their impact on the environment. The primary cause for the discrepancy may be that
many people are simply not aware of what being “eco-friendly” entails. There does not appear to
be many well-known environmental initiatives or programs in Bali. There are several smaller scale
and local organizations which have environmental programs.
These endeavors face their own set of problems. The majority are small scale and regional.
Even the larger organizations which have multiple locations, still have relatively small reach. A
number of these groups focus on educating locals about the importance of the environment and
ways to minimize their own impact- such as not burning plastic but recycling it, using reusable
water bottles, and putting waste in bins. Others focus on organic farming techniques and livestock
breeding or on biodiversity issues. Very few resources are directed to educating businesses about
conservation practices and sustainability.
This is very disproportionate to the economy- tourism makes up 10% of Indonesia’s GDP,
and the current government is trying to expand the industry. The goal is for it to be 15% of GDP
by 2019 (Rachman, 2016). The majority of resources being spent on the industry is to attract more
tourists, but this will only exacerbate current problems- which could backfire. Increasing numbers
of people will produce more waste and a faster rate of depreciation for nature based tourism. This
in turn will defeat the very purpose of many of these tourists’ visits.
A second large problem this could lead to is tourists being misled by companies claiming
to be green or “eco-friendly”, and believing that they are travelling green when they are not.
Traveling green has become more and more important for many people. Eco-tourism now accounts
for roughly 23% of the worldwide tourism industry (Williams, 2014). Eco-tourism is also the
fastest growing industry, proving that not only is it good for the environment, but for the pocket
book as well.
Is eco-tourism profitable?
According to the data collected, eco-tourism businesses were considerably more
profitable than their counterparts. On average, eco-company profits were over $10,000 more per
company than the profits generated by the mass tourism companies. This is an interesting find
since the majority of these companies are relatively new and were expected to have higher start-
up costs to pay off, and therefore would take longer to become profitable ventures.
These results may also be skewed due to the distribution of eco-tourism companies across
sectors. As expected, companies which were based largely upon nature activities had the most
environmental conservation programs. However, this means that recreational companies are
disproportionately eco-friendly in comparison to their share of the overall industry. Further,
because tourists spend a large portion of their travel budget on “experiences” profits may be
skewed by uneven spread across the industry.
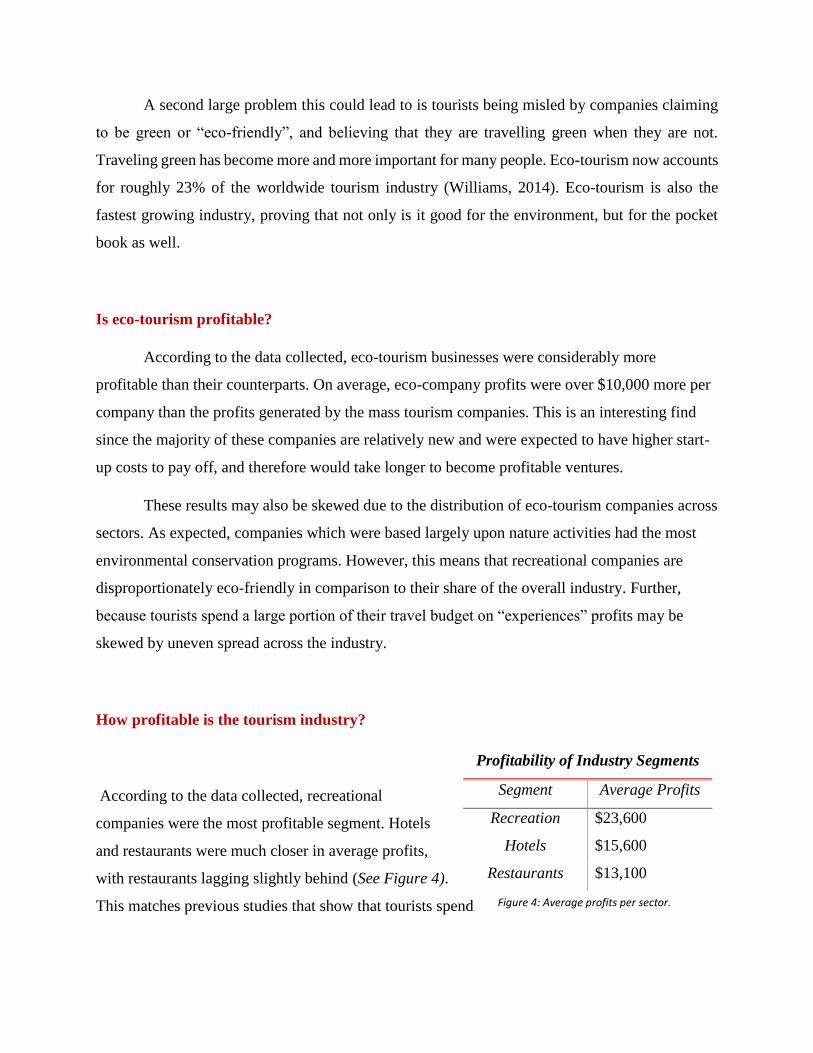
How profitable is the tourism industry?
According to the data collected, recreational
companies were the most profitable segment. Hotels
and restaurants were much closer in average profits,
with restaurants lagging slightly behind (See Figure 4).
This matches previous studies that show that tourists spend
Profitability of Industry Segments
Segment Average Profits
Recreation $23,600
Hotels $15,600
Restaurants $13,100
Figure 4: Average profits per sector.

the majority of their money on experiences. Overall the aggregate income in the industry was
$1.3 million for the last year.
Is there any growth within the (eco) tourist industry?
The Wall Street Journal reports that tourism in Indonesia has grew 7.6% from 2014 to
2015, with more growth expected this year. The data collected reflects this, as well as steady
growth for the last five years. For all the businesses surveyed, 75% were opened in the last 1-5
years, and 21% of these were opened within the last year. For eco-tourism, 77% were opened in
the last year, 30% of which were opened within the last year.
Of the businesses surveyed, 69% responded that they saw room for growth. However, only 61%
are currently trying to expand. Respondents were also asked why they believed there was room
for growth: unmet demand, increasing visibility (for the company), increasing tourist numbers,
or other (see Figure 5). The most common response was increasing number of tourists.
A second factor affecting profits is the length of time the businesses have been
established. Of all the eco-companies, there are two general clumps. Those established 15-20
years ago, and those established in the last five years. Mass tourism only has one cluster-
companies created from the last year to ten years ago, with the majority of those businesses
19%
31%
57%
REASONS FOR GROWTH
Unmet Demand Increasing Visibility Number of Tourists
Figure 5: Reasons cited for potential growth.

established within the last five years (See Figure 6). This follows the global trend in tourism of
rapid expansion within the last five years.
.
In 2014, eco-tourism was cited as the “fastest growing segment within the worldwide
tourism industry” (William, 2014). In a more recent study from 2015, over a quarter of travelers’
value sustainability and responsibility when making decisions (Klotz, 2015). Across the world,
the number of ecologically conscious and responsible companies has increased drastically,
reflecting the growing value that people place on preserving resources and benefitting local
communities.
It is therefore surprising that the amount of businesses that are eco-conscious, and their
growth rate, is so low. The eco-conscious segment of customers, generally younger than 40 and
from more ecologically aware regions such as Europe, Australia and America, has been
significantly increasing. Together, these three regions accounted for 20% of the growth in
numbers of travelers from 2015 to 2016 (Bali Regional Government). The increasing growth of
eco-tourist companies may reflect this market segment growth, but it is not on an equitable level
with the demand that would be expected from the data.
Overall, 68% of the companies surveyed responded that they saw room for growth, but
only 61% were actively trying to grow their business. The most common obstacle to expanding
businesses were the associated costs. Multiple businesses cited logistical difficulties supporting
their current business as a key hindrance to expansion. Located on islands, the supply chain
security is much harder to ensure and businesses currently have issues with their orders on a
regular basis. They are weary of expanding and not being able to support the increase in business
for logistical reasons.
Eco-Tourism Mass Tourism
>1 year 23.1% 15.3%
1 – 5 years 53.8% 61.0%
6 – 10 years 0% 15.3%
<11 years 23.1% 5.1%
Figure 6: Distribution of companies relative to years of operation.

How do businesses attract customers?
Many of the companies surveyed were using a variety of marketing channels. The largest
were walk-ins customers. The next largest was online. Over two thirds of the companies had at
least one social media account or website, and half had both. The two most common social sites
were Facebook and Instagram. A large number of companies also reported using third party
websites to direct customers to their pages. They varied by industry, but among the most used
were booking.com and Trip Advisor.
Increasing tourist numbers may partially be contributing to companies progressively
using the internet and social media to increase their visibility; this “increasing numbers of
tourists”, was cited as the number one reason for opening new businesses and fueling growth.
They are also better able to reach the predominate age group most efficiently online- the 20 to 40
year olds.
Is there a target demographic?
The majority of businesses report that their customers are between 20 and 40 years of
age, travel in groups of two to four people, and are usually evenly split female/male. A large
proportion of these businesses are also using social media to increase their visibility- which
means their adverts and promotions are more likely to reach this same segment.
While many companies try to reach the bigger spenders, stereotypically middle aged
customers, businesses are finding that the younger demographics are also willing to spend more.
According to Forbes, young travelers accounted for “$217 billion of the $1.088 trillion tourism
spend worldwide” (2012). The increasing number of young tourists who are less cost conscious
than backpackers has led to the term “flashpackers”; people who travel with laptops,
smartphones, and less budget restrictions.
ACCOMMODATION
What is the typical business structure?
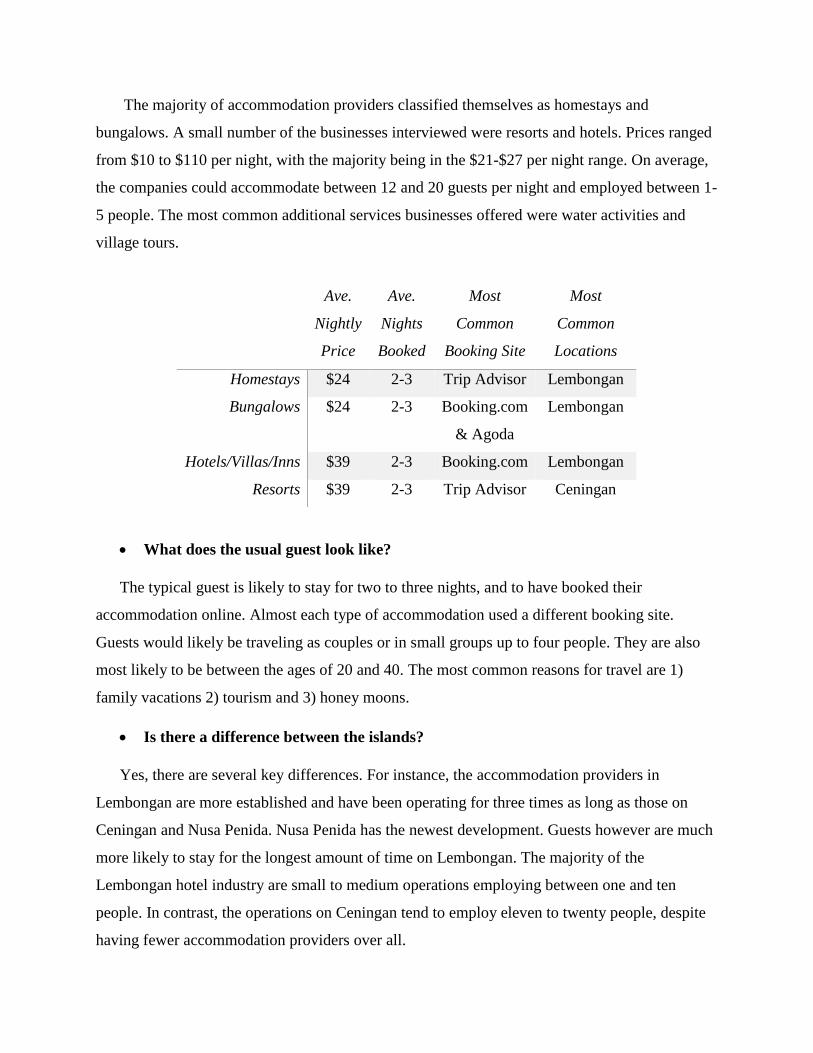
The majority of accommodation providers classified themselves as homestays and
bungalows. A small number of the businesses interviewed were resorts and hotels. Prices ranged
from $10 to $110 per night, with the majority being in the $21-$27 per night range. On average,
the companies could accommodate between 12 and 20 guests per night and employed between 1-
5 people. The most common additional services businesses offered were water activities and
village tours.
What does the usual guest look like?
The typical guest is likely to stay for two to three nights, and to have booked their
accommodation online. Almost each type of accommodation used a different booking site.
Guests would likely be traveling as couples or in small groups up to four people. They are also
most likely to be between the ages of 20 and 40. The most common reasons for travel are 1)
family vacations 2) tourism and 3) honey moons.
Is there a difference between the islands?
Yes, there are several key differences. For instance, the accommodation providers in
Lembongan are more established and have been operating for three times as long as those on
Ceningan and Nusa Penida. Nusa Penida has the newest development. Guests however are much
more likely to stay for the longest amount of time on Lembongan. The majority of the
Lembongan hotel industry are small to medium operations employing between one and ten
people. In contrast, the operations on Ceningan tend to employ eleven to twenty people, despite
having fewer accommodation providers over all.
Ave.
Nightly
Price
Ave.
Nights
Booked
Most
Common
Booking Site
Most
Common
Locations
Homestays $24 2-3 Trip Advisor Lembongan
Bungalows $24 2-3 Booking.com
& Agoda
Lembongan
Hotels/Villas/Inns $39 2-3 Booking.com Lembongan
Resorts $39 2-3 Trip Advisor Ceningan

Are all of the accommodation types equally eco-friendly?
No. According to the data, resorts were the most eco-friendly, and then the hotels.
Bungalows were the least environmentally conscious. Bungalows however, were the most likely
to be located on the beach and therefore could possibly be the biggest contributor in terms of
waste produced that enters the environment.
Homestay are interesting because they are a budget friendly option on the same price level as
several of the bungalows, but they have more environmental safe guards. This illustrates that
budget options can also be environmentally friendly; but there is no obvious reason for why
homestays have more initiatives than bungalows. The most common environmental initiatives
for those located directly on the beach were beach clean ups- more than likely to attract
customers to cleaner sand. Many accommodation providers also sorted plastic and sent them to
Bali to be recycled. Others also sold water bottle refills to help prevent plastic waste.
Is one island or one type of accommodation more profitable?
Overall, accommodation was the most profitable sector accounting for more than 40% of the
aggregated profits of this study. Individually, Lembongan had the highest average profits per
company. However, Ceningan was a close second, and has much less industry competition and
more profit concentration. The data for both Ceningan and Nusa Penida may be skewed due to
the amount of newly opened businesses in both areas when compared to the longevity of
businesses on Lembongan. It may be possible for Cenigan to overtake Lembongan within the
next year or two, as ventures become more established.
RESTAURANTS
What is the typical business structure?
The majority of restaurants are relatively new. Over 82% were opened in the last five years.
They also tend to be small in size, with staff between one and five people. The majority of
businesses rely on walk-by traffic, but a decent portion also use social media such as Instagram

to direct customers to their restaurants. Ceningan had the highest rate of companies utilizing the
internet to draw in consumers.
The majority of restaurants do not necessarily need to be located within walking distance of
hotels since a large number of tourists rent scooters for at least part of their stay. Parking lots
were found at a significant portion of the restaurants and guests were generally mobile. Several
restaurants were located quite some ways from the nearest accommodation but were still busy
and had average or high profits.
What does the usual guest look like?
The usual guest is a couple or small group of two to four people, ranging between 20 to 40
years old. However, some restaurants reported only being frequented by one or two groups. This
was typically the younger than 25 crowd, or people between 51 and 60 years old.
Are all restaurants eco-friendly?
No, only 18% of restaurants in this study were considered eco-friendly. The majority at 48%
had no programs or initiatives. Of the restaurants who are working to minimize their impact, the
most common program was sorting plastic and sending it to Bali to be recycled. Others also sold
water bottle refills or free refills for customers, and gave discounts to people who brought in
recyclable plastic. Many restaurants also used reusable straws to cut down on waste.
RECREATION
What is the typical business structure?
Number of
Restaurants
Ave.
Income
Ave. Age
(years)
Most
Common
Marketing
Penida 4 $14,000 5.3 Walk-ins
Lembongan 12 $13,750 3.7 Walk-ins
Ceningan 6 $11,660 3.0 Online

A much higher percent of recreational companies were foreign owned in comparison to the
accommodation and restaurant sectors. Many businesses like dive shops also appeared to have a
higher proportion of foreign employees in order to appeal to customers who want to be instructed
in their native tongue.
These ventures also were typically much larger in scale. Only 30% employed between one
and five people. The largest number of business employed between eleven and twenty people,
with an additional 17% employing over thirty individuals. Often these businesses had a small
shop or signage along a beach front or in town off of the main road. A second location would
serve to store supplies and equipment. Many of these organizations had multiple locations across
the islands.
What does the typical customer look like?
Interestingly, this group showed the most variation within the industry. Customers were less
likely to be split evenly based on gender. Several of the companies that rated themselves as
adventure tourism reported higher numbers of male clients. In contrast, relaxation companies
such as spas typically had more female patrons. There was also more variation in group size-
many went as individuals whereas restaurants and hotels reported mostly groups of two to four
people.
These customers are also in a more condensed age group. For 61% of companies, they only
had clients ranging from 20 to 40 years of age. Only 17% reported having any clients in the last
age group. The majority of companies also reported that the bulk of their customers were
European. The next largest group were Indonesia tourists, followed by Australians.
How eco-friendly are recreational companies?
Pretty friendly. In this study recreational companies were the most environmentally
conscious. According to the data, 33% of companies surveyed would be considered responsible
by this study and that a further 50% had at least one environmental program. Only 9% of
companies were ranked at the lowest level with no initiatives whatsoever.
The most common initiative were beach clean ups. These ranged from a few times a month
to multiple times a week. Other common programs included membership in associations for

environmental awareness. Several of the nature tourism companies also had training programs
that their clients had to complete before participating in the activities- these included information
about safe interactions with animals and the environments in which their activities would take
place.
How do these companies usually reach their customers?
For recreational companies, the majority reported either using the internet or relying on walk-
ins. The larger businesses had websites, multiple social media pages, and often worked in
partnership with hotels around the islands. For smaller and newer ventures, the majority of their
customers saw fliers or walked by their shop. Word of mouth, or referrals from past customers,
also played a larger part in this sector than in the other two.
How profitable are recreational companies?
Recreational companies proved to be the second most profitable sector. Of the $1.3 million
surveyed in this study, recreational providers accounted for $425,000 or roughly 33% of the
aggregate profits. However, this sector had the highest average profits. They were 1.5 times
higher than the average accommodation profits.
IN COMPARISON: ACCOMMODATION, RESTAURANTS, AND RECREATION
In comparison, there is much variation across industries. However, several points can be
easily summed up. For Bali, the typical tourist and therefore the typical customer is between the
ages of 20 to 40 years old and is generally evenly split between males and females. The most
common travelers are couples followed by groups of friends of up to four people. There are some
larger groups that travel together, however they are much less common.
There are also large numbers of both foreign and domestic tourists. Despite this, foreign
travels outspend domestic visitors at a rate of 3:1. This is in part responsible for a wide gap in
profits between companies who focus on different customer bases. Overall profits are
concentrated in the accommodation industry, but are higher on average for recreation providers.
Restaurants had the lowest profits.
Company size was also less distinct between accommodations and restaurants. Both
sectors were dominated by smaller businesses with one to five employees, the majority of them
locally owned and operated. In contrast, recreation companies were more likely to be foreign
owned with a staff of 11 to 20 employees. Overall, the restaurant and accommodation sectors
were much more similar. There were several large deviations from the trend when it came to
recreational companies.
LIMITATIONS
This study faced several limitations. The largest issue was the language barrier when
interviewing locals. Although the survey was in the local language, the meaning of two of the
questions were unfamiliar. Particularly, “eco-friendly” and “promotion”, were the most
misunderstood. Further explanations were provided, however, it is doubtful that the intent of the
question was communicated clearly.
Other limitations included not being able to survey many different restaurants and
recreational companies due to the nature of the industry- many were owned by hotels and were
not operated as individual businesses. Many companies also had multiple locations but
aggregated profits under one company, making it difficult to distinguish individual companies to
avoid duplicating interviews.
FUTURE RESEARCH
In the future, several other topics will be added to this paper. This includes common
challenges reported by businesses in all three subgroups, as well as issues with inconsistent
regulations, inspections and enforcement. A third aspect that plays into regulations and
enforcement is the distribution of foreign and locally owned businesses and the amount of
bureaucracy that both face regularly to better understand how business friendly Indonesia is.

Further research concerning the impact of budget and self-guided tourists have on
economic amplification of tourism would also prove valuable for to illustrate potential profits in
a diverse market. Additional sections may also be added concerning the marketing matrix that
these companies used, including programs to train staff and analyzing resulting profits to
discover any potential correlation.
SUMMARY
This study was originally intended to look at the profitability of eco-tourism businesses in
Bali and their potential growth. A large number of companies claimed to be eco-friendly, but in
reality the majority are not. Therefore the study evolved into looking at the tourism industry in
general, what the customer base looks like, how companies reach their clients and how much
room for growth there is in the industry. The study also noted the current practices being used by
successful eco-tourism companies and how operators in the current industry can adopt some of
them in order to reduce their impact on the environment and to increase competitiveness.
Travelers are placing more weight on being green and as a result eco-tourism is the
fastest growing industry in the world. Countries no longer have to face such a substantial tradeoff
between growing their economies and protecting their natural resources. These practices have
added benefits or reducing the waste created in general and the strain that tourists place on
existing infrastructure.
THANKS
A special thank you to the following for their help, guidance and support:
Dr. Arya Gaduh, adviser University of Arkansas
Jack Grant, adviser School for International Training
Made Yudi, adviser School for International Training

SOURCES
American Chamber of Commerce. Indonesia’s Tourist Industry. 2015. Accessed July 24, 2015.
Web.
Bali Regional Government. Direct Foreign Tourist Arrivals to Bali by Market Country: January
to May 2016. Published May 2016. Print.
Forbes. Travel Boom: Young Tourists Spent $217 Billion Last Year, More Growth Than Any
Other Group. 2013. Accessed July 17, 2016. Web.
Klotz, Don. Green Indonesia- Indonesia’s Indigenous Communities Use Ecotourism to Secure
the Rights to their Lands. National Geographic. Jan 23, 2015. Accessed July 17, 2016. Web.
Rachman, Anita. Indonesia’s Tourism Industry. The Wall Street Journal. June 1, 2015. Accessed
July 23, 2016.
United Nations Environmental Program. Environmental Impacts of Tourism. Sustainable
Tourism. 2001. Accessed July 24, 2016.
William, Steve. The Growth of the Global Ecotourism Industry. EcoWanderlust. February 26
2014. Accessed July 17, 2016. Web.


