Baseline Survey Report - Lima -...
39
Resource Recovery and Reuse (RRR) Project 2012 Baseline Survey Report - Lima
Transcript of Baseline Survey Report - Lima -...

Resource Recovery and Reuse (RRR) Project
2012
Baseline Survey Report - Lima

1
Name of city: Lima See terminology in Annex
A. Official interest in project. Please consult a responsible person in the local waste
authorities who can respond to the following questions and/or refer to their policies:
1. Is Resource Recovery & Reuse (RRR) from waste occurring in the city (waste composting,
irrigation with treated wastewater, energy from waste projects)?
In 2007, the SWITCH-Lima Project,
implemented by IPES and the Ministry
of Housing, Construction and
Sanitation, developed a research
process in order to identify experiences
in treatment and use of wastewater for
green areas and urban agriculture; and
analyze their current situation
(strengths, weaknesses, etc.) in the city
of Lima. This process obtained an
inventory with 37 experiences identified
and characterized, which were
developed on 982 ha using a flow rate
of approximately 1.692 l/s, equivalent to
only 10% of sewage collected in Lima.
This figure shows that currently 1.72
L/s. ha is been applied. Considering the
arid conditions of Lima (climate, soil
and other factors) it is estimated that
the water requirement for a surface
irrigation system should not exceed 1
L/s, hence the flow rate used could
supply 72% more currently irrigated
area, if it were made more efficient use
of water. In the map it is shown the
location of the 37 experiences
registered in the inventory.
The experiences have been developed
by district municipalities of the Province of Lima, the Provincial Municipality of Lima, the Water
and Sewer Service of Lima – SEDAPAL, universities and private schools, and private companies.
As an example the Metropolitan Municipality of Lima (MML) has 5 treatment plants of domestic
wastewater for irrigation of green areas in the crossroads with a combined production capacity
of 923 m3 of treated water per day (approx. 18 ha).
Source: Tomás Alfaro, 2007

2
The management of solid waste in Lima is developed by the District Municipalities who operate
the service directly or outsource to private companies. Unfortunately, the management is
inadequate and deficient in most of Lima's districts except districts those ones with a higher
budget municipality. There are no systems of segregation at source of waste, except for pilot
programs in some districts of Lima. It is therefore little evidence of reuse of waste for composting
or biogas experiences. These are highly localized and informal experiences and there is no
inventory on them.
2. Are the authorities in charge of a) solid waste and those in charge of b) wastewater
interested in a feasibility study for RRR options and related Sanitation Safety Plans in
their city? Please note which authority confirmed interest (name, position, authority; or
policy citation).
The Municipality of Lima is formulating the Integral Metropolitan Plan of Solid Waste
Management for the entire city of Lima, and one of the actions of the Plan is the use of organic
and inorganic waste, so studies of this feasibility are key issue to develop metropolitan projects.
The MML promotes the use of treated water for irrigation of green areas in the province of Lima
as one of ITS Environmental policies. In order to get this, the MML included in the Proposal of a
new ordinance to create the metropolitan system of green areas a chapter prioritizing the use of
treated wastewater to irrigate green areas.
On the other hand, the Municipality of Metropolitan Lima manages the Metropolitan and Zonal
Parks of the city that conform the metropolitan system:
Source: Municipality of Lima

3
181.4 hectares of green areas in 17 Metropolitan and Zonal Parks in various districts.
Water requirement: 108.9 lps (9405.85 m3/day) / (Current Source of irrigation: water, water
channels and treated wastewater)
Additionally there is a plan and investments of the MML to build 6 new Zonal Parks until 2014.
The Municipality of Lima has a plan to begin a gradual change of source of water for irrigation in
the zonal parks and for them to be irrigated with treated wastewater instead. The MML proposes
the construction of treatment plants.
And the MML is interesting in acquiring more information generated of study cases which
evaluate the potential use of wastewater for all Zonal and Metropolitan Parks and to create green
corridors and smaller parks in the districts.
See Annex 1.
3. Is there private sector interest in innovative resource recovery models? Who? In what?
Can this be documented/verified via examples?
There are private companies (American, Spanish, and Canadian) interested in investing in the
construction, operation and maintenance of residual water treatment plants for irrigation of green
areas. These companies have directly contact the Municipality of Lima to discuss the possibility
of developing grants of private investment initiatives.
4. Are there public complaints (e.g. newspaper reports) about uncontrolled waste reuse or
actual or potential health risks (please provide any proof/documentation if yes)?
There have been registered some complaints to the Water and Sewer Service of Lima
(SEDAPAL) for crimes against the environment and public health due to pollution caused by any
malfunction of the pipes.
Besides, some regulatory institution like the defunct National Environment Council (CONAM)
publicly expressed its concern about the increased pollution in the city, as a result of the
concentration of wastewater in the Collector Taboada, which is the place where all the
wastewater of sewer of Lima is concentrated. The communities in Callao, place where is located
the Collector, were the most affected. Neighbors of the zone had complaints about generation of
odors, insect infestation and potential contamination of children, animals and plants.
These potential risks of contamination would affect specially the population living in poverty and
extreme poverty, which is more prone to water-related diseases. The rate of acute diarrheal
diseases (ADDs) is one of the indicators associated with the sanitary quality of drinking water.
The Health Ministry reported almost 280,000 cases in Lima and Callao in 2009, reversing a
downward trend in the last five years. The cumulative incidence (AI) per 10,000 population
doubles in the Callao of Lima. It is estimated that 30% of all cases is directly related to the water
quality.

4
Acute Diarrheal diseases in Lima y Callao, 2005-2009
The media have reported several of these specific cases registered in some districts of Lima.
The main causes mentioned by specialists on the theme, are the lack of enough treatment plants,
and that sewage end up in rivers, lakes and seas, polluting the air and affecting the environment
and our health.
Here are some links of the most important news about this issue:
http://peru21.pe/2012/01/21/actualidad/denuncian-sedapal-contaminar-playa-lurin-2008416
http://radio.rpp.com.pe/cuidaelagua/alta-carga-organica-en-desagues-contamina-rios-mares-y-
lagos/
http://peru21.pe/noticia/14715/desagues-24-distritos-contaminan-mar-callao
http://elcomercio.pe/lima/1340076/noticia-contaminacion-rio-rimac-aumenta-no-hay-quien-
pague-ella
http://elcomercio.pe/ediciononline/html/2008-05-21/el-colector-taboada-traeria-problemas-
contaminacion.html
http://www.larepublica.pe/01-08-2009/piden-reparar-los-filtros-en-taboada
Based on the concern in Taboada Collector, it was started a big project of the construction and
implementation of a wastewater treatment plant of Taboada. It has an original budget of 280
million dollars and plans to treat 14 cubic meters per second of wastewater of Lima and Callao.
The project is scheduled to begin at the end of this year.
National and local authorities and the population hope that with this treatment plant will be the
end to the problems encountered and a solution to avoid any risk of environmental pollution and
health.
Source: Department of Epidemiology, Ministry of Health, 2010
0
50000
100000
150000
200000
250000
2005 2006 2007 2008 2009
Nº TOTAL
EDAS
0.00
100.00
200.00
300.00
400.00
500.00
600.00
700.00
800.00
900.00
1000.00 IA X 10,000
HAB.
LIMA Nº Total de EDAS
CALLAO Nº Total de EDAS
LIMA IA X 10,000 HAB.
CALLAO IA X 10,000 HAB.
5
5. What are the major constraints to waste use or waste-resource recovery relating to
institutional/legal, cultural or perceptional aspects?
Both, the use and recovery of solid waste and wastewater are being promoted by the national
government and the municipality of Lima, and there is no institutional constraint on the subject.
An economic limitation is that there isn’t a legal framework for the sale of treated wastewater at
a national level.
On a cultural level, the use of wastewater for irrigation of green areas has a positive perception,
but there isn’t a positive perception to use this water for irrigation especially in the area of
vegetables. The use of urine and human feces for agriculture does not have a positive
perception.
B. Project supporting policies (questions should be directed to health and relevant
institutions)
6. Who is concerned about safety issues related to current formal or informal RRR
activities? If anyone, which activities are of concern?
The inappropriate use of solid and liquid waste is a latent concern at national and municipal level.
Ex: The used of residual water without treatment for agricultural or irrigation of green areas, the
inadequate use of organic solid waste to feed pigs.
Based on this potential risk among others, the Ministry of Health, through the General
Management of Environmental Health (DIGESA) introduced the "Regulations of Quality Drinking
Water", a document that establishes criteria and mechanisms to ensure the safety of the water
to ensure the health of the Peruvian population. It is planned to be enactment soon.
7. Are authorities aware of (or practicing) the new WHO (2006) guidelines for safe wastewater
irrigation, grey water and excreta use?
At the municipal level authorities are aware of the update of the guidelines, however, it has not
been developed a process to adapt the guidelines to local conditions and promote their
implementation.
8. Do authorities use the WHO promoted Water Safety Plan concept or something
comparable (name it) for safeguarding drinking water supply? Give the sources.
The water supply does not depend on the Municipality of Lima, the company depends on the
Water and Sewer Service of Lima - SEDAPAL.
The drinking water production is done through 3 treatment plants, two in the Atarjea, with a total
rated capacity of 17.5 m3 / s. These depend on the system of regulation of Rimac-Mantaro. The
third plant is in Punchauca, Chillon River basin, has a nominal capacity of 2.5 m3 and operates
through a concession to Consorcio Agua Azul SA,

6
Capacity of water production plant
In addition, groundwater is extracted from wells operated by SEDAPAL and private ones. It is
estimated a total of 3380 wells: 471 of SEDAPAL and 3359 wells are operated by users, of which
1626 are formal and 1733 are informal.
Formal and informal Wells in Lima and Callao
SEDAPAL wells are in the valleys of Rimac, Chillon, Lurin and Chilca. Of the 471 existing, only
158 are operational because there is availability of surface water, while the rest is in standby
(SEDAPAL, 2009). According to the company, the historical trend of increasing use of
groundwater has been reversed over the past 5 years now; nowadays, the extraction is below
safe operating flow of 6 m3 and the static level of wells is increasing.
9. Are there policies, plans and/or strategies supporting safe RRR from selected waste
streams? Which ones? What is encouraged? What not? Which organizations are involved
in the preparation and implementation of regulation?
m3/s m3/s % m3/s %
Rímac river Atarjea plant 1 y 2 18.5 18 80 16.5 80
Chillón river Chillón plant 2,5 2 9 1 (*) 5
Underground water wells 7,5 2.5 11 3 15
TOTAL 27,5 22,5 100 20,5 100
NOMINAL CAPACITY
NORMAL PRODUCTION
Source PRODUCTION UNITS
Avenidas
DEC - APRIL Estiaje
MAY - NOV
* Well System “Agua Azul S.A.”
471
1626
1733
pozos de SEDAPAL
pozos particulares con
licencia
pozos particulares sin
licencia*
SEDAPAL wells
Private wells with
license
Private wells
without license
* Informal wells don’t have license from ANA and SEDAPAL Source: ANA, SEDAPAL, 2009.

7
At National Level
The Ministry of Housing, Construction and Sanitation, through the Environment Office,
participated in 2008 in the Global SWITCH Project (Sustainable Water management improves
Tomorrow’s Cities’ Health), the goal of which is to build the capacities of decision-makers, urban
planners and others responsible for water management in Metropolitan Lima to design and
implement wastewater (gray and black) treatment and reuse systems for urban greening.
As a result of this process, the Environment Office with the cooperation of the SWITCH
Project, formulated a proposed Policy Guidelines document, which was approved on November
5, 2010 through Ministerial Resolution No. 176-2010-VIVIENDA; this resolution represented the
culmination of efforts which began in 2007, and the following entities participated in formulating
the guidelines: Ministry of the Environment, the National Water Authority, the National
Superintendence of Sanitation Services, the Potable Water and Sewer Service of Lima, the
World Bank, the Pan-American Health Organization through the Pan-American Center for
Sanitary Engineering and Environmental Sciences and the National Sanitation Directorate of the
Ministry of Housing, Construction and Sanitation.
Besides, there is the Law N ° 27314 - General Law of Solid Waste (LGRS) and its Regulations,
Supreme Decree N°057-2004-PCM, that established the institutional framework for the
management and solid waste management that responds to a comprehensive and sustainable
approach that links the dimension of health, environment and development, in the process of
government reform, public policy and private sector participation.
The first section of the law establishes rights, obligations, powers and responsibilities of society,
to ensure management and solid waste management, health and environmentally appropriate,
in accordance with the principles of minimization, prevention of environmental risks and
protection of health and welfare of the human person.
The Ministry of Health, as lead institution for health policy in the country, has set a priority for
solid waste, an action agenda in order to help to reduce risk factors significantly associated with
the environment, to protect and promote health of the population, especially those living in
poverty and extreme poverty. The law promotes the reuse of organic and inorganic solid waste.
Currently the Ministry of Environment is reformulating national policy of Solid Waste.
Finally, as it has been mentioned before, the Ministry of Health, through the General
Management of Environmental Health (DIGESA) introduced the "Regulations of Quality Drinking
Water", a document that establishes criteria and mechanisms to ensure water safety, to ensure
the health of the Peruvian population.
At City level
The Metropolitan Municipality of Lima is updating the solid waste ordinance metropolitan N°295
of 2000.The new ordinance will promote the appropriate use of organic and inorganic solid waste
at the metropolitan level.
10. Please list key sector policies with RRR section.
National Policy Guidelines to promote use of treated wastewater for green areas
These are the Policy Guidelines for promoting treatment systems that use domestic and
municipal wastewater for irrigating urban an peri-urban green areas developed by the Ministry of
Housing, Construction and Sanitation (Ministerial Resolution N° 176-2010-VIVIENDA):

8
GUIDELINE 1. Reusing treated domestic and municipal waste water for irrigating urban and peri-
urban green areas must be incorporated into sectoral policy, plans and strategies, in a way that
contributes to the integrated management of water resources on a national level, fostering the
substitution of potable water for said use.
GUIDELINE 2. Using effective technologies for treating domestic and municipal waste water for
irrigating urban and peri-urban green areas must be a part of national sanitation policy, along
with promoting and supporting the implementation of specific research that contributes to
improving the efficiency of the process, reduces the costs of water treatment and mitigates the
environmental impacts.
GUIDELINE 3. Active participation of the public sector, the private sector, civil society and
international organisms is key to strengthening the management of Water Resources, as well as
guaranteeing the principle of sustainability and ensuring financial support for managing the
treatment systems which reuse domestic and municipal waste water for irrigating urban and peri-
urban green areas.
GUIDELINE 4. Promoting citizen participation and the public access to the information must be
assured as a way of guaranteeing transparency, control and efficiency in managing treatment
systems that reuse domestic and municipal waste water for irrigating urban and peri-urban green
areas.
GUIDELINE 5. Strengthening of capacities and training for the diverse public and private
stakeholders must be a permanent part of sector policy. To achieve these specific resources
should be allocated to meet the needs of distinct stakeholders involved in treating domestic and
municipal waste water used for irrigating urban and peri-urban green areas.
National Law of Solid Waste
The National Law of solid waste includes in its policy guidelines the proper utilization of waste,
below those guidelines where adequate use of waste is mention:
Article 4. - Policy Guidelines
5. Develop and use technologies, methods, practices and processes of production and
marketing to promote the minimization or recycling of solid waste and its proper
management.
6. Encourage the reuse of solid waste and adopt complementary practices of treatment and
proper final disposal.
7. Gradually establish the selective management of solid waste, admitting the joint
management by exception, when significant health or environmental risks were not
generated.
11. Do any comprehensive investment or feasibility studies exist for RRR from any waste
streams which went beyond a small case study?
There is no study at the level of the city of Lima, but it is important to have a feasibility study that
links the potential supply (treatment plants that exist and can be built, recycling organic solid
waste in landfills, or decentralized areas where waste market can be treated, etc..) and demand
(green areas, agricultural areas, etc.).

9
12. Aside for normal incinerators, are there special incentives, policies, or regulations that
support the generation of electric or thermal energy from organic wastes (i.e., biogas or
combustion/gasification of agro-industrial or domestic waste)?
There is a National Award for Eco-efficiency awarded annually by the Ministry of Environment in
which private companies can apply to different categories. To date, there are no companies with
projects of energy generation from organic waste. There is a poultry company that has conducted
a biogas project of poultry manure and participates in the Clean Development Mechanism
(CDM).
C. Local partner capacity
13. Is there a local office of WHO, IWMI SANDEC, or Swiss TPH in the city to facilitate research
logistics, visa, conferences etc.? (leave answer blank; this will be answered by these
institutions)
14. Give names and contact data of 2-3 key local organizations (NGO, university departments,
research institutions, etc.) interested in RRR with likely capacity to coordinate other local
institutions (multi-disciplinary teams) and host students also from abroad?
Grupo GEA: Is an NGO founded in 1992. Since then, it has developed programs and projects
in water recycling and solid waste. It is the operator of the National Center for Cleaner Production
in Peru since 2007 in coordination with the Ministry of Environment. GEA Group has a contract
with Nippon Koei / BID to develop the Master Plan for Solid Waste of the Association of
Municipalities in Santo Domingo, Dominican Republic. This work is in its final stage and involves
the design of projects of recycling plants and landfill with treatment systems and leachate
recirculation for 4 million people. Currently, it is the responsible institution of the technical aspects
of the development of the new Solid Waste Law that is being prepared by the Ministry of
Environment.
IPES Promoción del Desarrollo Sostenible: It is a non-governmental organization with over
25 years working in the city of Lima. IPES provided technical assistance to the Ministry of
Housing, Construction and Sanitation in the development of the Policy Guidelines to promote the
use of wastewater for irrigation of green areas for which developed research and case studies
on existing experiences in treatment and reuse in Lima.
Agraria La Molina University - UNALM: Through the Horticulture Program of Agronomy Faculty
has advised several development projects related to food security an agricultural issues. In 2007
was a local partner in the Switch-Lima Project responsible for the elaboration and analysis of the
inventory of urban agriculture experiences in the city of Lima. Also through the Agricultural
Faculty developed research on use of alternative source of water for irrigation of crops and green
areas.
15. Which local authority/institutions/university/business schools or research institute could
be recommended to work with the project on data generation and knowledge exchange in
the areas of:
Sanitation and sanitation safety plans: Grupo GEA

10
Public health and risk assessment (epidemiological studies): QMRA, OMS
Environmental risk assessment: GRUPO GEA
Waste stream analysis and treatment options: UNALM/Grupo GEA/IPES
RRR for energy: Grupo GEA
Urban agriculture (soil fertility and irrigation): IPES/UNALM
Institutional analysis: Grupo GEA/IPES
16. Do any (multi-)stakeholder platforms or learning alliances exist from similar waste (reuse)
projects or initiatives which could be linked to for the discussion of RRR business plans
and/or SSP development?
These are the platforms formed that have been working together in order to carry out the
research activities, with different stakeholders from local governments, NGOs, CBOs and
universities.
Multi-Sectorial Committee
The Ministerial Resolution No.176-2010, where the "Policy Guidelines for the promotion of
treatment for the reuse of domestic and municipal wastewater for irrigation of urban and peri-
urban green areas" were approved, established in Section 2 the formation and coordination of a
Multi-Sectorial Committee to the Office of Environment of the Ministry of Housing, Construction
and Sanitation, formed by that institution, the National Water Authority, the Ministry of Health,
Ministry of Environment and the National Superintendence of Sanitation Services – SUNASS.
The Multi-Sectorial Committee therefore aims to provide a platform for planning and monitoring
of policy guidelines described above. To achieve this, it must generate the necessary
management tools for their development. The first meeting was held in 2010, and all the
institutions developed the Implementation Plan as the management tool used to plan the
committee's actions in relation to the priority activities in the Ministerial Resolution.
17. Do any local institutions have or had related RRR projects? Name project content or title
and approx. year. Was SANDEC, Swiss TPH or IWMI involved in any of these?
Grupo GEA: The Eco-Efficiency Centre and Social Responsibility (CER) of GEA Group is
supported by the Swiss Cooperation - DRY and has worked with EMPA. Currently, SECO has
confirmed support for an energy project with the coffee sector to be implemented by the RSC
with the participation of Mr. Hannes Zellweger of Switzerland.
IPES: SWITCH is a global initiative being led by a consortium made up of 32 institutions,
coordinated by the UNESCO-IHE Water Education Institute and is financed by the General
Research Directorate of the European Union. The project is being carried out in 11 cities around
the world: Accra, Alexandria, Beijing, Belo Horizonte, Birmingham, Chongqing, Hamburg, Lodz,
Tel Aviv, Zaragoza and Lima. In addition, the Emscher region of Germany has been included.
One of the global partners was IWMI.
18. Can ethical clearance/approval for medical research be easily obtained locally? What is
the process? What are the guidelines?

11
There is no specifically guidelines established, once you have a project, meetings with the
Ministry of Health are held to present the initiative and invite them and other stakeholders to be
part of it and support the development of the project.
19. List international and national airlines reaching the city regularly.
KLM is the best international airline for long trips (specially from Europe, Asia and Africa).
However, there are others like Lan Peru and Taca airlines. Both of them have daily national and
international flights. Other common airlines are: American Airlines, Copa, Peruvian Airlines,
Iberia and Avianca.
Lima has also become a focal point in connecting flights from South America to other continents,
so there is variety of schedules and availability to travel all around the world.
D. Demand for RRR i.e. waste resource recovery in industry, farming, construction, etc.
20. Which waste-based products a) have already a demand by whom in and around the city,
and b) which could have? Consider waste-derived fuel for cement kilns, irrigation water,
nutrients, organo-fertilizer, biogas, etc., and as sectors e.g. urban and peri-urban
agriculture, peri-urban agro-industry, parks and gardens, housing sector, aquaculture,
forestry, cement industry, other industry.
Treated wastewater is being used for irrigation of green areas and agriculture.
21. How big are the likely interested sectors approx.? e.g. in terms of size of (open-space)
farming (number of farmer or area), number/size of industries actually/potentially
interested in nutrient/water/energy?
12
For Zonal Parks
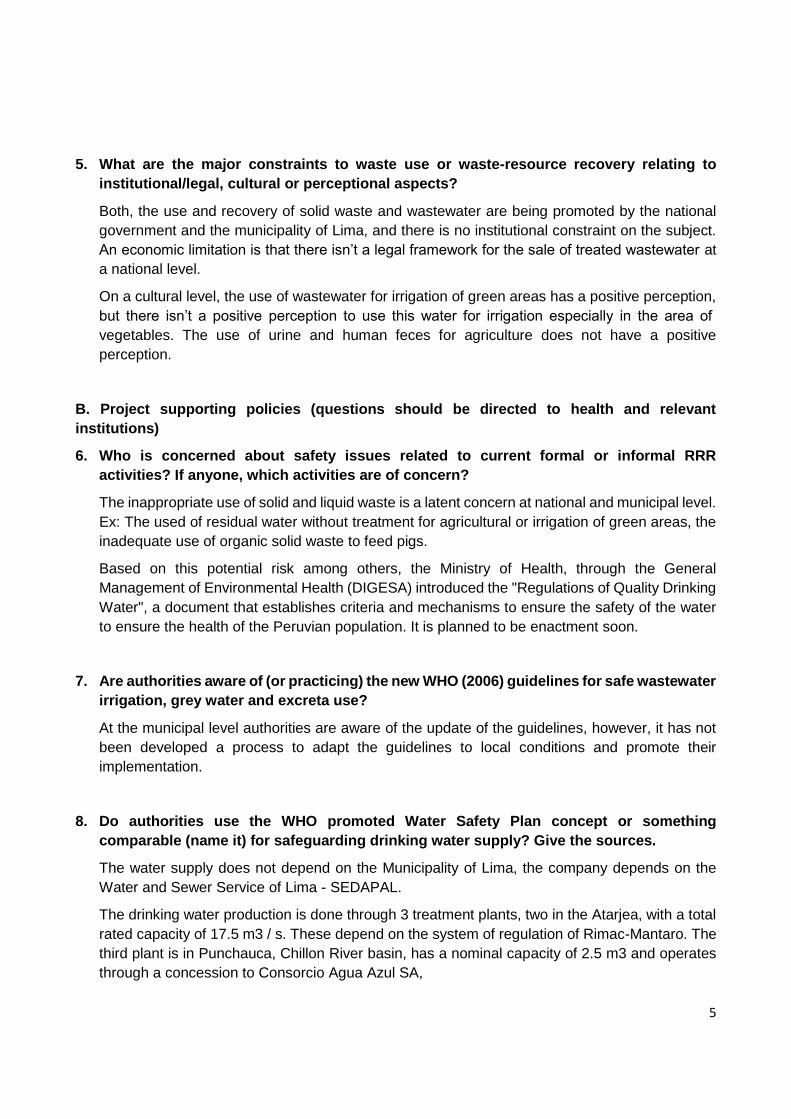
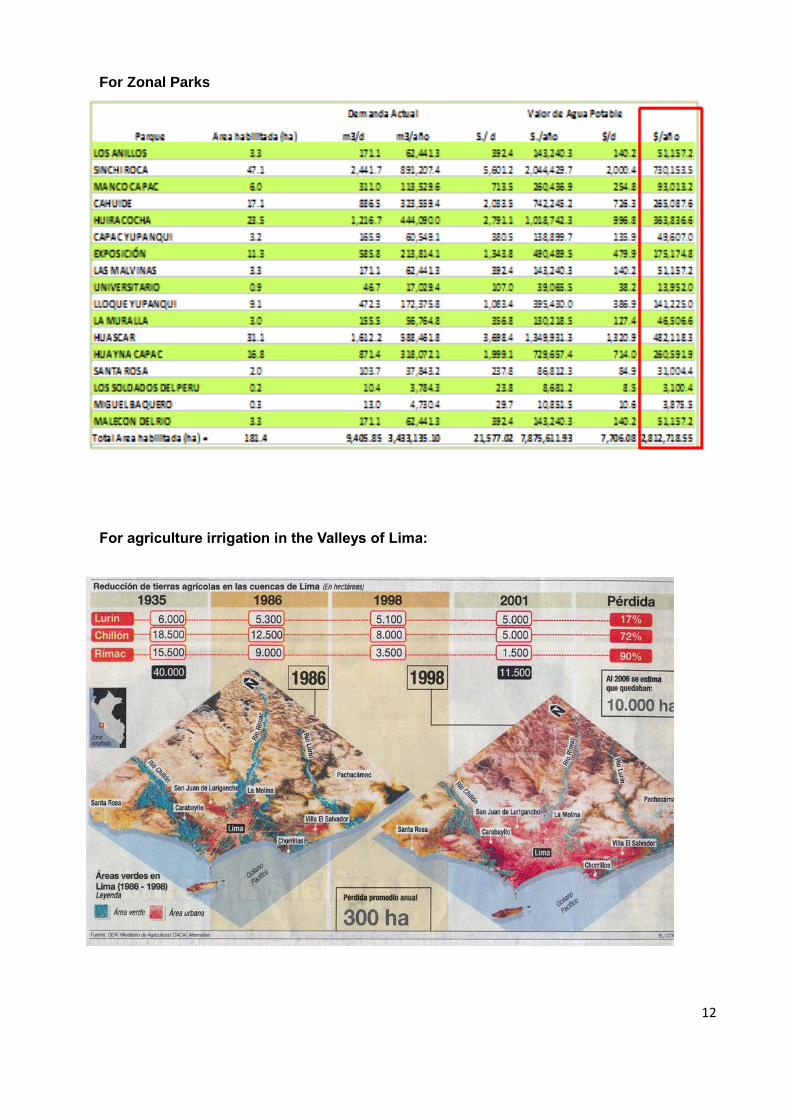
For agriculture irrigation in the Valleys of Lima:

13
22. Amount of rainfall per year (how many dry seasons/number of dry months) (important for
wastewater reuse)
The weather of Lima is warm and desert, and is influenced by the cold Humboldt Current, which
ensures minimum average temperatures ranging between 12 °C to 20 °C and maximum average
of 25 °C-30 °C. Rainfall is virtually absent, with an average of 15 mm per year, while the humidity
is very high, resulting in the presence of fairly continuous fog especially between May and
November.
23. Number, size and perennial status of a) streams crossing city or peri-urban area; b) are
they polluted by wastewater? c) are they used for formal or informal irrigation?
The most important streams crossing city or peri-urban área are RImac River, Chillon River and
Lurin River:
Rímac River: It has its origin in the melting of snow UCO, at 5.100 m.a.s.l. It has a total area
of 3,713.17 km2 with a wet surface area of approximately 2.211 km2 (61.2% of total area). It
covers a total distance of 138 km, with an average slope of 3.6%.
It has a semi-regulated regime, in the upper basin 21 ponds have been identified. They store
a usable volume of approximately 284.27 MMC, corresponding to Santa Eulalia Basin 77.63
MMC, the Rimac Basin 48.30 MMC and the Mantaro Basin 158.34 MMC. The San Mateo
river with a slope of 4.5% and Santa Eulalia river with a slope of 6.3%, formed the Rimac
River, upstream from the town of Chosica.
It is a reference that the average annual precipitation ranges from 10.20 mm (International
Airport to 13 m.a.s.l.) to 870 mm (San Cristobal, 4,600 m.a.s.l.). Between December to
March, precipitation is higher, and between April and November, rainfall is lower. The Rimac
River supplies 80% of the population of Lima and is the most polluted waterway. It receives
discharges from mining, industry, city and agricultural drains along its route from the upper

14
basin. In a recent diagnosis, the Ministry of Environment has identified 62 industrial
discharges, mining and domestic that discharge a total of 3,188 liters per second into the
river, and 22 drains of waste that discharge 22 tons daily.
Polluting factors Total
Industrial wastewater dumping 28
Passive environmental wastewater dumping 10
Domestic reuse wastewater dumping 1
Domestic wastewater dumpling 39
Irrigation wastewater dumping 4
Solid waste dumps 91
Sub total 173
Pipes connected to the river for domestic wastewater
dumping. Intermittent.
488
Chillon River: The river originates in Chonta Lake at 4,850 m.a.s.l., capturing rainfall in the
upper parts of its collector area and the melting of the “Widow Range”. It has a length of 126
km and an average slope of 3.8%.
Its maximum flow occurs between the month of December to April. It has a semi-regulated
regime. In dry season from August to mid-December, water resources for irrigation comes
from regulated Chuchón, Leoncocha and Azulcocha lagoons, to an approximate volume of
19.2 MMC.
The monthly average discharge, historically, is 8.97 m3/sec, the minimum discharge of 0.59
m3/sec and peak discharge of 180 m3/sec, which occurred in March 1964. Discharges to
75% of persistence range of 1.12 m3/sec in September to 14.65 m3/sec in March.
In Chillon River, it is a Basin Board Users, called the Board of Users of the Sub District of
Irrigation in Chillon, which is responsible for managing the Water Resources; recognized by
Administrative Regulation No. 32. The river receives a large number of discharges without
treatment and are used in agriculture irrigation.
Lurín river: It begins in the melting of Mount Surococha, at 5,000 m.a.s.l., receiving
precipitation from the upper collector and the melting of glaciers. In the first three months of
the year, run about 63% of its annual discharge. From May to November (dry period),
download only about 15% of the annual total.
Surface waters of the Lurin river, are the main source of the valley, has irregular discharge
regime and torrential character, with extreme differences between their parameters. The
maximum discharge recorded is 12.12 m3/sec and the minimum is 0.00 m3/sec, with an
average of 4.61 m3/sec. The results of monitoring conducted in 2005-2009, show that most
concern are domestic effluents and garbage in the last stretches of the Lurin river (Strategic
Technical Group of Chillon, 2010 and DIGESA, 2010). In 2010, even shrimp are caught up

15
to Cieneguilla: the Lurin can be considered a clean river in the middle of the metropolis, a
resource that should be treasured.
For all rivers, it is registered the formal and informal use. One example is that it is often used for
irrigating farmland, which represents a risk to public health.
24. Would treated wastewater have a possible market? Why Yes or No. If Yes, for whom?
Since it does not rain in Lima and the main rivers in the city are contaminated, the use of treated
wastewater is a very important market in the city for parks and for agricultural use. In the case of
the green areas the potential is higher as districts that currently have a significant percentage of
green area per capita irrigated them with water, and since 2013 the rate of drinking water for
irrigation of green areas will increase in a 100% according to the rules of the National
Superintendence of Sanitation Services (Resolution of the Board of SUNASS 008-
2012/SUNASS-CD). For all rivers, is recorded using both formal and informal. One example is
that often are used to irrigate farmland, which represents a risk to public health.
25. Which farming systems (like urban vegetable farming or peri-urban pineapple or firewood
plantations) are most likely to use organic waste fertilizer, and on which crops?
Organic waste fertilizers used on crops are currently the urine, the biol, composted manure and
waste, both for vegetables and for pineapple plantations in urban and peri-urban areas.
E. Ongoing reuse activities of interest for Sanitation Safety Plans (SSP)
26. Are there any public (or public-private) projects on RRR from any domestic (household or
market waste; excreta, wastewater), or agro-industrial waste streams (cassava peelings,
food processing waste, cotton husks, etc.) in operation?
The public (and/or public-private) projects on RRR in Lima in operation, process and as new
projects:
Green Areas of the National University of Engineering (San Martín de Porres) – Municipality
of San Martin de Porres
Punta Hermosa (Punta Hermosa) – Municipality of Punta Hermosa
Huerto Comunal (Villa María del Triunfo) – Municipality of Villa María del Triunfo
Costa Verde (Miraflores) – Municipality of Miraflores
Green Areas of Surco (Surco) – Municipality of Surco
Alameda de la Solidaridad (Villa El Salvador) – Municipality of Villa El Salvador
Alameda de la juventud (Villa El Salvador) – Municipality of Villa El Salvador
Huascar Zonal Park (Villa El Salvador) – Municipality of Villa El Salvador
Oasis de Villa (Villa El Salvador) – Municipality of Villa El Salvador
Vial Universitaria (Carabayllo) – Municipality of Lima and Municipality of Carabayllo
Z. Aguirre (Los Olivos) – Municipality of Lima

16
Eduardo Habich (San Martín de Porres) – Municipality of Lima
Av. Colonial (Callao) – Municipality of Lima
Vía Expresa Grau (Lima) – Municipality of Lima
Puente Huaylas (Chorrillos) – Municipality of Lima (in process)
Vial Norte (Los Olivos) – Municipality of Lima (in process)
Tomás Valle (Los Olivos) – Municipality of Lima (in process)
Caqueta (Lima) – Municipality of Lima (new Project)
Acho (Lima) – Municipality of Lima (new Project)
Parque 26 (Villa El Salvador) – Ministry of Housing, Construction and Sanitation
Green Areas of Jerusalen y Piedras Gordas (Puente Piedra) - Ministry of Defense
27. Is there an informal sector active in RRR from organic waste? (which waste for which
purpose)
Organic waste that the informal sector recycles is mainly used to raise pigs in unsanitary
conditions.
28. Are farmers or others using any domestic or agro-industrial waste products, raw or
treated? Do they pay for it? Is the use regulated or informal? If regulated, by which
regulation/authority?
There are 18 experiences that used wastewater for agriculture activities. 15 of them are located
in peri-urban areas, and 3 are located in intra-urban areas. All of them have a total of 753.5 ha.
There are two experiences, the Agriculture Zone of San Agustín and the Agriculture Zone of
Chorrillos, which untreated wastewater is also being used. Farmers don’t have to pay; they get
it through agreements of delivery because there is no legal framework for sales yet.
29. Name private entities actively working on reuse (which waste, which output; how big are
these firms; web link). Are there e.g. compost producers in the private sector, community
based, or NGO/Research projects?
For the construction, operation and maintenance of wastewater treatment plant, we have the
following ones CTG Capital, ITT, Korimayo/Dessau.
Composting is done in some municipalities in a small scale. Parks and Gardens waste is used to produce compost in municipal nurseries. Regarding private sector companies, INGEMEDIOS produces compost with municipal organic waste. This is the only company that performs this task formally. His website is: http://www.ingemedios.com.pe/
30. Are any reuse-related environmental or health issues known? Are they being addressed?
Every day there is more awareness of health, environment and waste. The Ministry of
Environment (MINAM) is finalizing the development of a new Solid Waste Law which states the
need to promote the concept and practice of energy for waste (waste-to-energy). The MINAM

17
has a national program of investment in solid waste of $ 100 million donated by JICA, IDB and
SECO. This program will impact on issues of health, environment and waste.
31. List all major RRR related projects (wastewater irrigation/aquaculture; organic
fertilizer/composting, energy/biogas/fuel; ecosan) operating in the city over the last 5
years as well as (all) ongoing ones with their main external and local partners and if
possible donor or provide web sites of those projects.
These are some of the most representative RRR related projects implemented over the last 5
years.
Description Donor Year
Project to Strengthen Community Gardens of Villa Maria del Triunfo
Red de Energía del Perú – REP
2011
Improving Food Security of Women Teenager and Teenager Mother through UA
Heifer International 2009 - 2010
RUAF – From Seed to Table – FSTT (De la huerta urbana a la mesa)
Ruaf Foundation 2009 - 2011
Enhancing Capacity for Innovation, Increasing Productivity and Access to Markets by Peri-Urban Producer Organizations in Latin America
IDRC – Canada 2007 - 2010
Optimizing water management to combat urban poverty
CORDAID (Holland) 2007 - 2009
Sustainable Water Management Improves Tomorrow’s Cities Health – SWITCH
Unesco – IHE Institute for Water Education
2007 - 2009
Project to Strengthen Community Gardens of Villa Maria del Triunfo
Red de Energía / Luz del Sur
2005 - 2007
Cities Farming for the Future – CFF Programme
Ruaf Foundation 2005 - 2008
Diagnosis of solid waste management Municipality of Santiago de Surco
2011
Good Environmental Practices Empresa Compañía Eléctrica El Platanal S.A. – CELEPSA
2011
Promotion of health education into the homes of human settlements in Villa El Salvador - PROMOSAN
ECODES - AECI 2010 - 2012
Electricity Generation from Biogas Project PETRAMAS 2011 - 2012
Strengthening municipal of solid waste management
Electric Company Inc. Platanal - Celepsa
2010
Corporate Social Responsibility for the Management of Electronic Waste in Peru
EMPA, Swiss Federal Laboratories for Materials Testing and Research
2009 -2011
School ecobusiness SAHEE (Suiza)
2009 - 2010
Design of collection centers of used oils of the Breña Service Center and Headquarters of SEDAPAL
Water and Sewer Service SEDAPAL
2009

18
Design of waste management system in the offices of Coca Cola
Coca Cola Perú Services 2008
Corporate Social Responsibility for the Management of Electronic Waste in Peru
EMPA, Swiss Federal Laboratories for Materials Testing and Research
2008 - 2010
Review of three educational manuals on waste management, wastewater treatment and environmental education for shelters
Ministery of Tourism and External trade (MINCETUR)
2004 - 2008
Diagnosis, awareness and dissemination of electronic waste management in Lima
EMPA, Swiss Federal Laboratories for Materials Testing and Research
2007
Formulation of the Integrated and Sustainable Management of Solid Waste Project in Lima
PNUD y Municipality of Lima
2007
32. Is there any <white elephant> project of significant RRR failure? Which, reasons?
33. Is there irrigation with (i) polluted water/wastewater or (ii) treated or (iii) partially treated
wastewater? (any info on locations, approx. number of farmers or ha). Is the use
regulated? If yes, by which regulation/ authority?
There are three experiences that use untreated wastewater, the Agriculture Zone of San Agustin,
the Agriculture Zone of Chorrillos and the Green Areas of the Pontificia Catholic University of
Peru. The two first ones are located in peri-urban areas and are managed by the Users of
Irrigation of their district. The last one is located in an intra-urban area and managed by the
University. All of them has a total area of 468 ha and produces a flow of 716 l/s. They represent
40% of the total area irrigated with wastewater in Lima.
34. Is there agricultural use of (i) fecal sludge or only (ii) feces or (iii) urine (fresh or treated)
ongoing? (any info on locations, approx. number of farmers or ha) Is the use regulated?
If yes, by which regulation/authority?
No. However, in some agricultural areas of Callao, is still used untreated wastewater for irrigation
cropland products. This is illegal.
35. Is there use of other organic waste (fresh or composted) ongoing? (any info on locations,
approx.. number of farmers or ha) Is the use regulated? If yes, by which
regulation/authority?
There is no information registered about it.
36. Are waste products already used for energy recovery? If yes, which waste for which
purpose and which approx. scale?
There is no reference of such uses in Lima.
19
37. Are there competing uses for the waste e.g. as fuel, livestock or aquaculture feed, which
compete with RRR e.g. for nutrients or energy? If yes, which waste for which purposes
and at which scale (small/medium/large)?
There are no competing uses for the waste.
38. Are there major sources of alternative fertilizers that are likely to be cheaper than waste
based products, e.g. like nearly free farm yard manure? Chicken manure?
There are no cheap alternative fertilizers.
39. Are industrial fertilizer subsidized? Which ones, how much? Or what is the price e.g. for
50kg Urea or 50 kg NPK 15-15-15)?
There is no subsidized fertilizer. A 50kg bag of urea costs $ 40.00.
F. Waste supply and management in the city
40. Population size of the city (with year of reference) and official city area.
Area (km2): 242 7 hab/km2 (INEI, Census 2007)
Population: 8 445 211 (30.8% of the total population in Peru - INEI, Census 2007)
Lima is divided in 43 districts, each of the districts have a Major and a Town Council elected
democratically by the inhabitants of each district.
Lima also has a Main Major elected by the inhabitants of all Lima, this major y above the
districts majors. The Main major is called the Major of Metropolitan Lima and he/she is in
charge of the Metropolitan Municipality of Lima. Actually the Major Susana Villaran de la
Puente the first women elected and she is from a left political party.

20
Table: Districts of Lima and inhabitants
Nº District Inhabitants
1 Ancón 33,367
2 Santa Rosa 10,903
9 Carabayllo 213,386
10 Puente Piedra 233,602
11 San Martín de Porres
579,561
12 Los Olivos 318,140
13 Comas 486,977
14 Independencia 207,647
15 San Juan de Lurigancho
898,443
16 Lima 299,493
17 Breña 81,909
18 Rímac 176,169
19 El Agustino 180,262
20 San Miguel 129,107
21 Pueblo Libre 74,164
22 Jesús María 66,171
23 Magdalena del Mar 50,764
Nº District Inhabitants
24 Lince 55,242
25 La Victoria 192,724
26 San Luis 54,634
27 San Isidro 58,056
28 Miraflores 85,065
29 Surquillo 89,283
30 Barranco 33,903
31 San Borja 105,076
32 Santiago de Surco
289,597
33 Chorrillos 286,977
34 Santa Anita 184,614
35 Ate 478,278
36 La Molina 132,498
37 Lurigancho-Chosica
169,359
38 Chaclacayo 41,110
39 Cieneguilla 26,725
40 Pachacámac 68,441
Nº District Inhabitants
41 San Juan de Miraflores
362,643
42 Villa María del Triunfo
381,790
43 Villa El Salvador 378,470
44 Lurín 62,940
45 Punta Hermosa 5,762
46 Punta Negra 5,284
47 San Bartolo 6,412
48 Santa María del Mar
161
49 Pucusana 10,633
35
36
37
38

21
Map of Lima
The following districts are not part of the province of Lima, they are part of the province of Callao.
Callao is not governed by the Metropolitan Municipality of Lima, is jurisdiction of the Municipality
of Callao:
3 Ventanilla 277,895
4 Callao 415,888
5 La Punta 4,370
6 Carmen de La Legua-Reynoso 41,863
7 Bellavista 75,163
8 La Perla 61,698
41. Solid waste collection coverage (percent of population serviced; year of reference)?
The municipalities have the responsibility for solid waste management. Each one usually works
in isolation and independent and is a direct provider of public cleaning service. The waste
management is regulated by various standards. The most important is the Solid Waste Law No.
27314 of 2000, amended by DL 1065 of 2008.
The 85.8% of all solid waste is collected by the collection vehicles (trucks, rail, compactors,
motocars and tricycles), the remaining 14.2%, equivalent to 1.054 MT / day, is not collected and
ends in informal dumps where are recyclers and scavengers, who burn and throw the waste
away the river.
Of all the waste collected, a proportion is transported to transfer stations, then they are
transported by trucks of large capacity (40TM) to the landfill. In Lima and Callao are located 6
transfer stations.

22
42. Solid waste collection carried out by municipality or private sector or both? Is there any
source separation going on? (how many households) Or any segregation after collection?
In Lima and Callao there have been carried out various projects of both public and private sectors
to improve solid waste management in the context of evolving regulations. The Solid Waste Law
No. 27314 of 2000 was amended in 2008 by DL 1065. This new version, has adapted functions
of organisms associated with solid waste management, as MINAM, DIGESA, district
municipalities, provincial municipalities, MTC, among others. In addition, budget priorities were
defined for this subject (SINIA, 200178).
One of the most important initiatives carried out in the country is the National Investment in Solid
Waste Project of MINAM: Although it doesn’t include Lima and Callao, it is expected that its
magnitude has a significant impact across the sector. This program covers 30 villages of Peru
and brings additional investment to improve the legal and institutional framework. From this point
of view, it will be beneficial to all cities, comprising Lima and Callao.
Specifically in the field of municipal strengthening, it should be mentioned the Certification for
Local Sustainable Environmental Management (GALS) which was an incentive that was given
until 2009 to those municipalities that had an integral environmental management plan. For this,
the plans needed to comply with various requirements, such as have been developed in a
participatory way, have studies to perform an environmental diagnostic, an action plan and an
environmental agenda, including an Integral Plan of Environmental Management of Solid Waste
(PIGARS), among others. In Lima and Callao, at least 13 districts have achieved this certification
and 15 made their PIGARS. GALS certification was enriched with a new approach of
environmental management by the Ministry of Environment (MINAM) that currently promotes the
program "Eco-efficient municipalities," which already has a manual and various instruments in
this regard.
43. Approximation of how much of the city is sewered (percentage of households connected
to sewerage)? Approximation of how much of the wastewater entering sewers is
eventually treated and to which level (i.e. primary, secondary, tertiary)? Estimated
percentage of treatment plants that work as designed?
While Lima and Callao have progressively improved their drinking water and sanitation, more
than 1 million of Lima does not have water and supplies from standpipes, tankers or systems
mixed networks + trucks. SEDAPAL makes an effort to improve and expand the service of a
growing urban population and an aggressive horizontal and vertical expansion. Currently, the
water network reached 11.763 km and covers 87% of the population living in metropolitan area.
The sewerage network reaches 10.553 km and 82.7% of the population is connected to the
system (SEDAPAL, 2008). The people who doesn’t have this service (1 million 353 thousand)
use alternative systems such as sewer condominial, latrines and septic tanks.
Coverage of water and sewerage in Lima and Callao.
Population with access to potable Water Network
Population with access to the sewer

23
Lima produces almost 18 m3 / s of wastewater, which are removed through 9 issuers: only 4 of
these plants discharge waste water treatment. Only the 15.1% of wastewater is treated in 16
treatment plants and effluent is not reused enough. The volume of treated wastewater will
increase when Taboada and La Chira plants start their operation at the end of 2012.
Wastewater Treatment plants operated by SEDAPAL
Name
Location
Volume til
Dic 2008
(L/s)
System
Use of effluent
North
Puente Piedra San Martín de Porres 364 Activated sludge None
Ventanilla Ventanilla 301 Anaerobic, aerobic and
facultative
Agriculture
Ancón Ancón 44 Oxidation pond Green areas irrigation
Santa Rosa Santa Rosa 6 Percolating filter Green areas irrigation
Taboada Callao (1)
Centre
Carapongo Ate Vitarte 460 Anaerobic – aerobic None
San Antonio
Carapongo
S.J.Lurigancho 18 Activated sludge Green areas irrigation
Sede Atarjea El Agustino 3 Activated sludge Green areas irrigation
South
San Bartolo Lurín 775 Aerated lagoons None
San Juan S. J. de Miraflores 428 Aerated lagoons Green areas irrigation
Huáscar – Parque 26 Villa El Salvador 73 Aerated lagoons Green areas irrigation
José Gálvez Villa María del Triunfo 50 Anaerobic - aerobic Green areas irrigation
San Pedro de Lurín Lurín 15 Anaerobic – aerobic Green areas irrigation
J.C. Tello Lurín 13 Oxidation ponds None
Nuevo Lurín Lurín 5 Oxidation ponds Green areas irrigation
Pucusana Pucusana 4 Oxidation ponds Green areas irrigation
Punta Hermosa Punta Hermosa 12 Oxidation ponds Green areas irrigation

24
44. How many households or estimated percentage of the city depend on on-site sanitation
systems for fecal sludge storage? What kind of onsite FS systems are there in percent
(pit latrines, public toilets, household septic tanks, Urine diverting dry toilets, etc.)?
While Lima and Callao have progressively improved their drinking water and sanitation, more than 1 million of Lima does not have water supplies and standpipes, tankers or trucks networking mixed systems. SEDAPAL makes an effort to improve and expand the service of a growing urban population and an aggressive horizontal and vertical expansion. Currently, the water network reached 11.763 km and covers 87% of the population living in metropolitan area.
The sewerage network reaches 10.553 km and 82.7% of the population is connected to the system (SEDAPAL, 2008). The people who do not have this service (1 million 353 thousand) use alternative systems such as condominial sewerage, latrines and septic tanks.
45. Who is cleaning septic tanks and latrines? Are there trucks with vacuum pump (maybe
called cesspit tank operators, honey suckers, etc.)? Are they operated by the public or
private sector or both? Any number of trucks available?
The cover of sanitation is 88%. Lack of sanitation is basically on slopes / hills informally inhabited,
which use latrines. Latrines are maintained by the population.
46. Is the municipality or private sector or both in charge of fecal sludge collection in the city?
How many septic trucks are approximately operating across the city? Share of vacuum
trucks vs. manual collection?
This does not exist in Lima, there are all connected to the sewer.
47. Where are most on-site systems in the city? Only in slums/low-income class areas? Or
also in high-class areas etc.?
The cover of sanitation is 88%. Lack of sanitation is basically on slopes / hills informally inhabited
by people in poverty and extreme poverty.
48. Where is the collected fecal sludge (FS) from on-site septic tanks deposited/dumped?
Percentage estimates: In septage ponds, other treatment plants, in water bodies/ocean,
in land depressions/environment, in farms for crop production, elsewhere (please
specify)?
Information is not available.
49. What is the approximate FS quantity disposed of in official places per year vs. unofficial
sites?
Information is not available.
25
50. Please provide a brief description of the major commercial activities in animal husbandry,
food industry and other agro-industrial (e.g. cotton) processing sub-sectors in the city?
Who are the big players providing significant processing or agro waste?
Information is not available.
51. Are there any data how much organic waste the major 5 to10 companies operating in
these sub-sectors generate e.g. per year?
There is no reference of the information requested. It is known that the minimum 50% of household waste is organic.
G. Pollution and sanitation
52. What kinds of industries (e.g. beverage, chemical, textile, food, sugar) are there in the city
and discharging waste? Is the industrial waste treated in each case? Which one not?
There are several industries discharging wastewater in the city of Lima basically from beverage,
mining, recycling, textile, paper and agricultural sector. Not all of them are treated, the mining
and beverage industries are the ones that discharge untreated wastewater but administrative
penalties have already been imposed by the Municipality of Lima for these actions.
53. Are there any reports on the probability of chemical contamination (heavy metals) of
organic and/or liquid waste streams? Could you cite related reports/papers?
Since January of 2012, the National Water Authority began a process of participative monitoring
of the three rivers of the City of Lima. The first results were presented at a reunion / workshop
for the Rio Rimac being the main conclusions as follows:
The Rimac river, its tributaries and Bocatoma La Atarjea are contaminated with certain metals
(aluminum, arsenic, cadmium, iron, manganese and lead), organic matter, oxidizable matter
and Coliform thermotolerant), whose concentrations exceed the values of the Category 1 -
A2 (water which can be drinkable with conventional treatment) and Category 3 (irrigation of
plants and animals drink) of the Environmental Quality Standards for Water (ECA)
established by Supreme Decree No. 002-2008-MINAM. This has more incidences on the
bottom of the basin.
In the upper and half basin of the Rimac River, the main sources of pollution are the mining
tailings, mine shafts and mining debris deposits (mining environmental liabilities), discharge
of domestic and municipal wastewater from various villages.
Surface waters of the Rimac River, are the main source of water for the population that uses
about 500 MCM / year, equivalent to 15.90 m3 / s (78% 97% demand), for irrigation of about
4162 ha, that consumes about 103 MCM / year, equivalent to 3.8 m3 / s (16.56% of total
demand in the basin) for the mining, industrial, power generation and for small-scale fish
production.
See Annex 2

26
54. Have any food safety/health issues been reported due to wastewater irrigation? By
whom? Citation/reference?
As it is answered in question 4, the rate of acute diarrheal diseases (ADDs) is one of the
indicators associated with the sanitary quality of drinking water. The Health Ministry reported
almost 280,000 cases in Lima and Callao in 2009, reversing a downward trend in the last five
years. The cumulative incidence (AI) per 10,000 population doubles in Callao Metropolitan Lima.
It is estimated that 30% of all cases is directly related to water quality (OACA, 1997). The
Demographic and Family Health (DHS, 2006) that built this information considered homes using
treated water, using appropriate storage or not stored, wash the containers with a less than a
week frequent and do not use containers that previously held chemicals or toxic.
H. Energy situation (per country if not per city) – needs sector expert assistance
55. Percent of rural/urban population with access to electricity from the grid?
Until June 2011, there is registered an 88.8% (total), and 61.2% (rural).
56. Please list the institutions/companies responsible for generation, transmission, and
distribution of electricity in the country and elaborate briefly on their respective roles and
responsibilities, including ownership.
Generation
In 2006, 38 companies generated electricity for the market, while 78 companies produced
electricity for own use. Among the 38 companies that supplied power to the market, four
accounted for 70% of total capacity:
EDEGEL S.A.A.: 1.574 MW
Electroperú S.A. (ELP): 1.032 MW
Energía del Sur S.A. (ENERSUR): 725 MW
EGENOR: 522 MW
ELP dominates the hydroelectric production with 32% of the total, while EDEGEL leads the
thermal generation, also with 32% of the total.
Private companies dominate the generation sector. In terms of participation, state-owned
companies account for 31% of generation capacity, while 69% is in private hands. Production
rates are 40% and 60% for state and private companies respectively.
Transmission
The 100% of the transmission activities in Peru is in private hands. In 2006, there were 6
companies exclusively dedicated to the transmission involved in electrical transmission in Peru:
Peru's Energy Network SA (REPS), with 28% of transmission lines, and Huancavelica Energy
Consortium (CONENHUA) Transmantaro SA Consortium (SA Transmantaro) Eteselva SRL,
Peru ISA Electric Interconnection (ISAPERU) and Red Electrica del Sur SA (REDESUR), with

27
15% of the lines. The generation and distribution companies and those that generates electricity
for own consumption operate the remaining 57% of the transmission lines.
Distribution
In 2006, 63% of electricity was traded through 22 distribution companies, while 37% was
marketed through generation companies. The companies distinguished by their sales to final
consumers were: Luz del Sur (21%), Edelnor (21%), Enersur (9%), Edegel (8%), Electroperú
(5%), Hidrandina (4% ) Termoselva (4%) and Electroandes (4%).
The public distribution companies supply electricity up to 55% of existing customers and 45% is
held by private companies. However, in terms of electricity distributed, private companies lead
with 71% of the total compared to 29% for public companies.
57. What entities regulate the energy sector? Please briefly describe their roles and
responsibilities?
The General Direction of Electricity (GDE), dependent of the Ministry of Energy and Mines
(MEM), is responsible for establishing policies and regulations of electricity and concessions. It
is also responsible for elaborating the expand plans of the generation and transmission and must
approve the relevant procedures for the operation of the electrical system.
The Supervisory Organization of Investment in Energy and Mining (OSINERGMIN), created in
1996 as OSINERG (the competences on mining skills were added in January 2007, then the
specific competence on environmental mining issues were forwarded to OEFA) performs its
tasks in the field as set out in the Electricity Concessions Law (ECL) in 1992 and the Law to
ensure the efficient development of Electricity Generation (Generation Efficiency Law) of 2006,
among others. In addition, the OSINERGMIN is responsible for enforcing tax obligations on
licensees as provided by law and regulation. Finally, it is responsible for monitoring the fulfillment
of the functions of the Economic Operation Committee of the System (EOCS) and for determining
every six months the percentages of participation of companies in the market.
In 2000, OSINERG merged with Electricity Tariffs Commission (ETC), now called Deputy
Management of Rate Regulation (DMRR). Together they are responsible for setting the charges
for generation, transmission and distribution and rate adjustment conditions for final consumers.
They also determine the rates of transport and gas distribution by pipeline.
In the case of rural electrification, the General Management of Rural Electrification (GMER) is in
charge of the National Rural Electrification Plan (NREP), which is part of the policy guidelines
set by the Ministry of Energy and Mines. The DGER is responsible for the implementation and
coordination of projects in rural areas and regions of extreme poverty.
Finally, the National Institute for the Defense of Competition and Intellectual Property Protection
(INDECOPI) is responsible for monitoring compliance with the AMA and oligopoly 1997.
58. Total installed electric capacity (MW) and annual electric generation (e.g. in Megawatt,
MW) by fuel source? Please include a breakdown of renewable energy generation by
source.
In the year 2010 the installed capacity of electric power nationwide, increased in 613.7 MW. The
Central y Central Units that began to generate power are: the Central Hydro Electric Company

28
El Platanal of 220 MW of the Electric Company El Platanal (CELEPSA), the third unit to natural
gas of the Central Power Plant of Kallpa of 192.3 MW, of the Kallpa Generation company, the
Central Power Plant Las Flores of 192.5 MW, of the DUKE ENERGY company EGENOR, the
first stage of the hydroelectric plant RONCADOR of 1.9 MW of the MAJA ENERGY company,
and the Central Hydroelectric Plant Santa Cruz II of 7 MW of the SANTA CRUZ Electric
Company.
59. Total electricity exported/imported?
Exportation in kv/hr
Source: http://www.indexmundi.com/map/?t=0&v=83&r=sa&l=es
29
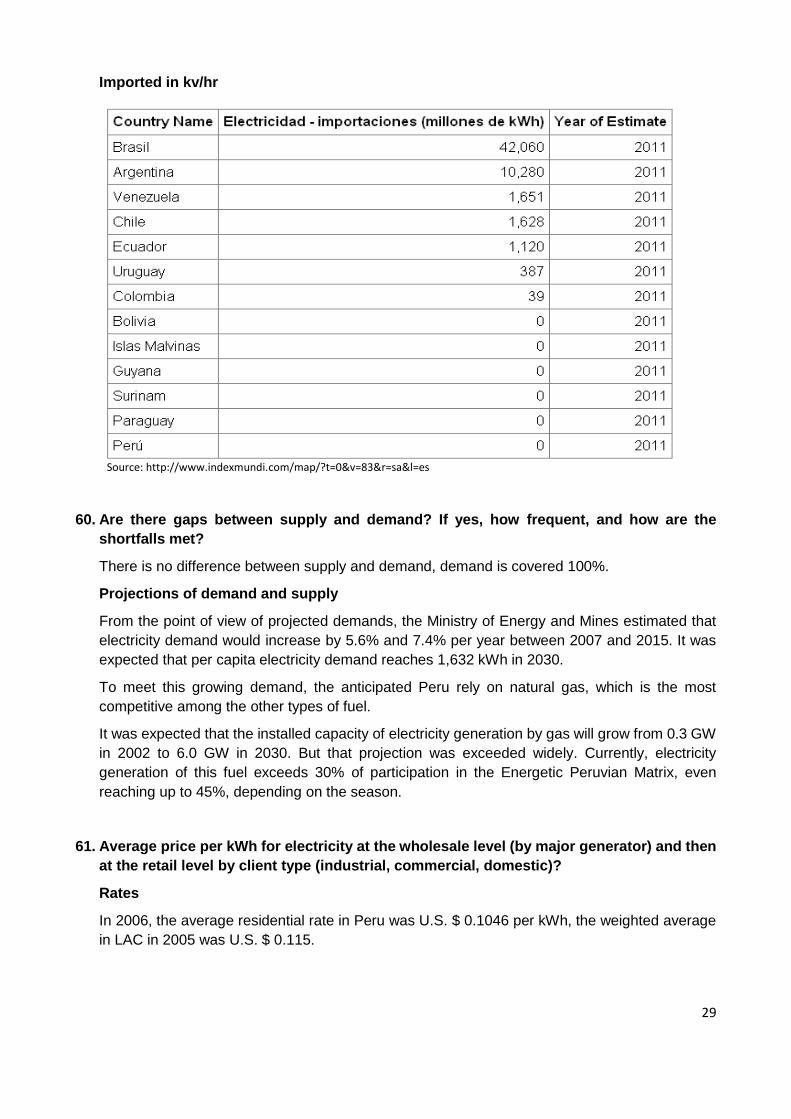
Imported in kv/hr
60. Are there gaps between supply and demand? If yes, how frequent, and how are the
shortfalls met?
There is no difference between supply and demand, demand is covered 100%.
Projections of demand and supply
From the point of view of projected demands, the Ministry of Energy and Mines estimated that
electricity demand would increase by 5.6% and 7.4% per year between 2007 and 2015. It was
expected that per capita electricity demand reaches 1,632 kWh in 2030.
To meet this growing demand, the anticipated Peru rely on natural gas, which is the most
competitive among the other types of fuel.
It was expected that the installed capacity of electricity generation by gas will grow from 0.3 GW
in 2002 to 6.0 GW in 2030. But that projection was exceeded widely. Currently, electricity
generation of this fuel exceeds 30% of participation in the Energetic Peruvian Matrix, even
reaching up to 45%, depending on the season.
61. Average price per kWh for electricity at the wholesale level (by major generator) and then
at the retail level by client type (industrial, commercial, domestic)?
Rates
In 2006, the average residential rate in Peru was U.S. $ 0.1046 per kWh, the weighted average
in LAC in 2005 was U.S. $ 0.115.
Source: http://www.indexmundi.com/map/?t=0&v=83&r=sa&l=es
30
In the deregulated market, the average rate for final consumers was U.S. $ 0.0558 per kWh for
the electricity supplied directly by generators and U.S. $ 0.0551 per kWh for the electricity
supplied by distribution companies.
Subsidies
In November 2001, Law No. 275010 established the Electrical Social Compensation Fund
(FOSE). The Fund established a system of cross-subsidy among consumers that benefits users
with a monthly consumption lower than 100 kWh through fixed and proportional discount. The
fixed discount applies to consumers between 30 and 100 kWh and proportional discounting is
aimed at those with consumption below 30 kWh. The amount of discount is financed by a
surcharge on the price consumers pay regulated monthly consumption above 100 kWh.
The number of households that benefit from this scheme is more than 2.4 million (3.6 million
connected households in a national level). In July 2004, FOSE was extended to cover up to 50%
of the bill of the National Interconnected System (SEIN) and 62.5% of isolated systems for users
with consumption below 30 kWh, while included a special focus on the geographic location (rural-
urban).
62. Are private companies allowed to generate, bank, transmit, and/or distribute energy? If
yes, in both urban and rural contexts? Please elaborate on the structure of such if
possible.
This issue is already answered in question 57.
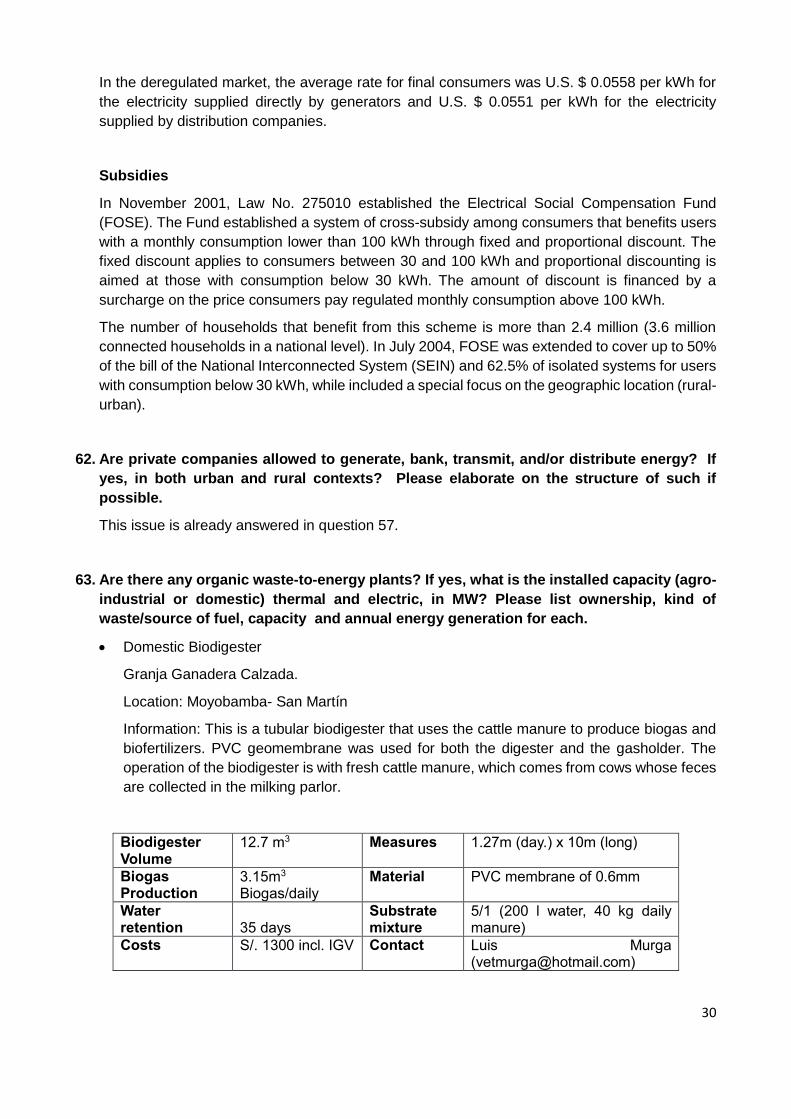
63. Are there any organic waste-to-energy plants? If yes, what is the installed capacity (agro-
industrial or domestic) thermal and electric, in MW? Please list ownership, kind of
waste/source of fuel, capacity and annual energy generation for each.
Domestic Biodigester
Granja Ganadera Calzada.
Location: Moyobamba- San Martín
Information: This is a tubular biodigester that uses the cattle manure to produce biogas and
biofertilizers. PVC geomembrane was used for both the digester and the gasholder. The
operation of the biodigester is with fresh cattle manure, which comes from cows whose feces
are collected in the milking parlor.
Biodigester Volume
12.7 m3 Measures 1.27m (day.) x 10m (long)
Biogas Production
3.15m3
Biogas/daily Material PVC membrane of 0.6mm
Water retention
35 days
Substrate mixture
5/1 (200 l water, 40 kg daily manure)
Costs S/. 1300 incl. IGV Contact Luis Murga ([email protected])

31
Use of biogas and biol: Biogas is utilized in the processing that the livestock center
produces daily, while the biol is used as fertilizer in the field.
Conclusions: The biodigester is a model to verify the success of this technology easily
applicable in medium and small farms. It is recommended to promote its use in rural villages
who mostly have pets, considering the technological benefits, low cost, easy installation and
maintenance.
Successful Case: Halfscale Biodigester
Fundo América
Location: Santa Rita -Arequipa
Information: Fundo America is dedicated to milk production and the cultivation of
vegetables, with 700 head of cattle. It has two biodigesters of 350m3 each and a gap of
receipt of biol of 350m3 installed since 2008. The liquids of the milking parlor are collected
and go to the box of separate solids before being stored in the dump tank. The mixture of
manure / water is distributed to both digesters and support the process using a circulating
pump for mixing the biodigester contents. The retention time in the biodigesters is 50 days.
Main achievements: The first goal was to properly treat the manure from the farm, and
further it was obtained a saving of 70% in energy consumption of the company, which was
Volume 700m3 Material Membrane of PVC of 0.6 mm
Biogas Production
350 m3 daily Type Taiwán type
Supplier Coplastgroup S.A, Water retention
30 days
Costs $ 80’000 incl. IGV
Use of biogas and biol: It produces approximately 350m3 of biogas per day, equivalent to
70 commercial gallons of liquefied petroleum gas (LPG). Biogas is used as fuel in a water
heater for washing dairy equipment. In the future it is planned to generate electricity (25kW).
On the other hand, the daily production of boil is approximately 14m3, which is used as
organic fertilizer injected into the pressurized irrigation system of the farm fields.
Conclusions: This type of biodigester is a half scale model that provides a proper handling
of liquid wastes from a farm and provides an additional income.
The use of biogas reduces expenditures for fuels and electricity, while the use of biol
increases productivity in the cultivation of vegetables. Besides, it contributes to environmental
protection by reducing greenhouse gases. However, the amount of the reduction is not
enough for participating in the Clean Development Mechanism (CDM).
Successful Case: Industrial Biodigester
Granja de Pollo La Calera

32
Location: Lima
Information: The principal activity of the Granja "La Calera" is the production of eggs with
about 4 million chickens and fruit production. La Calera has four biodigesters, one of 750m3
and a 1'500m3, operating for 10 years, and two of 3'000m3 capacity each constructed in
2010. This will greatly improve the management of manure and produce renewable energy.
The plant is highly technical and has a monitoring system, security and control tech.
Use of biogas and biol: Daily, in La Calera approximately 6600m3 of biogas is produced,
equivalent to 1'320 gallons of Liquefied Petroleum Gas (LPG). Biogas, which is not used for
internal heating of the biodigester, is mainly used to provide heat to the chicks. It is also used
to operate the kilns of the internal Paper Recycling Factory. The biol serves as organic
fertilizer injected into the pressurized irrigation system of the farm fields.
Conclusions: The biodigester is a model of an industrial level. It saves a lot of fuel and treat
manure in a properly way. The company reduced greenhouse gas emissions in an enough
amount to allow the producer to obtain financial support through the Clean Development
Mechanism (CDM). The high costs of this type of biodigester (typically German type) make
it difficult to install for small and medium producers.
Biodigester Volume
750 m3 (steel) 1’500m3 (concrete 2x 3’000 m3
(concrete)
Biogas production
6’600m3 Biogás/daily
Biodigester Aleman type Material Steel and concrete
Water retention
30 days Contact www.lacalera.com.pe
64. Please add information how the major organic waste-to-energy projects have been
financed?
Financing through CDM
The type of digester technology that prevents the emission of greenhouse gases (GHGs) can
take financial advantage of the Clean Development Mechanism (CDM). This technology is
widespread open liquid manure tanks that are large emitters of methane (CH4), which has the
effect greenhouse gas 21 times stronger than CO2.
These projects are funded under the CDM and assume that these deposits are covered to collect
the methane produced. Although usually the biogas collected in this way simply burned with a
torch. The use of biogas reduces even more than CO2 emissions (depending on what is
replacing).
Since Peru participates in the carbon market, the number of CDM projects has been increasing,
and currently has 190 CDM projects. Most of these projects are in the hydroelectric sector,
landfills or in the photovoltaic industry, but there are some that are based on the technology
biodigesters.

33
This mechanism consists of a process involving several steps and involves several institutions
to benefit from carbon market. All procedures of the idea of a project until the final certification is
called "Cycle of CDM". For more information on this mechanism, see:
Table : Fuel portfolio Perú 2011 [FONAM, 2011]
Number Description Reduction t CO2/a
Investment Mío $
B-14 Avoid methane emissions from agricultural waste and wastewater. Production of electricity for self-consumption.
93’000 15.8
B-16 La Calera: Biodigesters Project. Reducing emissions of methane from chicken manure.
30’000 1.7
B-20 Biodigester on a farm: The project involves the implementation of a biodigester to replace anaerobic lagoon manure management on pig farms.
3’700 NR
Financial benefit and value of certificates
The estimated financial benefits are relative and vary depending on transaction volume and on
the founder who finances the different the various stages of the business. Initial costs include
planning, investments and transactions during the CDM cycle. The value of the benefits of Low
Emission Certificate (CER) is influenced by the potential reduction (CER amounts) and the price
of CER's. The market price of carbon by the CER's are approximately U.S. $ 8.30 per CER
(1CER = 1tCO2-eq/year). By the supplier, the benefit is less than this value as the seller of the
CERs claimed their share.
How to identify a CDM project through biodigesters?
A CDM project of biodigesters must have certain criteria. The conditions are listed in the official
website of United Nations Framework Convention on Climate Change (UNFCCC)
[www.cdm.unfccc.int] and in the pages of the National Environment Fund (FONAM) and consist
of the following factors:
Calculation of reducing emissions from the project in relation to the baseline.
Funding for the project.
Environmental and Economic Impacts.
Find evidence that the project is additional.
Calculate emissions reductions:
The calculation of the reductions of emissions on a project related to the baseline is a
combination of reduced emissions from the lagoon and the change of fuel when biogas is used:
Potential reduction [tCO2/yr] =
Reduction through proper management of manure and (1)
Reduction with traditional fuel switching to biogas (2)

34
For a CDM project it is required a critical amount of 3'000-4'000 tCO2-eq/year.
For the calculations for CH4 emissions from management should be consulted emissions from
livestock management and manure in the "2006 IPCC Guidelines for national inventories of
greenhouse gases". The calculations for CH4 emissions have four variables, depending on the
available data. The easiest is an estimate only depends on the type of animal and the
temperature of the climate. In general, calculations should be done differently.
Animal Emission per year
<15°C 15°C-25°C >25°C
Cows kg CO2/ animal 21 21 21
Pigs kg CO2/ animal 21 21 21
Sheep kg CO2/ animal 2.1 3.15 4.2
Goat kg CO2/ animal 2.31 3.57 4.62
Poultry kg CO2/ animal 0.21 0.42 0.42
To calculate the reduction through a change in fuel emissions can be calculated with the following
table:
Table: Energy values and CO2 emissions for different fuels [FONAM, 2009]
Traditional energy Amount Biogas eq equivalent [m3]
CO2 Potential Reduction
Fuels Natural Gas (pure methane)
1’000 gallons 3’762 m3
4.46 tCO2
Gasoline 1’000 gallons 5’622 m3 8.70 tCO2
Diesel 1’000 gallons 6’173 m3 10.21 tCO2
Residual oil 1’000 gallons 6’407 m3 11.06 tCO2
GLP 1’000 gallons 4’333 m3 6.10 tCO2
Biogas 1 m3 - 0.0 tCO2
[tCO2/MWh ]
Electricity Electrical 1MWh 555 m3 0.54 tCO2
Biogas 1MWh - 0.0 tCO2

35
Electricity coverage (June 2011) 88.8% (total), 61,2% (rural), (total average in AL
y C in 2007: 92%)
Installed Capacity (2006) 6,7 GW
Percentage of fossil energy 52%
Percentage of renewable energy 48% (hydroelectric)
GHG emissions from electricity
generation (2003)
3,32 millions of Tm de CO2
Average consumption of electricity
(2006)
872 kWh per cápita
Distribution losses (2006) 6,3%
Transmission losses (2006) 4,7%
Residential consumption (% of total) 24%
Industrial consumption (% of total) 66%
Commercial consumption (% of total) 19%
Average residential rate (US$/kWh,
2006)
0,1046; (average in AL y C in 2005: 0,115)
Annual investment in electricity (US$ in
2006)
484,6 million (27% public, 73% private)
Unbundled Sector Yes
Percentage of private sector in
generation
69%
Competitive Supply for big users Yes
Competitive Supply for residential
users
No
Number of service suppliers 38 (generation), 6 (transmission), 22
(distribution)

36
National Electricity Regulator Yes (DGE, Electricity General Management)
Responsible for setting policies DGE, Electricity General Management
Responsible for renewable energy National Environment Fund (FONAM)
Responsible for environment National Environmental Council (MINAM)
Law of Electric Sector Yes (1992, modified in 1997)
Law of Renewable Energy No
Operations on the electricity sector
MDL
7 projects MDL registered; annual reduction of
emissions of CO2e of 800.020 Tm

37
Annex: Terminology
Biosolids are stabilized (treated) excreta or the treated byproducts of domestic and commercial sewage, wastewater and faecal sludge treatment, which can be beneficially utilized as soil amendment and fertilizer after drying.
Business Model (in this context): a model that contributes to cost recovery or profit from reuse, ideally supporting in this way the sanitation service
Co-composting: Is the simultaneous composting of excreta with other organic waste. Alternatively, both components can also be composted separately and mixed later.
Domestic effluent: blackwater (excreta, urine and faecal sludge, i.e. toilet wastewater) and greywater (kitchen and bathing wastewater)
Dried Sludge is found on drying beds where biosolids from WWTPs are exposed to sun.
Excreta: human faeces and urine (sometimes also called night soil)
Faecal Sludge: Sludge of variable consistencies collected from on-site sanitation systems, such as latrines, non-sewered public toilets, septic tanks and aqua privies which store blackwater. The faecal sludge comprises of varying concentrations of settleable solids as well as of other, non-faecal matter. Faecal sludge consists of human faeces and urine (and flushing water) and has a high concentration of organic matter and nutrients. The term usually refers to fresh (watery) sludge.
Organic waste - kitchen waste, plant material, human and animal excreta, agro-industrial, wood and food pressing waste
Peri-urban agriculture (PUA): agriculture within approx. 30 Km around the build-up city area.
Reclaimed water or recycled water is treated wastewater that can officially be used under controlled conditions for beneficial purposes (potable, non-potable)
Sanitation Safety Plan: A manual to operationalize e.g. safe wastewater reuse like the Water Safety Plans operationalize the WHO Drinking Water Guidelines.
Septage: A term used for the combination of sludge, scum and liquid pumped from a septic tank where household black water ends (on-site sanitation) if not flushed away in a sewer; Septage is largely similar to faecal sludge.
Sewage sludge: Sludge produced in wastewater treatment plants as a result of the treatment process. It includes faeces, other waste products and the excess bacteria used in activated sludge treatment processes. The quantity of sludge produced depends on the treatment technique.
Sewage: The spent and used water from a community that contains dissolved or suspended matter, including faeces and urine, and usually moves in pipes or sewers.
Sewerage: a domestic drainage system involving sewers or pipes
Treated wastewater: is wastewater that has been processed through a wastewater treatment plant up to certain standards in order to reduce its pollution or health hazard. If this is not fulfilled the wastewater is considered to be partially treated. What is called treated ww in low-income countries might still classify as untreated ww in high-income countries.

38
Urban agriculture (UA): agriculture incl. aquaculture and livestock keeping within the build-up area, usually on open-spaces (backyards are not target of the study);
Wastewater: All types of domestic, commercial and/or industrial effluent as well as storm water runoff, usually mixed and of different qualities, ranging from raw to diluted. The term does not imply any form of transport or treatment. It should be differentiated between raw wastewater and wastewater which entered natural water bodies (diluted wastewater, polluted stream water)