Baseline (Actual RATE OF Performance ACTUAL ACCOMPLISHMENT … · 2017-06-10 · ACTUAL...
13
1 Rationalizing the number, distribution and growth of SUCs and LUCs Mapping of programs Identification of oversubscribed and undersubscribed programs. Number of oversubscribed and undersubscribed programs identified. 0/15 programs 1,530,210.00 None of the 15 program offerings is considered oversubscribed/ undersubscribed but are instead deemed as within the mandate and priority programs of the Region 100% Promotion of degree programs in line with the college mandate. Conduct of school to school campaigns encouraging potential students to enrol in mandated degree programs. Percentage increase in the number of students enrolled in mandated & priority programs. 3,231 students enrolled in mandated & priority programs during 1 st sem AY 2013-2014 2,550,350.00 18.69% (3,835 1st sem 2014- 2015 against 3,231 during 1st sem, 2013-2014) increase in the number of students enrolled in mandated and priority programs for 1st semester AY 2014-2015 186.90% piloting of governance and restructuring models like amalgamation Participation in regional efforts to adopt amalgamation initiatives Coordination with the DC-SUC III/CIRPS in partaking in meetings discussing the implementation of amalgamation Percentage of attendance to meetings, workshops, etc. on the implementation of amalgamation. 100% (5/5 invitations) attendnace to the invitations towards implementation of amalgamation AY 2013-2014 1,530,210.00 100% (4/4 meetings of DC-SUC III/CIRPS had been conducted wherein amalgamation was one of the agenda. All four meetings called for were attended/ participated in by the college) 100% 2 Rationalization of SUC/LUC program offerings typology Alignment of degree programs to the college mandate Strengthening programs to address demand of the clients (industry needs). MFO1- Higher Education Services Number of existing programs reviewed to align with the demand/industry needs 2/15 programs reviewed for FY 2013 2,040,280.00 5 out of 15 (33.33% programs: BAS, BSA, BSAM, BSHM & BSBA were reviewed to align with the demand of times/industry needs) 133.32% SUC levelling Evaluation of college overall status Preparation and application for SUC levelling. MFO1, MFO2, MFO3, STO & GASS Status is higher than present SUC level Level 1 since 2003 6,844,000.00 The third round of simulation on SUC Leveling instrument was conducted on July 24, 2014. Result revealed that of the four Key Result Areas the minimum point on Quality and Relevance of Instruction was not met (KRA1- min. 5 points, BASC 3.75; KRA2- min. 2, BASC 4.125; KRA3-min. 5, BASC 8.5; and KRA4-min. 3, BASC 3.125) 100% participation on the simulation of Levelling instrument for the possible conduct of SUC Levelling for FY 2015 MFO1- Higher Education Services ACTUAL ACCOMPLISHMENT as of NOVEMBER 30, 2014 mapping 10% (323) increase in the number of students enrolled in mandated and priority programs for 1st semester AY 2014-2015 Thrusts/ Programs Strategies MFOs Baseline (Actual Accomplishment 2013) Budget Performance Indicators OBJECTIVE A. IMPROVE EFFICIENCY: RATIONALIZE THE PUBLIC HIGHER EDUCATION SYSTEM PHER Agenda Roadmap Goals Elevated to SUC Level II 4 (25%) programs are reviewed to align with the demand/industry needs 2014 Targets 0/15 programs 100% cooperation/ participation among member SUCs in Region 3 towards implementation of amalgamation RATE OF ACCOMPLISHMENT/ REMARKS 10
Transcript of Baseline (Actual RATE OF Performance ACTUAL ACCOMPLISHMENT … · 2017-06-10 · ACTUAL...

1Rationalizing the number,
distribution and growth of SUCs
and LUCsMapping of
programs
Identification of
oversubscribed and
undersubscribed
programs.
Number of
oversubscribed and
undersubscribed
programs identified.
0/15 programs 1,530,210.00 None of the 15 program offerings
is considered oversubscribed/
undersubscribed but are instead
deemed as within the mandate
and priority programs of the
Region
100%
Promotion of degree
programs in line
with the college
mandate.
Conduct of school to
school campaigns
encouraging potential
students to enrol in
mandated degree
programs.
Percentage increase
in the number of
students enrolled in
mandated & priority
programs.
3,231 students
enrolled in
mandated & priority
programs during 1st
sem AY 2013-2014
2,550,350.00 18.69% (3,835 1st sem 2014-
2015 against 3,231 during 1st
sem, 2013-2014) increase in the
number of students enrolled in
mandated and priority programs
for 1st semester AY 2014-2015
186.90%
piloting of governance and
restructuring models like
amalgamation
Participation in
regional efforts to
adopt amalgamation
initiatives
Coordination with the
DC-SUC III/CIRPS in
partaking in meetings
discussing the
implementation of
amalgamation
Percentage of
attendance to
meetings,
workshops, etc. on
the implementation
of amalgamation.
100% (5/5
invitations)
attendnace to the
invitations towards
implementation of
amalgamation AY
2013-2014
1,530,210.00 100% (4/4 meetings of DC-SUC
III/CIRPS had been conducted
wherein amalgamation was one
of the agenda. All four meetings
called for were attended/
participated in by the college)
100%
2Rationalization of SUC/LUC
program offeringstypology Alignment of degree
programs to the
college mandate
Strengthening
programs to address
demand of the clients
(industry needs).
MFO1- Higher
Education Services
Number of existing
programs reviewed
to align with the
demand/industry
needs
2/15 programs
reviewed for FY
2013
2,040,280.00 5 out of 15 (33.33% programs:
BAS, BSA, BSAM, BSHM & BSBA
were reviewed to align with the
demand of times/industry
needs)
133.32%
SUC levelling Evaluation of college
overall status
Preparation and
application for SUC
levelling.
MFO1, MFO2, MFO3,
STO & GASS
Status is higher than
present SUC level
Level 1 since 2003 6,844,000.00 The third round of simulation on
SUC Leveling instrument was
conducted on July 24, 2014.
Result revealed that of the four
Key Result Areas the minimum
point on Quality and Relevance
of Instruction was not met (KRA1-
min. 5 points, BASC 3.75; KRA2-
min. 2, BASC 4.125; KRA3-min. 5,
BASC 8.5; and KRA4-min. 3, BASC
3.125)
100% participation on
the simulation of
Levelling instrument
for the possible
conduct of SUC
Levelling for FY 2015
MFO1- Higher
Education Services
ACTUAL ACCOMPLISHMENT
as of NOVEMBER 30, 2014
mapping 10% (323) increase in
the number of students
enrolled in mandated and
priority programs for 1st
semester AY 2014-2015
Thrusts/ Programs Strategies MFOs
Baseline (Actual
Accomplishment
2013)
BudgetPerformance
Indicators
OBJECTIVE A. IMPROVE EFFICIENCY: RATIONALIZE THE PUBLIC HIGHER EDUCATION SYSTEM
PHER Agenda Roadmap Goals
Elevated to SUC Level II
4 (25%) programs are
reviewed to align with
the demand/industry
needs
2014 Targets
0/15 programs
100% cooperation/
participation among
member SUCs in Region 3
towards implementation
of amalgamation
RATE OF
ACCOMPLISHMENT/
REMARKS
10

ACTUAL ACCOMPLISHMENT
as of NOVEMBER 30, 2014Thrusts/ Programs Strategies MFOs
Baseline (Actual
Accomplishment
2013)
BudgetPerformance
IndicatorsPHER Agenda Roadmap Goals 2014 Targets
RATE OF
ACCOMPLISHMENT/
REMARKS
review, phase out/closure of
inefficient, duplicative
programs
Gradual closure of
inefficient degree
programs
Identification of
oversubscribed
programs particularly
those with low demand
and employability rate
MFO1- Higher
Education Services
Number of
oversubscribed
programs are
identified
No program
identifed as
oversubscribed
2,040,280.00 0/15 (100%) existing programs
was identified as oversubscribed.
All program offerings
complemented CMO No. 01 s.
2014 on CHED Priority Programs
for AY 2014-2015 to AY 2017-
2018
100%
3
Rationalizing resource
utilization and maximizing
resource generation by SUCs
normative financing
Compliance with
NFF requirements
Increasing of agency’s
performance to
improve baseline data
e.g. MFO1-3, STO, GASS
GASS Percentage increase
of the operational
budget in 2015.
GAA Budegt for 2014
amounting to
P77,322,000
(including RLIP)
549,920.00 10% (85,057,000 for FY 2015 as
against 77,322,000 for FY 2014)
on total operational budget for
2015 (as per NEP: PS
51,037,000; MOOE 22,032,000;
CO 11,988,000)
100%
Identification of
financially
disadvantaged
students.
Implementation of
policies allowing
financially
disadvantaged
students to pay their
tuition on a staggered
basis throughout each
semester.
Inventory of assets
such as land
properties for
additional income
generation
Entrance into lease
agreement with
private agencies for
income generation
under contracts duly
approved by the
Board.
Number of lease
contract/agreement
made
One lease contract
was entered into by
the college with
OILWELL 8, InC. in
2013549,920.00
One lease contract was entered
into on the rental of the Tunnel
Ventilated Piggery House on June
2014. This is in addition to the
existing contract of the operating
Flying-V gas station.
100%
Expansion of the
existing income-
generating projects.
Additional business to
increase existing
income-generating
projects.
GASS Percentage share of
income on IGPs to
the college total
operational budget.
2-3% increase for FY
2013
549,920.00 2.44% share of income on IGP
(2,915,851.7 income on IGP/
119,403,759.84 college total
operational budget). Aminimal
contribution due to limited
resources of the College
48.80%
Percentage of
students enjoying
merit scholarship
program
assets inventory and
management for resource
generation
socialized tuition fee schemes
Enhancement of
financial assistance
programs for
students from low
income families
MFO1- Higher
Education Services
3.03% (99/3,264 baccalaureate
students enjoy merit/academic
scholarship program for 1st sem,
AY 2014-2015) Breakdown are
as follows: 38 BSEd; 28 BEEd; 9
BAS; 7 BSBA; 6 BSAM; 3 BSABEn;
3 BSGE; 2 BSA; 1 BSFT; 1 BSIT; &
1 BSHM.
1.49% (45/3024)
students received
merit scholarship for
AY 2013-2014
3,060,420.00
0/15 programs are
identified as
oversubscribed
2% of the students
received merit
scholarship
10% increase of total
operational budget for
GAA 2015.
One lease contract
adopted to implement
resource generation
5% share increase from
the income on IGPs to
total operating budget
151.50%
10

ACTUAL ACCOMPLISHMENT
as of NOVEMBER 30, 2014Thrusts/ Programs Strategies MFOs
Baseline (Actual
Accomplishment
2013)
BudgetPerformance
IndicatorsPHER Agenda Roadmap Goals 2014 Targets
RATE OF
ACCOMPLISHMENT/
REMARKS
improving public financial
management of SUCs and
synchronizing this with GIFMIS
implementation of
policies on efficient
procurement
complying with RA
9184
conduct of
management audit and
internal control system
alignment of annual
budget preparations
on priorities
approved by the
Board
conduct of budget
preparation
discussions during
planning sessions
4Strengthening quality
assurance in SUCs and LUCs
phase out/closure of
substandard programs
Identification of
substandard degree
programs
Development of plans
for gradual phasing out
of identified
substandard degree
programs
MFO1- Higher
Education Services
Number of identified
substandard degree
programs for
possible gradual
phase out and
subject for Board
approval
No program has
been phased out or
identified as sub-
standard
2,040,280.00 0/15 programs offered by the
college is identified as
substandard having complied
with CHED minimum standard of
curricular offerings
100%
accreditation
Upgrading of
programs to
accredited levels
Application to AACCUP
Creation of
accreditation task
forces Preparation of
documents required
Compliance to AACCUP
recommendations
MFO1- Higher
Education Services,
GASS, STO
Percentage of
programs
accredited/visited
Graduate Programs
Candidate status,
33.33% (1 of 3)
Baccalaureate
Programs Level 2,
41.67% (5 of 12)
Level 1, 16.67% (2
of 12) Candidate
status, 16.67% (2 of
12)
5,100,700.00 33.33% (1/3 graduate programs
was given candidate status)
41.76% (5/12 baccalaureate
programs were Level 2 re-
accredited; 16.67% (2/12 were
Level 1 accredited; and 16.67%
2/12 are given candidate status)
100% (33.33% (1/3
graduate programs
candidate; 100%
(41.76% (5/12
baccalaureate
programs Level 2)
50% (33.33% (2/12
Level 1); and
100% (16.67% or
2/12 candidate status)
others
Increase number of
graduates
Close monitoring and
advising of student
performance and
classroom activities. MFO1- Higher
Education Services
Percentage of total
graduates that are in
priority courses
71% (240/339) of
the graduates for AY
2012-2013 were in
mandated & priority
programs
2,852,410.00 85.31% (331 graduates were in
priority courses/388 actual
graduates) Breakdown per
program is as follows: Ph.D. 6;
MAEd 22; BAS 43; BSA 24; BEEd
74; BSEd 51; BSAM 10; BSBA 78;
BSAEn 2; BSFT 2; BSIT 16; BSAf 2
& ACT 1
112.25%
OBJECTIVE B. UPGRADE QUALITY OF PUBLIC HIGHER EDUCATION
100% (all prescribed reports
required by COA, CHED, DBM
and other agencies were
prepared and submitted on time
1,099,840.00
33.33% (1/3 graduate
programs is given
candidate status)
41.76% (5/12
baccalaureate programs
are Level 2 re-accredited;
33.33% (4/12 are Level 1
accredited; and 16.67%
2/12 are given candidate
status)
0/15 existing program
offerings identified as
substandard
76% (300/394) of total
graduates are in priority
courses
1.00100% of all
precribed reports
required by
concerned agencies
submitted as
scheduled
Percentage of
submission of
financial statements
and reports /
documents by COA,
CHED, DBM and
other agencies are
submitted
accurately and
completely (on or
before due date)
100% reports submitted'
10

ACTUAL ACCOMPLISHMENT
as of NOVEMBER 30, 2014Thrusts/ Programs Strategies MFOs
Baseline (Actual
Accomplishment
2013)
BudgetPerformance
IndicatorsPHER Agenda Roadmap Goals 2014 Targets
RATE OF
ACCOMPLISHMENT/
REMARKS
Total number of
graduates on all
programs.
345 (345/349
graduated as of
March, May and
October 2013)
1,530,210.00 388 (98.48%) graduates out of
394 target with the following
breakdown per program: Ph.D. 6;
MAEd 22; BAS 43; BSA 24; BEEd
74; BSEd 51; BSAM 10; BSBA 78;
BSHM 57; BSAEn 2; BSFT 2; BSIT
16; BSAf 2 & ACT 1
98.48%
Percentage of
graduates who
finished within
timeframe
63% (345/547) of
the graduates
finished within the
timeframe in 2013
1,530,210.00 63.40% (246 of 388 graduated
within the prescribed timeframe.
Breakdown per program is as
follows: Ph.D. 5; MAEd 16; BAS
20; BSA 14; BEEd 50; BSEd 37;
BSAM 5; BSBA 55; BSHM 42;
BSFT 2
100.06%
Passing percentage
is equal to or higher
than the national
passing percentage
of five programs
with licensure
examination
107% (BASC 37.62
/ National 34.92)
across all disciplines
1,530,210.00 ####################### 182.51%
Inter-country
mobility programs
for students
Linkaging with foreign
agencies for
partnership on
exchange students or
conduct of internships.
Percentage of
increase in the
number of students
sent for OJT to other
countries.
45 OJT students
were sent to
undergo on-the-job-
training for AY 2013-
2014
1,020,140.00 91.49% (43/47) students were
sent for On-the-Job-Training to
Israel through Agro-Studies, Inc.
for AY 2014-2015. Breakdown
per program is as follows: BAS
28; BSA 8; BSAM 4; BSAf 3
91.49%
394 graduates for FY
2014
63% (248/394) of
graduates finished their
academic program
according to the
prescribed timeframe
5% (47/45) increase of
the students sent to
undergo on-the-job-
training to other
countries for AY 2014-
2015
107% (BASC 37.62/34.92
National) passing of
licensure exams by the
BASC graduates/national
average passing across all
disciplines covered by
BASC
10

ACTUAL ACCOMPLISHMENT
as of NOVEMBER 30, 2014Thrusts/ Programs Strategies MFOs
Baseline (Actual
Accomplishment
2013)
BudgetPerformance
IndicatorsPHER Agenda Roadmap Goals 2014 Targets
RATE OF
ACCOMPLISHMENT/
REMARKS
Weighted Enrolled
Units (WEU)
Improvement of
number of WEU
Percentage of
increase on total
enrolment
3,589 enrolees, 1st
sem AY 203-2014
2,550,350.00 14.88% (4123/3589) for 1st
semester, AY 2014-2015
enrolment increase to total
enrolment. The following are
breakdown per program for the
total enrolment as of 1st
semester, AY 2014-2015: Ph.D.
46; MAEd 232; MSA 22; BSE 333;
BEEd 444; BSBA 427; BSA 544;
BSAM 333; BAS 734; BSIT 188;
BSABEn 107; BSGE 43; BSFT 34;
BSHM 236; BSAf 69; ACT 43; &
LHS 288.
212.55%
Improvement of
employability/job
competency of
graduates
Determination/
tracing of
employability of
graduates.
Percentage of
employability of
graduates within
one year after
graduation
none has been
undertaken for the
entire graduate
2,550,350.00 Baseline data gathering is
currently undertaken to establish
a more concrete information on
the employability graduates
50% (on-going)
Webpage
development and
enhancement
Enhancement of web
page of the college
Number of times the
website is visited
No record to show
since only this 2014
that the website has
been fixed and
updated
1,020,140.00 68,796 (229.32%) times the
website (www.basc.edu.ph) was
visited/accessed for various
information and services the
college offers
229.32%
5Upgrading qualification of
faculty
Faculty Development Program
Revisit of the
Faculty
Development
Program
Encourage faculty to
pursue graduate
degree programs by
giving scholarship,
thesis/dissertation
assistance, etc.
MFO1- Higher
Education Services
Percentage of faculty
members pursuing
doctorate and
master’s degree.
26 of the faculty
members (including
contractual) pursued
their doctorate and
master’s degree of
which 20% of them
are enrolled in
programs with
atleast level 3
accreditation or
center of excellence
4,080,560.00 15.63% (20/128 faculty
members including contractual
enrolled to pursue their graduate
programs (Doctorate 6 and
Masters 14); 28% (7/25) are
enrolled in programs with at
least Level 3 accreditation.
156.3% ; 269.25%
30,000 times the website
is visited or browsed
based from the visitor's
counter of the page
7% (251 of 3,589)
increase in total
enrolment, 1st semester
AY 2014-2015
10% (13/128 including
contractual) of the faculty
members pursue their
doctorate and masters
degree of which 20%
(2/13) of them are
enrolled in programs
with atleast level 3
accreditation or center of
excellence
25% (76/301
baccalaureate graduates,
FY 2013 are employed
within one year after
graduation
10

ACTUAL ACCOMPLISHMENT
as of NOVEMBER 30, 2014Thrusts/ Programs Strategies MFOs
Baseline (Actual
Accomplishment
2013)
BudgetPerformance
IndicatorsPHER Agenda Roadmap Goals 2014 Targets
RATE OF
ACCOMPLISHMENT/
REMARKS
Attendance of
faculty to seminars
workshops,
trainings, for a, etc.
Further participation
to seminars,
workshops, trainings,
etc.
Percentage of faculty
and personnel
enabled to attend
training, seminars,
conferences, fora,
workshops, etc.
93.3% (56/60
faculty and
personnel pursued
studies/training
based on number of
needed training as
prescribed on the
policies and
guidelines)
4,080,560.00 ####################### 105.26%
In-service capability
enhancement
activities for faculty.
Conduct of in-service
seminars, workshops,
trainings, etc.
MFO1- Higher
Education Services
Number of in-
service trainings,
seminars,
workshops, etc.
conducted
1 in-serivce training
was conducted by
one institute for the
1st semester, AY
2013-2014
1,530,210.00 5 in-service trainings, seminars
were conducted
100%
6Upgrading leading SUCs to
international standards
establishment R&D centers with
state-of-the-art facilities
Grants-in-Aid for Research,
Development and Extension
Project proposal
development and
packaging
Capacity enhancement
program for faculty
MFO1- Higher
Education ServicesResearch:
Implementation of
effective and
relevant research
programs.
Project proposal
development
MFO2- Research
Services
Number of research
proposals developed
and packaged for
funding
5 proposals
developed and
packaged
295,300.00 7 of 5 (140%) proposals were
developed, packaged and
submitted to different funding
agencies
140%
Resource
generation.
Other related technical
trainings outside
MFO3- Extension
Services Number of research
studies completed in
the last three years.
19 researches
completed for the
last three years
295,300.00 25 researches were completed
for the last three years
108.70%
95% (57/60) of faculty
and employees attended
trainings, seminars,
conferences, for a,
workshops, etc.
5 proposals developed
and packaged
23 researches completed
for the last three years
5 in-service
trainings/seminars
conducted by the college
or by institute
10

ACTUAL ACCOMPLISHMENT
as of NOVEMBER 30, 2014Thrusts/ Programs Strategies MFOs
Baseline (Actual
Accomplishment
2013)
BudgetPerformance
IndicatorsPHER Agenda Roadmap Goals 2014 Targets
RATE OF
ACCOMPLISHMENT/
REMARKS
Contribution in the
Rice Self-sufficiency
program of the
national government
Percentage of
research projects
completed in the last
3 years presented in
local, regional,
national or
international fora
37% (7/19 of
research projects
completed in the last
3 years presented in
local, regional,
national or
international fora)
295,300.00 60.87% (14 researches
presented out of the 23
researches completed in the last
3 years in local, regional, national
or international for a
156.08%
Production of quality
vegetables and fruits
Percentage of
research projects
completed within
the original project
timeframe
100% of the
researches are
completed within
timeframe
442,950.00 ####################### 100%
39% (9/23) of the
researches completed in
the last three years are
presented in local,
regional, national or
international fora
100% (4/4) of the
research projects
completed within the
original timeframe
10

ACTUAL ACCOMPLISHMENT
as of NOVEMBER 30, 2014Thrusts/ Programs Strategies MFOs
Baseline (Actual
Accomplishment
2013)
BudgetPerformance
IndicatorsPHER Agenda Roadmap Goals 2014 Targets
RATE OF
ACCOMPLISHMENT/
REMARKS
Intensification of
research on animal and
aquaculture
production
Number of linkages
established and
maintained
11 established and
maintained linakges
as of FY 2013
442,950.00 16 linkages were maintained and
established such as DA-Bureau of
Agricultural Research, PhilRice,
PCAARRD, CHED Central Office,
CHED-Zonal Research Center, DA-
RFO3, DENR, DA-Agricultural
Training Institute, DA-RFO3,
Municipalities in Bulacan, Other
State Universities & Colleges, etc.
100%
Watershed
management
Percentage
increase in the
number of faculty
members
Involved in
research and
development
project/ activities.
12.5% (15/120
faculty(including
contractual) were
involved in research
and extension
activities of the
colege
442,950.00 13% (17/128 faculty including
contractual) increase in the
number of faculty involved in
research/extension activities of
the college
100%
Social researches as
benchmark of
improving services
delivery
Number of research
study published on
a CHED recognized
and/or SCOPUS or IS
indexes
None has been
published yet in a
CHED recognized
journal
442,950.00 One (1) research study accepted
for publication on its July-
December issue of ANNALS OF
TROPICAL RESEARCH)
waiting for the issue to
be released
Productivity
enhancement
Amount generated
to conduct research
activities through
external fund
generation
initiatives.
P3,207,174.00 was
generated for FY
2013
295,300.00 P4,913,035 (98.26%) total of
funds generated to conduct
research activities through
external fund generation
initiatives from PCCARD, DAR,
DENR, DA-BAR, DARFO3,
PhilRice, etc.
98.26%
Number of copyright
or trademark
applied for and
approved
none for FY2013 109,100.00 One (1) copyright approved 50%
16 established and
maintained linkages
13% (17/128 faculty
including contractual)
increase in the number of
faculty involved in
research/extension
activities
One (1) research study
published on CHED
recognized and/or
SCOPUS or IS indexes
P5M amount of funds
generated to conduct
research activities
One for each copyright or
trademark applied for
and approved
10
ACTUAL ACCOMPLISHMENT
as of NOVEMBER 30, 2014Thrusts/ Programs Strategies MFOs
Baseline (Actual
Accomplishment
2013)
BudgetPerformance
IndicatorsPHER Agenda Roadmap Goals 2014 Targets
RATE OF
ACCOMPLISHMENT/
REMARKS
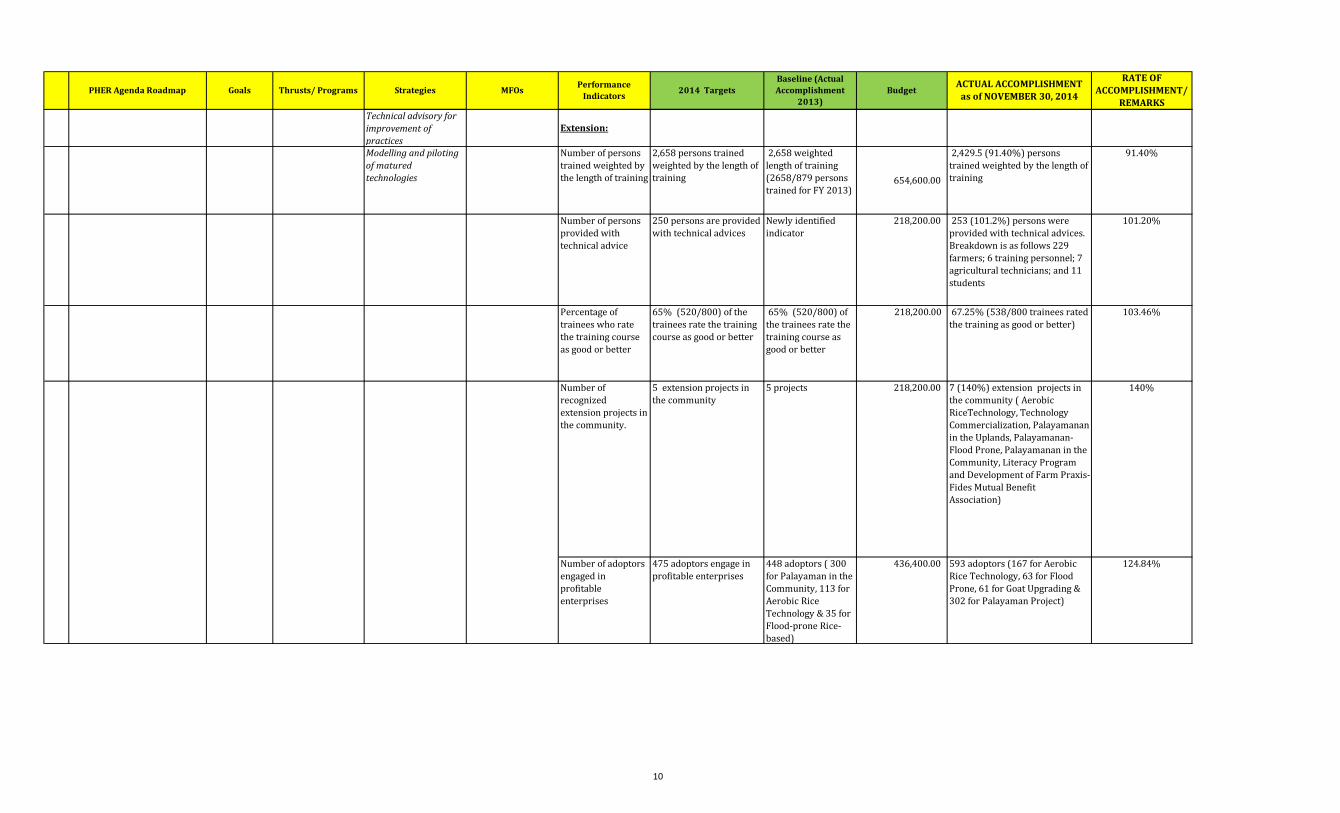
Technical advisory for
improvement of
practices
Extension:
Modelling and piloting
of matured
technologies
Number of persons
trained weighted by
the length of training
2,658 weighted
length of training
(2658/879 persons
trained for FY 2013) 654,600.00
2,429.5 (91.40%) persons
trained weighted by the length of
training
91.40%
Number of persons
provided with
technical advice
Newly identified
indicator
218,200.00 253 (101.2%) persons were
provided with technical advices.
Breakdown is as follows 229
farmers; 6 training personnel; 7
agricultural technicians; and 11
students
101.20%
Percentage of
trainees who rate
the training course
as good or better
65% (520/800) of
the trainees rate the
training course as
good or better
218,200.00 67.25% (538/800 trainees rated
the training as good or better)
103.46%
Number of
recognized
extension projects in
the community.
5 projects 218,200.00 7 (140%) extension projects in
the community ( Aerobic
RiceTechnology, Technology
Commercialization, Palayamanan
in the Uplands, Palayamanan-
Flood Prone, Palayamanan in the
Community, Literacy Program
and Development of Farm Praxis-
Fides Mutual Benefit
Association)
140%
Number of adoptors
engaged in
profitable
enterprises
448 adoptors ( 300
for Palayaman in the
Community, 113 for
Aerobic Rice
Technology & 35 for
Flood-prone Rice-
based)
436,400.00 593 adoptors (167 for Aerobic
Rice Technology, 63 for Flood
Prone, 61 for Goat Upgrading &
302 for Palayaman Project)
124.84%475 adoptors engage in
profitable enterprises
65% (520/800) of the
trainees rate the training
course as good or better
5 extension projects in
the community
250 persons are provided
with technical advices
2,658 persons trained
weighted by the length of
training
10

ACTUAL ACCOMPLISHMENT
as of NOVEMBER 30, 2014Thrusts/ Programs Strategies MFOs
Baseline (Actual
Accomplishment
2013)
BudgetPerformance
IndicatorsPHER Agenda Roadmap Goals 2014 Targets
RATE OF
ACCOMPLISHMENT/
REMARKS
Number of viable
demonstration
projects based on
positive cost and
return analysis.
3 demo-projects
were established for
Upland
Palayamanan,
Aerobic Rice
Technology & Flood-
prone Rice-based)
218,200.00 18 out of 5 (360%) demo
projects were established with
positive cost and return analysis
(1 for ART, 6 Palayaman in the
Uplands, 1 for Palayamanan-
Flood Prone and 10 for
Palayamanan in the Community)
360%
Percentage of
requests for training
/technical advice
responded to within
3 days of request.
165 requests were
responded
109,100.00 100% (253 of 253) requests
responded within 3 days of
request
100%
Centers of Excellence /
Development Program
7Modernizing Facilities of
Developing SUCs
Infrastructure development
and maintenance
Facilities
construction,
improvement and
maintenance.
Allotment of funds for
construction,
improvement and
maintenance of
facilities from internal
and external funds.
Percentage of
internally/
externally generated
income to total
operating
budget/cost
55% (36,638,000/
66.418,000 GAA FY
2013)
1,374,800.00
30.71%
(P31,097,191.84/P101,641,000.0
0) of internally/externally
generated income to total
operating budget/cost. (Tuition
fee P11,349,780.24; Income
collected from students
P6,791,661.60; Externally
Sourced Grants for Research
P7,760,735; Externally Sourced
Grants for Extension P1,300,000)
as of September 2014
63.98%
GASS
Amount of external
and internal funds
utilized for the
construction,
improvement and
maintenance of
facilities.
P4,841,679.00 was
utilized for the
construction,
improvement and
maintenance of
college facilities
1,374,800.00 P32,247,628.03 (644.95% out of
P5M target) was utilized for the
construction, improvement and
maintenance of 29 college
facilities out of the internal and
external funds generated.
645%
5 demonstration projects
are established with
positive cost and return
analysis
48%
(34,867,680/72,641,000
GAA FY 2014 of the total
operating budget/ cost
P5M out of total external
and internal generated
funds
100% (250 of 250)
requests responded
within 3 days of request
OBJECTIVE C. ENHANCE ACCESS TO QUALITY HIGHER EDUCATION
10

ACTUAL ACCOMPLISHMENT
as of NOVEMBER 30, 2014Thrusts/ Programs Strategies MFOs
Baseline (Actual
Accomplishment
2013)
BudgetPerformance
IndicatorsPHER Agenda Roadmap Goals 2014 Targets
RATE OF
ACCOMPLISHMENT/
REMARKS
Number of facilities
constructed or
improved
4 facilities were
constructed for FY
2013
1,374,800.00 29 facilities of the college were
constructed/improved/repaired
/renovated amounting to
P32,247,628.03 out of the
internal and external funds
generated. Major facilities were
the Renovation/ improvement of
BASC Gymnasium and
installation of other fixtures
amounting to P7,077,418.83;
Construction of Science
Laboratory Center worth
P5,342,481.59; Construction of
the Institute of Management
Building amounting to
P4,767,755.16; Construction of
Gov. Willy Sy-Alvarado 2-storey-
4 classroom Building amounting
to P4,600,000.00; Asphalting of
Track and Field Oval (245 m)
worth P3,000,000.00 among
others.
1450%
STO
Percentage of
college facilities are
maintained and in
good condition (A1
condition)
90% of the facilities
maintained and in
good condition
687,750.00 92% of the college facilities (e.g.
service vehicles, comfort rooms,
gymnasium, athletic ground,
conference halls, etc) are
maintained for the use of the
faculty, staff and students.
102.22%
Percentage of
students and
personnel who
availed of the college
services
81% (2319/2863) of
the students and
personnel availed of
the college services
687,750.00 85% (3,298/3,880) of the
students and personnel availed
services provided in the library
and college clinic such as
provision of first-aid /treatment,
medicine, medical check-up,
taking of blood pressure, etc.
103.66%82% (2,460/3000) of the
students and personnel
90% usable and in good
condition
2 facilities constructed/
improved/constructed/re
paired/renovated
10

ACTUAL ACCOMPLISHMENT
as of NOVEMBER 30, 2014Thrusts/ Programs Strategies MFOs
Baseline (Actual
Accomplishment
2013)
BudgetPerformance
IndicatorsPHER Agenda Roadmap Goals 2014 Targets
RATE OF
ACCOMPLISHMENT/
REMARKS
8
student financial assistance
poor but deserving
students given
priority to
scholarship grants.
Coordination with
DSWD regarding the
list of 4Ps beneficiaries
MFO1-Hihger
Education Services
Percentage of
utilization of
scholarship fund for
112 poor but
deserving students
(P6,908,000).
none yet 6,908,000.00 60.51% (P4,179,750.25 is
utilized for 112 scholars under
Expanded Students Grants-in-Aid
Program for Poverty Alleviation
(ESG-APPA) as of Nov. 15, 2014.
This will still be fully utilized
since school year ends by March
2015. Likewise
programs/activities for the
grantees are also lined up)
60.51%
STO
Percentage of poor
but deserving
students provided/
assisted financially
through scholarship
or other assistance
to finish schooling
45% (1,457/3,231)
poor but deserving
students were
provided/assisted
financially through
scholarship/other
assistance for AY
2013-2014
1,306,420.00 39.77% (1,543/3,880 of the
students were provided financial
assistance through scholarship
and other assistance to finish
schooling). A total of 302 BASC
grantees; Government sponsored
1,013 and private sponsored 167
were provided financial
assistance for their schooling.
159.07%
9
Strengthening public HEI
management thru executive
development program
Cross-cutting
Participation to the
Executive
Development
Program of CHED
Participation to the
Executive
Development Program
GASS Additional number
of Top Level and
Middle Managers
attended
professional training
to compliment
delivery of services
5 key officials were
sent to attend the
training
30,000.00 3 key officials were sent to
attend the CHED-DAP EDPS (Dr.
Melchor I. Pastrana, Dean-
Institute ofAgriculture; Dir.
Minerva D. Arcilla, Director for
Administrative and Support
Services and Dir. Rhuelyn A.
Ballaran, Director for extension
& Training)
150%
TOTAL 72,641,000.00
Strengthened Student Financial Assistance
Programs (STUFAPs)
2 senior officials
participated EDPs
spearheaded by CHED-
DAP
100% (P6,908,000)
scholarship fund is
utilized
25% (750/3000) of the
students in priority
programs awarded
financial aid
10

ACTUAL ACCOMPLISHMENT
as of NOVEMBER 30, 2014Thrusts/ Programs Strategies MFOs
Baseline (Actual
Accomplishment
2013)
BudgetPerformance
IndicatorsPHER Agenda Roadmap Goals 2014 Targets
RATE OF
ACCOMPLISHMENT/
REMARKS
*RLIP (P4,681,000) not included AMOUNT
51,007,000
2,953,000
2,182,000
2,751,000
13,748,000
72,641,000
Prepared by: NOTED:
ANNIE ROSE P. PAGDANGANAN HERMINIO B. GIRON, Ph.D.
Director, Planning & Development Vice President, AFBA
GENERAL ADMINISTRATION & SUPPORT
SUPPORT TO STUDENTS
MFO3: TECHNICAL ADVISORY EXTENSION SERVICES
MFO2: RESEARCH SERVICES
MFO1: HIGHER EDUCATION SERVICES
BREAKDOWN OF GAA 2014 BUDGET
TOTAL
10